transmission bandwidth properties of geo_2-p_2o_5-doped silica graded-index optical fibers
TRANSCRIPT

Transmission bandwidth properties of GeO2 -P2 05 -doped silicagraded-index optical fibers
Y. Ohmori
Transmission bandwidth properties of GeO 2 -P 2 0 5-doped silica graded-index fibers have been investigated.Theoretical results obtained from Olshansky's theory are represented in the form of a bandwidth map withprofile parameter a on the vertical axis and wavelength X horizontally. The material dispersion am (X) andthe optimal profile parameter aot(X) determined by the glass refractive-index measurement are used forcalculating the transmission bandwidth. It is confirmed that the estimated results from the bandwidth mapagree with the experimental results of transmission bandwidth measurements at X = 0.82, 1.06, 1.27, and 1.52/im for twenty GeO2-P2 05-doped silica graded-index fibers with different a values.
1. Introduction
It is necessary to determine experimentally andtheoretically the dependence of the transmissionbandwidth on the profile parameter a and the wave-length for clarifying the transmission bandwidthproperties of graded-index optical fibers. The trans-mission bandwidth properties have been investigatedtheoretically and experimentally for available fiber glasscompositions.1-
The GeO 2 -P2 05-doped silica glass composition is apromising contender for use in optical fibers for trans-mission media in the long-wavelength optical commu-nication systems because of its low scattering lossproperty and low deposition temperature, which makeit easy to control the refractive-index profile in thefabrication process by the modified CVD method. 5
In previous papers the optimal profile parameter a 0opt
of GeO 2 -P2 05 -doped silica graded-index fibers wasdiscussed from the dependence of the transmissionbandwidth on the profile parameter a at 1.27 m,6 theglass refractive-index measurement,7 and the wave-length dependence of the transmission bandwidth.8
The material dispersion ain(X) of GeO 2 -P2 05 -dopedsilica glass system was also determined by the nano-second pulse method. 7
The author is with Nippon Telegraph & Telephone Public Cor-poration, Ibaraki Electrical Communication Laboratory, Tokai,Ibaraki-ken, 319-11 Japan.
Received 1 June 1981.0003-6935/81/244307-06$00.50/0.© 1981 Optical Society of America.
In this paper theoretical results on the transmissionbandwidth properties obtained by using previous dataand Olshansky's theoryl are represented in the form ofa bandwidth map, with profile parameter a on thevertical axis and wavelength X on the horizontal axis.As an experimental result, the transmission bandwidthsof GeO2-P205-doped silica graded-index fibers withdifferent a values measured at different wavelengthsare described.
II. Bandwidth Map
The transmission bandwidth f(a,X,AX) of GeO2-P 205 -doped silica graded-index fibers with A = 1% canbe calculated from Olshansky's theory,' by using theprevious data7 of the material dispersion ,m (X) and theoptimal profile parameter a0 pt(X). The theoreticalbandwidth is a function of the profile parameter a, thewavelength X, and the linewidth AX of the lightsource.
To schematically represent the theoretical results aniso-bandwidth line (a line joining places having the samebandwidth of fiso) on a bandwidth map, with profileparameter a on the vertical axis and wavelength X onthe horizontal axis, is determined by using the followingprocedures:
(1) By using the material dispersion 0 m(X) (psec/Akm) and the linewidth AX(A) of the light source, theintramodal dispersion erintramode is calculated as afunction of the wavelength.
Cintramode = 2(2 1n2)1/ 2 M (1)
(2) By using the intramodal dispersion intramodecalculated from process (1), the intermodal dispersionUintermode is calculated as a function of the wavelengthin the case of f (a,X,AX) = fiso (GHz km).
15 December 1981 / Vol. 20, No. 24 / APPLIED OPTICS 4307

- 1000
c 500
9 200a:I)
0a 100 F
020
0
10
-0.20 -0.15 -0.1 -0.05 0 0.05 0.1 0.15 0.20
a -DEVIATION FROM a opt a - a opt
Fig. 1. Intermodal dispersion Orintermode vs a deviation from aopt.
2.
2LiI-
0.
0
Figure 2, 3, 4, and 5 show the bandwidth maps withAX = 0, AX = 20, AX = 100, and AX = 400 A, respec-tively, for GeO 2 -P2 05-doped silica graded-index fiberswith A = 1%. The iso-bandwidth lines in Figs. 2, 3, 4,and 5 are taken to be 500 MHz km, 1 GHz km, and 3GHz km. As seen in the bandwidth maps, the charac-teristics of the transmission bandwidth are affectedsignificantly in the shorter than l.O-,um wavelength bythe linewidth AX of the light source.
Ill. Experimental Procedures
A. Fiber Fabrication
Graded-index optical fibers with GeO2-P 205-SiO2core and uniform GeO 2-B20 3-P 205 -SiO2 cladding wereprepared by the modified CVD method.9
Figure 6 shows a block diagram of the fabricationsystem. Raw material gases carried with Ar are intro-duced into a quartz tube set on a glass-working lathe.The flow rate x of the raw material vapor is approxi-mately expressed by
PT-U,760 - PT
(3)
where PT is a vapor pressure (mmHq) of the raw ma-terial (SiCl4 , GeCl4, BBr3 , or POC13 ) in a saturator heldat temperature TIC, and u is the carrier gas-flow rate.Oxygen gas for oxidation of the raw material vapors is
.71 0 0 1 1 .2 14 _. I I I I I I I I I 10.7 0.8 0.9 1.O . 1I.2 1.3 1.4 1.5 1.6 1.7
WAVELENGTH (pm)
Fig. 2. Bandwidth map for GeO 2 -P 2 05 -doped silica graded-indexfibers with A = 1% at the linewidth of the light source AX = 0 A.
2.1
.tW
E
L
W-j
0a:Q.
JA =20A°
JA =100A
ts1:
E*sQa:
(L
0
IL
0.71 10.7 0.8 0.9 1.0 1.1 1.2 1.3 1.4 1.5 1.6 1.7
WAVELENGTH A (pm)
Fig. 4. Bandwidth map for GeO 2 -P2 0 5 -doped silica graded-indexfibers with A = 1% at the linewidth of the light source AX = 100 A.
0.7 0.8 0.9 1.0 1.1 1.2 1.3 1.4 1.5 1.6 1.7
WAVELENGTH (pm)
Fig. 3. Bandwidth map for GeO2 -P2 0 5-doped silica graded-indexfibers with A = 1% at the linewidth of the light source AX = 20 A.
[(21 n2)1/2 1 2 11/2Iintermode = I i - - 'intramode 1 (2)
(3) By using Fig. 1, the a deviation from a0 pt is de-termined as a function of the wavelength in the case ofthe intermodal dispersion intermode calculated fromprocess (2).
(4) By using the optimal profile parameter a0 pt(X)and the a deviation calculated from process (3), theprofile parameter is determined as a function of thewavelength when the transmission bandwidth is fiso andthe linewidth of the light source is AX.
Lib
a
-
oa
2.1AIA =400A
I I I I I I I IA above 3GHz.kmB I GHz-km-3GHz.km
D C: 500MHz.km-IGHz.kmfflfl-D D below 500MHz2.0k-
, .9-
DI I I I I I.7L
0. - 0.8 0.9I I I
1.0 1.1 1.2 1.3 1.4 1.5 1.6 1.7
WAVELENGTH ( m)
Fig. 5. Bandwidth map for GeO 2 -P2 0 5 -doped silica graded-indexfibers with A = 1% at the linewidth of the light source AX = 400 A.
4308 APPLIED OPTICS / Vol. 20, No. 24 / 15 December 1981
l
.7

Oxygen Argon
Fig. 6. Block diagram of the modified CVD fabrication system.
X 10-I
1 5
30 15 0 15 30r (m)
2 -
I _
0.5
C
C
0.0 1'5 10 20 30 50
r (m)
(a) (b)
Fig. 7. Typical example of measured refractive-index profiles forGeO 2 -P2 0 5 -doped silica graded-index fibers: (a) refractive-index
profile; (b) profile parameter a.
Table 1. Raw Material Condition for Fiber Fabrication
SiCl4 GeCl4 POCl3 BBr3Clad Core Clad Core Clad Core Clad Corelayer layer layer layer layer layer layer layer
Temperature (°C) 19.5 19.5 4 4 10 10 17 -
0Flow rate of Ar gas (cc/min) 403 133 28 96 32 142 -
310
0Flow rate of raw material gas 130.6 43.1 1.13 2.1 0.7 8.6 -
(cc/min)12.4
also introduced into the quartz tube. The temperatureof the tube, heated by an oxyhydrogen gas flame, wasmeasured by a Williamson model 4420 IR pyrometerand regulated with an accuracy of +50C by controllingthe oxyhydrogen gas-flow ratio. The burner movesalong the tube length at 150 mm/min for converting theraw material gases into oxide and simultaneously intoa transparent glass layer on the tube's inside wall. Thisprocess was repeated many times so that thick glasslayers were deposited inside the tube. As the refractiveindex of a glass layer depends on the mixing ratio ofGeCl4 gas, the refractive-index profile of the depositedcore glass is formed by changing the mixing ratio at eachburner pass number.
A typical example of fabrication conditions used inthis study is shown in Table I. A Heralux quartz tube,with a 20-mm o.d., 17-mm i.d., and 1000-mm length, wasused as a supporting tube. Twenty layers of uniformGeO2 -, P2 05 -, and B2 03 -doped silica glass composition,whose refractive index was controlled to be equal to thatof SiO2 at 0.589-Mm wavelength, were deposited as acladding layer. To form the graded-index core layer theGeCl4 flow rate x (cc/min) is increased gradually ac-cording to Eq. (4) (Ref. 9) at each burner pass, and thetotal was 100 passes.
x = 12.4 t1 - 100- i /21 (4)
m100 Iwhere i is a burner pass number. Both SiCl4 and POC13
flow rates were kept constant throughout the core de-position. The above process was accomplished byprogramming the flow rates to the thermal mass-flowcontrollers with a minicomputer (HP-25A).
In the present study, core layer deposition conditionswere designed to be a = 1.95, 1.90, 1.85, 1.80, and 1.75.After the deposition processes the tube was collapsedin six burner passes into a preform by heating it to'1800°C. The obtained preforms were drawn into fi-bers in a carbon-resistance furnace.
B. Measurements
The refractive-index profile was measured with atransmission interference microscope' 0 on 50-Mim thickpolished fiber samples. Profile parameters of fiberswere evaluated by plotting the refractive-index differ-ence between n(r) and n1 in a coordinate system, wheren- n(r) is on the vertical axis and r is on the horizontalaxis. As a dip appeared in the core center, nj was esti-mated by extrapolating n(r) to the core center. Figure7 shows a typical example of measured refractive-indexprofile. The profile parameter a can be obtained fromthe slope plotted in Fig. 7(b). The refractive-indexprofiles of the fibers fabricated in this study were wellcharacterized by a single a because measured pointswere approximately on one straight line as shown in Fig.7(b). The profile parameter a is estimated within anerror of +0.03.
15 December 1981 / Vol. 20, No. 24 / APPLIED OPTICS 4309
= .93
I I I I
an
0.1 0.05_

Table 11. Experimental Conditions for Transmission BandwidthMeasurements
LinewidthWave- of thelength Light light source Measuring(Aim) source AX (A) Detector method
0.82 GaAlAs laser 20 Si-APD Swept-frequency
1.06 Mode-locked 2 Ge-APD PulseNd: YAG laser transmission
1.27 GaInAsP/InP 40 Ge-APD Swept-laser frequency
1.52 GaInAsP/InP 15 Ge-APD Swept-laser frequency
V-Groove
Fig. 8. Block diagram of the measuring setup for the swept-fre-quency method.
Nd: YAG Laser V-Groovemi n m . Connector
Ll~~o-(ot~~~l EEEStep-lnde. Test
Fiber FiberMode
m a Locker a = 0 1 1
Sampling CPUa 1. ill5 ope M
Fig. 9. Block diagram of the measuring setup for the pulse trans-mission method.
Bandwidths were measured by a swept-frequencymethod" and a pulse transmission method. Table IIindicates the experimental conditions for bandwidthmeasurements at four wavelengths ( = 0.82, 1.06, 1.27,and 1.52 m).
A block diagram of the measuring setup for theswept-frequency method is illustrated in Fig. 8. A laserdriver with a flat frequency response in the 0.1-MHz-2.3-GHz frequency range was used. Basebandfrequency response can be measured in the 0.1-MHz-1.9-GHz frequency range by transforming theoutput waveform of the laser driver into rectangularcurrent pulses (return to zero pulses). The optical
signal transmitted through a fiber was detected with afast avalanche photodiode. The detected optical signalwas transformed by a spectrum analyzer.
Figure 9 shows a block diagram of the measuringsetup for the pulse transmission method. A mode-locked Nd:YAG laser was used as an optical source.The average output power was 230 mW, and the beamspot size was 2.2 mm. The input pulse width was 500psec, and the repetition frequency was 300 MHz. Theoptical signal transmitted through a fiber was detectedby a fast germanium avalanche photodiode and fed intoa sampling oscilloscope. The detected optical signalswere analyzed by the Tectronix digital processing os-cilloscope system (D.P.O. system; wp-1200). Transferfunctions for the fibers were obtained by a fast Fouriertransform (FFT) algorithm.
A randomly bent step-index multimode fiber of 5-mlength was used as a mode scrambler. Splicing betweenthe step-index fiber and the test fiber was made in aV-groove. The transmitted optical signal after the 2-mgraded-index fiber was used as a reference.
IV. Results and Discussions
The dependence of the transmission bandwidth onthe profile parameter ax for GeO 2 -P2 05 -doped silicagraded-index fibers was investigated by the bandwidthmeasurements at four wavelengths (X = 0.82, 1.06, 1.27,and 1.52 -Mtm) in twenty fibers. The structural param-eters of the fibers are listed in Table III, and the com-posite loss spectrum of the fibers is shown in Fig. 10.The average losses of these fibers were 2.74 dB/km at0.82jum, 1.05 dB/km at 1.06 Mm, 0.79 dB/km at 1.27,Mm,and 0.63 dB/km at 1.52 Mm. It can be seen from TableIII and Fig. 10, that the twenty fibers prepared for thepresent study are similar in structure and loss.
Table Ill. Structural Parameters of the Fibers
Relative Core Outerindex diameter diameter Thickness of
difference A 2a 2b clad(%) (Am) (Am) (Am)
Average 0.96 58.4 150.2 12.3
Variance 0.07 2.7 0.6 1.4
20.0
I 0.0
m 5.0
U) 2.0_0
I .0
0.5
0.7 0.9 1.1 1.3 1.5 1.7
WAVELENGTH (pm)
Fig. 10. Loss spectra in the wavelength region from 0.7 to 1.7 Am fortwenty fibers: core material, GeO 2 -P 2 05 -SiO 2 ; clad material,
GeO 2-P 20 5 -B2 03 -SiO2 -
4310 APPLIED OPTICS / Vol. 20, No. 24 / 15 December 1981
I I I
I I_
1.7 1:8 1.9 2.0 2.1
20.C
I
I-_
3t0znz0U)2U)Zit
PROFILE PARAMETER a
(a)
I o.ok
5.01-
2.0
1.0
0.51
1.7 1.8 1.9 2.0 2.1
PROFILE PARAMETER a
(b)
20.0
IE3
II-03:0
nZ
0V)UI)2U)zixI-
10.0
5.0
2.0
1.0
0.5
0.2
0.11.7 1.8 1.9 2.0 2.1
, 20.0E
I 10.0
I 5.0I-a3:o 2.0Z
n .0
2V)
<Z 0.2D
0.1
PROFILE PARAMETER a
(c)
1.7 1.8 1.9 2.0 2.1
PROFILE PARAMETER a
(d)
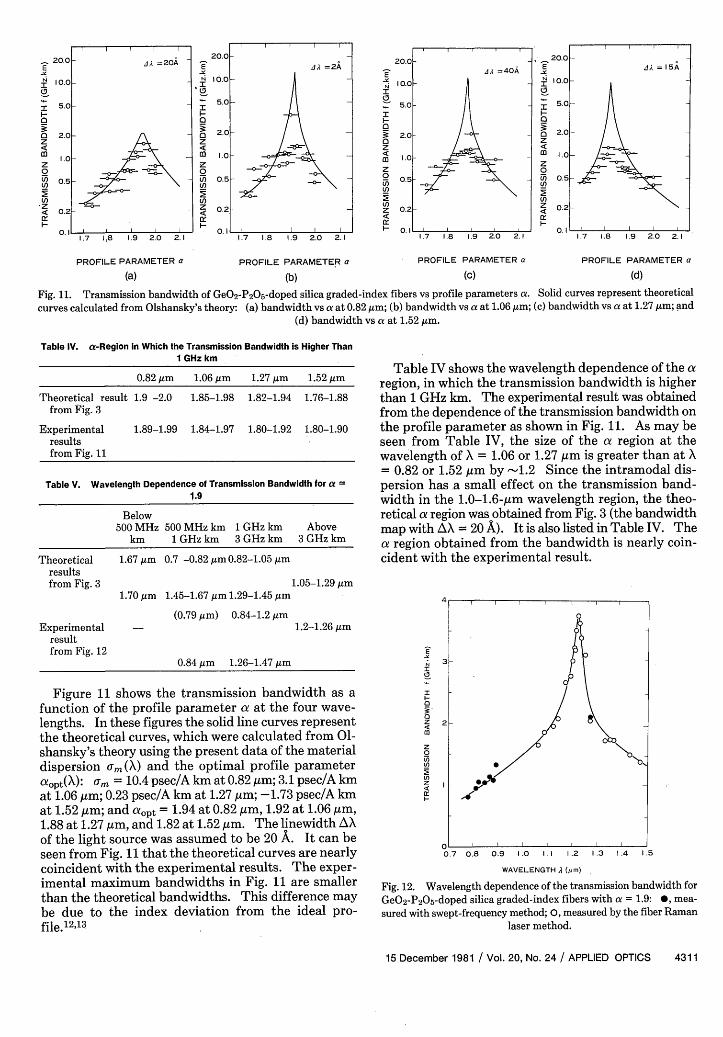
Fig. 11. Transmission bandwidth of GeO2 -P 2 05 -doped silica graded-index fibers vs profile parameters a. Solid curves represent theoretical
curves calculated from Olshansky's theory: (a) bandwidth vs a at 0.82Ajim; (b) bandwidth vs a at 1.06Ajm; (c) bandwidth vs a at 1.27,jm; and(d) bandwidth vs a at 1.52 jim.
Table IV. a-Region in Which the Transmission Bandwidth is Higher Than1 GHz km
0.82 jm 1.06 jm 1.27 jm 1.52 jm
Theoretical result 1.9 -2.0 1.85-1.98 1.82-1.94 1.76-1.88from Fig. 3
Experimentalresultsfrom Fig. 11
1.89-1.99 1.84-1.97 1.80-1.92 1.80-1.90
Table V. Wavelength Dependence of Transmission Bandwidth for a =
1.9
Below500 MHz 500 MHz km 1 GHz km Above
km 1 GHz km 3 GHz km 3 GHz km
Theoretical 1.67 Am 0.7 -0.82 Am 0.82-1.05 Amresultsfrom Fig. 3 1.05-1.29 jm
1.70 jm 1.45-1.67 jm 1.29-1.45 jm
(0.79 jim) 0.84-1.2 jmExperimental - 1.2-1.26 jm
resultfrom Fig. 12
0.84 jm 1.26-1.47 jm
Figure 11 shows the transmission bandwidth as afunction of the profile parameter ax at the four wave-lengths. In these figures the solid line curves representthe theoretical curves, which were calculated from 01-shansky's theory using the present data of the materialdispersion om(X) and the optimal profile parameteraxpt(X): om = 10.4 psec/A km at 0.82 Am; 3.1 psec/A kmat 1.06,um; 0.23 psec/A km at 1.27 Am; -1.73 psec/A kmat 1.52 ,m; and ax0pt = 1.94 at 0.82 Mm, 1.92 at 1.06 Mm,1.88 at 1.27 Mm, and 1.82 at 1.52 Mm. The linewidth AXof the light source was assumed to be 20 A. It can beseen from Fig. 11 that the theoretical curves are nearlycoincident with the experimental results. The exper-imental maximum bandwidths in Fig. 11 are smallerthan the theoretical bandwidths. This difference maybe due to the index deviation from the ideal pro-file.12,13
Table IV shows the wavelength dependence of the aregion, in which the transmission bandwidth is higherthan 1 GHz km. The experimental result was obtainedfrom the dependence of the transmission bandwidth onthe profile parameter as shown in Fig. 11. As may beseen from Table IV, the size of the ax region at thewavelength of X = 1.06 or 1.27 Mim is greater than at X= 0.82 or 1.52 Mim by -1.2 Since the intramodal dis-persion has a small effect on the transmission band-width in the 1.0-1.6-Mm wavelength region, the theo-retical ax region was obtained from Fig. 3 (the bandwidthmap with AX = 20 A). It is also listed in Table IV. Theax region obtained from the bandwidth is nearly coin-cident with the experimental result.
I(3I
a1-
a
co
Z
0
E
z
a:
0.7 0.8 0.9 1.0 1.1 1.2
WAVELENGTH A (Pm)
1.3 1.4 1.5
Fig. 12. Wavelength dependence of the transmission bandwidth forGeO 2 -P 2 0 5-doped silica graded-index fibers with a = 1.9: *, mea-sured with swept-frequency method; 0, measured by the fiber Raman
laser method.
15 December 1981 / Vol. 20, No. 24 / APPLIED OPTICS 4311
I I I I
A, =20A
D I 7A
20.0
10.0
5.0
2.0
1.0
0.5
0.2
0.1
'E
I(sII-.a3:0zM
(n
z0
I-
A1A =40A
I I I
I 2
AA =2A
l l l
AA = 15A
Lt 1
F
I-
DF
0.2 .
O. I

The bandwidth map presents not only the depen-dence of the transmission bandwidth on the profileparameter but also the wavelength dependence of thetransmission bandwidth. Table V shows the wave-length dependence of the transmission bandwidth forGeO2-P2 05-doped silica graded-index fibers with a =1.9. Figure 12 shows the wavelength dependence of thetransmission bandwidth, measured by the fiber Ramanlaser method.8"14 The experimental result in Table Vwas obtained from Fig. 12. The theoretical result ob-tained from the bandwidth map shows agreement withthe experimental result.
V. Conclusions
A bandwidth map was made for schematically pre-senting the transmission bandwidth properties ofGeO2-P2 05-doped silica graded-index fibers. Thebandwidth map presents the dependence of the trans-mission bandwidth on the profile parameter and thewavelength dependence of the transmission bandwidth.The a region, in which the transmission bandwidth ishigher than 1 GHz km, and the wavelength dependenceof the transmission bandwidth for ax = 1.9 obtained fromthe bandwidth map were confirmed by the experimentalresults. The theoretical dependence of the transmis-sion bandwidth on the profile parameter was also con-firmed by the experimental dependence at four wave-lengths (X = 0.82, 1.06, 1.27, and 1.52 Mm).
The author wishes to thank N. Niizeki, H. Takata,and N. Inagaki for their encouragement. He would alsolike to thank T. Edahiro, S. Takahashi, I. Hatakeyama,and M. Horiquchi for their informative discussions andH. Okazaki for fiber preparation.
References1. R. Olshansky and I. P. Kaminow, Appl. Opt. 15, 483 (1976).2. L. G. Cohen, Appl. Opt. 15, 1808 (1976).3. L. G. Cohen, I. P. Kaminow, H. W. Astle and L. W. Stulz, IEEE.
J. Quantum Electron. QE-14, 37 (1978).4. H. M. Presby and I. P. Kaminow, Appl. Opt. 15, 3029 (1976).5. Y. Ohmori, H. Okazaki, M. Horiguchi, and I. Hatakeyama,
Electron. Commun. Lab. Tech. J. NTT Jpn. 29, 233 (1980) (inJapanese).
6. Y. Ohmori, K. Chida, M. Horiguchi, and I. Hatakeyama, Electron.Lett. 14, 764 (1978).
7. M. Horiguchi, Y. Ohmori, and T. Miya, Appl. Opt. 18, 2223(1979).
8. M. Horiguchi, Y. Ohmori, and H. Takata, Appl. Opt. 19, 3159(1980).
9. W. G. French, G. W. Tasker, and J. R. Simpson, Appl. Opt. 15,1803 (1978).
10. C. A. Burrus and R. D. Standley, Appl. Opt. 13, 2365 (1974).11. I. Kobayashi and M. Koyama, Trans. IECE Jpn. E-59, 11
(1976).12. R. Olshansky, Appl. Opt. 15, 783 (1976).13. D. Marcuse and H. M. Presby, Appl. Opt. 18, 3758 (1979).14. L. G. Cohen and Chinlon Lin, Appl. Opt. 16, 3136 (1977).
FACSS IXPRELIMINARY ANNOUNCEMENT
ANDCALL FOR PAPERS
The 9th Meeting of the Federation of AnalyticalChemistry and Spectroscopy Societies (FACSS) will beheld September 19-24, 1982 at the Franklin Plaza HotelIn Philadelphia, Pa. Original unpublished papers willbe accepted for presentation on all facets ofanalytical chemistry, applied spectroscopy,chromatographic methods, and allied techniques of In-strumental analysis.
Authors who wish to present papers at the 1982FACSS meeting must submit the title of their presen-tation, current address and current telephone numberby April 14, 1982 to:
FACSS IX Program ChairmanAndrew T. ZanderSpectrametrics, Inc.204 Andover StreetAndover, MA 01810(617)475-7015
After receipt of the title each author will be notified,and asked to submit a 250 word abstract by June 9,1982.
4312 APPLIED OPTICS / Vol. 20, No. 24 / 15 December 1981