transnational crime, local criminals. hope.pdf · transnational crime, local criminals ... colima....
TRANSCRIPT

TRANSNATIONAL CRIME, LOCAL CRIMINALS Rethinking the size and shape of Mexican organized crime
December 2011
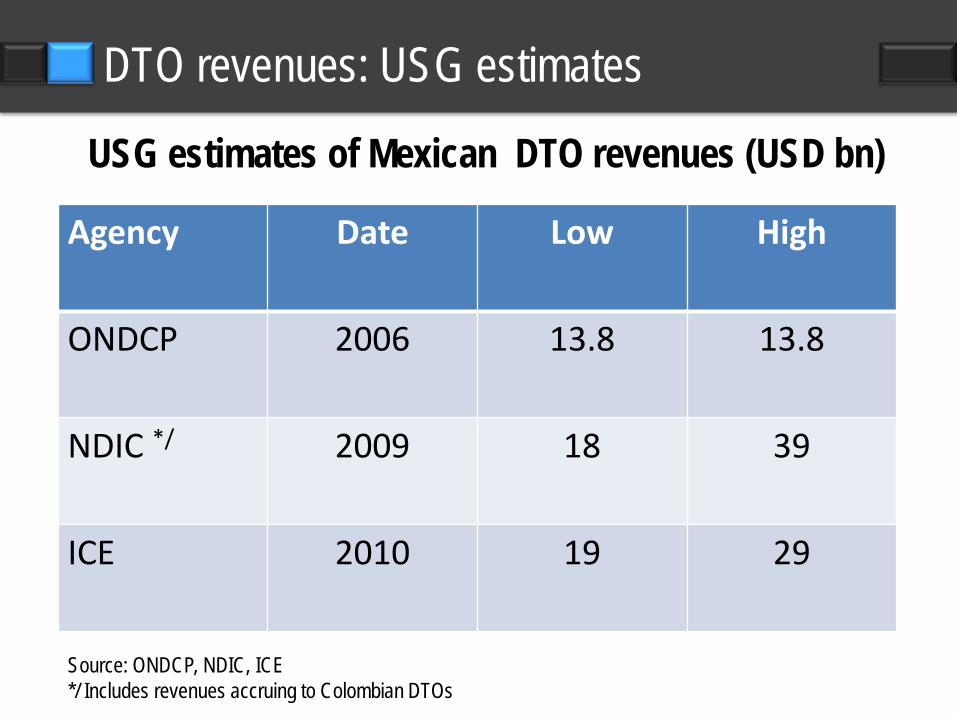
DTO revenues: USG estimates
Source: ONDCP, NDIC, ICE */ Includes revenues accruing to Colombian DTOs
USG estimates of Mexican DTO revenues (USD bn)
Agency Date Low High
ONDCP 2006 13.8 13.8
NDIC */ 2009 18 39
ICE 2010 19 29
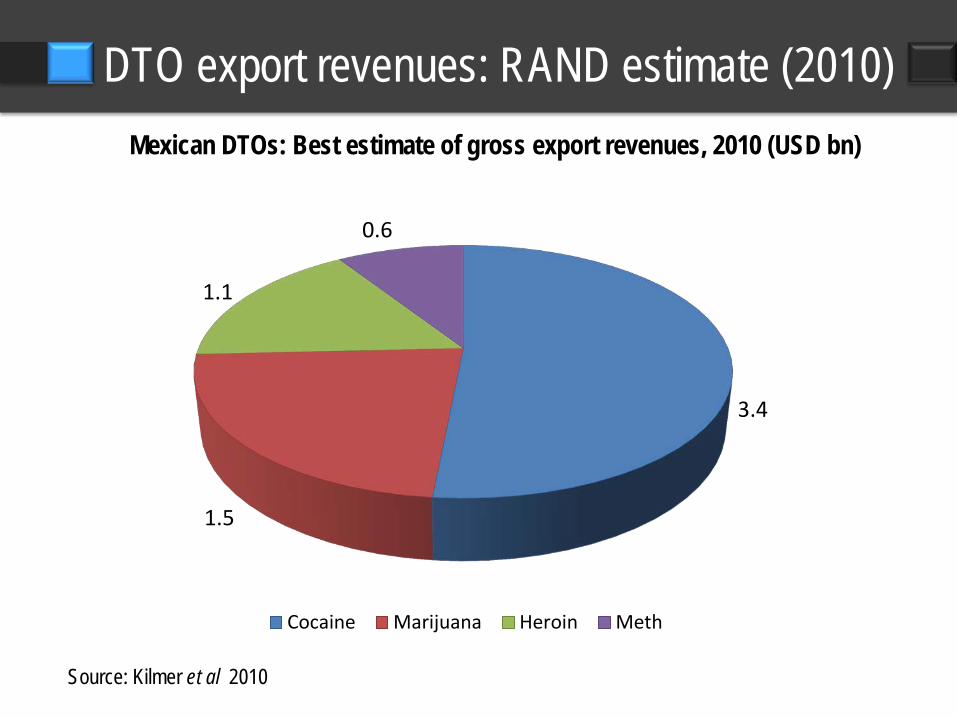
Source: Kilmer et al 2010
DTO export revenues: RAND estimate (2010) Mexican DTOs: Best estimate of gross export revenues, 2010 (USD bn)
3.4
1.5
1.1
0.6
Cocaine Marijuana Heroin Meth
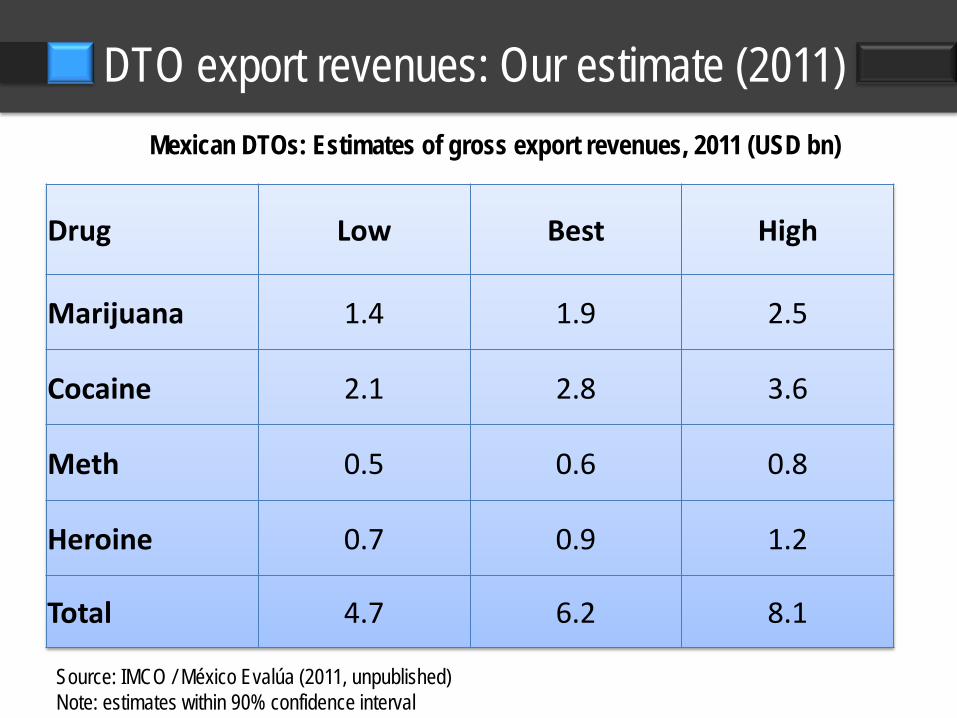
Source: IMCO / México Evalúa (2011, unpublished) Note: estimates within 90% confidence interval
DTO export revenues: Our estimate (2011) Mexican DTOs: Estimates of gross export revenues, 2011 (USD bn)
Drug Low Best High
Marijuana 1.4 1.9 2.5
Cocaine 2.1 2.8 3.6
Meth 0.5 0.6 0.8
Heroine 0.7 0.9 1.2
Total 4.7 6.2 8.1

DTO income: missing pieces GROSS EXPORT REVENUES
- COST OF DRUGS
= NET DRUG EXPORT REVENUES + NET DOMESTIC DRUG REVENUES + US DOMESTIC DISTRIBUTION REVENUES
= TOTAL DRUG INCOME
+ NON-DRUG INCOME
= TOTAL INCOME
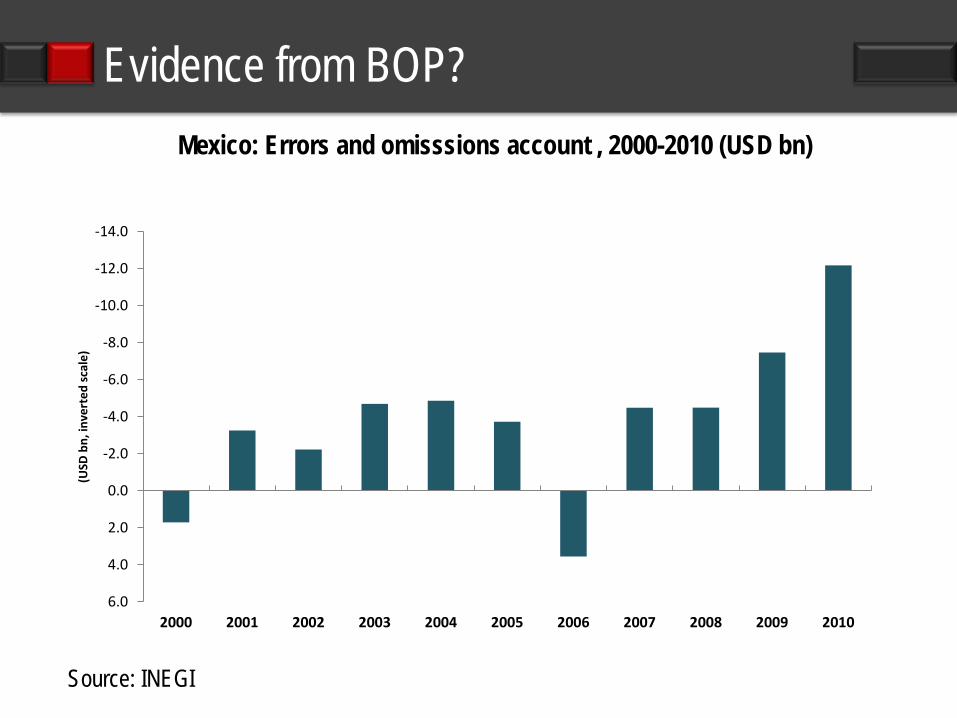
Source: INEGI
Evidence from BOP? Mexico: Errors and omisssions account , 2000-2010 (USD bn)
-14.0
-12.0
-10.0
-8.0
-6.0
-4.0
-2.0
0.0
2.0
4.0
6.02000 2001 2002 2003 2004 2005 2006 2007 2008 2009 2010
(USD
bn,
inve
rted
scal
e)

Source: Banxico
Evidence of “Dutch disease”? MX Peso: Trade-weighted exchange index, 2000-2011
(100=Jan. 2000)
60.0
70.0
80.0
90.0
100.0
110.0
120.0
130.0
Jan-
00M
ay-0
0Se
p-00
Jan-
01M
ay-0
1Se
p-01
Jan-
02M
ay-0
2Se
p-02
Jan-
03M
ay-0
3Se
p-03
Jan-
04M
ay-0
4Se
p-04
Jan-
05M
ay-0
5Se
p-05
Jan-
06M
ay-0
6Se
p-06
Jan-
07M
ay-0
7Se
p-07
Jan-
08M
ay-0
8Se
p-08
Jan-
09M
ay-0
9Se
p-09
Jan-
10M
ay-1
0Se
p-10
Jan-
11M
ay-1
1
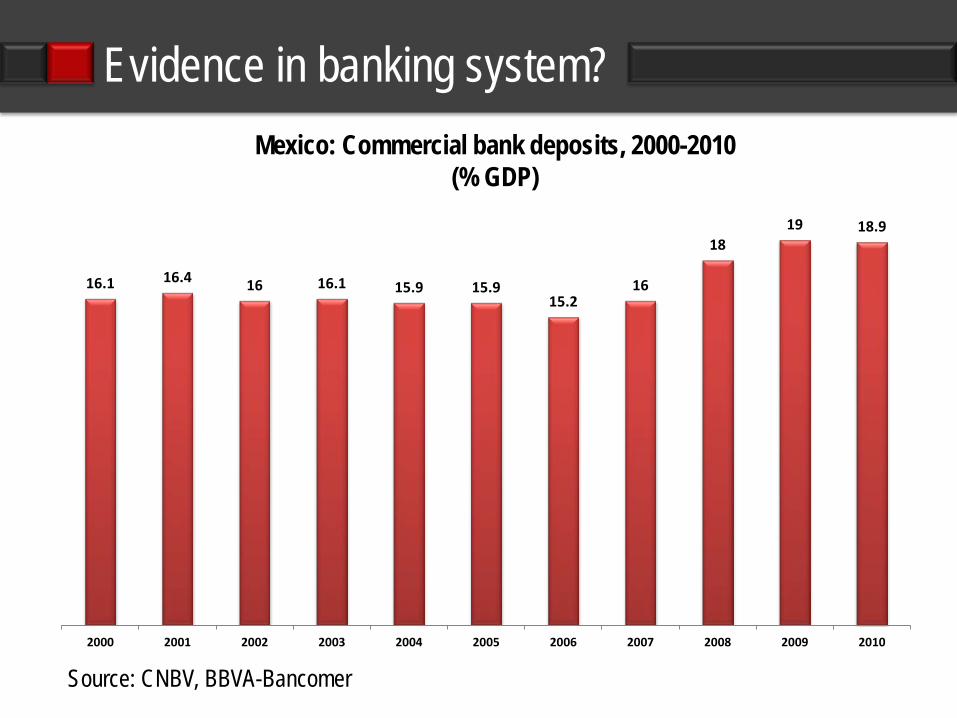
Evidence in banking system? Mexico: Commercial bank deposits, 2000-2010
(% GDP)
Source: CNBV, BBVA-Bancomer
16.1 16.4 16 16.1 15.9 15.9 15.2
16
18 19 18.9
2000 2001 2002 2003 2004 2005 2006 2007 2008 2009 2010
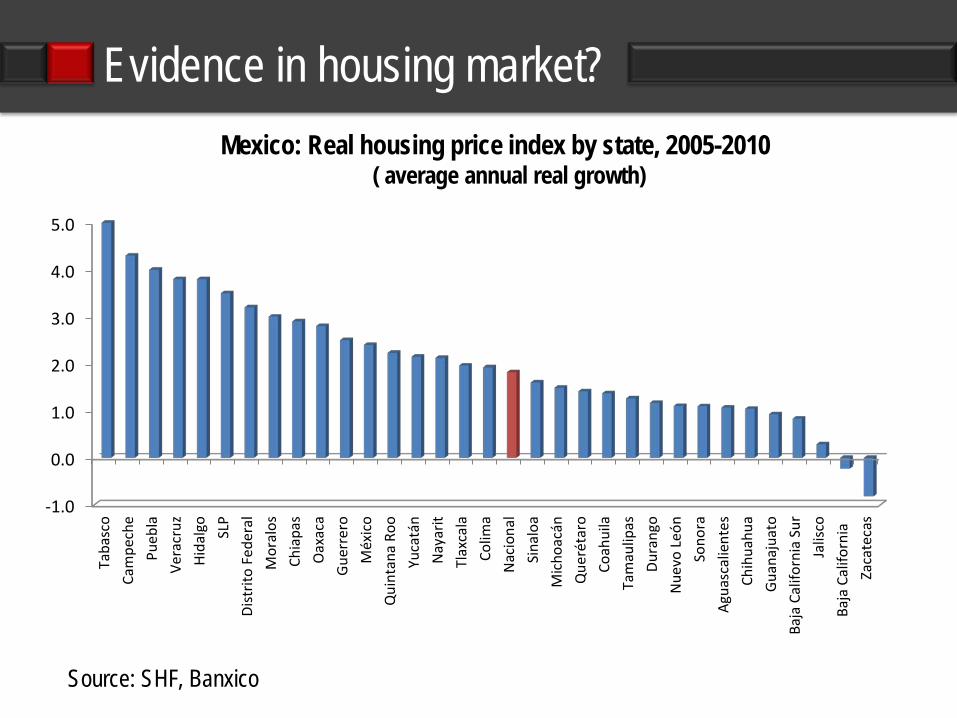
Evidence in housing market? Mexico: Real housing price index by state, 2005-2010
( average annual real growth)
Source: SHF, Banxico
-1.0
0.0
1.0
2.0
3.0
4.0
5.0
Taba
sco
Cam
pech
ePu
ebla
Vera
cruz
Hida
lgo
SLP
Dist
rito
Fede
ral
Mor
alos
Chia
pas
Oax
aca
Guer
rero
Méx
ico
Qui
ntan
a Ro
oYu
catá
nN
ayar
itTl
axca
laCo
lima
Nac
iona
lSi
nalo
aM
icho
acán
Que
réta
roCo
ahui
laTa
mau
lipas
Dura
ngo
Nue
vo L
eón
Sono
raAg
uasc
alie
ntes
Chih
uahu
aGu
anaj
uato
Baja
Cal
iforn
ia S
urJa
lisco
Baja
Cal
iforn
iaZa
cate
cas
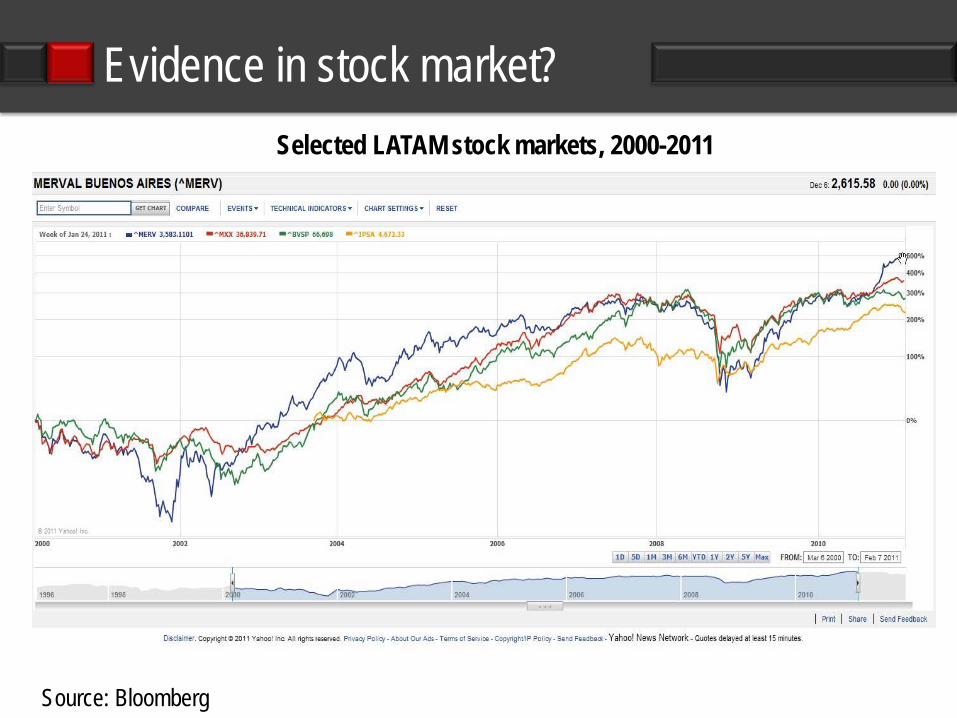
Evidence in stock market? Selected LATAM stock markets, 2000-2011
Source: Bloomberg

Vertical integration?
0% 10% 20% 30% 40% 50% 60% 70% 80% 90% 100%
Importer
Producer
Money laundering
Wholesaler
Retailer
Mule
Possession
Unspecified
US, Non-Mexican Mexican-American Mexican Other nationals
Drug-related state and federal inmates by self-specified role and national/ethnic origin, 2004 (%)
Source: Caulkins/Sevigny 2010, with data from Survey of Inmates in State and Federal Correctional Facilities (2004)

A taxonomy of criminal groups Illicit traffic
Rent extraction
Local Transnational
Sinaloa
AFO BLO
Juárez / BA Zetas
Templarios
Prison gangs
Human traffickers
Migrant kidnappers
Local kidnappers
Acapulco gangs
Fuel thiefs
“Fakers”
Local drug distributors
Traditional smugglers
Domestic traders
Gulf
Muscle men
Piracy rings
Border extortionists

Three conclusions and some implications
Conclusions CW about size, most likely wrong
Network, not vertically-integrated structure
Highly diversified criminal forms: TCO denomination obscures the issue!
Implications No long-term threat to Mexican national security
Key issue: law and order
Need for local responses (while leveraging federal + US resources)
Thank you Alejandro Hope Proyecto MC2 (Menos Crimen, Menos Castigo) Blog: http://www.animalpolitico.com/blogueros-plata-o-plomo Twitter: @ahope71