transparent insulation in practice: results from the new ... · transparent insulation in practice:...
TRANSCRIPT
Transparent insulation in practice: results from the new passive solar student residences in Glasgow Robert Forrest, Callum Stuart and John Twidell
Energy Studies Unit, University of Strathclyde, Glasgow GI IXQ, Scotland
ABSTRACT
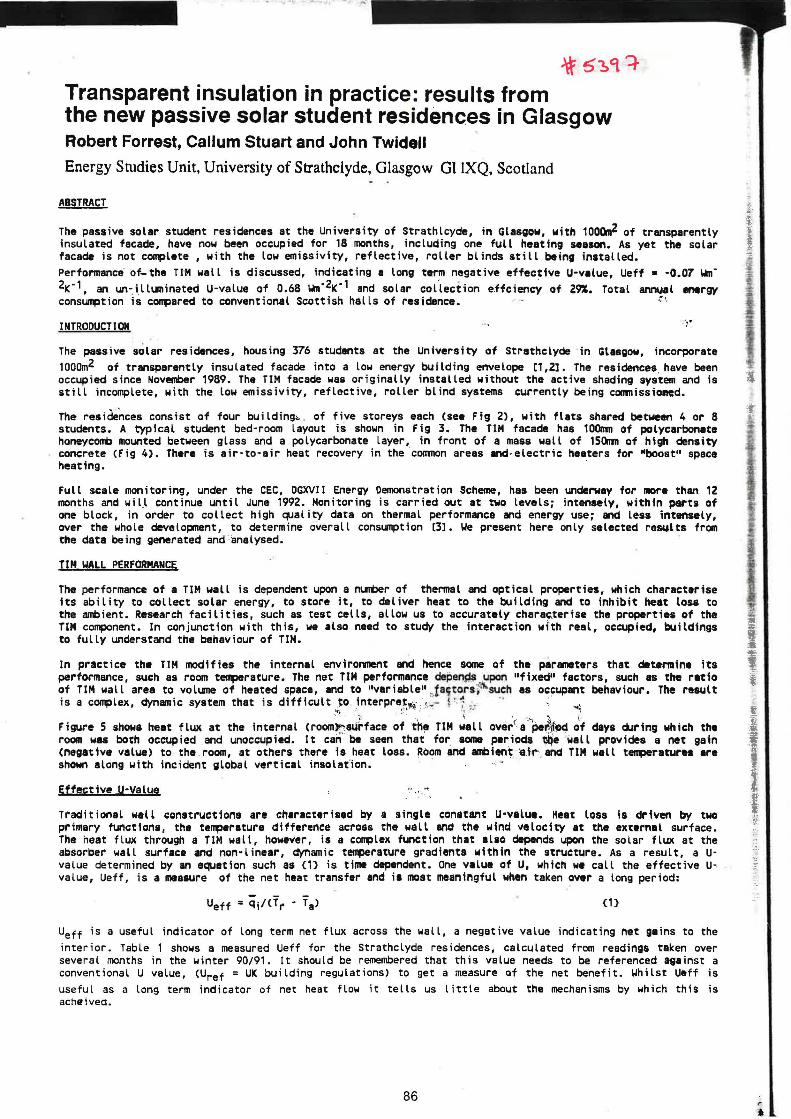
The passive solar student residences at the University of Strathlcyde, in Glasgow, with 100ar.2 of transparently insulated facade, have now been occupied for 18 months, including one full heating season. As yet the solar facade is not c~lete, with the low emissivity, reflective, roller blinds still being installed. Performance of-the Tl'M wal L is discussed, indicating a Long term negative effectfve U·value, Ueff • ·0.07 1.m· 2K·1, an un~i.lluninated U-value of 0.68 1.m·2K- 1 and solar col .lection e.ffciency of 291. Total annual energy cons~tion is compared to conventional Scottish halls of residence. -~·-
INTRODUCTION
The passive solar residences, housing 376 students at the University of Strathclyde in Glasgow, incorporate 1000m2 of transparently insulated facade into a Low energy building envelope C1,2l. The residences. have been occupied since Noveni:>er 1989. The TIM facade was originally installed without the active shading system and is still incomplete, with the low emissivity, reflective, roller blind systems currently being comnissiQl!ed.
The reside~ces consist of four building~ . of five storeys each (see Fig 2), with flats shared between 4 or 8 students. A typical student bed-room layout is shown in Fig 3. The TIM facade has 100nm of polycarbonate honeyconl> mounted between glass and a polycarbonate Layer, in front of a mass wall of 150nm of high density concrete (fig 4). There is air-to-air heat recovery in the co111110n areas and-electric heaters for "boost" space heating. ·
Full scale monitoring, under the CEC, DGXVII Energy Demonstration Scheme, has been underway for 1110re than 12 months and wi L_l continue until June 1992. Monitoring is carried out at two levels; intensely, within parts of one block, in order to col Leet high quality data on thermal performance and energy use; mid less intensely, over the whole development, to determine overall consumption C3l. We present here only selected results from the data being generated and -analysed.
TIM WALL PERFORMANCE
The performance of a TIM wall is dependent upon a nunber of thermal and optical properties, which characterise its ability to collect solar energy, to store it, to deliver heat to the building and to inhibit heat losa to the ambient. Research facilities, such as test cells, allow us to accurately chara~terise the properties of the TIM co.nent. In conjunction with this, we also need to study the interaction wl"th real, occupied, buildings to fully understand the behaviour of TIM.
In practice the TIM modifies the internal enviroment and hence some of the paraneters thn determine its performance, such as room t~rature. The net TIM performance dej)e~ . upon "fixed" factors, such as the ratio of TIM wall area to volune of heated space, and to "variable" J a,torst"-such as occupant behaviour. The result is a complex, dynamic system that is difficult ,~o . interpre:~~-:' ';-- ~ '· ~ ~.- - ·· · ..,1
. . ~ ' ·, ~ ·, ..... , ~ ~
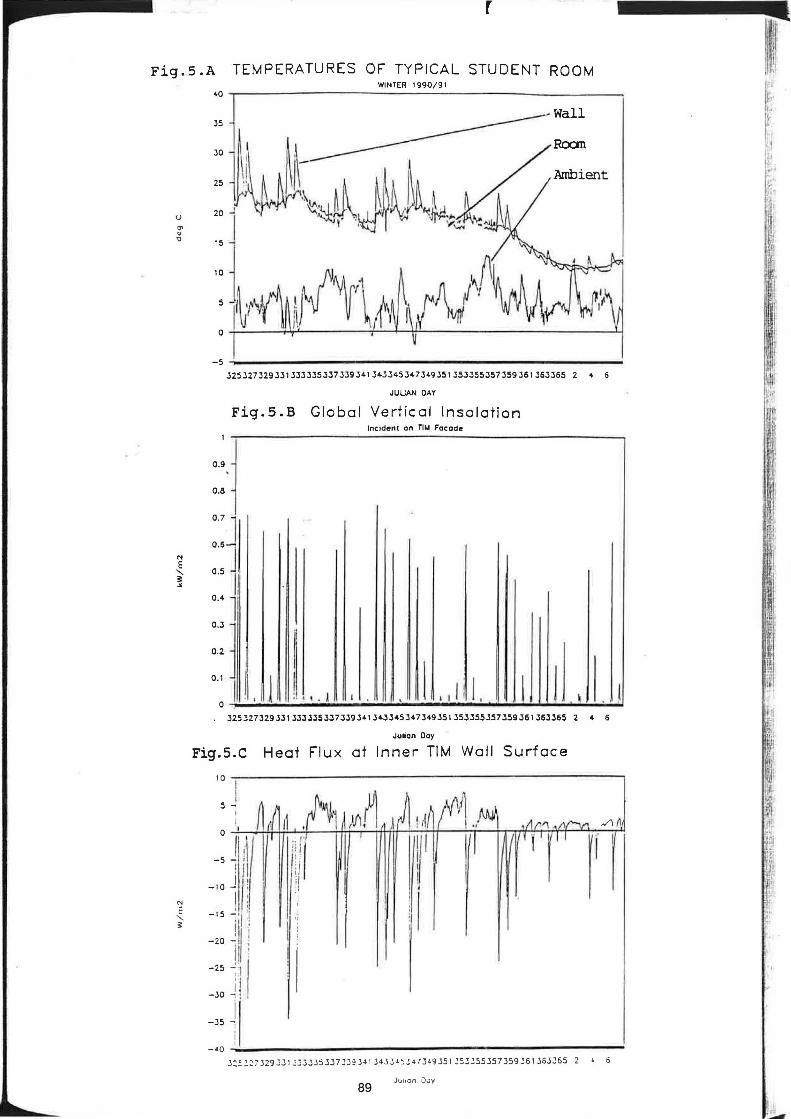
Figure 5 shows heat flux at the internal Croom)h~rface of the TIM wall over ' a pe~ of days d.lring which the room wu both occupied and unoccupied. It caii' be seen that for some periods ~e wall provides a net gain Cnegattva value> to the . room, at others there is heat Loss. Room and anE>ient •h~ end TIM wall teq>eratures are shown along with incident global vertical insolat'ion. " , -
Effective u-yalye ··: \. ·~
Traditional wall constructions are characterised by a single constant U·valua. Heat loss is driven by two primary tuncttons, the temperature difference across the wall and the wind velocity at the external surface. The heat flux through a TIM wall, however, is a co"1)lex function that also depends upon the solar flux at the absorber wall surface and non·linear, dynamic t~rature gradients within the structure. As a result, auvalue determined by an equation such as {1} is time dependent. One value of U, which we call the effective uvalue, Ueff, is a measure of the net heat transfer and ii most meaningful when taken over a long period:
{1}
Ueff is a useful indicator of Long term net flux across the wall, a negative value indicating net gains to the interior. Table 1 shows a measured Ueff for the Strathclyde residences, calculated from readings taken over several months in the winter 90/91. It should be remembered that this value needs to be referenced against a conventional U value, CUref = UK building regulations) to get a measure of the net benefit. IJhi lst Ueff is useful as a long term indicator of net heat flow it tells us little about the mechanisms by which this is acheived.
86
:;_.

r
Wall Performance Characterisation - Two Methods
[Al The performance of the TIM wall can be understood with reference to a simple heat balance model for the room as a node:
{2}
If we plot (qi-qs>l<Tr-Ta> vs Gvl<Tr-Ta>• and then draw a best fit line, Fig 6, the negative slope is the efficiency with which the solar energy is delivered to the interior, e, and the intercept ~als the dark Uvalue, UL. It is not possible, in the occupied building, to discount the effects of the mass storage element,
as is possible in controlled test procedures. Results from Fig 6 indicate a dark U-value,UL = 0.68 (+/_ 0.05)
Wm-2K-1 and a collection efficiency e= 29%C+/_ 3%).
CBl Measurements of heat f Lux at the absorber surface can take the form of the Hottel-Whil lier equation for solar collection, allowing us to characterise the wall elements between the ambient and the absorber:
{3}
A plot of qabs/dT vs Gv/dT, see Fig 7, has the U-value of the absorber-TIM-cover glass as the intercept and the effective transmittance-absorptance product as the negative slope. From data for the facade with no roller blind present we find UTIM = 1-16 c+/_ 0.05)_ Wm-2K-1 and ( /O)e = 0.56 c+/_ 0.05).
Eqn {1}
Eqn {2}
Eqn {3}
General:
UL = 0.68 +· 0.05 W/m-2K-1
e = 2.9-X +- 3~
UTIM = 1.16 +· 0.05 IJ/m-2K· 1
C /o>e = 0.56 +- 0.05 W/m-2K-1
TABLE 1: SUMMARY OF RESULTS FROM THE EQUATIONS
Factors Affecting Performance
The behaviour of the wall is modified by a number of factors that are hard to measure or model mathematically. From the room layout (Fig 3) we can see, for example, that there are shelves on the TIM wall, which will affect heat transfer between the wall and the room. The varied use of shelves by each resident adds further complication by making the effect unpredictable. T~re has been some degradation of the TIM, in the form of black staining has taken place within the TIM honeycomb. This leads to a reduction in solar transmission" Experiments are underway to measure this effect and to establish the cause. This is of particular interest for the next generation of TIM walling which may need to be in the form of factory assembled modular units to avoid degradation.
OVERALL BUILDING ENERGY CONSUMPTION
The overall conventional energy consumption of the buildings hes been metered, on a weekly basis, for one year. Figure 8 shows the total consumption per ·capita, per IJIQnth from March 1990 to 1991. The annual total has been compared with data from another new residence at Strathclyde and a traditional one in Edinburgh, see Table 2. This shows that the solar residences have the lowest per capita consumption. The Normalised Performance Indicator CNPl), a standard measure of building- pi;!rformance, which is ·adjusted,primarily to the floor area of the building, shows that the new conventional hells at Strathclyde consume less energy per square metre.
GAS/kWh ELECTRICITY /kWh TDTAUKwh NPI /(kWh/m2)
SOLAR RESIDENCES 2530 1877 4406 311 (GLASGOW)
GARNET HALLS 4210 1028 5239 277 (GLASGOW)
POLLO CK HALLS 8009 1355 9364 467 (EDINBURGH)
TABLE 2: ANNUAL ENERGY CONSUMPTION COMPARISON
These figure are not an indication of comparitive heating costs as they contain both service and space heating demand. Note that in the "solar residences", gas provides domestic hot water (DHW) only and back-up heating is provided by electricity. In Garnet and Pollock Halls, gas provides space heating and DHW, with no electric heating. These results, of course, give no indication of the levels of service or comfort provided, or of the temperatures attained. _We expect to conduct surveys to establish such factors
87
c 11. 11 ·I I , •·\ '
~- ·'· ':
..
i
l-d I ll
r •
1 •
f
~ I
I
L

NOMENCLATURE
c ..
' I,
,,~
REFERENCES
'-'~ff ,, ~L
.J.,,,
=~::>~.~ 1_1~.:~ 'r.Tie aY'P.ic!':~- 'Nm.-2r-i
:·~~ 1ro~.3r 1 ~~ss .:.Git1r'°ii:16nt. 'Nm-2~.- 1
~~rvnt ·~~0t!1'l~~t')1t'ifll!""'."''~
A/~I l!~n~r.y I ;-n-'~
f~~I Fr.'"'fi!t"'t ~ J r~P.tl ,J w ~,,f'1 '.ShJart CS • ''Transoarenr '""!Ulatlor1 - i=-'t"t!tHT11nary t='llo!'SUrts '?'r.rn .._..,....rirtnnN1 ~ ~'5~,...,, ~f)1at' 5h.1aerit P~'fl~r.ll!!'S :u '3~ ...... ~ · Nonn~un \.j() C:.:;rd£1r>ince I il%
Fig.l
On• of th• H•avily Konitor•d Rooar
Fig.2 Floor Plan of on• ot tour Building• (•acll buildinq Ila• Uv• atorey•I l Fig . 4 cxa •=11• 'lltUDI "" ......
Tr•n•p•r•nt ln•ul•Uon ICat•rh!
Polvc•rbonata lh••t.
• " uo l 10 uo
H1qh D•neltr Concr•t..
Hlqh Deneit7 Ph•C•r
ft
South
I
88 Fiq.3 flao~ Plan ot Rooa l and Ad1oining Room11
I
I
r
Fig. 5 .A TEMPERATURES OF TYPICAL STUDENT ROOM WINTER 1990/91
- Wall 35
30
"i ,: i~·,~r~i\tl~'\ 0
325327J29JJ13333353J7JJ9J41343J45347349J51353J55J57J59J61J6JJ65 2 4 6
JULIAN OAY
Fig.S.B Global Vertical lnsolation Incident on TIM Facade
J25J27329J31333335337339341J43345347349JSIJ53J55357359J61363365 2 4 6
Julian Day
Fig.5.C Heat Flux at Inner TIM Wall Surface
-----,,1
ii
I~ ~
, I
I I·
~ ·
" I
ill I . '
"
-•o~------------------------------------------' J:o327329JJ13JJJJSJJ73J~J~1J4JJ45J47349JSIJSJ355J57359J61J6JJ65 2 " 6
89 Ju11an Dav
·.!...

Fig. 6 TIM WALL PERFORMANCE CHARACTERISATION
" N
E
' 3:
0 ... ... ...
::::: 0 " :l I
s
0 ... I ..
0 0 ...
' .. 0 0 O'
2 ·a.. 0 u ... G Q.
.c I
"
57 days, doi ly overage•. (store) 1.6 .,.---------------------- - ---- - ---..
1.4 0
1.2 0
0
0 a 0 .6
~ 0.6
0.4
0 .2
0
-0.2
-0.4
-0.6
-0.6
-1
-1 .2
-1 .4
-1.6
-1.8
0
Fig.7
2 T
0 -1
-2 -J -4
-5 - 6_
-7
-a -9
-10 -11 -12
-1J -14
-15
-16 -17
-18 -19
-20
-5
Fig.8 260
260
240
220
200
180
160
140
120
100
80
60
•0
20
0
MAR
a
a
a
2
a
4
a 00 a
Cv/(Tr - To) W/m2K
a a a
6
TIM-ABSORBER CHARACTERISATION
5
(JO days data, hall hourly averages)
15
Gv/(Tobs - To)
25
Electricity' and Gas Consumption I.larch 1990 to 1991
a
8
a
35
APR MAY JUN JUL AUG SEP OC T NOV DE C JAN FEB MAR
IZ2J Cos Month
(SSJ Elect ri city
90
I 1 l