transportation & logistics - harriswilliams.com to ernst & young’s (ey) ......
TRANSCRIPT
www.harriswilliams.com
Investment banking services are provided by Harris Williams LLC, a registered broker-dealer and member of FINRA and SIPC, and Harris Williams & Co. Ltd, which is authorised andregulated by the Financial Conduct Authority. Harris Williams & Co. is a trade name under which Harris Williams LLC and Harris Williams & Co. Ltd conduct business.
TRANSPORTATION & LOGISTICSAUTOMOTIVE AFTERMARKET SECTOR UPDATE │ AUGUST 2015

PAGE |
www.harriswilliams.com
TRANSPORTATION & LOGISTICSAUTOMOTIVE AFTERMARKET SECTOR UPDATE │ AUGUST 2015
AUTONATION TO ACQUIRE DEALER GROUPS
The nation’s largest auto dealership chain purchased two smaller dealer groups onAugust 18th, adding to a string of acquisitions among car retailers as U.S. light-vehicle sales head toward their highest levels in more than a decade. AutoNationInc. agreed to acquire Carl Gregory Enterprises and Valley Motors Auto Group indeals that represent more than $600 million in annual revenue, the company said.The acquisitions further a torrid pace of similar deals among car dealers as autosales take off amid low interest rates and cheaper gasoline.Wall Street Journal
SAFETY TECHNOLOGIES CONTRIBUTE TO INCREASED VEHICLE APPEAL
The safety-related technologies that manufacturers are increasingly equippingtheir new vehicles with are making those vehicles more appealing to vehicleowners, according to the J.D. Power 2015 U.S. Automotive Performance, Executionand Layout (APEAL) Study. The study finds that some safety features cancontribute to a significant boost in APEAL scores. For example, the overall scoreamong owners of vehicles with blind-spot monitoring and warning systems is 38points higher than among those without them.J.D. Power
WHAT WE’RE READING
AUTOMOTIVE SECTOR M&A APPETITE REACHES ALL-TIME HIGH
Growing confidence in the global economy and a relentless push for innovationwill further support M&A in the automotive sector over the next 12 months,according to Ernst & Young’s (EY) Automotive Global Capital ConfidenceBarometer. The biannual survey gauges the corporate confidence and acquisitionintentions of global executives and reveals that automotive companies’ appetitefor M&A is at an all-time high, with 70% of executives expecting to pursueacquisitions in the next 12 months – the highest percentage since the surveybegan in 2009.Ernst & Young
AVERAGE AGE OF LIGHT VEHICLES IN THE U.S. RISES SLIGHTLY IN 2015
Registrations for light vehicles in operation (VIO) in the U.S. reached a record levelof 257.9 million. That’s an increase of more than 5.3 million (2.1%) since last yearand the highest annual increase the auto industry has seen in the U.S. since IHSbegan tracking VIO growth. New vehicle registrations also outpaced scrappageby more than 42% – the highest rate seen since the statistic has been tracked.Aftermarket News
For the automotive industry, TTIP (Transatlantic Trade and Investment Partnership)represents an opportunity to remove regulatory barriers, while maintaining highsafety and environmental standards. A recent study by the Peterson Institute forInternational Economics concluded that the elimination of regulatory barrierscould increase automotive trade by 20% or more, resulting in transatlantic incomegains of more than $20 billion.Aftermarket News
1
CONTENTS M&A TRANSACTIONS PUBLIC MARKETS OVERVIEW STOCK PRICE PERFORMANCE OUR GROUP
CONTACTS
UNITED STATES
Frank MountcastleManaging [email protected]+1 (804) 915-0124
Jason BassManaging [email protected]+1 (804) 915-0132
Joe ConnerManaging Director [email protected]+1 (804) 915-0151
Jershon JonesDirector [email protected]+1 (804) 932-1356
Jeff BurkettDirector [email protected] +1 (804) 932-1334
Jeff KiddVice President [email protected] +1 (804) 915-0178
EUROPE
Jeffery PerkinsManaging Director [email protected]+49 (0) 69 3650638 00
TTIP HAS POTENTIAL TO BOOST AUTO TRADE BY 20% OR MORE

PAGE |
Date Target Business Description Acquirer
8/18/2015 Carl Gregory Enterprises Owns and operates auto dealerships that offer new and used vehicles in Alabama and Tennessee.
AutoNation, Inc.
8/18/2015 Valley Motors, Inc. Owns and operates auto dealerships that offer new and used vehicles in Maryland.
AutoNation, Inc.
8/17/2015 Affinia Group Holdings Inc. Designs, manufactures, markets, and distributes a range of aftermarket products.
Mann + Hummel Holding GmbH
8/10/2015 Stackpole International Inc. Manufactures powertrain systems and components for automotive original equipment manufacturers.
Johnson Electric Holdings Ltd.
8/5/2015 Somerset Tire Serv ice, Inc. Sells tires for cars, trucks, cross-utility vehicles, or sports utility vehicles and offers automotive maintenance and repair serv ices.
Mavis Tire Supply Corporation
8/3/2015 Bestop Inc. Manufactures and supplies jeep and truck tops and accessories. Kinderhook Industries
8/3/2015 Painters Supply Co., Inc. Distributes automotive paint. Finishmaster Inc.
8/3/2015 EiKO Global, LLC, Automotive Lighting Business
Manufactures automotive lighting components. Old World Industries, LLC
7/17/2015 Covs Parts Pty Ltd Distributes auto parts, tools, equipment, and consumables to automotive, mining, truck and trailer and industrials in western Australia.
GPC Asia Pacific Group Pty Ltd.
7/16/2015 Getrag Getriebe Manufactures transmission systems for passenger cars and light commercial vehicles in Germany and internationally.
Magna International Inc.
7/13/2015 Remy International, Inc. Designs, manufactures, remanufactures, markets and distributes rotating electrical components for automobiles, light trucks and heavy duty trucks.
BorgWarner Inc.
7/13/2015 Identifix, Inc. Operates an auto repair hotline which prov ides technical assistance to shop owners and technicians seeking additional expertise.
Claims Serv ices Group, Inc.
7/9/2015 Coast Distribution System Inc. Supplies replacement parts for RVs to retail parts and supply stores, repair establishment, and dealers.
Keystone Automotive Operations, Inc.
7/8/2015 Power Train Company Remanufactures and distributes heavy duty truck parts. TruckPro, LLC
7/8/2015 PartsChannel Inc. Distributes aftermarket replacement parts for the collision repair industry in the United States.
LKQ Corp.
6/26/2015 Kadel's Auto Body, LLC Provides auto body repair serv ices across the United States. ABRA Auto Body & Glass LP
6/15/2015 Holding & Barnes Plc Prov ides online salvage auction serv ices to buy accident damaged, theft-recovered, and used vehicles in the United Kingdom.
ADESA (UK) Limited
6/11/2015 IVC Industrial Coatings, Inc. Manufactures and distributes powder, liquid, and specialty coating products for commercial and consumer applications.
PPG Industries, Inc.
M&A TRANSACTIONS
2
RECENT M&A TRANSACTIONS1,2
TRANSPORTATION & LOGISTICSAUTOMOTIVE AFTERMARKET SECTOR UPDATE │ AUGUST 2015

PAGE |
PUBLIC MARKETS OVERVIEW
3
TRANSPORTATION & LOGISTICS
TEV / LTM EBITDA TEV / 2015E EBITDA
AVERAGE REVENUE GROWTH (2011 – 2014) AVERAGE REVENUE GROWTH (2014 – 2016P)
AVERAGE EBITDA GROWTH (2011 – 2014) AVERAGE EBITDA GROWTH (2014 – 2016P)
AUTOMOTIVE AFTERMARKET SECTOR UPDATE │ AUGUST 2015
6.8x
10.2x
11.9x
12.6x
Suppliers
Vehicle Manufacturers
Distributors and Retailers
Dealerships and ServicesProviders
7.1x
9.9x
11.6x
12.1x
Suppliers
Vehicle Manufacturers
Distributors and Retailers
Dealerships and ServicesProviders
2.8%
3.7%
7.6%
14.2%
Vehicle Manufacturers
Suppliers
Distributors and Retailers
Dealerships and ServicesProviders
0.1%
1.4%
3.0%
10.7%
Distributors and Retailers
Vehicle Manufacturers
Suppliers
Dealerships and ServicesProviders
4.4%
7.5%
9.3%
13.5%
Distributors and Retailers
Suppliers
Vehicle Manufacturers
Dealerships and ServicesProviders
4.4%
5.6%
7.1%
10.9%
Suppliers
Vehicle Manufacturers
Distributors and Retailers
Dealerships and ServicesProviders
PAGE |
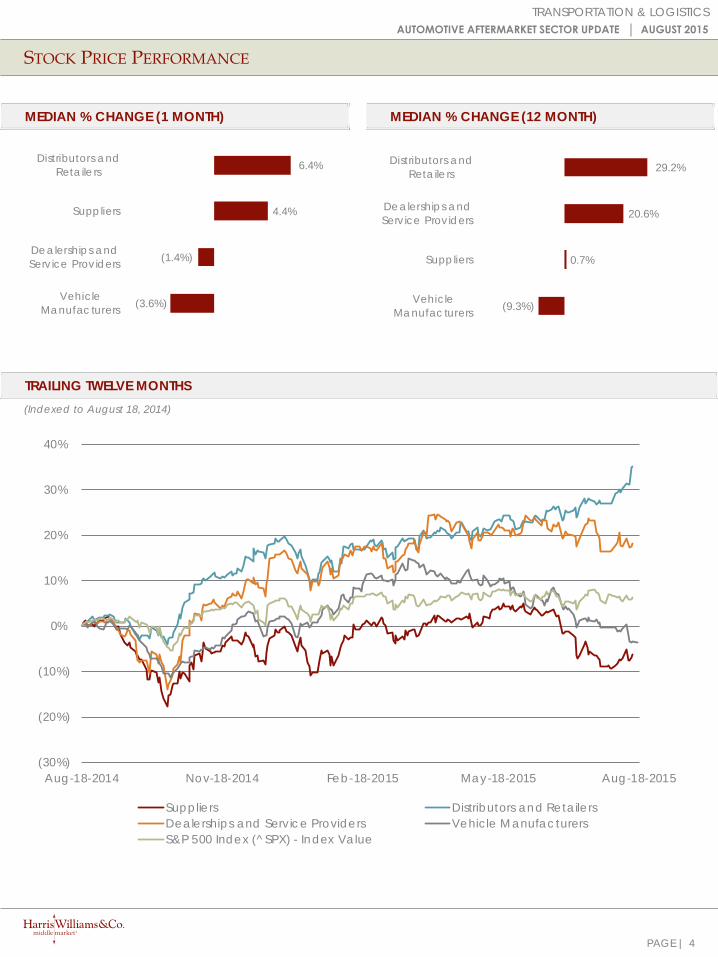
STOCK PRICE PERFORMANCE
4
TRANSPORTATION & LOGISTICS
(Indexed to August 18, 2014)
TRAILING TWELVE MONTHS
MEDIAN % CHANGE (1 MONTH) MEDIAN % CHANGE (12 MONTH)
AUTOMOTIVE AFTERMARKET SECTOR UPDATE │ AUGUST 2015
(3.6%)
(1.4%)
4.4%
6.4%
VehicleManufacturers
Dealerships andService Providers
Suppliers
Distributors andRetailers
(9.3%)
0.7%
20.6%
29.2%
VehicleManufacturers
Suppliers
Dealerships andService Providers
Distributors andRetailers
(30%)
(20%)
(10%)
0%
10%
20%
30%
40%
Aug-18-2014 Nov-18-2014 Feb-18-2015 May-18-2015 Aug-18-2015
Suppliers Distributors and RetailersDealerships and Service Providers Vehicle ManufacturersS&P 500 Index (^SPX) - Index Value
PAGE |
has been acquired by
a portfolio company ofa portfolio company of
has been acquired byhas been acquired by
a portfolio company of
has been acquired by
a portfolio company of
and
in partnership with
and
RCL Services Group
has sold
to
has been acquired by
a portfolio company of
has been acquired by
a portfolio company of
has been acquired by
a portfolio company of
has been acquired by
a portfolio company of
a portfolio company of
has been acquired by
a portfolio company of
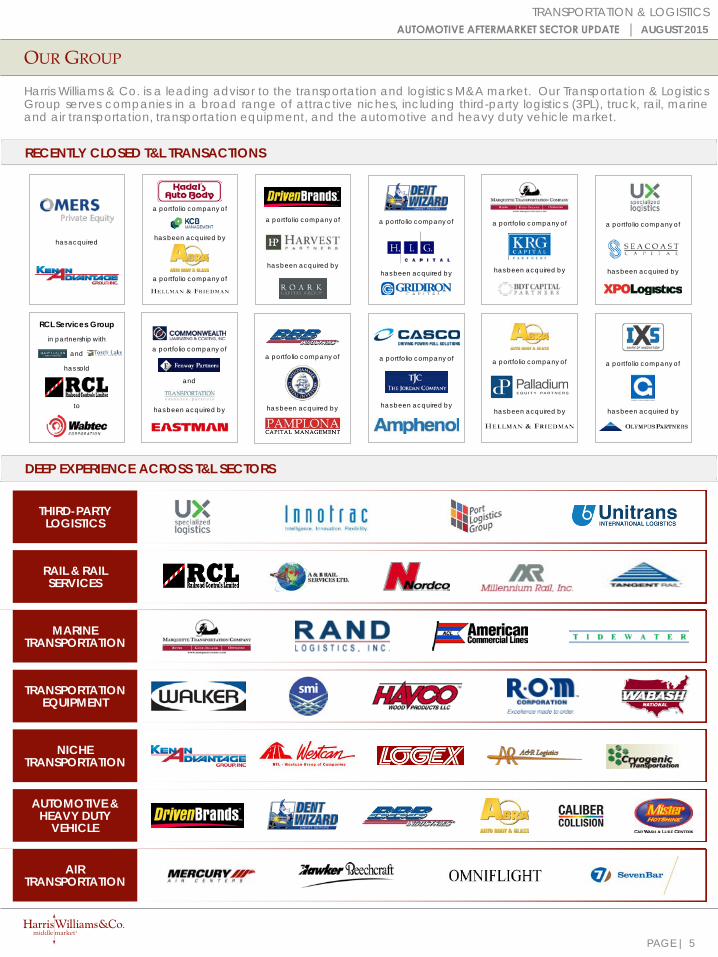
OUR GROUP
Harris Williams & Co. is a leading advisor to the transportation and logistics M&A market. Our Transportation & LogisticsGroup serves companies in a broad range of attractive niches, including third-party logistics (3PL), truck, rail, marineand air transportation, transportation equipment, and the automotive and heavy duty vehicle market.
TRANSPORTATION & LOGISTICS
RECENTLY CLOSED T&L TRANSACTIONS
DEEP EXPERIENCE ACROSS T&L SECTORS
MARINE TRANSPORTATION
NICHE TRANSPORTATION
TRANSPORTATION EQUIPMENT
RAIL & RAIL SERVICES
AUTOMOTIVE & HEAVY DUTY
VEHICLE
THIRD-PARTY LOGISTICS
AIR TRANSPORTATION
5
has been acquired by
a portfolio company of
has acquired
AUTOMOTIVE AFTERMARKET SECTOR UPDATE │ AUGUST 2015

Energy, Power & Infrastructure
IndustrialsHealthcare & Life Sciences
Transportation & Logistics
Aerospace, Defense & Government
Services
Business Services
Building Products & Materials
Technology, Media & Telecom
Specialty Distribution
Consumer
PAGE |
HARRIS WILLIAMS & CO. OFFICE LOCATIONS
UNITED STATES EUROPE
BostonTwo International Place24th FloorBoston, Massachusetts 02110Phone: +1 (617) 482-7501Fax: +1 (617) 482-7503
Cleveland1900 East 9th Street20th FloorCleveland, Ohio 44114Phone: +1 (216) 689-2400Fax: +1 (216) 689-2401
Minneapolis222 South 9th StreetSuite 3350Minneapolis, Minnesota 55402Phone: +1 (612) 359-2700Fax: +1 (612) 359-2701
Richmond (Headquarters) 1001 Haxall Point9th FloorRichmond, Virginia 23219 Phone: +1 (804) 648-0072Fax: +1 (804) 648-0073
San Francisco575 Market Street31st FloorSan Francisco, California 94105, USAPhone: +1 (415) 288-4260Fax: +1 (415) 288-4269
FrankfurtBockenheimer Landstrasse 33-3560325 FrankfurtGermanyPhone: +49 069 3650638 00Fax: +49 069 3650638 01
London63 Brook StreetLondon W1K 4HS, EnglandPhone: +44 (0) 20 7518 8900Fax: +44 (0) 20 7526 2187
NETWORK OFFICES
BeijingHong KongMumbai
New DelhiShanghai
Transportation & Logistics
Harris Williams & Co. has a broad range of industry expertise, which creates powerful opportunities.Our clients benefit from our deep-sector experience, integrated industry intelligence andcollaboration across the firm, and our commitment to learning what makes them unique. For moreinformation, visit our website at www.harriswilliams.com/industries.
OUR FIRM
6
AUTOMOTIVE AFTERMARKET SECTOR UPDATE │ AUGUST 2015TRANSPORTATION & LOGISTICS
PAGE |
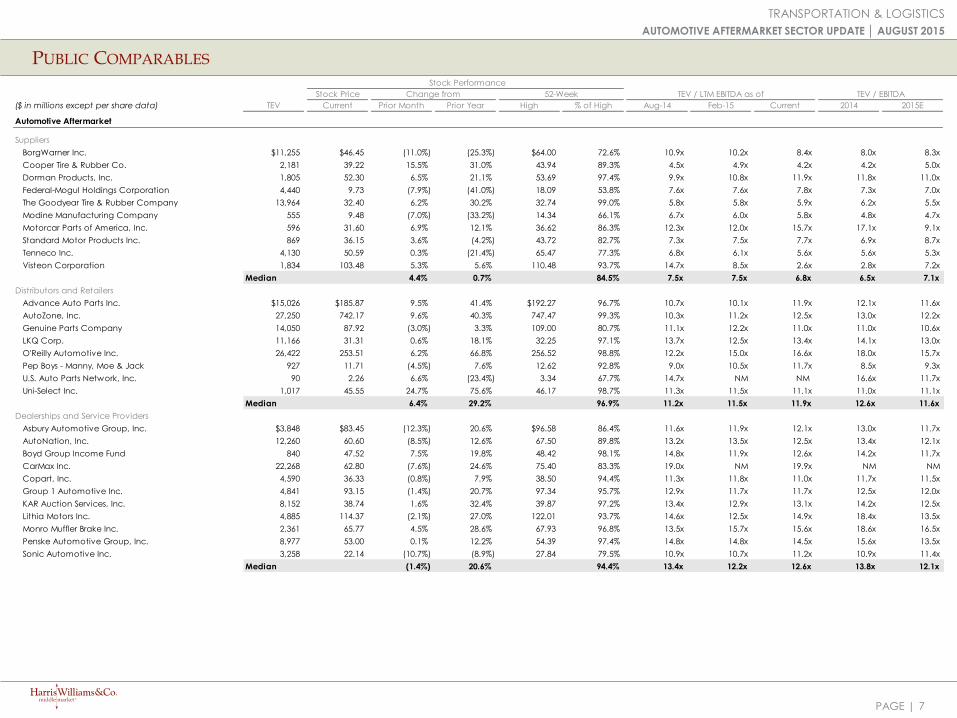
PUBLIC COMPARABLES
7
TRANSPORTATION & LOGISTICS
AUTOMOTIVE AFTERMARKET SECTOR UPDATE │ AUGUST 2015
Stock Performance
Stock Price Change from 52-Week TEV / EBITDA EBITDA
($ in millions except per share data) TEV Current Prior Month Prior Year High % of High Aug-14 Feb-15 Current 2014 2015E
Automotive Aftermarket
TEV / LTM EBITDA as of
Suppliers
BorgWarner Inc. $11,255 $46.45 (11.0%) (25.3%) $64.00 72.6% 10.9x 10.2x 8.4x 8.0x 8.3x
Cooper Tire & Rubber Co. 2,181 39.22 15.5% 31.0% 43.94 89.3% 4.5x 4.9x 4.2x 4.2x 5.0x
Dorman Products, Inc. 1,805 52.30 6.5% 21.1% 53.69 97.4% 9.9x 10.8x 11.9x 11.8x 11.0x
Federal-Mogul Holdings Corporation 4,440 9.73 (7.9%) (41.0%) 18.09 53.8% 7.6x 7.6x 7.8x 7.3x 7.0x
The Goodyear Tire & Rubber Company 13,964 32.40 6.2% 30.2% 32.74 99.0% 5.8x 5.8x 5.9x 6.2x 5.5x
Modine Manufacturing Company 555 9.48 (7.0%) (33.2%) 14.34 66.1% 6.7x 6.0x 5.8x 4.8x 4.7x
Motorcar Parts of America, Inc. 596 31.60 6.9% 12.1% 36.62 86.3% 12.3x 12.0x 15.7x 17.1x 9.1x
Standard Motor Products Inc. 869 36.15 3.6% (4.2%) 43.72 82.7% 7.3x 7.5x 7.7x 6.9x 8.7x
Tenneco Inc. 4,130 50.59 0.3% (21.4%) 65.47 77.3% 6.8x 6.1x 5.6x 5.6x 5.3x
Visteon Corporation 1,834 103.48 5.3% 5.6% 110.48 93.7% 14.7x 8.5x 2.6x 2.8x 7.2x
Median 4.4% 0.7% 84.5% 7.5x 7.5x 6.8x 6.5x 7.1x
Distributors and Retailers
Advance Auto Parts Inc. $15,026 $185.87 9.5% 41.4% $192.27 96.7% 10.7x 10.1x 11.9x 12.1x 11.6x
AutoZone, Inc. 27,250 742.17 9.6% 40.3% 747.47 99.3% 10.3x 11.2x 12.5x 13.0x 12.2x
Genuine Parts Company 14,050 87.92 (3.0%) 3.3% 109.00 80.7% 11.1x 12.2x 11.0x 11.0x 10.6x
LKQ Corp. 11,166 31.31 0.6% 18.1% 32.25 97.1% 13.7x 12.5x 13.4x 14.1x 13.0x
O'Reilly Automotive Inc. 26,422 253.51 6.2% 66.8% 256.52 98.8% 12.2x 15.0x 16.6x 18.0x 15.7x
Pep Boys - Manny, Moe & Jack 927 11.71 (4.5%) 7.6% 12.62 92.8% 9.0x 10.5x 11.7x 8.5x 9.3x
U.S. Auto Parts Network, Inc. 90 2.26 6.6% (23.4%) 3.34 67.7% 14.7x NM NM 16.6x 11.7x
Uni-Select Inc. 1,017 45.55 24.7% 75.6% 46.17 98.7% 11.3x 11.5x 11.1x 11.0x 11.1x
Median 6.4% 29.2% 96.9% 11.2x 11.5x 11.9x 12.6x 11.6x
Dealerships and Service Providers
Asbury Automotive Group, Inc. $3,848 $83.45 (12.3%) 20.6% $96.58 86.4% 11.6x 11.9x 12.1x 13.0x 11.7x
AutoNation, Inc. 12,260 60.60 (8.5%) 12.6% 67.50 89.8% 13.2x 13.5x 12.5x 13.4x 12.1x
Boyd Group Income Fund 840 47.52 7.5% 19.8% 48.42 98.1% 14.8x 11.9x 12.6x 14.2x 11.7x
CarMax Inc. 22,268 62.80 (7.6%) 24.6% 75.40 83.3% 19.0x NM 19.9x NM NM
Copart, Inc. 4,590 36.33 (0.8%) 7.9% 38.50 94.4% 11.3x 11.8x 11.0x 11.7x 11.5x
Group 1 Automotive Inc. 4,841 93.15 (1.4%) 20.7% 97.34 95.7% 12.9x 11.7x 11.7x 12.5x 12.0x
KAR Auction Services, Inc. 8,152 38.74 1.6% 32.4% 39.87 97.2% 13.4x 12.9x 13.1x 14.2x 12.5x
Lithia Motors Inc. 4,885 114.37 (2.1%) 27.0% 122.01 93.7% 14.6x 12.5x 14.9x 18.4x 13.5x
Monro Muffler Brake Inc. 2,361 65.77 4.5% 28.6% 67.93 96.8% 13.5x 15.7x 15.6x 18.6x 16.5x
Penske Automotive Group, Inc. 8,977 53.00 0.1% 12.2% 54.39 97.4% 14.8x 14.8x 14.5x 15.6x 13.5x
Sonic Automotive Inc. 3,258 22.14 (10.7%) (8.9%) 27.84 79.5% 10.9x 10.7x 11.2x 10.9x 11.4x
Median (1.4%) 20.6% 94.4% 13.4x 12.2x 12.6x 13.8x 12.1x

PAGE |
PUBLIC COMPARABLES
8
TRANSPORTATION & LOGISTICS
AUTOMOTIVE AFTERMARKET SECTOR UPDATE │ AUGUST 2015
Stock Performance
Stock Price Change from 52-Week TEV / EBITDA EBITDA
($ in millions except per share data) TEV Current Prior Month Prior Year High % of High Aug-14 Feb-15 Current 2014 2015E
Automotive Aftermarket
TEV / LTM EBITDA as of
Vehicle Manufacturers
Bayerische Motoren Werke Aktiengesellschaft $148,616 $95.87 (7.8%) (17.7%) $137.42 69.8% 10.7x 10.5x 10.5x 10.2x 9.5x
Daimler AG 178,461 84.52 (7.8%) 5.7% 106.73 79.2% 10.9x 11.8x 10.6x 11.3x 8.5x
Ford Motor Co. 162,603 14.65 (0.3%) (15.4%) 17.87 82.0% 13.7x 14.5x 13.9x 14.5x 14.9x
General Motors Company 81,194 31.30 2.1% (7.5%) 39.00 80.3% 6.9x 9.1x 6.3x 8.9x 5.2x
Harley-Davidson, Inc. 17,508 59.28 7.9% (4.2%) 70.41 84.2% 12.1x 12.5x 12.7x 12.0x 11.6x
Navistar International Corporation 5,940 18.04 (2.7%) (50.0%) 40.17 44.9% NM 19.8x 16.5x NM 10.7x
Oshkosh Corporation 3,906 38.96 (4.5%) (18.7%) 55.69 69.9% 7.6x 7.5x 7.2x 6.3x 7.3x
PACCAR Inc. 27,701 62.71 (2.7%) 0.8% 71.15 88.1% 12.6x 12.0x 10.0x 11.3x 10.4x
Toyota Motor Corporation 329,678 63.83 (5.2%) 9.0% 70.68 90.3% 8.8x 10.4x 9.4x 9.6x 10.6x
Volkswagen AG 191,812 197.08 (9.2%) (11.1%) 291.56 67.6% 7.7x 8.2x 7.7x 7.7x 6.2x
Median (3.6%) (9.3%) 79.7% 10.7x 11.2x 10.2x 10.2x 9.9x
PAGE |
PUBLIC COMPARABLES
9
TRANSPORTATION & LOGISTICS
AUTOMOTIVE AFTERMARKET SECTOR UPDATE │ AUGUST 2015
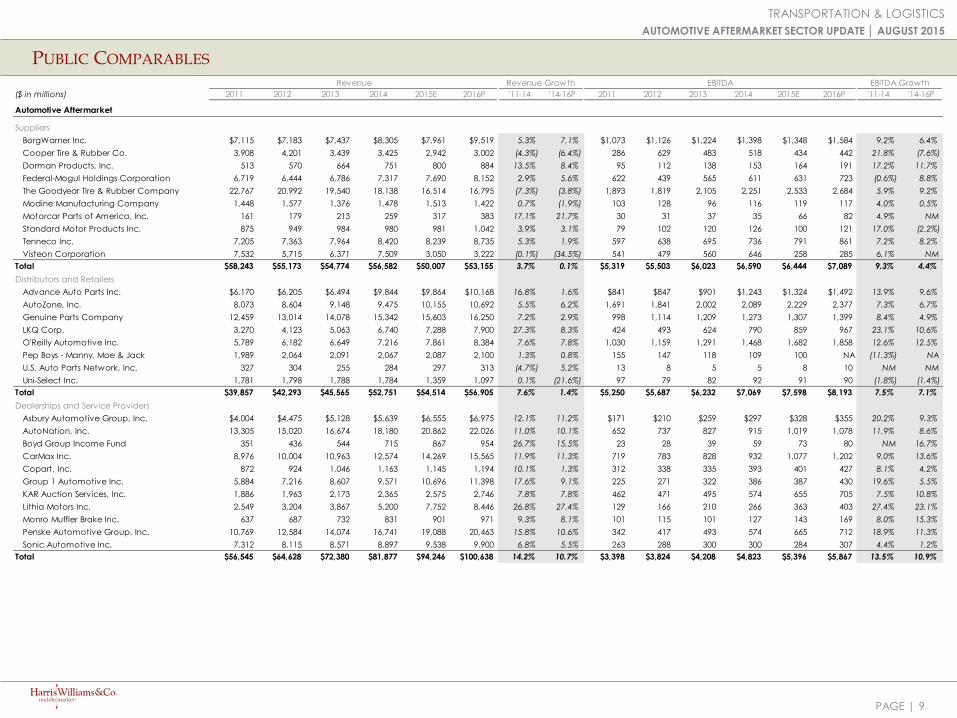
Revenue Revenue Growth EBITDA EBITDA Growth
($ in millions) 2011 2012 2013 2014 2015E 2016P '11-14 '14-16P 2011 2012 2013 2014 2015E 2016P '11-14 '14-16P
Automotive Aftermarket
Suppliers
BorgWarner Inc. $7,115 $7,183 $7,437 $8,305 $7,961 $9,519 5.3% 7.1% $1,073 $1,126 $1,224 $1,398 $1,348 $1,584 9.2% 6.4%
Cooper Tire & Rubber Co. 3,908 4,201 3,439 3,425 2,942 3,002 (4.3%) (6.4%) 286 629 483 518 434 442 21.8% (7.6%)
Dorman Products, Inc. 513 570 664 751 800 884 13.5% 8.4% 95 112 138 153 164 191 17.2% 11.7%
Federal-Mogul Holdings Corporation 6,719 6,444 6,786 7,317 7,690 8,152 2.9% 5.6% 622 439 565 611 631 723 (0.6%) 8.8%
The Goodyear Tire & Rubber Company 22,767 20,992 19,540 18,138 16,514 16,795 (7.3%) (3.8%) 1,893 1,819 2,105 2,251 2,533 2,684 5.9% 9.2%
Modine Manufacturing Company 1,448 1,577 1,376 1,478 1,513 1,422 0.7% (1.9%) 103 128 96 116 119 117 4.0% 0.5%
Motorcar Parts of America, Inc. 161 179 213 259 317 383 17.1% 21.7% 30 31 37 35 66 82 4.9% NM
Standard Motor Products Inc. 875 949 984 980 981 1,042 3.9% 3.1% 79 102 120 126 100 121 17.0% (2.2%)
Tenneco Inc. 7,205 7,363 7,964 8,420 8,239 8,735 5.3% 1.9% 597 638 695 736 791 861 7.2% 8.2%
Visteon Corporation 7,532 5,715 6,371 7,509 3,050 3,222 (0.1%) (34.5%) 541 479 560 646 258 285 6.1% NM
Total $58,243 $55,173 $54,774 $56,582 $50,007 $53,155 3.7% 0.1% $5,319 $5,503 $6,023 $6,590 $6,444 $7,089 9.3% 4.4%
Distributors and Retailers
Advance Auto Parts Inc. $6,170 $6,205 $6,494 $9,844 $9,864 $10,168 16.8% 1.6% $841 $847 $901 $1,243 $1,324 $1,492 13.9% 9.6%
AutoZone, Inc. 8,073 8,604 9,148 9,475 10,155 10,692 5.5% 6.2% 1,691 1,841 2,002 2,089 2,229 2,377 7.3% 6.7%
Genuine Parts Company 12,459 13,014 14,078 15,342 15,603 16,250 7.2% 2.9% 998 1,114 1,209 1,273 1,307 1,399 8.4% 4.9%
LKQ Corp. 3,270 4,123 5,063 6,740 7,288 7,900 27.3% 8.3% 424 493 624 790 859 967 23.1% 10.6%
O'Reilly Automotive Inc. 5,789 6,182 6,649 7,216 7,861 8,384 7.6% 7.8% 1,030 1,159 1,291 1,468 1,682 1,858 12.6% 12.5%
Pep Boys - Manny, Moe & Jack 1,989 2,064 2,091 2,067 2,087 2,100 1.3% 0.8% 155 147 118 109 100 NA (11.3%) NA
U.S. Auto Parts Network, Inc. 327 304 255 284 297 313 (4.7%) 5.2% 13 8 5 5 8 10 NM NM
Uni-Select Inc. 1,781 1,798 1,788 1,784 1,359 1,097 0.1% (21.6%) 97 79 82 92 91 90 (1.8%) (1.4%)
Total $39,857 $42,293 $45,565 $52,751 $54,514 $56,905 7.6% 1.4% $5,250 $5,687 $6,232 $7,069 $7,598 $8,193 7.5% 7.1%
Dealerships and Service Providers
Asbury Automotive Group, Inc. $4,004 $4,475 $5,128 $5,639 $6,555 $6,975 12.1% 11.2% $171 $210 $259 $297 $328 $355 20.2% 9.3%
AutoNation, Inc. 13,305 15,020 16,674 18,180 20,862 22,026 11.0% 10.1% 652 737 827 915 1,019 1,078 11.9% 8.6%
Boyd Group Income Fund 351 436 544 715 867 954 26.7% 15.5% 23 28 39 59 73 80 NM 16.7%
CarMax Inc. 8,976 10,004 10,963 12,574 14,269 15,565 11.9% 11.3% 719 783 828 932 1,077 1,202 9.0% 13.6%
Copart, Inc. 872 924 1,046 1,163 1,145 1,194 10.1% 1.3% 312 338 335 393 401 427 8.1% 4.2%
Group 1 Automotive Inc. 5,884 7,216 8,607 9,571 10,696 11,398 17.6% 9.1% 225 271 322 386 387 430 19.6% 5.5%
KAR Auction Services, Inc. 1,886 1,963 2,173 2,365 2,575 2,746 7.8% 7.8% 462 471 495 574 655 705 7.5% 10.8%
Lithia Motors Inc. 2,549 3,204 3,867 5,200 7,752 8,446 26.8% 27.4% 129 166 210 266 363 403 27.4% 23.1%
Monro Muffler Brake Inc. 637 687 732 831 901 971 9.3% 8.1% 101 115 101 127 143 169 8.0% 15.3%
Penske Automotive Group, Inc. 10,769 12,584 14,074 16,741 19,088 20,463 15.8% 10.6% 342 417 493 574 665 712 18.9% 11.3%
Sonic Automotive Inc. 7,312 8,115 8,571 8,897 9,538 9,900 6.8% 5.5% 263 288 300 300 284 307 4.4% 1.2%
Total $56,545 $64,628 $72,380 $81,877 $94,246 $100,638 14.2% 10.7% $3,398 $3,824 $4,208 $4,823 $5,396 $5,867 13.5% 10.9%
PAGE |
PUBLIC COMPARABLES
10
TRANSPORTATION & LOGISTICS
AUTOMOTIVE AFTERMARKET SECTOR UPDATE │ AUGUST 2015
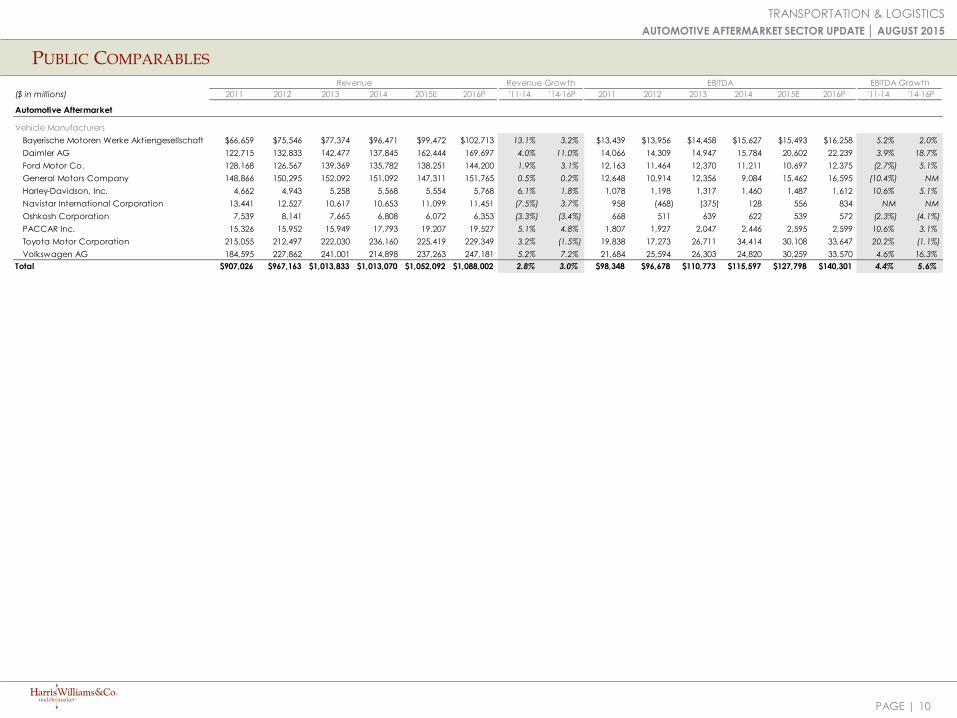
Revenue Revenue Growth EBITDA EBITDA Growth
($ in millions) 2011 2012 2013 2014 2015E 2016P '11-14 '14-16P 2011 2012 2013 2014 2015E 2016P '11-14 '14-16P
Automotive Aftermarket
Vehicle Manufacturers
Bayerische Motoren Werke Aktiengesellschaft $66,659 $75,546 $77,374 $96,471 $99,472 $102,713 13.1% 3.2% $13,439 $13,956 $14,458 $15,627 $15,493 $16,258 5.2% 2.0%
Daimler AG 122,715 132,833 142,477 137,845 162,444 169,697 4.0% 11.0% 14,066 14,309 14,947 15,784 20,602 22,239 3.9% 18.7%
Ford Motor Co. 128,168 126,567 139,369 135,782 138,251 144,200 1.9% 3.1% 12,163 11,464 12,370 11,211 10,697 12,375 (2.7%) 5.1%
General Motors Company 148,866 150,295 152,092 151,092 147,311 151,765 0.5% 0.2% 12,648 10,914 12,356 9,084 15,462 16,595 (10.4%) NM
Harley-Davidson, Inc. 4,662 4,943 5,258 5,568 5,554 5,768 6.1% 1.8% 1,078 1,198 1,317 1,460 1,487 1,612 10.6% 5.1%
Navistar International Corporation 13,441 12,527 10,617 10,653 11,099 11,451 (7.5%) 3.7% 958 (468) (375) 128 556 834 NM NM
Oshkosh Corporation 7,539 8,141 7,665 6,808 6,072 6,353 (3.3%) (3.4%) 668 511 639 622 539 572 (2.3%) (4.1%)
PACCAR Inc. 15,326 15,952 15,949 17,793 19,207 19,527 5.1% 4.8% 1,807 1,927 2,047 2,446 2,595 2,599 10.6% 3.1%
Toyota Motor Corporation 215,055 212,497 222,030 236,160 225,419 229,349 3.2% (1.5%) 19,838 17,273 26,711 34,414 30,108 33,647 20.2% (1.1%)
Volkswagen AG 184,595 227,862 241,001 214,898 237,263 247,181 5.2% 7.2% 21,684 25,594 26,303 24,820 30,259 33,570 4.6% 16.3%
Total $907,026 $967,163 $1,013,833 $1,013,070 $1,052,092 $1,088,002 2.8% 3.0% $98,348 $96,678 $110,773 $115,597 $127,798 $140,301 4.4% 5.6%
PAGE |
TRANSPORTATION & LOGISTICS
SOURCES
TRANSPORTATION & LOGISTICS
1. Capital IQ.
2. MergerMarket.
Harris Williams & Co. (www.harriswilliams.com) is a preeminent middle market investment bank focused on the advisory needs of clients worldwide. The firm has deep industry knowledge, global transaction expertise, and an unwavering commitment to excellence. Harris Williams & Co. provides sell-side and acquisition advisory, restructuring advisory, board advisory, private placements, and capital markets advisory services.
Investment banking services are provided by Harris Williams LLC, a registered broker-dealer and member of FINRA and SIPC, and Harris Williams & Co. Ltd, which is authorised and regulated by the Financial Conduct Authority. Harris Williams & Co. is a trade name under which Harris Williams LLC and Harris Williams & Co. Ltd conduct business.
THIS REPORT August CONTAIN REFERENCES TO REGISTERED TRADEMARKS, SERVICE MARKS AND COPYRIGHTS OWNED BY THIRD-PARTY INFORMATION PROVIDERS. NONE OF THE THIRD-PARTY INFORMATION PROVIDERS IS ENDORSING THE OFFERING OF, AND SHALL NOT IN ANY WAY BE DEEMED AN ISSUER OR UNDERWRITER OF, THE SECURITIES, FINANCIAL INSTRUMENTS OR OTHER INVESTMENTS DISCUSSED IN THIS REPORT, AND SHALL NOT HAVE ANY LIABILITY OR RESPONSIBILITY FOR ANY STATEMENTS MADE IN THE REPORT OR FOR ANY FINANCIAL STATEMENTS, FINANCIAL PROJECTIONS OR OTHER FINANCIAL INFORMATION CONTAINED OR ATTACHED AS AN EXHIBIT TO THE REPORT. FOR MORE INFORMATION ABOUT THE MATERIALS PROVIDED BY SUCH THIRD PARTIES, PLEASE CONTACT US AT THE ABOVE ADDRESSES OR NUMBERS.
The information and views contained in this report were prepared by Harris Williams & Co. (“Harris Williams”). It is not a research report, as such term is defined by applicable law and regulations, and is provided for informational purposes only. It is not to be construed as an offer to buy or sell or a solicitation of an offer to buy or sell any financial instruments or to participate in any particular trading strategy. The information contained herein is believed by Harris Williams to be reliable, but Harris Williams makes no representation as to the accuracy or completeness of such information. Harris Williams and/or its affiliates August be market makers or specialists in, act as advisers or lenders to, have positions in and effect transactions in securities of companies mentioned herein and also August provide, August have provided, or August seek to provide investment banking services for those companies. In addition, Harris Williams and/or its affiliates or their respective officers, directors and employees August hold long or short positions in the securities, options thereon or other related financial products of companies discussed herein. Opinions, estimates and projections in this report constitute Harris Williams’ judgment and are subject to change without notice. The financial instruments discussed in this report August not be suitable for all investors, and investors must make their own investment decisions using their own independent advisors as they believe necessary and based upon their specific financial situations and investment objectives. Also, past performance is not necessarily indicative of future results. No part of this material August be copied or duplicated in any form or by any means, or redistributed, without Harris Williams’ prior written consent.
Copyright© 2015 Harris Williams & Co., all rights reserved.
DISCLOSURES
11
AUTOMOTIVE AFTERMARKET SECTOR UPDATE │ AUGUST 2015