transportation s ystems management an d …
TRANSCRIPT

February 2016
TRANSPORTATION SYSTEMS MANAGEMENT AND OPERATIONS (TSMO) PROGRAM PLAN

Iowa Transportation Systems Management and Operations (TSMO) Program Plan
Version 1.0
Prepared for:
Iowa Department of Transportation
Office of Traffic Operations
Prepared by:
Lakeside Engineers, LLC
Pat Noyes & Associates
February 2016

iii
VERSION CONTROL
Date Version Description
2/11/16 1.0 TSMO Program Plan

iv
TABLE OF CONTENTS Why TSMO Matters ............................................................................................................................ 1
TSMO Plan Purpose .......................................................................................................................... 3
TSMO Vision ...................................................................................................................................... 5
TSMO Mission .................................................................................................................................... 5
TSMO Strategic Goals and Objectives ............................................................................................... 6
PART 2. TSMO Program Plan ............................................................................................................... 7
What is a TSMO Program Plan? ........................................................................................................ 7
Report Format .................................................................................................................................... 7
TSMO Program Objectives ............................................................................................................... 10
TSMO Roadway Facility Hierarchy ................................................................................................... 15
How does TSMO Relate to Current Plans and Programs? ............................................................... 16
PART 3. Leadership and Organization ................................................................................................. 20
PART 4. Business Processes and Resources ..................................................................................... 24
Staffing Expertise ............................................................................................................................. 24
Budgeting, Accounting, Procurement and Contract Management..................................................... 28
Project Programming ........................................................................................................................ 29
Systems Engineering ....................................................................................................................... 30
Collaboration with External Partners ................................................................................................ 31
Programmatic and Administrative Processes ................................................................................... 32
Sustainability and Resiliency ............................................................................................................ 35
Communications, Marketing, and Outreach ...................................................................................... 38
Data Management ............................................................................................................................ 38
Continuous improvement (including Capability Maturity Model) ........................................................ 39
Research and Development ............................................................................................................. 42
Part 5. Performance Management and Decision Support .................................................................... 44
Part 6. 5-Year TSMO Program ............................................................................................................. 54
The ICE-OPS Tool for TSMO Analysis ............................................................................................. 54
5-Year TSMO Budget and ITS Program ........................................................................................... 70
5-Year TSMO Program Activities, Policies, and Procedures ............................................................. 73
Part 7. TSMO Service Layers Overview ............................................................................................... 76
Service Layer Descriptions and Existing Conditions ......................................................................... 76
Service Layer Plan Components ...................................................................................................... 82

v
BIBLIOGRAPHY .................................................................................................................................. 84
Appendix A. Traffic Incident Management Blueprint ............................................................................. 86
Appendix B: One-on-One TSMO Interview Summaries ........................................................................ 95
Appendix C: Internal and External TSMO Focus Group Summaries .................................................... 97
Appendix D: Accomplishment Year Plan-FY2016 .............................................................................. 100

vi
LIST OF FIGURES Figure 1. Iowa Sources of Congestion, 2013-2015 ................................................................................ 2 Figure 2. Percentage Increase of Vehicle Miles Traveled vs. New Lane Miles ....................................... 3 Figure 3. TSMO Documents Relationship .............................................................................................. 4 Figure 4. Iowa DOT Basic and Cross-Cutting Functions ........................................................................ 5 Figure 5. TSMO Roadway Facility Priorities ......................................................................................... 16 Figure 6. Iowa DOT Strategic Direction ................................................................................................ 16 Figure 7. Iowa DOT Long Range Plan Relationships ........................................................................... 17 Figure 8. Interstate Condition Evaluation (ICE) .................................................................................... 18 Figure 9. Office of Traffic Operations Organizational Relationships ..................................................... 21 Figure 10. Office of Traffic Operations Organizational Chart ................................................................ 22 Figure 11. Current TSMO Budget Cycle Process ................................................................................. 28 Figure 12. Systems Engineering “V” Diagram ...................................................................................... 30 Figure 13. TSMO Program Plan and Systems Planning Processes ..................................................... 34 Figure 14. TSMO Capability Levels...................................................................................................... 40 Figure 15. Traffic Incident Performance Measure Graphics ................................................................. 46 Figure 16. TIM and Highway Helper Sample Graphics ......................................................................... 48 Figure 17. Number of Iowa Fatalities, 2001-2014 ................................................................................. 51 Figure 18. ICE-OPS Analysis - All Bottlenecks .................................................................................... 59 Figure 19. ICE-OPS Analysis - Freight Bottlenecks ............................................................................. 60 Figure 20. ICE-OPS Analysis - Traffic Incident Frequency ................................................................... 61 Figure 21. ICE-OPS Analysis - Crash Rates ........................................................................................ 62 Figure 22. ICE-OPS Analysis - Planning Time Index ........................................................................... 63 Figure 23. ICE-OPS Analysis - Event Center Mileage .......................................................................... 64 Figure 24. ICE OPS Analysis - Weather Sensitive Corridor Mileage .................................................... 65 Figure 25. ICE-OPS Analysis - Total AADT ......................................................................................... 66 Figure 26. ICE-OPS Analysis - ICE Rating ........................................................................................... 67 Figure 27. ICE-OPS Analysis - Total Composite Score ........................................................................ 68 Figure 28. Proposed TSMO Services Cost Summary, FY 2016-20 ...................................................... 71 Figure 29. Proposed TSMO Construction Cost Summary, FY 2016-20 ................................................ 72 Figure 30. Iowa DOT Transportation Districts ...................................................................................... 80

vii
LIST OF TABLES Table 1. Strategic Goals and Objectives ................................................................................................ 6 Table 2. Service Layer Definitions ......................................................................................................... 9 Table 3. TSMO Program Objectives .................................................................................................... 11 Table 4. Leadership and Organizational Development (LOD) Recommendations ................................ 23 Table 5. TSMO Staffing Roles ............................................................................................................. 25 Table 6. Comparative Peer Agency Staffing ........................................................................................ 26 Table 7. TSMO Staffing Needs ............................................................................................................ 27 Table 8. ITS Architecture Status .......................................................................................................... 31 Table 9. Proposed TSMO Program Plan and Service Layer Plan Update Cycle .................................. 35 Table 10. INVEST Scoring Summary ................................................................................................... 37 Table 11. Six Critical Dimensions of Capability .................................................................................... 40 Table 12. 2013 CMM Workshop Self-Assessment Outcomes .............................................................. 41 Table 13. 2015 CMM Self-Assessment Outcomes ............................................................................... 42 Table 14. National Goals and Performance Management Measures ................................................... 44 Table 15. Traffic Incident Response Measures .................................................................................... 46 Table 16. TMC Activity Performance Measures ................................................................................... 46 Table 17. Operations Staff Performance Measures ............................................................................. 47 Table 18. ITS Maintenance Online Management System Performance Measures ............................... 47 Table 19. TIM and Highway Helper Performance Measures ................................................................ 47 Table 20. Traffic Critical Projects Measures ......................................................................................... 48 Table 21. Traveler Information Measures............................................................................................. 49 Table 22. CTRE Performance Measures Research ............................................................................. 49 Table 23. Existing Iowa DOT Enterprise-Wide TSMO Related Performance Measures ....................... 50 Table 24. TSMO Strategic Objective Monitoring .................................................................................. 51 Table 25. TSMO Program Performance Monitoring Status .................................................................. 53 Table 26. ICE-OPS Criteria Weighting ................................................................................................. 56 Table 27. ICE-OPS Criteria Scoring, Part 1 of 2................................................................................... 57 Table 28. ICE-OPS Criteria Scoring, Part 2 of 2................................................................................... 57 Table 29. Overall ICE-OPS Corridor Ranking ...................................................................................... 58 Table 30. Border Bridges Traffic Operations Characteristics ................................................................ 69 Table 31. Proposed TSMO Services Cost Summary, FY 2016-20 ....................................................... 70 Table 32. Proposed TSMO Construction Cost Summary, FY 2016-20 ................................................. 72 Table 33. 5-Year Program Activities, Policies and Procedures ............................................................. 73 Table 34. Service Layer Plan Existing Conditions ................................................................................ 76 Table 35. Chronological History of Iowa TSMO Deployments .............................................................. 79 Table 36. Existing ITS and Communications Devices .......................................................................... 80 Table 37. Future Programmed ITS Device Installations ....................................................................... 81 Table 38. Traffic Incident Management (TIM) Plan Status ................................................................... 82

viii
LIST OF ABBREVIATIONS AADT Average Annual Daily Traffic InTrans Institute of Transportation at Iowa State
University AADTT Average Annual Daily Truck Traffic AASHTO American Association of State Highway
and Transportation Officials Iowa DOT Iowa Department of Transportation ISP Iowa State Patrol
ATDM Active Transportation and Demand Management
ITS Intelligent Transportation Systems IWZ Intelligent Work Zone
ATMS Advanced Traffic Management System KSAO Knowledge, Skills, Abilities and Other Characteristics CAD Computer Aided Dispatch
CARS Condition Acquisition and Reporting System
MAP-21 Moving Ahead for Progress in the 21st Century Act
C/AV Connected and Automated Vehicle MDST Multi-Disciplinary Safety Team CCTV Closed Circuit Television MPO Metropolitan Planning Organization CMM Capability Maturity Model MVE Motor Vehicle Enforcement COG Continuity of Government NCHRP National Cooperative Highway Research
Program COOP Continuity of Operations CTRE Center for Transportation Research and
Education NCHRP National Cooperative Highway Research
Program CVO Commercial Vehicle Operations OCM Office of Construction and Materials DMS Dynamic Message Sign OTO Office of Traffic Operations DMS DOT
Dynamic Message Sign Department of Transportation
PTI Planning Time Index RFP Request for Proposals
ETO Emergency Transportation Operations RWIS Road Weather Information System FAST Fixing America's Surface Transportation SEOC Statewide Emergency Operations Center FHWA Federal Highway Administration SHRP2 2nd Strategic Highway Research Program FTA Federal Transit Administration TAM Transportation Asset Management GTSB Governor’s Traffic Safety Bureau TAS Office of Traffic and Safety HAR Highway Advisory Radio TCP Traffic Critical Projects HH Highway Helper TIM Traffic Incident Management ICE Interstate Condition Evaluation TMC Traffic Management Center ICE-OPS Interstate Condition Evaluation-Operations TMP Transportation Management Plan ICS Incident Command System TRB Transportation Research Board ICWS Intersection Collision Warning System TSMO Transportation Systems Management and
Operations VMT Vehicle Miles Traveled

1
PART 1. INTRODUCTION Transportation Systems Management and Operations (TSMO) is defined by the Moving Ahead for Progress in the 21st Century Act (MAP-21) as: “Integrated strategies to optimize the performance of existing infrastructure through the implementation of multimodal and intermodal, cross-jurisdictional systems, services, and projects designed to preserve capacity and improve security, safety, and reliability of the transportation system.” TSMO strategies are used to proactively manage the transportation system by addressing recurring and nonrecurring congestion in real time. Strategies such as traffic incident management, traveler information services, safety service patrols, work zone management and freight management improve system efficiency, enhance public safety, help reduce traveler delays and improve information access. Key to successful integration of these and other TSMO strategies are public and private agency partnerships that, when cohesive, enhance communications and collaboration among transportation partners.
Why TSMO Matters Iowans are experiencing a variety of mobility challenges every day. The most significant of these challenges are temporary disruptions that take away part of the roadway from use, known as “non-recurring” congestion, primarily including bad weather, traffic incidents, and work zones, as shown Figure 1. In fact, about 72% of the congestion and delay experienced by the traveling public in Iowa is non-recurring congestion. Non-recurring congestion can happen anywhere in the state at any time, and these challenges to mobility largely reflect Iowa’s rural landscape. The impact of congestion goes well beyond a traffic event. In calendar year 2015, there was an average of approximately 1,400 traffic incidents per month statewide, with an average duration of approximately 60 minutes for blocked lanes. Each minute a lane is blocked can lead to 4-5 minutes of delay, and for each minute that a primary incident continues, the likelihood of a secondary crash increases by 2.8%. USDOT estimates that secondary crashes represent more than 20% of all crashes and are often more deadly than the primary incident. Fewer incidents and quicker clearance of
WHY DEVELOP A TSMO PROGRAM PLAN?
The TSMO Program
Plan is a guide that
helps Iowa DOT operate
existing infrastructure at
its optimal, full-service
potential, to meet the
vision for TSMO.

2
incidents help to reduce congestion, allowing the transportation system to operate more safely and efficiently.
FIGURE 1. IOWA SOURCES OF CONGESTION, 2013-2015
State transportation agencies have long pursued the practice of increasing capacity to improve service. However, travel demand is far outstripping supply. In Iowa over the last 19 years, vehicle miles traveled throughout the state have grown more than 21%, in contrast to an increase in lane miles of 1.6% as illustrated in Figure 2.

3
FIGURE 2. PERCENTAGE INCREASE OF VEHICLE MILES TRAVELED VS. NEW LANE MILES
Vehicle miles traveled are projected to grow 20% by 2030 and truck freight volumes by 43%. With this projected growth, advancements in technology, and limitations in funding, there is increasing recognition that Iowa’s challenges extend beyond traditional construction and maintenance functions. Cost-effective TSMO strategies are used to improve service by “taking back” the transportation system capacity lost to congestion without necessarily adding lanes. TSMO matters because it deals directly with the root causes of congestion, offers the potential to improve safety and efficiency, and offers the potential to maximize existing infrastructure capacity through cost-effective strategies. Ultimately, this will improve the safety and mobility of the transportation system and help Iowans travel to their destinations safely, efficiently, and conveniently.
TSMO Plan Purpose The purpose of Iowa’s TSMO plan is to improve the capabilities of Iowa DOT to operate and proactively manage the state’s transportation system. As illustrated in Figure 3, collectively the three major components of the TSMO Plan are intended to provide: 1) Strategic direction; 2) Program development direction, and 3) Specific strategies and actions.

4
FIGURE 3. TSMO DOCUMENTS RELATIONSHIP
TSMO complements the investments Iowa DOT has made in infrastructure by enhancing system management and traffic operations. TSMO does not replace any of the current responsibilities; instead, it builds upon the people, processes, and systems already in place, and offers resources and strategies to realize the full capacity of the existing transportation system, as shown by the basic and cross-cutting activities performed by Iowa DOT in Figure 4.

5
FIGURE 4. IOWA DOT BASIC AND CROSS-CUTTING FUNCTIONS
The outcome of Iowa’s TSMO plan is a safer, more efficient, and more reliable transportation system as a result of coordinated and targeted Transportation Systems Management and Operations (TSMO) investments and process refinements, ultimately supporting Iowa DOT’s vision of “Smarter, Simpler, Customer-Driven.”
TSMO Vision Iowa’s transportation system is safe, efficient and reliable, supporting the state’s environmental and economic health as a result of TSMO
TSMO Mission To get you there safely and reliably by proactively managing the transportation system.

6
TSMO Strategic Goals and Objectives The TSMO Strategic Goals and Objectives shown in Table 1 provide direction for the structure, strategies, actions and management of the TSMO Program. They reflect the Iowa DOT Core Values and are consistent with the MAP-21 National Goals for Performance. Also, these goals were developed based on both internal agency and external partner input. The goals are key to achieving Iowa DOT’s vision of a transportation system that is safer, more efficient, and more reliable as a result of strategic TSMO investments and actions.
TABLE 1. STRATEGIC GOALS AND OBJECTIVES Strategic Goal Strategic Objective
1. Safety
Reduce crash frequency and severity
2. Reliability Improve transportation system reliability, increase system resiliency, and add highway capacity in critical corridors
3. Efficiency Minimize traffic delay and maximize transportation system efficiency to keep traffic moving
4. Convenience
Provide ease of access and mobility choices to customers
5. Coordination Engage all DOT disciplines, and external agencies and jurisdictions to proactively manage and operate the transportation system
6. Integration Incorporate TSMO strategies throughout DOT’s transportation planning, design, construction, maintenance, and operations activities

7
PART 2. TSMO PROGRAM PLAN
What is a TSMO Program Plan? The overall purpose of Iowa’s TSMO plan is to improve the capabilities of Iowa DOT to operate and proactively manage the state’s transportation system. The TSMO plan provides: 1) strategic direction, 2) program development, and 3) specific strategies and actions, as previously illustrated in Figure 3. In this context, the TSMO Program Plan focuses specifically on program development within the Iowa DOT and bridges the TSMO strategic vision with the specific actions needed to achieve the vision. The programmatic focus provides the organizational, procedural and resource framework needed to move TSMO from a group of ad hoc activities and services to an integrated approach. A primary goal of comprehensive TSMO program planning is to integrate TSMO into the core mission and culture of the Department, as well as TSMO stakeholders. TSMO program planning is an ongoing, iterative process with other departmental plans, initiatives, and stakeholders. Program planning addresses not only internal, but also external coordination and collaboration to deliver a cohesive program. The TSMO Program Plan provides the structure by which Iowa DOT coordinates across disciplines, projects and services to deliver the strategic vision. It also serves as the business plan for TSMO activities, supporting business decisions and processes needed to deliver a safe, efficient and reliable transportation system while supporting the state’s environmental and economic health.
Report Format A primary intent of Iowa’s TSMO plan is to facilitate and advance transportation systems management and operations into the core mission and culture of Iowa DOT and to mature the TSMO capabilities of the agency. A recently completed NCHRP study (NCHRP 20-07/Task 345) recommends a basic framework for developing a model TSMO Program Plan:
• Mission, Vision, Goals, Objectives, and Performance Measures • Leadership and Organization • Business Processes • Resources (Financial, Human, Infrastructure, and Technology) • Packages of Services, Projects, and Activities with Related Policies and Guidelines
Iowa’s TSMO plan follows this model framework and utilizes three levels of TSMO planning documents, as shown in Figure 3, each with varying degrees of detail provided for different audiences. The TSMO Strategic Plan provides the mission, vision, goals and strategic objectives for TSMO in Iowa. The TSMO Program Plan focuses on leadership, organization, business processes, performance management and resources. The TSMO Service Layer Plans are the packages of specific TSMO services, activities and projects to be undertaken by the agency.
8
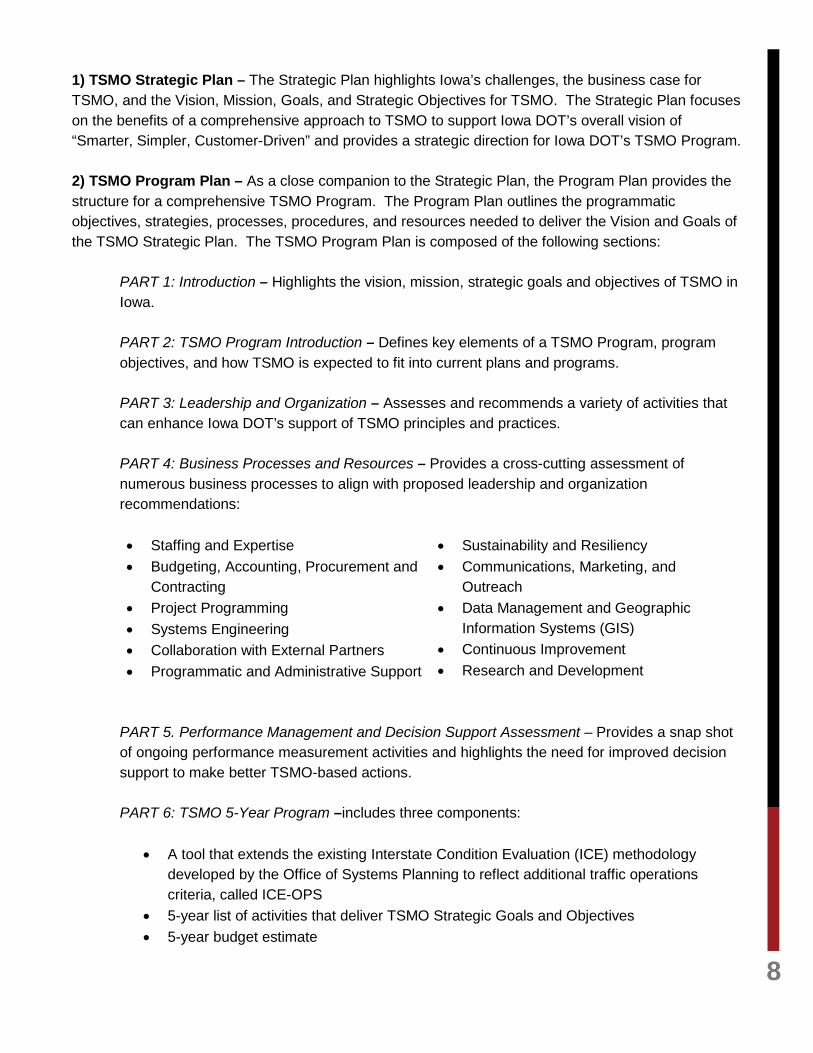
1) TSMO Strategic Plan – The Strategic Plan highlights Iowa’s challenges, the business case for TSMO, and the Vision, Mission, Goals, and Strategic Objectives for TSMO. The Strategic Plan focuses on the benefits of a comprehensive approach to TSMO to support Iowa DOT’s overall vision of “Smarter, Simpler, Customer-Driven” and provides a strategic direction for Iowa DOT’s TSMO Program. 2) TSMO Program Plan – As a close companion to the Strategic Plan, the Program Plan provides the structure for a comprehensive TSMO Program. The Program Plan outlines the programmatic objectives, strategies, processes, procedures, and resources needed to deliver the Vision and Goals of the TSMO Strategic Plan. The TSMO Program Plan is composed of the following sections:
PART 1: Introduction – Highlights the vision, mission, strategic goals and objectives of TSMO in Iowa. PART 2: TSMO Program Introduction – Defines key elements of a TSMO Program, program objectives, and how TSMO is expected to fit into current plans and programs. PART 3: Leadership and Organization – Assesses and recommends a variety of activities that can enhance Iowa DOT’s support of TSMO principles and practices. PART 4: Business Processes and Resources – Provides a cross-cutting assessment of numerous business processes to align with proposed leadership and organization recommendations: • Staffing and Expertise • Budgeting, Accounting, Procurement and
Contracting • Project Programming • Systems Engineering • Collaboration with External Partners • Programmatic and Administrative Support
• Sustainability and Resiliency • Communications, Marketing, and
Outreach • Data Management and Geographic
Information Systems (GIS) • Continuous Improvement • Research and Development
PART 5. Performance Management and Decision Support Assessment – Provides a snap shot of ongoing performance measurement activities and highlights the need for improved decision support to make better TSMO-based actions. PART 6: TSMO 5-Year Program –includes three components:
• A tool that extends the existing Interstate Condition Evaluation (ICE) methodology developed by the Office of Systems Planning to reflect additional traffic operations criteria, called ICE-OPS
• 5-year list of activities that deliver TSMO Strategic Goals and Objectives • 5-year budget estimate
9
PART 7: Service Layers Overview – Provides introductory information on the eight (8) Service Layer Plans that are expected to be completed over the course of several fiscal years.
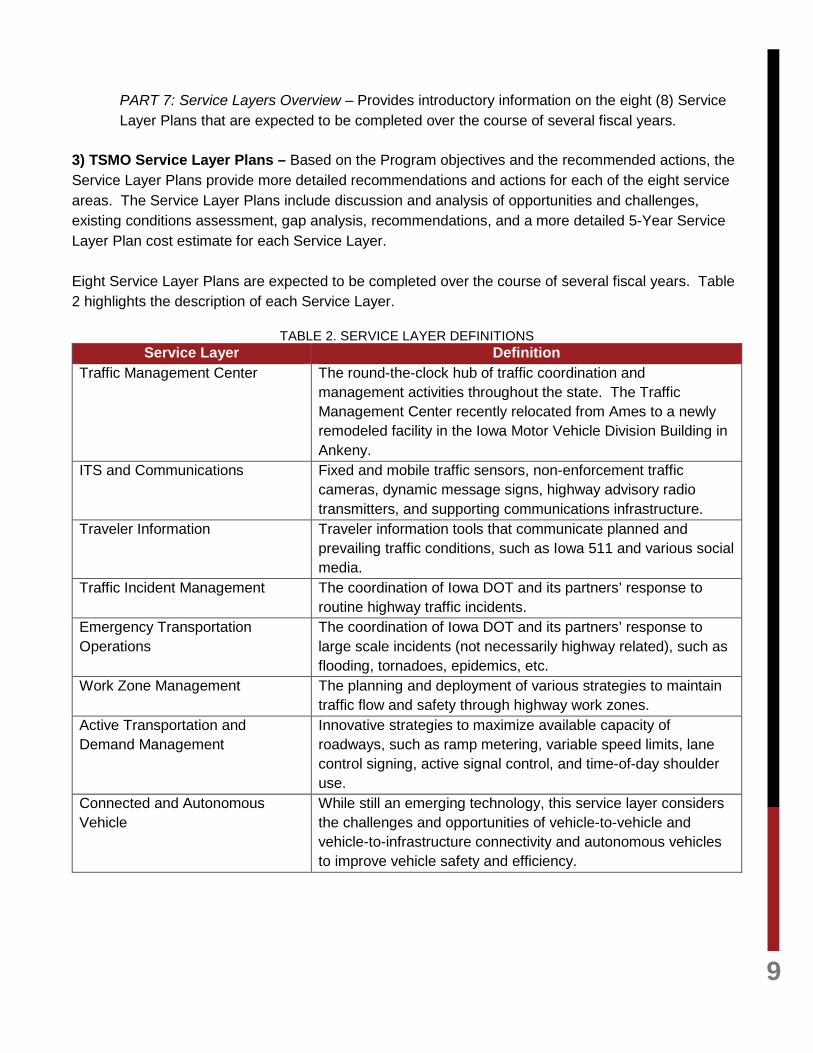
3) TSMO Service Layer Plans – Based on the Program objectives and the recommended actions, the Service Layer Plans provide more detailed recommendations and actions for each of the eight service areas. The Service Layer Plans include discussion and analysis of opportunities and challenges, existing conditions assessment, gap analysis, recommendations, and a more detailed 5-Year Service Layer Plan cost estimate for each Service Layer. Eight Service Layer Plans are expected to be completed over the course of several fiscal years. Table 2 highlights the description of each Service Layer.
TABLE 2. SERVICE LAYER DEFINITIONS Service Layer Definition
Traffic Management Center The round-the-clock hub of traffic coordination and management activities throughout the state. The Traffic Management Center recently relocated from Ames to a newly remodeled facility in the Iowa Motor Vehicle Division Building in Ankeny.
ITS and Communications Fixed and mobile traffic sensors, non-enforcement traffic cameras, dynamic message signs, highway advisory radio transmitters, and supporting communications infrastructure.
Traveler Information Traveler information tools that communicate planned and prevailing traffic conditions, such as Iowa 511 and various social media.
Traffic Incident Management The coordination of Iowa DOT and its partners’ response to routine highway traffic incidents.
Emergency Transportation Operations
The coordination of Iowa DOT and its partners’ response to large scale incidents (not necessarily highway related), such as flooding, tornadoes, epidemics, etc.
Work Zone Management The planning and deployment of various strategies to maintain traffic flow and safety through highway work zones.
Active Transportation and Demand Management
Innovative strategies to maximize available capacity of roadways, such as ramp metering, variable speed limits, lane control signing, active signal control, and time-of-day shoulder use.
Connected and Autonomous Vehicle
While still an emerging technology, this service layer considers the challenges and opportunities of vehicle-to-vehicle and vehicle-to-infrastructure connectivity and autonomous vehicles to improve vehicle safety and efficiency.

10
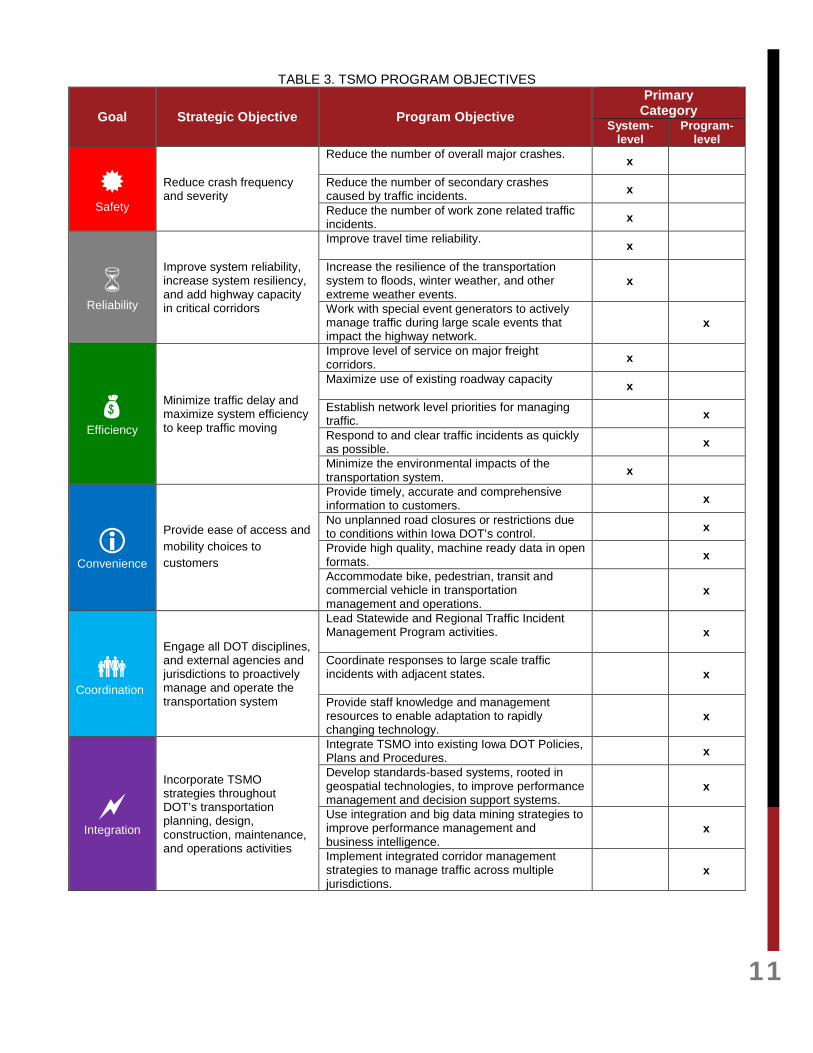
TSMO Program Objectives Without a well-structured, well managed program, the ability of Iowa DOT to meet current and future operational challenges is limited. Iowa’s TSMO plan provides for: 1) overall goals, 2) strategic objectives, and 3) program objectives. These goals, strategic objectives, and program objectives are intended to align and build upon one another and to drive development of specific operational strategies. Program objectives provide a foundation that enables Iowa DOT to deliver projects and services that support integrated and coordinated transportation systems management. The TSMO program objectives are the more detailed and targeted objectives that bridge between the specific strategies of the eight service layers and the overall strategic objectives of TSMO. In this context, they provide a mechanism to monitor and manage the overall effectiveness of the TSMO program and the eight service layers. The program objectives are intended to drive development of the eight service layers because the eight service layers will contain the specific services, projects, and activities that will be undertaken to achieve the program objectives. These objectives also provide a basis for prioritization and programmatic decision-making to deliver an effective TSMO program in Iowa. The key program objectives are shown in Table 3. Because some of the program objectives relate to the transportation system and others relate to DOT’s TSMO program, they are distinguished based on each category. Program objectives have been aligned with key strategic goals to provide prioritization and structure, yet they may support more than one strategic goal and should not be considered mutually exclusive. The program objectives are described in more detail following Table 3.
11
TABLE 3. TSMO PROGRAM OBJECTIVES
Goal Strategic Objective Program Objective Primary
Category System-
level Program-
level
Safety
Reduce crash frequency and severity
Reduce the number of overall major crashes. x
Reduce the number of secondary crashes caused by traffic incidents. x
Reduce the number of work zone related traffic incidents. x
Reliability
Improve system reliability, increase system resiliency, and add highway capacity in critical corridors
Improve travel time reliability. x
Increase the resilience of the transportation system to floods, winter weather, and other extreme weather events.
x
Work with special event generators to actively manage traffic during large scale events that impact the highway network.
x
Efficiency
Minimize traffic delay and maximize system efficiency to keep traffic moving
Improve level of service on major freight corridors. x
Maximize use of existing roadway capacity x
Establish network level priorities for managing traffic. x
Respond to and clear traffic incidents as quickly as possible. x
Minimize the environmental impacts of the transportation system. x
Convenience
Provide ease of access and mobility choices to customers
Provide timely, accurate and comprehensive information to customers. x
No unplanned road closures or restrictions due to conditions within Iowa DOT’s control. x
Provide high quality, machine ready data in open formats. x
Accommodate bike, pedestrian, transit and commercial vehicle in transportation management and operations.
x
Coordination
Engage all DOT disciplines, and external agencies and jurisdictions to proactively manage and operate the transportation system
Lead Statewide and Regional Traffic Incident Management Program activities.
x
Coordinate responses to large scale traffic incidents with adjacent states.
x
Provide staff knowledge and management resources to enable adaptation to rapidly changing technology.
x
Integration
Incorporate TSMO strategies throughout DOT’s transportation planning, design, construction, maintenance, and operations activities
Integrate TSMO into existing Iowa DOT Policies, Plans and Procedures. x
Develop standards-based systems, rooted in geospatial technologies, to improve performance management and decision support systems.
x
Use integration and big data mining strategies to improve performance management and business intelligence.
x
Implement integrated corridor management strategies to manage traffic across multiple jurisdictions.
x
12
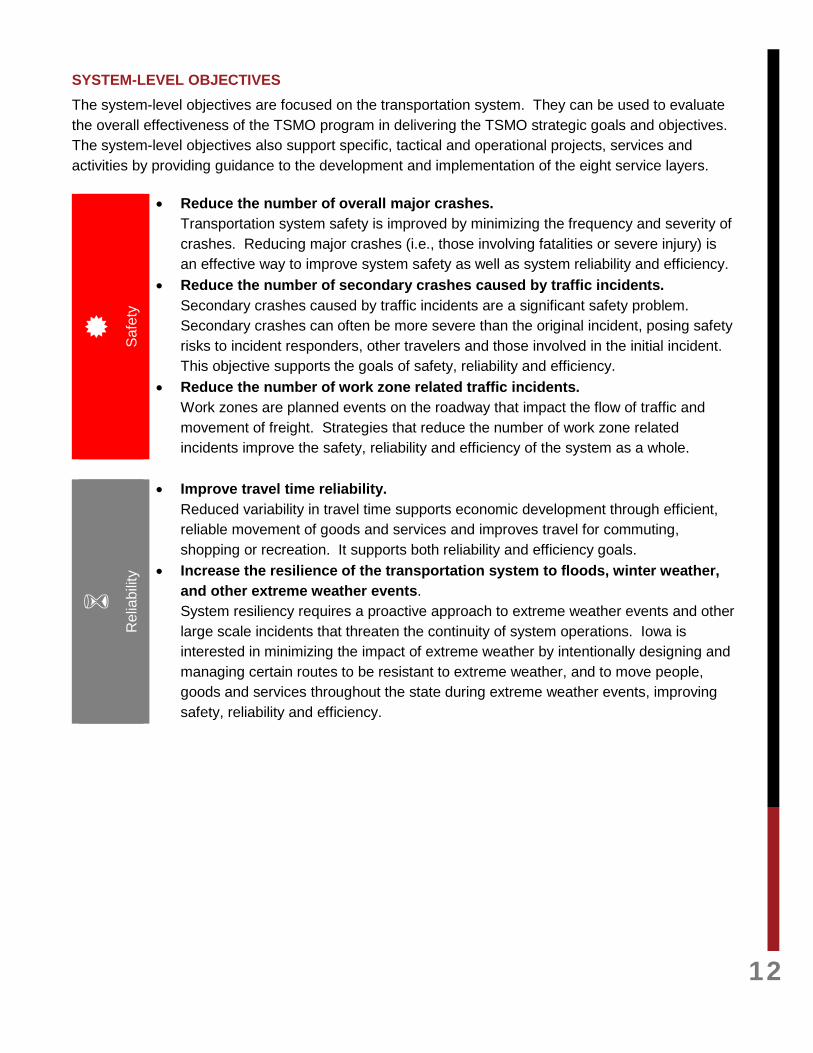
SYSTEM-LEVEL OBJECTIVES The system-level objectives are focused on the transportation system. They can be used to evaluate the overall effectiveness of the TSMO program in delivering the TSMO strategic goals and objectives. The system-level objectives also support specific, tactical and operational projects, services and activities by providing guidance to the development and implementation of the eight service layers.
Safe
ty
• Reduce the number of overall major crashes. Transportation system safety is improved by minimizing the frequency and severity of crashes. Reducing major crashes (i.e., those involving fatalities or severe injury) is an effective way to improve system safety as well as system reliability and efficiency.
• Reduce the number of secondary crashes caused by traffic incidents. Secondary crashes caused by traffic incidents are a significant safety problem. Secondary crashes can often be more severe than the original incident, posing safety risks to incident responders, other travelers and those involved in the initial incident. This objective supports the goals of safety, reliability and efficiency.
• Reduce the number of work zone related traffic incidents. Work zones are planned events on the roadway that impact the flow of traffic and movement of freight. Strategies that reduce the number of work zone related incidents improve the safety, reliability and efficiency of the system as a whole.
Rel
iabi
lity
• Improve travel time reliability. Reduced variability in travel time supports economic development through efficient, reliable movement of goods and services and improves travel for commuting, shopping or recreation. It supports both reliability and efficiency goals.
• Increase the resilience of the transportation system to floods, winter weather, and other extreme weather events. System resiliency requires a proactive approach to extreme weather events and other large scale incidents that threaten the continuity of system operations. Iowa is interested in minimizing the impact of extreme weather by intentionally designing and managing certain routes to be resistant to extreme weather, and to move people, goods and services throughout the state during extreme weather events, improving safety, reliability and efficiency.
13
Effic
ienc
y
• Improve level of service on major freight corridors. Iowa’s major freight corridors are critical to the state’s economic vitality. By improving the level of service on these corridors and reducing congestion-related delay, Iowa DOT helps to maintain the supply chain for interstate and intrastate commerce.
• Maximize use of existing roadway capacity. TSMO supports Iowa DOT’s ability to use existing capacity more efficiently by actively managing traffic and identifying congestion hotspots for operational improvements. This increases system efficiency and reliability, reducing or postponing the need for major construction investments, and supporting targeted capacity improvements in critical corridors.
• Minimize the environmental impacts of the transportation system. Increased efficiency and reliability of the system reduces congestion and resulting emissions and fuel consumption.
PROGRAM-LEVEL OBJECTIVES The program-level objectives are focused on DOT’s TSMO program efforts; they identify programmatic objectives necessary for business improvements, program management and supporting the service layers.
Rel
iabi
lity
• Work with special event generators to actively manage traffic during large scale events that impact the highway network. Special events that generate significant traffic over a fairly short duration can negatively impact system efficiency and reliability. By working with event coordinators in advance, Iowa DOT can support active traffic management during the event which also enhances traveler information accuracy before and during the event, supporting strategic goals of reliability, efficiency, and coordination.
Effic
ienc
y
• Establish Network Level Priorities for managing traffic. The Iowa TSMO Program will develop and use a Network Level Priorities strategy for planning and deploying specific projects, services and activities across its 9,400 mile primary highway network to manage the transportation system efficiently (see Figure 5). These priorities will support TSMO Program decision making, resource allocation processes and coordination.
• Respond to and clear traffic incidents as quickly as possible. Traffic incidents negatively impact the safety, reliability and efficiency of the highway system. Quick response and quick, safe clearance, as articulated in the National Unified Goal for Traffic Incident Management (TIM NUG), support the TIM program and its partners. The TIM NUG was ratified in 2007 to promote responder safety; safe, quick clearance; and prompt, reliable, interoperable communications.

14
Con
veni
ence
• Provide timely, accurate and comprehensive information to customers. Timely, accurate and comprehensive information allows system users to make informed travel choices, which supports convenience, system efficiency and reliability for all users.
• No unplanned road closures or restrictions due to conditions within Iowa DOT’s control. Iowa DOT is committed to working proactively to eliminate unplanned road closures associated with DOT activities and other non-emergency events. This supports system convenience, safety, efficiency and reliability.
• Provide high quality, machine-ready information in open formats. Iowa DOT serves a broad range of user groups, including commuters, tourists, and commercial carriers. Information content needs vary by user group, whether it’s the motoring public or the agencies responding to a traffic incident. Providing high quality information in open formats to customers and businesses when and how they need it supports system convenience, efficiency and reliability.
• Accommodate bike, pedestrian, transit and commercial vehicles in transportation management and operations. TSMO must address all user needs, including bicycle, pedestrian, transit, and commercial vehicles. As the eight service layer plans are developed and implemented, it is important to coordinate with other activities and users to address accommodations for all user types to deliver a safe, reliable and efficient system.
Coo
rdin
atio
n
• Lead Statewide and Regional Traffic Incident Management Program activities. The Traffic Incident Management (TIM) Program is one of the eight service layers that support the TSMO Program. This service layer focuses on coordination with internal and external partners to provide an integrated, comprehensive approach to planning for and managing incidents on Iowa highways. By adopting the National Unified Goal for TIM and leading and coordinating TIM activities statewide, Iowa DOT can support a safer and more reliable transportation system.
• Coordinate responses to large scale traffic incidents with adjacent states. Regional planning for and response to large scale traffic incidents is an important component of interagency coordination and corridor management. Limited access points along Interstates and major corridors, specifically where border bridge crossings are involved, require a coordinated response between state DOTs. This supports the goal of coordination as well as safety, reliability, efficiency and integration.
• Provide staff knowledge and management resources to enable adaptation to rapidly changing technology. To develop an effective TSMO Program, Iowa DOT needs staff and management resources required to adapt to changing technology. Changes in data sources, ITS technology, communications and vehicle capabilities will require continuous development of staff capabilities to deliver program goals and objectives.

15
Inte
grat
ion
• Integrate TSMO into existing DOT Policies, Plans and Procedures. In order to create a culture of TSMO across the various organizational levels and disciplines of Iowa DOT, it is critical to consider TSMO as a core component in DOT policies, plans and procedures. This integration will enable the TSMO vision and goals to be realized in support of the full range of DOT projects and services.
• Develop standards-based systems, rooted in geospatial technologies, to improve performance management and decision support systems. Standardizing systems within Iowa DOT and between DOT and its public and private partners will support system efficiency, coordination and integration to maximize return on investment in technology. By building on geospatial technologies to integrate data, data sharing, coordination and integration can be enhanced to support a more efficient and reliable transportation system.
• Use integration and big data mining strategies to improve performance management and business intelligence. As new and expanded sources of data become available, data sharing and data mining offer new opportunities for planning for TSMO and actively managing traffic on the system. Integration of big data and expanded data analytics will improve performance management and decision support activities to enhance system safety and reliability.
• Implement integrated corridor management strategies to manage traffic across multiple jurisdictions. Integrated corridor management provides a framework for multi-modal, multi-jurisdictional coordination to deliver a safer, more reliable, and more convenient transportation system for all users while enhancing the cost-effectiveness for participating agencies.
TSMO Roadway Facility Hierarchy To focus and direct program resources, Iowa DOT established a priority of different roadway facility types as shown in Figure 5, in which Interstate highways are the most important facilities to actively manage, followed by primary municipal highways, primary rural highways and border bridges. Interstate highways are the highest priority because, when compared to the entire state road and street system, the facilities comprise only 0.7% of total mileage and carry 25% and 56% of all traffic and truck traffic, respectively. The primary municipal network experiences a significant amount of the congestion and traffic incidents in the state, and the primary rural network is critical to support intercity commerce and travel. Border bridges have been included in the hierarchy since significant rerouting and operations support are typically required in the event a crossing is closed for any extended duration. At a high level, the hierarchy will help drive TSMO related decisions ranging from real-time traffic management strategies to resource planning.

16
FIGURE 5. TSMO ROADWAY FACILITY PRIORITIES
How does TSMO Relate to Current Plans and Programs? The integration of TSMO principles within the Department will require buy-in, collaboration and patience to expand the organization’s culture to be more inclusive of an operations focus. There are a number of well-established plans and programs throughout the Department that will benefit from integration of TSMO principles. The following section highlights the current plans and programs that should be evaluated for TSMO integration. IOWA DOT STRATEGIC PLAN
Updated on a biannual or annual basis, the Iowa DOT 2014 Strategic Plan defines the overall organizational Vision, Mission and Core Values, as shown in Figure 6, to identify and initiate a variety of changes within the organization.
FIGURE 6. IOWA DOT STRATEGIC DIRECTION
Smarter, Simpler,
Customer-Driven
Vision
Getting you there safely, efficiently,
and conveniently
Mission
● Safety● Respect● Integrity● Teamwork● Leadership
Core Values
17
The Strategic Plan also identifies initiatives that directly address the areas within the organization that need attention. The defined Key Initiatives for change include: • Performance Management • Data Integration • Portfolio and Project Management • Organizational Communication • Workforce and Knowledge Management Many of the Key Initiative activities are reflected in the TSMO Program Plan. Part 4 of this plan elaborates on how TSMO activities are being addressed at the business process and resource allocation level. IOWA LONG RANGE MULTIMODAL TRANSPORTATION PLAN
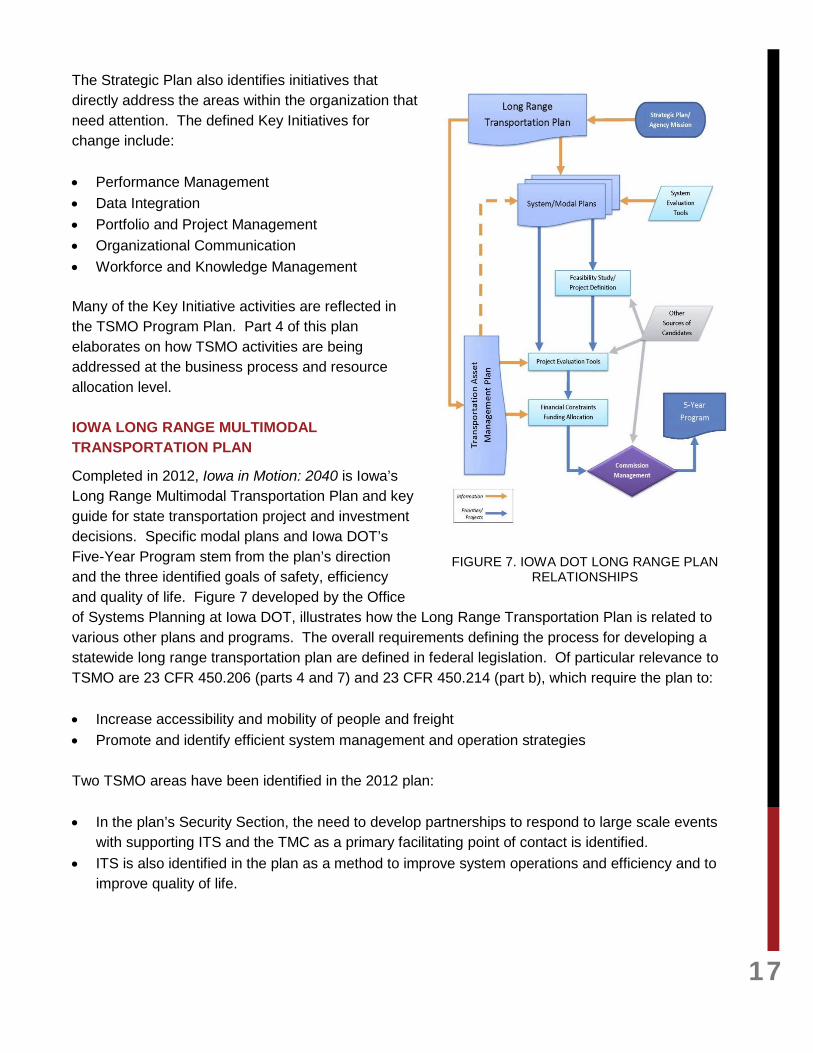
Completed in 2012, Iowa in Motion: 2040 is Iowa’s Long Range Multimodal Transportation Plan and key guide for state transportation project and investment decisions. Specific modal plans and Iowa DOT’s Five-Year Program stem from the plan’s direction and the three identified goals of safety, efficiency and quality of life. Figure 7 developed by the Office of Systems Planning at Iowa DOT, illustrates how the Long Range Transportation Plan is related to various other plans and programs. The overall requirements defining the process for developing a statewide long range transportation plan are defined in federal legislation. Of particular relevance to TSMO are 23 CFR 450.206 (parts 4 and 7) and 23 CFR 450.214 (part b), which require the plan to: • Increase accessibility and mobility of people and freight • Promote and identify efficient system management and operation strategies Two TSMO areas have been identified in the 2012 plan: • In the plan’s Security Section, the need to develop partnerships to respond to large scale events
with supporting ITS and the TMC as a primary facilitating point of contact is identified. • ITS is also identified in the plan as a method to improve system operations and efficiency and to
improve quality of life.
FIGURE 7. IOWA DOT LONG RANGE PLAN RELATIONSHIPS

18
IOWA DOT MODAL AND SPECIALIZED SYSTEM PLANS Iowa DOT has developed a series of mode-specific plans that reflect the high level needs identified in the Long Range Multimodal Transportation Plan. The modal and specialized system plans are at varying degrees of completion as follows:
• Aviation Plan – defines proposed aviation investments over a 20-year period from 2010-2030. • Bicycle and Pedestrian Plan – currently in the process of being completed. • Statewide Rail Plan – Completed in 2009, the plan defines investments for future freight,
passenger and commuter rail infrastructure improvements. • Statewide Freight Plan - Iowa DOT is currently preparing a statewide freight plan that is
expected to be completed in 2016. It will use bottleneck analysis and transportation demand modeling to provide a picture of current freight movements throughout the state.
• Iowa Interstate Corridor Plan was completed in 2013 and developed to provide Iowa DOT with an initial screening and prioritization of Interstate corridors/segments. This plan uses roadway segment-level analytics and a variety of condition criteria, such as average annual daily traffic (by classification), congestion index, and roadway/bridge conditions, to prioritize Interstate segments for improvement. The analytical tool is referred to as the Interstate Condition Evaluation (ICE) tool, and the summarized analysis is illustrated in Figure 8.
FIGURE 8. INTERSTATE CONDITION EVALUATION (ICE)
Since completion of the initial report in 2013, the ICE methodology is currently being extended to the entire 9,400 mile primary roadway network. Through cooperation and coordination with the Office of Systems Planning, the methodology developed for the Interstate system has been modified to include

19
several operations-oriented criteria and is referred to as the ICE-OPS Analysis. Additional discussion of ICE-OPS is located in Part 6: 5-Year TSMO Program. Other specialized system plans recently completed include the Statewide Park and Ride Plan and the Statewide Rest Area Study. There may be a role to provide supplemental surveillance capabilities at rest areas and park and ride sites throughout the state to enhance safety and security. TRANSPORTATION ASSET MANAGEMENT PLAN As required by MAP-21, Iowa DOT is in the process of developing a Transportation Asset Management Plan (TAMP). As such, Transportation Asset Management (TAM) is a Department-wide commitment to excellence in managing Iowa’s transportation assets and applies to all offices and divisions within Iowa DOT. Numerous activities have been proposed to implement the TAMP over the next couple years: • Initiative 1. Implement TAM Governance Structure to guide the direction and implementation of
Asset Management principles in a comprehensive and collaborative manner. • Initiative 2. Develop TAM Communications Plan • Initiative 3. Develop TAM Training Plan • Initiative 4. Develop a Centralized TAM Warehouse • Initiative 5. Enhance Performance Based Planning and Programming • Initiative 6. Develop Formal Risk Management Process • Initiative 7. Develop Trade-off Capabilities for Pavements and Bridges • Initiative 8. Develop Asset Class Specific TAM Procedures • Initiative 9. Develop Maintenance Quality Assurance Program • Initiative 10. Develop Whole Life Management Procedures for Pavements and Bridges. ITS Devices ranked 11th out of 20 in a list of prioritized asset classes. It may be some time before TSMO is integrated into the overall TAMP and associated programmatic activities. IOWA 5-YEAR TRANSPORTATION IMPROVEMENT PROGRAM The 5-Year Program defines the infrastructure projects to be constructed throughout the state. The most recent plan covers FY 2016-2020 and includes projects totaling $1.16 billion for State Fiscal Year 2016. The Plan includes a number of programs:
• Aviation • Transit • Railroad • State and Federal Trails • Revitalize Iowa’s Sound Economy (RISE)
• Statewide Transportation Alternatives • Iowa’s Clean Air Attainment Program (ICAAP) • Traffic Safety Improvement • Highway
The largest category is the Highway Program, which focuses on reconstructing and expanding highway capacity. In the near-term, there are opportunities to be more explicit in defining construction projects that are candidates for TSMO strategies. Longer-term, at the project definition stage, TSMO strategies

20
may be considered as tools to defer, or where possible eliminate, the need for roadway capacity expansion. OTHER PLANS The Iowa Strategic Highway Safety Plan (SHSP) 2013-2016 provides a comprehensive framework for reducing highway fatalities and serious injuries on Iowa’s public roads. The SHSP focuses on strategies with the greatest potential to reduce fatalities and meet the adopted statewide vision of “Zero Fatalities.” Relevant priority strategies are identified in the five key disciplines of the SHSP (Education, Enforcement, Engineering, Emergency Responders, Everyone). One of the Priority Strategies referenced in the plan and currently used by Iowa DOT employs dynamic message signs to relay safety messages to the traveling public (i.e. Message Mondays). There are other references in the SHSP to using TSMO strategies to improve safety, including commercial vehicle enforcement technology enhancements and traffic signal improvements. Iowa’s Emergency Transportation Operations (ETO) Plan was developed in 2013 to guide statewide, multi-jurisdictional response to large scale incidents and natural disasters. The Iowa ETO Plan follows a standardized, all-hazards approach to incident management, consistent with the National Incident Management System (NIMS) and will provide a foundation for the ETO Service Layer Plan. Iowa’s Traffic Incident Management (TIM) Blueprint (see Appendix A), developed in 2015, provides a framework for activities needed to enhance and evolve Iowa DOT’s coordination with response agencies and capabilities in responding to and managing traffic incidents statewide. The Blueprint will be integrated into the yet to be developed Traffic Incident Management Service Layer Plan.
PART 3. LEADERSHIP AND ORGANIZATION The current leadership and organizational structure is well defined within Iowa DOT. As shown in Figure 9, primary TSMO responsibilities are centered in the Office of Traffic Operations (OTO) within the Highway Division and Systems Operations Bureau. However, OTO is only 3 years old and prior to forming the office, TSMO staff were distributed across the organization. For example, ITS planning and design staff were positioned within Research and Technology Bureau, while Emergency Traffic Operations and the Emergency Operations Center personnel were based in the Office of Maintenance. The Office of Maintenance has a significant role in TSMO, especially in the context of weather management, traffic incident response and emergency transportation operations. In addition, the Office of Traffic and Safety (TAS) has a historical role of developing policies and procedures related to TSMO activities (e.g., TAS Manual - DMS standards).

21
FIGURE 9. OFFICE OF TRAFFIC OPERATIONS ORGANIZATIONAL RELATIONSHIPS
More specifically, Figure 10 illustrates the current OTO organization chart. The Office is led by a Director, with three lead workers. The lead workers oversee four areas: • Traffic Operations Systems and Technical Services – Includes a variety of activities, such as
Advanced Traffic Management System (ATMS) software, plan development for stand-alone and mainstreamed ITS deployment projects, Traffic Critical Projects planning and deployment, primary coordination with the Institute of Transportation (InTrans) at Iowa State University, traveler information services, and maintenance of ITS devices, including supporting communication networks.
• Traffic Incident and Emergency Management – Responsible for TIM/ETO training and exercises, COOP/COG, Federal Emergency Relief (ER) Program, statewide/regional TIM planning, state and local agency coordination, emergency management, and major incident after-action reviews.
• Traffic Management Center Services – Oversees day-to-day operations of the 24/7/365 Traffic Management Center, including oversight of an out-sourced operator staffing contract.
• Traffic Operations Research and Decision Support – Includes coordination with the Center of Transportation Research and Education (CTRE) at Iowa State University and others to support operations decision making, development of system-wide performance measures, and applications development such as using probe data to alert operators of rapidly developing queuing situations.

22
FIGURE 10. OFFICE OF TRAFFIC OPERATIONS ORGANIZATIONAL CHART
While many TSMO responsibilities are centered within the Office of Traffic Operations, there is a need to define roles and responsibilities for TSMO in other areas of the Department. For example, the Districts are largely responsible for directly performing or assisting with many traffic operations functions throughout the state. There remains a need to define TSMO roles at District management and staff levels. There are several considerations highlighted in NCHRP Project 20-7/Task 345 “Program Planning and Development for TSMO in State Departments of Transportation” that represent leadership and organizational development effective practices. The Department’s current TSMO status and recommendations for related improvement are provided in Table 4.

23
TABLE 4. LEADERSHIP AND ORGANIZATIONAL DEVELOPMENT (LOD) RECOMMENDATIONS
Recommended Practice 1. Department-wide integration of TSMO concepts and principles Current State of Play With the relatively recent creation of OTO in 2012, TSMO concepts and principles are in their infancy and being defined on a Department-wide basis. Current planning for an Iowa Lane Closure System presents immediate opportunities for TSMO integration.
Recommendations LOD1. Integrate TSMO principles more broadly into the Department’s policies, plans and procedures by incorporation into the Design Manual, Policies and Procedures Manual, Traffic and Safety Manual and Instructional Memorandums LOD2. Integrate TSMO into the Department’s Strategic and Long Range Transportation Plans
Recommended Practice 2. Development of an organizational unit(s) with lead responsibility for TSMO Current State of Play Since 2012, OTO has cycled through three Directors. Iowa DOT is a very flat organization compared to other state DOTs. OTO has a Director with three lead workers. Most other organizations have some level of additional management supervision, particularly to address the 24/7 nature of operations.
Recommendations LOD3. Clearly articulate OTO’s roles and responsibilities to internal and external audiences LOD4. Create appropriate management layers to provide 24/7 on-call management access (through rotation) and to develop the next TSMO leaders of the organization LOD5. Rename Systems Operations Bureau to “Systems Management & Operations Bureau”
Recommended Practice 3. Relative responsibilities of headquarters and region/district offices Current State of Play Nearly all responsibilities are based in Ames. There is one traffic technician in each district. In 2015, District 5 (Fairfield) hired a traffic engineer that reports to the District Maintenance Manager.
Recommendations LOD6. Designate TSMO responsibilities in each District to the Assistant District Engineers or similar level of District management LOD7. Designate at least one person in each District to serve as TSMO or Operations Engineer LOD8. Develop an internal forum/committee for District TSMO representatives to share successes and lessons learned LOD9. Engage Districts in planning and implementing the TSMO Program LOD10. Elevate Districts to serve as leader for MDST meetings where appropriate, in concert with InTrans, Systems Planning, and Traffic & Safety LOD 11. Establish virtual TMC technologies in each District LOD 12. Develop system performance measurements in concert with each District
Recommended Practice 4. Responsibilities for TSMO deployment planning Current State of Play Most deployment activities take place within OTO. On occasion, peer offices are involved with developing concepts in coordination with OTO.
Recommendations LOD13. Complete detailed plans for each proposed Service Layer and broadly engage internal offices/Districts during plan development LOD14. Link deployment planning with 5-Year Highway Improvement Program by developing an ITS program that is annually vetted with Districts
Recommended Practice 5. Interaction with external stakeholders, expanding coordination and collaboration to enhance existing relationships and building new partnerships Current State of Play MDSTs and other ongoing TIM program activities serve as methods to routinely engage external stakeholders.
Recommendations LOD15. Develop sustainable strategies to maintain momentum of regional TIM activities LOD16. Implement TIM Blueprint recommendations LOD17. Establish a statewide TIM Committee
Recommended Best Practice 6. Reducing organizational dependence on champions and sponsors Current State of Play OTO would lose significant institutional knowledge with the retirements or departures of only one or two key personnel.
Recommendations LOD18. Document existing processes and provide training to staff to minimize impacts of retirements or departures LOD19. Provide cross training and require mission-critical positions to have multiple back-ups
24
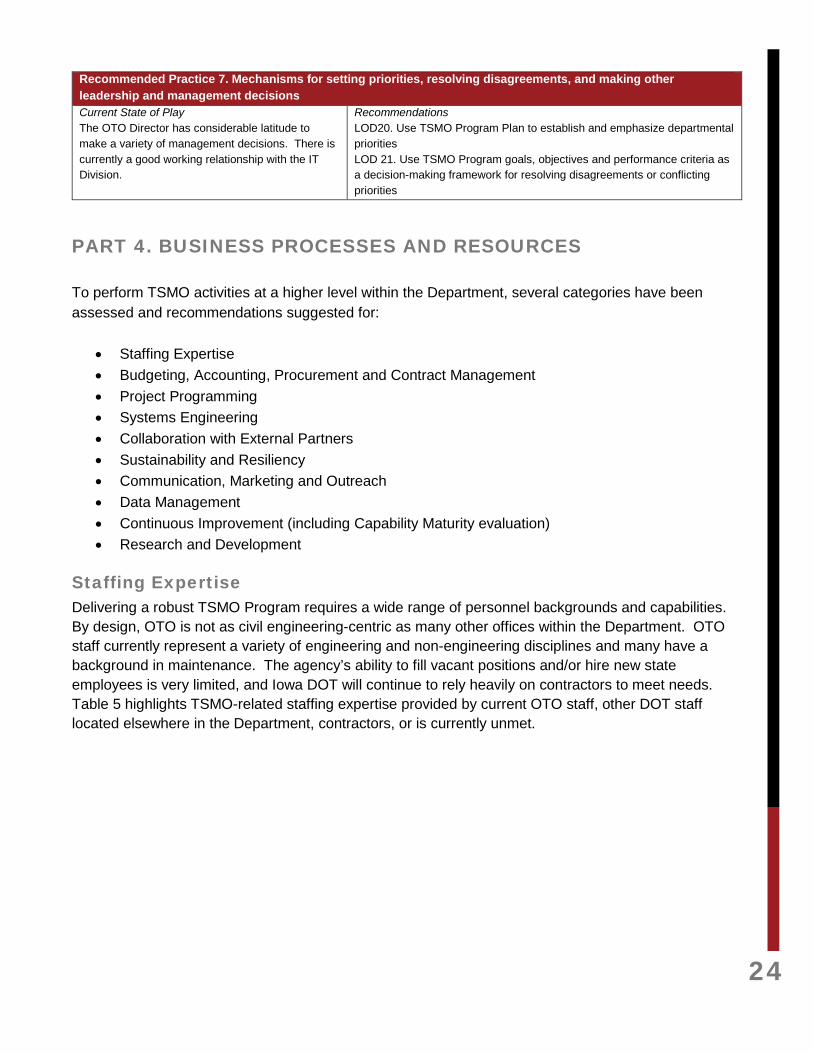
Recommended Practice 7. Mechanisms for setting priorities, resolving disagreements, and making other leadership and management decisions Current State of Play The OTO Director has considerable latitude to make a variety of management decisions. There is currently a good working relationship with the IT Division.
Recommendations LOD20. Use TSMO Program Plan to establish and emphasize departmental priorities LOD 21. Use TSMO Program goals, objectives and performance criteria as a decision-making framework for resolving disagreements or conflicting priorities
PART 4. BUSINESS PROCESSES AND RESOURCES To perform TSMO activities at a higher level within the Department, several categories have been assessed and recommendations suggested for:
• Staffing Expertise • Budgeting, Accounting, Procurement and Contract Management • Project Programming • Systems Engineering • Collaboration with External Partners • Sustainability and Resiliency • Communication, Marketing and Outreach • Data Management • Continuous Improvement (including Capability Maturity evaluation) • Research and Development
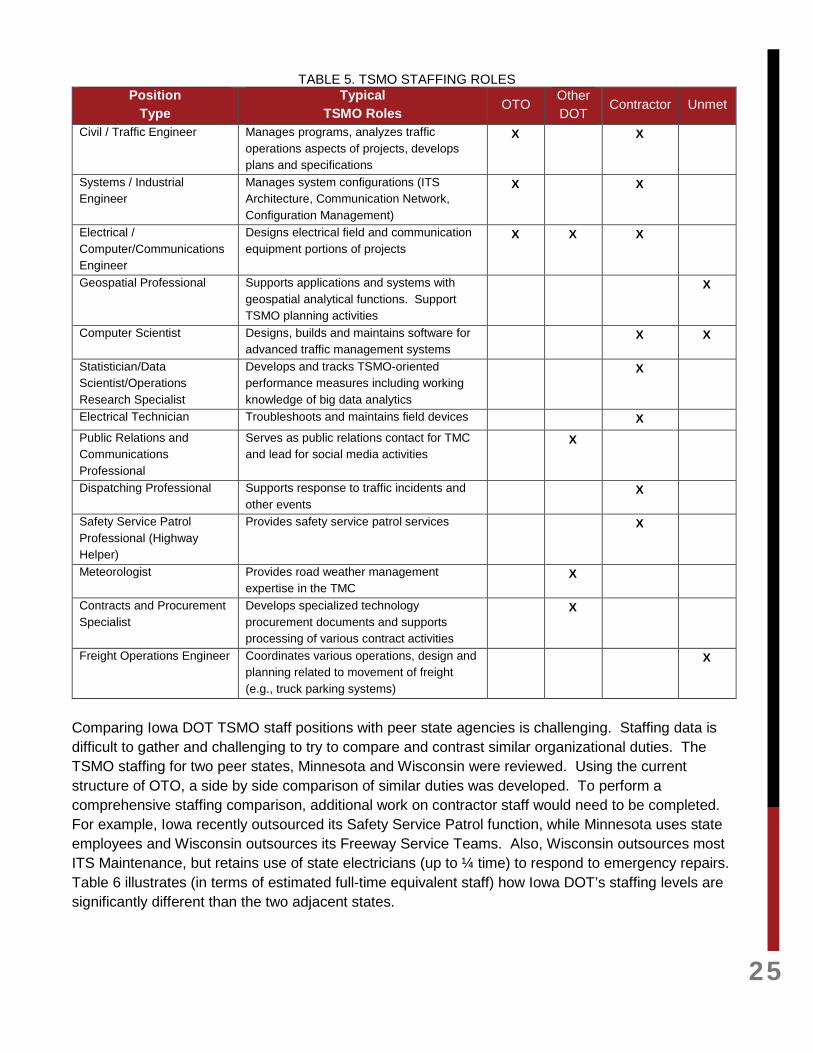
Staffing Expertise Delivering a robust TSMO Program requires a wide range of personnel backgrounds and capabilities. By design, OTO is not as civil engineering-centric as many other offices within the Department. OTO staff currently represent a variety of engineering and non-engineering disciplines and many have a background in maintenance. The agency’s ability to fill vacant positions and/or hire new state employees is very limited, and Iowa DOT will continue to rely heavily on contractors to meet needs. Table 5 highlights TSMO-related staffing expertise provided by current OTO staff, other DOT staff located elsewhere in the Department, contractors, or is currently unmet.
25
TABLE 5. TSMO STAFFING ROLES Position
Type Typical
TSMO Roles OTO Other DOT
Contractor Unmet
Civil / Traffic Engineer Manages programs, analyzes traffic operations aspects of projects, develops plans and specifications
X X
Systems / Industrial Engineer
Manages system configurations (ITS Architecture, Communication Network, Configuration Management)
X X
Electrical / Computer/Communications Engineer
Designs electrical field and communication equipment portions of projects
X X X
Geospatial Professional Supports applications and systems with geospatial analytical functions. Support TSMO planning activities
X
Computer Scientist Designs, builds and maintains software for advanced traffic management systems
X X
Statistician/Data Scientist/Operations Research Specialist
Develops and tracks TSMO-oriented performance measures including working knowledge of big data analytics
X
Electrical Technician Troubleshoots and maintains field devices X Public Relations and Communications Professional
Serves as public relations contact for TMC and lead for social media activities
X
Dispatching Professional Supports response to traffic incidents and other events
X
Safety Service Patrol Professional (Highway Helper)
Provides safety service patrol services X
Meteorologist Provides road weather management expertise in the TMC
X
Contracts and Procurement Specialist
Develops specialized technology procurement documents and supports processing of various contract activities
X
Freight Operations Engineer Coordinates various operations, design and planning related to movement of freight (e.g., truck parking systems)
X
Comparing Iowa DOT TSMO staff positions with peer state agencies is challenging. Staffing data is difficult to gather and challenging to try to compare and contrast similar organizational duties. The TSMO staffing for two peer states, Minnesota and Wisconsin were reviewed. Using the current structure of OTO, a side by side comparison of similar duties was developed. To perform a comprehensive staffing comparison, additional work on contractor staff would need to be completed. For example, Iowa recently outsourced its Safety Service Patrol function, while Minnesota uses state employees and Wisconsin outsources its Freeway Service Teams. Also, Wisconsin outsources most ITS Maintenance, but retains use of state electricians (up to ¼ time) to respond to emergency repairs. Table 6 illustrates (in terms of estimated full-time equivalent staff) how Iowa DOT’s staffing levels are significantly different than the two adjacent states.

26
TABLE 6. COMPARATIVE PEER AGENCY STAFFING Iowa DOT Minnesota DOT Wisconsin DOT
Management and Support Management 2 4 12
Administrative Support 1 1 0 Systems and Technical Services
Engineers 4 10.5 9 Technicians/Electricians 1 30 7.5*
Other Professionals 0 0 0.5 Traffic Incident and Emergency Management
Engineers 0 0 1 Technicians/Electricians 0 0 0
Other Professionals 6 20** 0 Traffic Management Center Services
Engineers 0 1 4 Technicians/Electricians 0 6 1
Other Professionals 2 6 1 Research and Decision Support
Engineers 0 4 0 Technicians/Electricians 0 0 1
* Estimated at ¼ time of District Electricians ** Freeway Incident Safety Team Staff TSMO positions require individuals with the necessary knowledge, skills, abilities and other characteristics to meet fluctuating operational demands and embrace technology changes. Iowa DOT should develop a comprehensive TSMO staffing plan to meet the challenges in assembling a specialized workforce. A staffing plan would identify the various TSMO positions and capabilities across the agency, offer a forecast of future demand, assess resource availability, and present strategies to meet any shortfall. The staffing plan should fulfill five key objectives:
• Ensure appropriate staffing levels, including both DOT and contract employees • Ensure the organization has both DOT and contractor staff with required knowledge, skills,
abilities, and other characteristics in the appropriate positions when needed • Ensure the organization adapts to both internal and external changes • Provide a systematic approach for staff resource management • Provide a shared vision of staff resource functions
It is also essential that a staffing plan offer a defined career ladder for identified positions to foster job satisfaction and support employee retention efforts. The implications of not having an efficiently operating TSMO workforce can be far reaching, affecting incident response rates, traveler information, and traffic congestion. Table 7 catalogs current TSMO related positions and also highlights current position needs that should be considered a near-term priority, whether through using state employees or outsourced contractors.

27
TABLE 7. TSMO STAFFING NEEDS POSITION STATUS
MANAGEMENT AND SUPPORT Office Director Position Filled
Secretary Position Filled
TSMO Manager POSITION PROPOSED
Contract Administration Manager Provided via Office of Design Support
SYSTEMS AND TECHNICAL SERVICES Lead Worker Position Filled
ATIS Administrator Position Filled
ITS Administrator Position Filled
ITS Deployment and Maintenance Engineer Position Filled
ITS Deployment and Maintenance Technician Position Filled
Computer/Electrical Engineer CURRENT NEED / NO POSITION AVAILABLE
ITS Maintenance Contractor Positions Filled
ITS Planner CURRENT NEED / NO POSITION AVAILABLE
Traffic Critical Projects Program Manager CURRENT NEED / Currently Shared Duties
Traffic Signal Systems Engineer CURRENT NEED / NO POSITION AVAILABLE
TRAFFIC INCIDENT AND EMERGENCY MANAGEMENT Lead Worker Position Filled
Emergency Management Position Filled
Emergency Management Position Filled
Statewide Traffic Incident Management Position Filled
Regional TIM Coordination Position Filled
Regional TIM Coordination Position Filled
Regional TIM Coordination CURRENT NEED / NO POSITION AVAILABLE
Highway Helper Field Staff Contractor Positions Filled
RESEARCH AND DECISION SUPPORT Geospatial Program Manager CURRENT NEED / NO POSITION AVAILABLE
Academic Staff Researcher (CTRE) CURRENT NEED / NO POSITION AVAILABLE
Statistician/Data Scientist/Ops Researcher CURRENT NEED / NO POSITION AVAILABLE
Freight Operations Engineer CURRENT NEED / NO POSITION AVAILABLE
TRAFFIC MANAGEMENT CENTER SERVICES Lead Worker Position Filled
Lead TMC Operator Position Filled
TMC Operator Contractor Positions Filled
Highway Helper Dispatcher Contractor Position Filled
Systems Manager Contractor Position Filled
Surface Transportation Weather Specialist Provided via Office of Maintenance
TMC Public Information Specialist Provided via Office of Strategic Communications
DISTRICTS
District TSMO Management CURRENT NEED / Evaluate Assistant District Engineer or Other Mgmt. Level
District TSMO/Traffic Operations Engineer CURRENT NEED / 1 Position Filled
District Traffic Technicians 6 Positions Filled

28
Staffing (S) Recommendations: S1. Identify skill sets needed to deliver services and meet program goals by developing a comprehensive staffing plan, including both DOT and contract employees S2. Further clarify the roles and related staffing needs between Central Office and Districts S3. Enhance skills through professional capacity building and additional personnel training S4. Tie staffing levels and associated knowledge, skills, abilities, and other characteristics to Service Layer Plans
Budgeting, Accounting, Procurement and Contract Management BUDGETING AND ACCOUNTING Currently, there is not a single, dedicated funding stream for TSMO projects and activities. Budgeting and funding allocations for TSMO come from a variety of sources, including the “Traffic Control Devices” line at the back of the 5-Year Program, project construction funds for deployments, and the outside services fund. Figure 11 illustrates the current TSMO budget cycle. In general, budgeting for the next state fiscal year starts every November, with final budget and decisions following in January, and Transportation Commission approval typically occurring in May or June.
FIGURE 11. CURRENT TSMO BUDGET CYCLE PROCESS

29
Stand-alone ITS deployments are generally programmed as projects in the 5-Year Program. ITS installed as part of highway improvement projects should be part of larger construction project funding. Outside services is another resource frequently used to hire vendors and consulting firms to support specialized planning, design and implementation of TSMO-related strategies. The current level of TSMO funding at Iowa DOT is approximately $20-$21 million per year for Fiscal Years 2016 and 2017. Because funding for operations activities has been distributed in the past, there are no consolidated return on investment measures for the Department’s previous TSMO investments. PROCUREMENT AND CONTRACT MANAGEMENT OTO has been successful in procuring unique technical services to support its TSMO activities in close coordination with the Department’s Purchasing Section. Typically, OTO staff has taken the lead in developing technical requirements, and the Purchasing Section has provided administrative process support. Given the rapid changes in technology and the specialized procurement methods necessary for ITS, it is imperative that OTO work with the Purchasing Section to develop methods to expedite bid, proposal and contracting processes. With limitations on additional new state staff, there will likely be a growing reliance on consultants to develop and sustain the TSMO Program. Developing methods to expedite selection and negotiation of contracts is desirable. The Department’s recent consolidation of consultant and contract administration into the Office of Design offers opportunities to streamline procurement, contracting, negotiation, and invoicing activities. Budgeting, Accounting, Procurement and Contract Management (BAP) Recommendations: BAP1. Continue to investigate funding sources and mechanisms to provide for program planning and sustainable TSMO funding BAP2. Transition TSMO budgeting activities to a five-year cycle, consistent with the 5-Year Program BAP3. Clarify technical specification roles of OTO, Purchasing, and Office of Design staff BAP4. Diversify procurement process expertise in OTO by designating staff authorized to carry out development of RFPs on behalf of OTO BAP5. Establish streamlined processes for consultant contracting and associated accounts payable activities
Project Programming The programming of projects focuses on the funding and scheduling of projects to meet the Department’s goals and priorities. TSMO activities include a range of services, activities and projects that do not fit neatly into traditional project programming. TSMO Program planning provides an opportunity to develop a process for identifying funding needs to deploy projects, as well as ongoing services and operations. In an organization traditionally focused on construction, the need to develop a process for prioritizing and funding programmatic activities that are non-construction in nature is important to the success of the TSMO Program. Project Programming (PP) Recommendations:

30
PP1. Work with the Office of Program Management and the Project Scheduling Engineer to streamline the process for integrating ITS deployments into highway improvement projects in the 5-Year Program PP2. Identify alternative funding opportunities, such as federal or state grants, public-private partnerships, and research funding PP3. Support efforts by MPOs to incorporate operations into regional planning
Systems Engineering One of the keys to sustaining a rapidly evolving TSMO program is to include systems engineering in planning and design. Iowa is committed to systems engineering approaches with deployments because systems engineering reduces project risk (cost and schedule) and product risk (performance, quality, functionality). The V-diagram shown in Figure 12 highlights the steps of the systems engineering process.
FIGURE 12. SYSTEMS ENGINEERING “V” DIAGRAM
Various aspects and degrees of systems engineering are performed within Iowa DOT. For example, the active traffic management elements being proposed for the Council Bluffs Interstate Reconstruction projects are using the systems engineering process to define the concept of operations. Other aspects of systems engineering that should be considered important to the continued sustainability of TSMO activities include improved configuration management procedures and ITS as-built management information systems. OTO and its predecessors developed a variety of ITS Architecture and Regional Traffic Incident Management Plans. In 2001, a Final Rule/Final Policy (23 CFR 940) from FHWA and FTA ensured that ITS projects carried out using funds from the federal Highway Trust Fund conform to the National ITS Architecture and applicable ITS standards through development of regional ITS architectures and using a systems engineering process for ITS project development. While the original Regional ITS
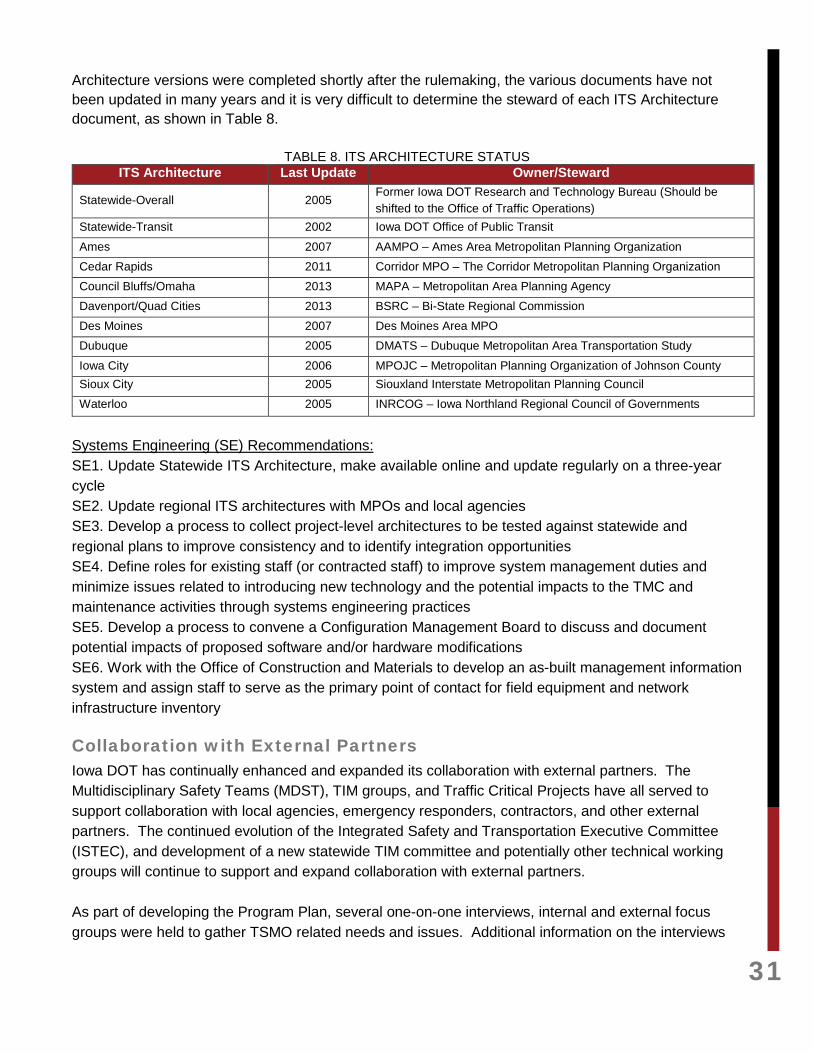
31
Architecture versions were completed shortly after the rulemaking, the various documents have not been updated in many years and it is very difficult to determine the steward of each ITS Architecture document, as shown in Table 8.
TABLE 8. ITS ARCHITECTURE STATUS ITS Architecture Last Update Owner/Steward
Statewide-Overall 2005 Former Iowa DOT Research and Technology Bureau (Should be shifted to the Office of Traffic Operations)
Statewide-Transit 2002 Iowa DOT Office of Public Transit
Ames 2007 AAMPO – Ames Area Metropolitan Planning Organization Cedar Rapids 2011 Corridor MPO – The Corridor Metropolitan Planning Organization Council Bluffs/Omaha 2013 MAPA – Metropolitan Area Planning Agency Davenport/Quad Cities 2013 BSRC – Bi-State Regional Commission Des Moines 2007 Des Moines Area MPO Dubuque 2005 DMATS – Dubuque Metropolitan Area Transportation Study
Iowa City 2006 MPOJC – Metropolitan Planning Organization of Johnson County Sioux City 2005 Siouxland Interstate Metropolitan Planning Council Waterloo 2005 INRCOG – Iowa Northland Regional Council of Governments
Systems Engineering (SE) Recommendations: SE1. Update Statewide ITS Architecture, make available online and update regularly on a three-year cycle SE2. Update regional ITS architectures with MPOs and local agencies SE3. Develop a process to collect project-level architectures to be tested against statewide and regional plans to improve consistency and to identify integration opportunities SE4. Define roles for existing staff (or contracted staff) to improve system management duties and minimize issues related to introducing new technology and the potential impacts to the TMC and maintenance activities through systems engineering practices SE5. Develop a process to convene a Configuration Management Board to discuss and document potential impacts of proposed software and/or hardware modifications SE6. Work with the Office of Construction and Materials to develop an as-built management information system and assign staff to serve as the primary point of contact for field equipment and network infrastructure inventory
Collaboration with External Partners Iowa DOT has continually enhanced and expanded its collaboration with external partners. The Multidisciplinary Safety Teams (MDST), TIM groups, and Traffic Critical Projects have all served to support collaboration with local agencies, emergency responders, contractors, and other external partners. The continued evolution of the Integrated Safety and Transportation Executive Committee (ISTEC), and development of a new statewide TIM committee and potentially other technical working groups will continue to support and expand collaboration with external partners. As part of developing the Program Plan, several one-on-one interviews, internal and external focus groups were held to gather TSMO related needs and issues. Additional information on the interviews
32
and focus groups are located in Appendices B and C. One area of concern identified in the focus group meetings was the need to improve coordination between local agencies responsible for the operation and maintenance of traffic signals on the State Highway system and Iowa DOT. Also, adaptive signal control systems would benefit traffic flow during diversions. It is recommended that the statewide protocol for signal maintenance on State Highways be reviewed and applied consistently throughout the State. Collaboration with external partners such as emergency response agencies and local public works agencies could be enhanced through multi-agency, multidisciplinary training, such as Strategic Highway Research Program (SHRP2) training, Iowa Law Enforcement Academy (ILEA) training focused on traffic incident response, and training for Multidisciplinary Safety Teams. Training opportunities should be identified and recommended for each of the eight Service Layer Plans to support their activities and initiatives. There is also an opportunity to engage external partners more proactively through updates to regional ITS architectures. Collaboration with External Partners (CEP) Recommendations: CEP1. Provide leadership and administrative support to sustain routine MDST TIM coordination in close coordination with Iowa DOT Districts, InTrans, the Office of Systems Planning and the Office of Traffic and Safety CEP2. Develop tools such as websites and social media channels for sharing information across groups CEP3. Identify opportunities to engage local agencies responsible for operating traffic signal systems to discuss integrated corridor management (with Office of Traffic and Safety as the lead) CEP4. Include training needs and opportunities in each of the eight Service Layer Plans. CEP5. Work with Iowa DOT General Counsel to enable entering into agreements with emerging technology companies to improve mobility and safety
Programmatic and Administrative Processes Because the TSMO Program Plan is a new concept in Iowa DOT, many have asked, “How does the TSMO plan fit into DOT’s existing planning processes?” Figure 4 highlights the wide range of basic and cross-cutting activities performed by Iowa DOT, many of which are related to planning, building, maintaining, and operating the highway system. TSMO is envisioned as a basic or core function of the Iowa DOT. It is intended to compliment and build upon other core functions performed by the agency in the context of cross-cutting activities such as performance management, asset management, and workforce development. The TSMO plan is considered a specialized plan that fits into the Office of Systems Planning category of “System/Modal Plans”. Additionally, specific TSMO functions and activities permeate other planning activities such as the Long Range Transportation Plan, project feasibility studies, project evaluation, and the 5-Year Program. A key effort to further integrate TSMO into project design is the creation of an American Association of State Highway and Transportation Officials (AASHTO) guidance manual specific to operations and system management (currently under development).

33
With the goal of integrating as much as possible with existing DOT planning activities, several TSMO-related activities were superimposed on the Office of Systems Planning long range planning diagram (previously shown in Figure 7). As shown in Figure 13, the TSMO related activities include:
• TSMO Plan (Strategic and Program Plans) – Proposed to fit with Office of Systems Planning category of “System/Modal Plans”
• System Evaluation Tools – The modified Interstate Condition Evaluation (ICE) methodology integrates operations criteria to help prioritize corridors throughout the state in terms of operational issues; the modified tool is referred to as ICE-OPS (described further in Part 6). Other tools anticipated for routine use include the INVEST Sustainability and the Capability Maturity Model self-assessment tools
• TSMO Service Layer Plans – Individual, yet-to-be developed plans that will recommend specific activities, locations and services
• TSMO Service Layer Evaluation Tools – Yet-to-be developed tools to drive development of the Service Layers
• 5-Year Program Integration – Integrate TSMO strategies into individual highway improvement projects at the project concept stage

34
FIGURE 13. TSMO PROGRAM PLAN AND SYSTEMS PLANNING PROCESSES
In order to sustain momentum and assist with budgeting, Table 9 presents a proposed update cycle for the TSMO Program. It is proposed the overall TSMO Plan be updated every five years, with subcomponent activities completed on an annual or biannual basis. An Accomplishment Year Plan, a 5-Year Annual Budget and an ICE-OPS Analysis will be completed on an annual basis. The FY2016 Accomplishment Plan is located in Appendix D. With a commitment to the Service Layer Plans, in any

35
given year, two or three planning projects will be performed. The initial Service Layer planning projects will likely need to be completed with consultant support. Depending on the complexity of technological advancements, future updates could be performed by Iowa DOT staff.
TABLE 9. PROPOSED TSMO PROGRAM PLAN AND SERVICE LAYER PLAN UPDATE CYCLE
Plan Description FY16 FY17 FY18 FY19 FY20 FY21 FY22 FY23 FY24 FY25 FY26
TSMO Strategic and Program Plans
Accomplishment Year Plan
5-Year Annual Budget Forecast w/ ICE-OPS
INVEST Sustainability Assessment
CMM Self-Assessment
SL1. Traffic Management Center
SL2. ITS and Communications
SL3. Traveler Information
SL4. Traffic Incident Management
SL5. Emergency Transportation Operations
SL6. Work Zone Management
SL7. Active Transportation and Demand Management
SL8. Connected and Autonomous Vehicle
Programmatic and Administrative Support (PAS) Recommendations: PAS1. Assign OTO staff to engage Office of Systems Planning to continue refining the ICE-OPS analysis on an annual basis, including expansion to the 9,400 mile Primary Roadway Network PAS2. Assign staff or hire consultant support to perform an annualized TSMO update and to routinely monitor progress of Service Layer Plan development to ensure consistency with the overall TSMO Program Plan
Sustainability and Resiliency The essence of TSMO activities is rooted in sustainability and resiliency. When offered a chance to pilot a new FHWA-developed sustainability tool called the Infrastructure Voluntary Evaluation Sustainability Tool (INVEST), the OTO agreed to test it. INVEST (https://www.sustainablehighways.org/) was developed by FHWA as a practical, web-based collection of voluntary best practices criteria, designed to help transportation agencies integrate

36
sustainability into their programs (i.e., policies, processes, procedures, and practices) and projects. The three modules of INVEST include:
• System Planning • Project Development • Maintenance and Operations
As part of the TSMO Program Plan, the INVEST Maintenance and Operations Module was tested. Specifically, the Maintenance and Operations Module comprises 14 best practice criteria, including four dealing with internal operations and ten focused on maintenance and operations of the highway system, as follows: • OM-01 Internal Sustainability Plan • OM-02 Electrical Energy Efficiency and Use • OM-03 Vehicle Fuel Efficiency and Use • OM-04 Recycle and Reuse • OM-05 Safety Management • OM-06 Environmental Commitments
Tracking System • OM-07 Pavement Management System • OM-08 Bridge Management System
• OM-09 Maintenance Management System • OM-10 Highway Infrastructure Preservation
and Maintenance • OM-11 Traffic Control Infrastructure
Maintenance • OM-12 Road Weather Management
Program • OM-13 Transportation Management and
Operations • OM-14 Work Zone Traffic Control
The last four best practice criteria (OM-11 thru OM-14) were tested as part of the TSMO Program Plan development. Two workshops were held; the first workshop was internally focused, while the other included some external partners (e.g., MPOs and local agency traffic engineering departments) that may be interested in using INVEST. Table 10 highlights the outcomes of the scoring discussions. For example, a score of 4 out of 11 in Traffic Control Infrastructure Maintenance suggests there is opportunity for improvement, while a score of 15 out of 15 in the Road Weather Management category suggests Iowa is doing a great job, and in many ways a national leader, from a sustainability perspective.
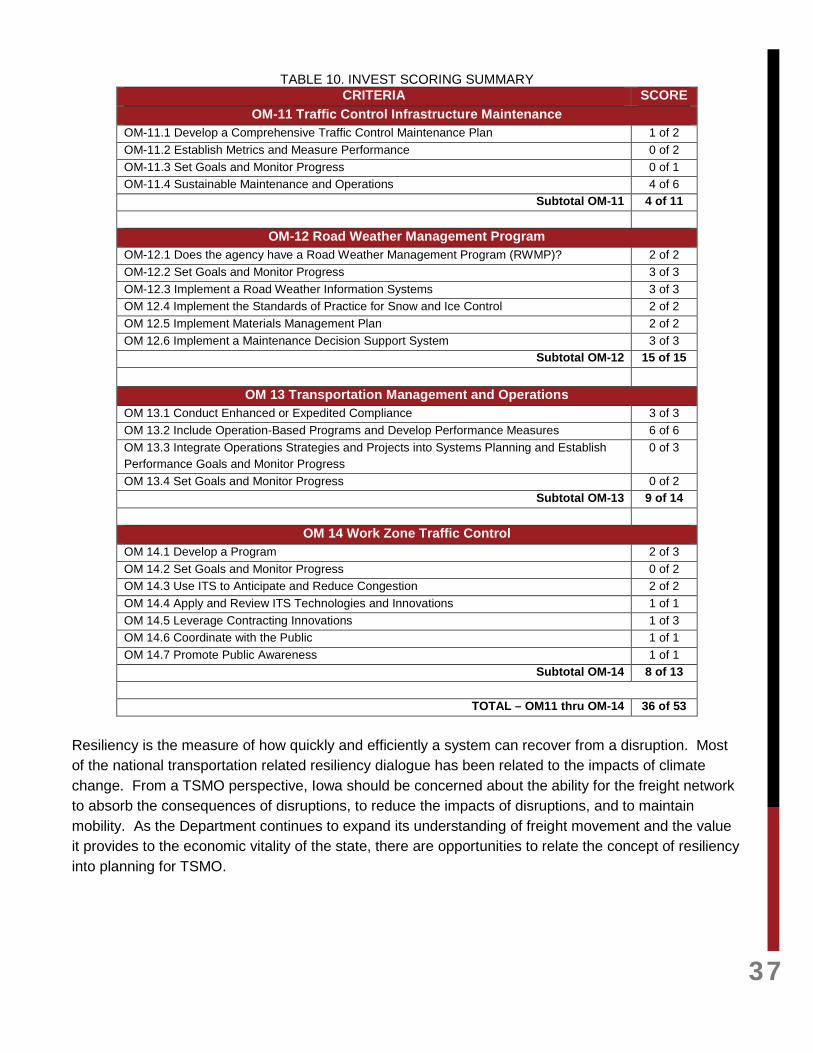
37
TABLE 10. INVEST SCORING SUMMARY CRITERIA SCORE
OM-11 Traffic Control Infrastructure Maintenance OM-11.1 Develop a Comprehensive Traffic Control Maintenance Plan 1 of 2 OM-11.2 Establish Metrics and Measure Performance 0 of 2 OM-11.3 Set Goals and Monitor Progress 0 of 1 OM-11.4 Sustainable Maintenance and Operations 4 of 6
Subtotal OM-11 4 of 11
OM-12 Road Weather Management Program OM-12.1 Does the agency have a Road Weather Management Program (RWMP)? 2 of 2 OM-12.2 Set Goals and Monitor Progress 3 of 3 OM-12.3 Implement a Road Weather Information Systems 3 of 3 OM 12.4 Implement the Standards of Practice for Snow and Ice Control 2 of 2 OM 12.5 Implement Materials Management Plan 2 of 2 OM 12.6 Implement a Maintenance Decision Support System 3 of 3
Subtotal OM-12 15 of 15
OM 13 Transportation Management and Operations OM 13.1 Conduct Enhanced or Expedited Compliance 3 of 3 OM 13.2 Include Operation-Based Programs and Develop Performance Measures 6 of 6 OM 13.3 Integrate Operations Strategies and Projects into Systems Planning and Establish Performance Goals and Monitor Progress
0 of 3
OM 13.4 Set Goals and Monitor Progress 0 of 2 Subtotal OM-13 9 of 14
OM 14 Work Zone Traffic Control
OM 14.1 Develop a Program 2 of 3 OM 14.2 Set Goals and Monitor Progress 0 of 2 OM 14.3 Use ITS to Anticipate and Reduce Congestion 2 of 2 OM 14.4 Apply and Review ITS Technologies and Innovations 1 of 1 OM 14.5 Leverage Contracting Innovations 1 of 3 OM 14.6 Coordinate with the Public 1 of 1 OM 14.7 Promote Public Awareness 1 of 1
Subtotal OM-14 8 of 13
TOTAL – OM11 thru OM-14 36 of 53 Resiliency is the measure of how quickly and efficiently a system can recover from a disruption. Most of the national transportation related resiliency dialogue has been related to the impacts of climate change. From a TSMO perspective, Iowa should be concerned about the ability for the freight network to absorb the consequences of disruptions, to reduce the impacts of disruptions, and to maintain mobility. As the Department continues to expand its understanding of freight movement and the value it provides to the economic vitality of the state, there are opportunities to relate the concept of resiliency into planning for TSMO.

38
Sustainability and Resiliency Recommendations:
SR1. Continue using INVEST as a tool to assess and encourage sound sustainability practices SR2. Develop a Resiliency Index for the entire Interstate network
Communications, Marketing, and Outreach Iowa DOT’s Vision – Smarter, Simpler, Customer-Driven – requires a clear understanding of customer needs and an ongoing focus on communication, marketing and outreach. Iowa DOT’s Office of Strategic Communications is responsible for public communication and outreach. They focus on traveler information and support planning, construction and operations efforts to engage the public and provide information. The TSMO Program can support this mission through informing and educating stakeholders and promoting operations activities to internal and external customers. Coordination and collaboration with Strategic Communications and TSMO-specific outreach activities will develop support from the public, partners and decision makers for the TSMO Program. Communications, Marketing and Outreach Recommendations: COM1. Develop business processes for communicating with and educating internal and external customers in coordination with the Office of Strategic Communications COM2. Develop an Iowa TSMO online presence beyond Iowa 511, including policies, procedures and interactive maps, to educate and inform customers about mobility on Iowa’s transportation system. COM3. Develop a quarterly mobility report to clearly illustrate the on-going performance of Iowa’s transportation system
Data Management One of the concepts often associated with systems management and ITS deployment is “data rich and information poor,” which means organizations collect significant amounts of data but rarely use it to improve how they do business. Answering simple questions, such as how many times has the agency closed a stretch of highway, can become a tedious effort. There are four distinct areas where data management can be improved:
• GIS – Almost every piece of data generated by OTO should have some type of geocoded characteristic
• Data Archiving and Curation – An emerging discipline that goes beyond archiving information is curating data so that it is useful when it needs to be used to help aid in business decisions. In this context, data curation is defined as processing raw data, performing quality assurance procedures, imputing missing data based on historical trends, and repackaging the information in a standardized format.
• Practitioner Data Query Tools Development – Tools should be developed that directly aid in performance measurement and, ultimately, performance management so that Iowa DOT has the capability to understand the performance of the transportation system at any given time without the need to await lengthy data processing methods.
• “Big Data” Analytics – Develop capabilities to leverage emerging and non-traditional data sources to identify operational trends and opportunities to support TSMO. The purpose of these

39
analytics is to create insights and understanding from information so that better decisions are possible and so that the public has a clear understanding of the performance of the transportation system.
Data Management (DM) Recommendations: DM1. Provide GIS training for staff and supplement with on-call consultant or in-house expertise DM2. Develop processes and capabilities for using big data to support performance management DM3. Develop a process to determine how existing and future data sources will be analyzed, archived, curated and accessed DM4. Extend and expand expertise and IT infrastructure capacity through university partners, such as InTrans/CTRE DM5. Develop a “TSMO Data Store” to enable open access of archived and near-real-time information to the public and private sectors
Continuous improvement (including Capability Maturity Model) Continuous improvement enables an organization to adapt to rapid change. Continuous improvement programs, such as Lean Six Sigma “Green Belt” certification, can have a significant effect. Lean thinking requires the whole organization to understand some of the basic principles. The rapid emergence of automated/connected vehicles, broader use of social media for traveler information, “Big Data” for traffic management analytics, and advances in telecommunications are just a few examples of why there needs to be broader awareness of continuous improvement principles and practices in order to adapt to some of the new technologies that the TSMO Program will be called upon to support. AASHTO and FHWA are supporting the implementation of a suite of Strategic Highway Research Program 2 (SHRP 2) products designed to address key agency business processes and institutional arrangements. These processes and arrangements are critical to the success of TSMO programs and projects at state, regional and local levels.
One such SHRP 2 product, the L06 study “Institutional Architectures to Advance Operational Strategies,” resulted in development of an institutional capability maturity model (CMM) framework that identified all the elements needed to self-evaluate and continually improve activities one level at a time in the six key dimensions of business processes, systems and technology, performance management, culture, organization and workforce, and collaboration. The CMM methodology was originally developed to assess Department of Defense software contractor capabilities, but has proven successful in defining opportunities for continuous improvement in a wide range of organizations. Table 11 highlights the six critical dimensions of capability developed as part of the research.

40
TABLE 11. SIX CRITICAL DIMENSIONS OF CAPABILITY Dimension Dimension Activity Examples
Business Processes Formal scoping, planning, programming and budgeting Systems & Technology Systems architecture, standards, inter-operability and standardization, and
documentation Performance Measurement Measures definition, data acquisition, analysis and utilization Culture Technical understanding, leadership, policy commitment, outreach and program
authority Organization/Staffing Organizational structure, staff capacity, development and retention Collaboration Relationships with public safety agencies, local governments, MPOs and private sector
As part of the self-evaluation, the six dimensions are assessed based on four incremental levels of capability (see Figure 14). The levels range from ad hoc activities (Level 1) to those more integrated into formal programs (Level 4). They are used to identify the strengths and weaknesses within each dimension, leading to the development of strategies and action items to improve capability.
FIGURE 14. TSMO CAPABILITY LEVELS
In October 2013, FHWA and AASHTO sponsored a capability maturity self-assessment workshop for Iowa DOT to develop a consensus evaluation of ongoing TSMO efforts. During the workshop, the group, comprised of Iowa DOT senior leadership, identified current levels of capability regarding the key processes, organization, staff and collaboration issues that may assist the Department in maturing its capabilities to deliver TSMO in the future. Workshop outcomes are presented in Table 12.
LEVEL 1
Performed• Activities &
relationships ad hoc• Champion-driven
LEVEL 2
Managed• Processes developing• Staff training• Limited accountability
LEVEL 3
Integrated• Process documented• Performance measured• Organization/
partners aligned• Program budgeted
LEVEL 4
Optimized• Performance-based
improvement• Formal program• Formal partnerships
Most Agencies Today
Goal for the Future

41
TABLE 12. 2013 CMM WORKSHOP SELF-ASSESSMENT OUTCOMES Dimension Iowa’s Level Level Criteria Description
Business Processes 2- Consensus regional approach developed regarding TSMO goals, deficiencies, B/C, networks, strategies and common priorities.
Systems & Technology 2 Regional con-ops and architectures developed and documented with costs included; appropriate procurement process employed.
Performance Measurement 1 Some outputs measured and reported. Culture 2+ Iowa DOT’s senior management understands TSMO business case
and educates decision makers/public. Organization/Staffing 3- TSMO managers have direct report to top management; job specs,
certification and training for core positions. Collaboration 2.75 Objectives, strategies and performance measures aligned among
organized key players (transportation and public safety agencies) with after-action debriefing.
Rationalization/sharing/formalization of responsibilities among key players through co-training, formal agreements and incentives.
In addition to rating Iowa DOT’s capabilities by dimension, several specific concerns and challenges were noted during the workshop:
• Incident management – Improving coordination and information sharing between Iowa DOT and emergency responders; standardizing processes for using data to perform post assessments of incidents; and, improving information dissemination to the public.
• Cultural and attitudinal barriers – Facilitating an ideological shift from construction-oriented projects to asset operations and management; and, improving coordination between Iowa DOT and local agencies.
• Freight operations – Integrating freight into planning processes; improving coordination between different regional agencies (for freight through traffic) and operators (for freight mode shift); and, reducing traffic impacts of oversize loads.
As part of the development of this TSMO Program Plan, a second CMM self-assessment was performed as shown in Table 13. Since the TSMO Plan was developed and each dimension was evaluated at a more detailed level, some of the scores actually went down. The recommendations provided by this plan are intended to elevate scoring of each dimension to 3 (Integrated) or higher.

42
TABLE 13. 2015 CMM SELF-ASSESSMENT OUTCOMES Dimension Iowa’s Level Level Criteria Description
Business Processes 1.5 Significant unrealized opportunity to integrate TSMO into existing and new (e.g., Lane Closure System) business processes.
Systems & Technology 1.8 Con-ops and architectures developed on a project level, ad-hoc basis. Growing need to update regional ITS Architectures and formalize ITS deployment planning.
Performance Measurement 1 TMC Monthly Performance Reports step in the right direction. CTRE developing system-wide performance measures.
Culture 1 DOT’s senior management understands TSMO business case but a lot of work required to integrate TSMO further into the Department’s culture.
Organization/Staffing 2 Office established to serve as champion for TSMO with direct reports to top management. Heavy reliance on consultant support with limited ability to add state staff.
Collaboration 1.8 Sustained partnerships with public safety and emergency management. Most other collaboration is project driven.
Continuous Improvement with Capability Maturity Model (CI) Recommendations: CI1. Lean Principles or other continuous improvement training for OTO staff CI2. Provide frequent Performance Measures Reports for internal and external audiences CI3. Complete the Capability Maturity Model Self-Assessment on a 5-year basis
Research and Development Iowa DOT has a long history of being a leader in research in coordination with its major state universities. The OTO has established a master contract with the Center for Transportation Research and Education (CTRE) at Iowa State University in Ames to provide a variety of services, with an emphasis on supporting performance measurement, decision support and TSMO-oriented evaluation. One of the early projects completed in 2014 was a training facility with ATMS capabilities at the CTRE offices to allow for future training of students and TMC operators. Iowa DOT also established a master contract with the University of Iowa to assist with developing Iowa’s Connected and Autonomous Vehicle strategy.
If designed properly, working with universities can be mutually beneficial in that the Department gains access to highly trained faculty, academic staff, students and computing infrastructure with very low overhead (compared to traditional engineering consulting). The university partner typically is able to support graduate level research students, generate publishable research, and possibly spin off companies that generate economic development opportunities. Some partnerships around the country have even placed university staff on a full or part-time basis at state DOT offices. These approaches offer benefits to both organizations and ultimately improve the TSMO Program while helping to train the next generation of TSMO professionals.
Historically, a majority of research in the TSMO area in Iowa has been performed by CTRE. The University of Iowa in Iowa City offers additional expertise in human factors, especially since it houses the National Advanced Driving Simulator. Other university-based simulators have been used to test a variety of design concepts such as new highway geometrics, traffic control concepts (e.g., flashing yellow arrow) and complicated visual environments (e.g., tunnels).

43
Research and Development Recommendations RD1. Expand the role of CTRE in providing part-time or full-time research staff on site in OTO to assist with performance measure and decision support development RD2. Establish a mechanism to test new equipment with industry partners and other agencies (e.g., traffic detection sensor test bed and a future TIM training facility)

44
PART 5. PERFORMANCE MANAGEMENT AND DECISION SUPPORT Moving Ahead for Progress in the 21st Century Act (MAP-21), the federal surface transportation and authorization bill passed in June 2012, established performance-based planning and programming to improve transportation decision-making and increase the accountability and transparency of Federal highway programs. MAP-21’s Section 1203 (Performance Management) established seven national TSMO performance goals for Federal highway programs, which are identified in Table 14.
TABLE 14. NATIONAL GOALS AND PERFORMANCE MANAGEMENT MEASURES National
Goal Area Goal
Description Safety To achieve a significant reduction in traffic fatalities and serious injuries on all public roads
Infrastructure Condition To maintain the highway infrastructure asset system in a state of good repair
Congestion Reduction To achieve a significant reduction in congestion on the National Highway System
System Reliability To improve the efficiency of the surface transportation system
Freight Movement and Economic Vitality
To improve the national freight network, strengthen the ability of rural communities to access national and international trade markets, and support regional economic development
Environmental Sustainability To enhance the performance of the transportation system while protecting and enhancing the natural environment
Reduced Project Delivery Delays To reduce project costs, promote jobs and the economy, and expedite the movement of people and goods by accelerating project completion through eliminating delays in the project development and delivery process, including reducing regulatory burdens and improving agencies’ work practices
Specifics on each MAP-21 performance measure are anticipated in the future through a series of formal rulemaking procedures with many of the final rules anticipated to be published in 2016. A state DOT’s failure to meet MAP-21 existing or future performance targets will not result in the restriction of Federal aid; however, the goal of the legislation was to see progress by both state transportation agencies and metropolitan planning organizations (MPOs) in coordinating and using performance measures to inform decision-making and provide taxpayers greater accountability for the use of public resources. MAP-21 contained strong language supporting TSMO. Both state transportation agencies and MPOs must consider projects and strategies that promote efficient system management and operations as part of the planning process. In addition, TSMO performance measures should align with MAP-21 goals and intent. The successor to MAP-21 is the Fixing America's Surface Transportation (FAST) Act, passed in December 2015, and it continues to support a variety use of TSMO strategies. For example, a Performance Management Data Support Program is to be created to develop, use, and maintain data sets and data analysis tools to assist states and metropolitan planning organizations in carrying out performance management analyses. TSMO is a program based on measuring performance. As Iowa DOT’s TSMO Program develops, it is critical that established management and operations objectives be outcome-driven and performance-based.
45
There are currently three areas for which performance measures for operations are being developed at various levels of intensity:
• Traffic Management Center – Creates a monthly report on a variety of activities performed by the TMC
• CTRE Research Activities – Currently working on a variety of systems oriented performance measures
• Iowa DOT Enterprise-Wide Performance Measures – A small subset of the 54 total measures are related to TSMO
Additionally, the Office of Maintenance created a winter operations dashboard to illustrate winter operations, and the Office of Traffic and Safety, along with the Office of Driver Services, track several measures related to crashes and fatalities. TRAFFIC MANAGEMENT CENTER MONTHLY PERFORMANCE REPORT The Department’s TMC collects traffic data to support real-time decisions during traffic incidents and archives the information for future use. A monthly report has been generated to describe trends the TMC is experiencing, with the intent of making modifications to policies, practices, or procedures to counter undesirable trends. The TMC has developed performance measures that use archived data to assess performance of the traffic operations program, including:
• Incident Response • TMC Performance • TMC Operations Staff • ITS Maintenance Online Management System (MOMS) • Traffic Incident Management and Highway Helper • Traffic Critical Projects • Traveler Information
Incident Response Incidents are defined as any non-recurring event that causes a reduction of roadway capacity or an abnormal increase in demand. Clearing incidents rapidly is crucial in minimizing congestion, reducing secondary crashes, and improving safety for both emergency responders and travelers.
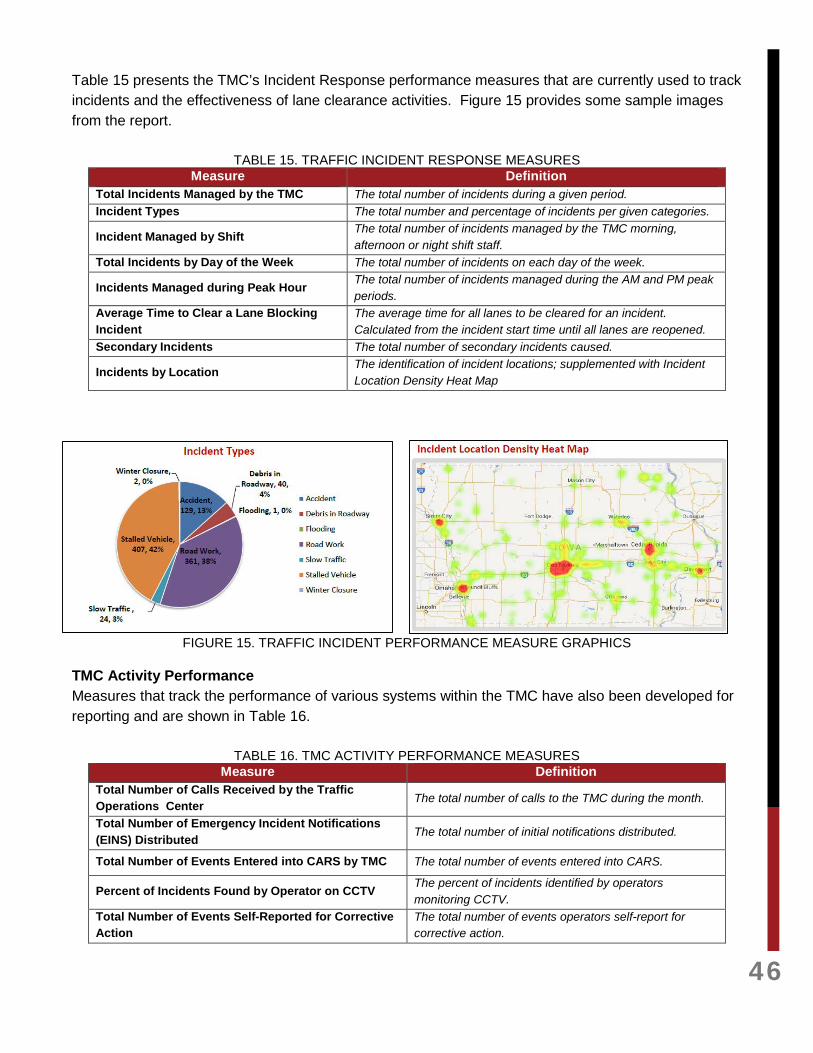
46
Table 15 presents the TMC’s Incident Response performance measures that are currently used to track incidents and the effectiveness of lane clearance activities. Figure 15 provides some sample images from the report.
TABLE 15. TRAFFIC INCIDENT RESPONSE MEASURES Measure Definition
Total Incidents Managed by the TMC The total number of incidents during a given period. Incident Types The total number and percentage of incidents per given categories.
Incident Managed by Shift The total number of incidents managed by the TMC morning, afternoon or night shift staff.
Total Incidents by Day of the Week The total number of incidents on each day of the week.
Incidents Managed during Peak Hour The total number of incidents managed during the AM and PM peak periods.
Average Time to Clear a Lane Blocking Incident
The average time for all lanes to be cleared for an incident. Calculated from the incident start time until all lanes are reopened.
Secondary Incidents The total number of secondary incidents caused.
Incidents by Location The identification of incident locations; supplemented with Incident Location Density Heat Map
FIGURE 15. TRAFFIC INCIDENT PERFORMANCE MEASURE GRAPHICS TMC Activity Performance Measures that track the performance of various systems within the TMC have also been developed for reporting and are shown in Table 16.
TABLE 16. TMC ACTIVITY PERFORMANCE MEASURES Measure Definition
Total Number of Calls Received by the Traffic Operations Center The total number of calls to the TMC during the month.
Total Number of Emergency Incident Notifications (EINS) Distributed The total number of initial notifications distributed.
Total Number of Events Entered into CARS by TMC The total number of events entered into CARS.
Percent of Incidents Found by Operator on CCTV The percent of incidents identified by operators monitoring CCTV.
Total Number of Events Self-Reported for Corrective Action
The total number of events operators self-report for corrective action.

47
Operations Staff Performance The monthly report also tracks performance of individual TMC staff members, as shown in Table 17.
TABLE 17. OPERATIONS STAFF PERFORMANCE MEASURES Measure Definition
Total Number of Incidents Confirmed The total number of incidents confirmed by staff member. Percent of Total Incidents Confirmed by Operators The percent of total incidents confirmed by staff member.
Total Number of Highway Helper Communications The number of Highway Helper communications per staff member.
Average Hours Worked per Week The average hours worked per week per staff member. ITS Maintenance Online Management System (MOMS) The ITS Maintenance Online Management System (MOMS) monitors the performance and operation of all ITS devices. MOMS is a monitoring tool that assists with tracking response and repair timeframes and organizes maintenance records. When a repair is needed, a ticket (or service order) is created in the MOMS system to initiate the repair and track the response through to completion. MOMS performance measures are highlighted in Table 18.
TABLE 18. ITS MAINTENANCE ONLINE MANAGEMENT SYSTEM PERFORMANCE MEASURES Measure Definition
Total Number of Maintenance Request Tickets Created The total number of MOMS tickets created.
Total Number of MOMS Issues Detected by the TMC The total number of MOMS issues found by TMC staff.
Response or Action Taken as a Result of a Created MOMS Ticket The result of a created MOMS ticket.
Traffic Incident Management and Highway Helper The Traffic Incident Management and Highway Helper performance measures track the response and activities of Highway Helpers, as presented in Table 19. A sample TIM and Highway Helper performance report graphic is shown in Figure 16.
TABLE 19. TIM AND HIGHWAY HELPER PERFORMANCE MEASURES Measure Definition
Average Dispatch Time The total time from when an incident is reported to the time when the TMC personnel dispatch Highway Helper or provide traveler information.
Incident Detection Method The method by which an incident was detected.
Number of Times TMC Dispatches Highway Helper The total number of times the TMC dispatches the Highway Helper.
Highway Helper Assist by Location The identification of Highway Helper assist locations.

48
FIGURE 16. TIM AND HIGHWAY HELPER SAMPLE GRAPHICS
Traffic Critical Projects The monthly report also presents statistics for the Department’s Traffic Critical Projects. The Traffic Critical Projects initiative manages work zone mobility and safety. The developed measures for Traffic Critical Projects track the effectiveness of the initiative, as shown in Table 20.
TABLE 20. TRAFFIC CRITICAL PROJECTS MEASURES Measure Definition
Number of Traffic Critical Projects The total number of traffic critical projects in a given month.
Number of Traffic Critical Projects with Intelligent Work Zones or TIM
The total number of traffic critical projects with intelligent work zones or TIM.
Number of Alerts for Traffic Critical Projects that Require TMC Response
The total number of alerts for traffic control projects that require TMC response.
Number of Work Zones Entered into the ATMS The total number of work zones entered into ATMS. Traveler Information To evaluate the effectiveness of Traveler Information program efforts, the monthly report tracks traveler information dissemination activities, as shown in Table 21.
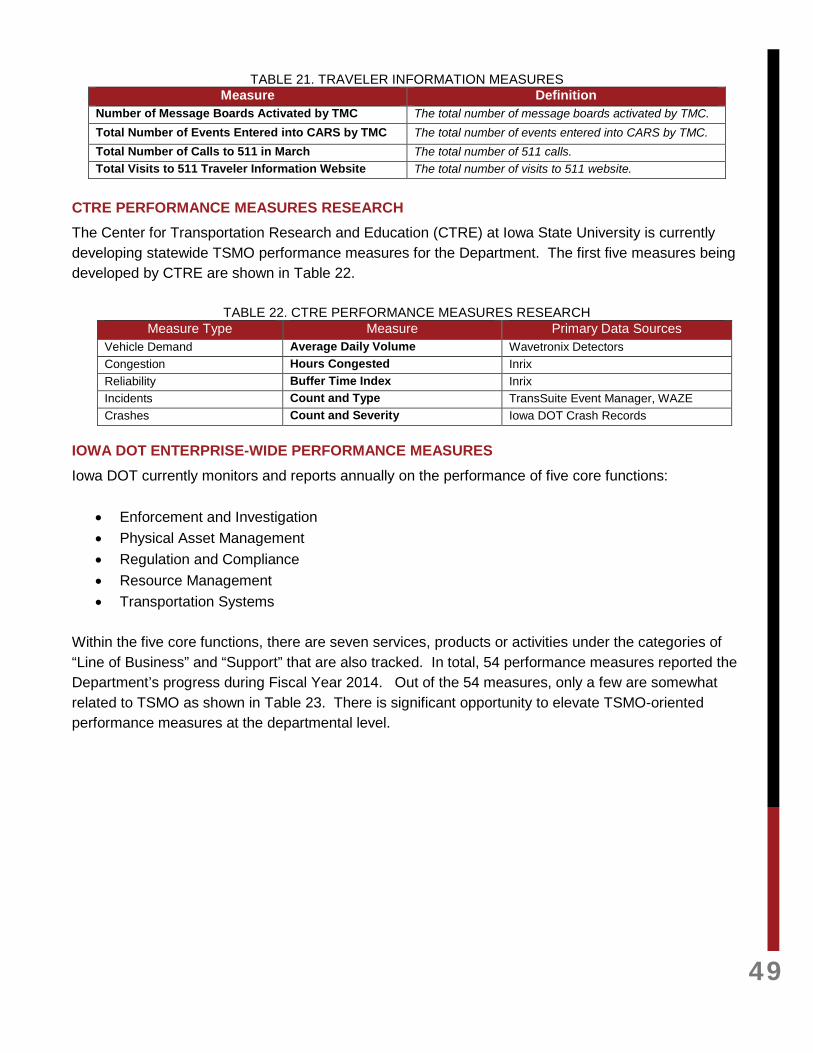
49
TABLE 21. TRAVELER INFORMATION MEASURES Measure Definition
Number of Message Boards Activated by TMC The total number of message boards activated by TMC. Total Number of Events Entered into CARS by TMC The total number of events entered into CARS by TMC. Total Number of Calls to 511 in March The total number of 511 calls. Total Visits to 511 Traveler Information Website The total number of visits to 511 website.
CTRE PERFORMANCE MEASURES RESEARCH The Center for Transportation Research and Education (CTRE) at Iowa State University is currently developing statewide TSMO performance measures for the Department. The first five measures being developed by CTRE are shown in Table 22.
TABLE 22. CTRE PERFORMANCE MEASURES RESEARCH Measure Type Measure Primary Data Sources
Vehicle Demand Average Daily Volume Wavetronix Detectors Congestion Hours Congested Inrix Reliability Buffer Time Index Inrix Incidents Count and Type TransSuite Event Manager, WAZE Crashes Count and Severity Iowa DOT Crash Records
IOWA DOT ENTERPRISE-WIDE PERFORMANCE MEASURES Iowa DOT currently monitors and reports annually on the performance of five core functions:
• Enforcement and Investigation • Physical Asset Management • Regulation and Compliance • Resource Management • Transportation Systems
Within the five core functions, there are seven services, products or activities under the categories of “Line of Business” and “Support” that are also tracked. In total, 54 performance measures reported the Department’s progress during Fiscal Year 2014. Out of the 54 measures, only a few are somewhat related to TSMO as shown in Table 23. There is significant opportunity to elevate TSMO-oriented performance measures at the departmental level.

50
TABLE 23. EXISTING IOWA DOT ENTERPRISE-WIDE TSMO RELATED PERFORMANCE MEASURES CORE FUNCTION: ENFORCEMENT AND INVESTIGATION Service, Product or Activity: Motor Vehicle Enforcement
Target Met
Yes Performance Measure Number of commercial vehicle safety inspections
Target 49,665 inspections Data Source Iowa DOT Motor Vehicle Division records
Yes Performance Measure Number of commercial vehicles inspected transporting hazardous
materials Target 4,200 inspections
Data Source Motor Vehicle Officers’ weekly inspection reports CORE FUNCTION: PHYSICAL ASSET MANAGEMENT
Service, Product, or Activity: Modal/Planning Functions Management
No Performance Measure Large truck (semi-truck) vehicle miles of travel
Target 2.90 billion Data Source Office of Transportation Data records
No Performance Measure Automobile vehicle miles of travel
Target 27.9 billion Data Source Office of Transportation Data records
Beyond the Annual Performance Report, several TSMO related measures are provided on the Iowa DOT Performance website (http://www.iowadot.gov/index.html#/performance):
• Infrastructure Condition – Provides interactive statewide maps of bridge and road conditions. • Safety – Provides a variety of historical safety data. A total fatalities graphic is shown in Figure
17 • Projects – Provides an interactive map to view whether projects are on time and/or within
budget • Winter Operations – Interactive graphics showing various measures related to Winter Weather
Operations (i.e., plowing and salting).

51
Figure 17. Number of Iowa Fatalities, 2001-2014
EXPANDING PERFORMANCE MANAGEMENT TO MEET STATEGIC AND PROGRAM OBJECTIVES TSMO Program Performance Management should be expanded to ensure that all Program Objectives are monitored and to provide input into performance-based decision making. Table 24 shows the TSMO Program Goals and Strategic Objectives and the current sources for monitoring the status of each.
TABLE 24. TSMO STRATEGIC OBJECTIVE MONITORING Goal Strategic
Objective Monitoring
Sources
1. Safety Reduce crash frequency and rates
State Crash Records and rate calculations maintained by Traffic and Safety
2. Reliability Improve system reliability and increase system resiliency
ICE-OPS uses the planning time index as a measure of reliability. Yet to be developed mobility report.
3. Efficiency Minimize traffic delay ICE-OPS Bottleneck measures for freight and all vehicles. Yet to be developed mobility report.
4. Convenience Provide simple, timely, and accurate information to system users
511 user statistics and customer feedback
5. Coordination Coordinate responses to traffic incidents Measures yet to be developed.
6. Integration Use standards to integrate across systems to improve decision making
Measures yet to be developed.
The TSMO Strategic Objectives help guide decision making about resources and program priorities. The monitoring process allows TMSO Program managers to track the effectiveness of actions and projects to determine if they are moving the results toward the objectives. Decisions about investments in staff, technology, processes and activities should reflect results observed through the monitoring process.

52
Another key to TSMO performance management are the TSMO Program Objectives. Similar to the TSMO Strategic Objectives, the TSMO Program Objectives provide an opportunity to track and evaluate the overall effectiveness of the TSMO Program.
Table 25 shows the TSMO Goals and Program Objectives, the current sources for monitoring the status of each, and the associated Service Layer(s) responsible for managing and delivering the Program Objectives.
As the eight Service Layer Plans are developed, performance monitoring will be needed to support the Program Objectives associated with individual Service Layers. These more specific measures and applications support the overall program and provide the basis for effectively managing the Service Layers. To develop a comprehensive, performance-based management approach to TSMO, each of the Program Objectives will require measures of effectiveness and ongoing monitoring. It is recommended that a robust Performance Management Plan be developed to support project, service and activity prioritization and management.

53
TABLE 25. TSMO PROGRAM PERFORMANCE MONITORING STATUS
Goal Program Objective Monitoring Sources TSMO
Program Associated
Service Layers
Safety
Reduce the number of overall major crashes. State crash records maintained by Traffic and Safety X
Reduce the number of secondary crashes caused by traffic incidents. Traffic Incident Response Measures TIM
Reduce the number of work zone related traffic incidents.
Work zone crash statistics maintained by the Office of Construction and Materials. Other related measures tracked in TCP Measures.
WZM
Reliability
Improve travel time reliability. ICE-OPS uses the planning time index as a measure of reliability X
Increase the resilience of the transportation system to floods, winter weather, and other extreme weather events.
Measures and monitoring needed ETO
Work with special event generators to actively manage traffic during large scale events that impact the highway network.
Measures and monitoring needed. ICE-OPS uses a measure to determine potential special event impacts.
TMC, ATDM
Efficiency
Improve level of service on major freight corridors.
Interstate Condition Evaluation (ICE) tracks major freight corridor bottlenecks. Real-time measures needed for TSMO.
ATDM
Maximize use of existing roadway capacity Incident related delay monitored in Traffic Incident Response Measures TMC,
ATDM
Establish Network Level Priorities for managing traffic.
Hierarchy of operations important based on facility type defined in TSMO Program Plan
TMC, ATDM
Respond to and clear traffic incidents as quickly as possible.
Incident related delay monitored in Traffic Incident Response Measures TIM
Minimize the environmental impacts of the transportation system. Measures and monitoring needed X
Convenience
Provide timely, accurate and comprehensive information to customers.
TMC Activity Performance Measures monitor calls and notification distribution. Additional measures and monitoring needed to measure accuracy.
TI
No unplanned road closures or restrictions due to conditions within Iowa DOT’s control.
Incident related closures monitored in Traffic Incident Response Measures. Additional measures and monitoring needed to log unplanned road closures or restrictions.
TIM, WZM, ETO
Provide high quality, machine ready data in open formats.
Measures currently logged in Traveler Information Measures TI
Accommodate bike, pedestrian, transit and commercial vehicle in TSMO. Measures and monitoring needed TMC,
WZM
Coordination
Lead Statewide and Regional Traffic Incident Management Program activities. Measures and monitoring needed TIM
Coordinate responses to large scale traffic incidents with adjacent states. Measures and monitoring needed TIM, ETO
Provide staff knowledge and management resources to enable adaptation to rapidly changing technology.
Measures and monitoring needed ATDM, CAV
Integration
Integrate TSMO into existing Iowa DOT Policies and Procedures. Measures and monitoring needed X
Develop standards-based systems, rooted in geospatial technologies, to improve performance management and decision support systems.
Measures and monitoring needed TMC, ITS,
ATDM, CAV
Use integration and big data mining strategies to improve performance management and business intelligence.
Measures and monitoring needed X
Implement integrated corridor management strategies to manage traffic across multiple jurisdictions.
Measures and monitoring needed TMC, ITS, ATDM

54
PART 6. 5-YEAR TSMO PROGRAM The 5-Year TSMO Program includes development of a prioritization tool to help determine where to apply resources in the future, as well as an annualized list of:
• Projects and Services – Includes non-construction projects and services required to deliver the TSMO Program.
• Construction Projects – Identifies targeted highway improvement projects and stand-alone ITS Device installations, termed the “ITS Program”.
• Activities, Policies and Procedures – Includes activities, policies and procedures that need to be completed to deliver the TSMO Program.
The ICE-OPS Tool for TSMO Analysis Early in the development of the TSMO Program, the need to develop a screening tool to support data-driven decisions on where to apply limited resources was identified. The Interstate Condition Evaluation for Operations (ICE-OPS) tool was developed in conjunction with the Office of Systems Planning based upon the Interstate Corridor Plan that uses condition data and spatial analytics to determine which Interstate corridors should be considered priorities for infrastructure renewal. The analysis methodology is called the Interstate Condition Evaluation (ICE). OTO worked with Systems Planning to develop a parallel ICE-OPS methodology that uses similar normalization, weighting structure and composite scoring techniques to compare 21 Interstate corridors as initially defined by the Interstate Corridor Plan. The ICE-OPS tool is meant to evaluate which Interstate corridors have operational challenges based upon nine different operations-oriented criteria. Ultimately, this information can be used to help prioritize investments in the Interstate system. Raw data from each criterion is maintained in an Excel table and summarized in a final output table through the use of Structure Query Language (SQL). Each criterion contributes to a segment level composite ICE-OPS score out of 100. Higher scores mean fewer operational challenges. The composite scores on the segments that made up the defined Interstate corridors were weighted by length and averaged for each. Definitions of the nine operations-oriented criteria include:
• All Bottleneck Occurrences per Mile uses the INRIX Bottleneck Ranking Tool for each quarter of 2014 where travel times drop below 60 percent of its 95th percentile speeds for durations of 5 minutes or longer. The four quarters of data were analyzed spatially and added into an Excel spreadsheet containing ‘number of occurrences’ and ‘location’ for each bottleneck. The final list was used to calculate occurrences per centerline mile for each Interstate corridor.
• Freight Bottleneck Occurrences per Mile uses the list of all bottleneck occurrences and overlaid with locations with high truck volumes greater than the 5,000 vehicles per day or 30% of overall AADT to identify ‘freight related’ locations. The final list was used to calculate occurrences per centerline mile for each Interstate corridor.

55
• Traffic Incident Frequency per Mile uses the 2014 ATMS dataset which contains a number of different types of traffic incidents. For ICE-OPS, events with duration greater than 20 minutes were selected and analyzed spatially to calculate an incidents per centerline mile ratio for each corridor.
• Crash Rate was defined by the Office of Traffic and Safety using an SQL process to assign 2010-2014 fatal, major injury, and minor injury crashes to the segment level. All crashes located within the 21 Interstate corridors were calculated using a weighted average by length to derive a final average crash rate.
• Planning Time Index (PTI) is the total travel time that should be planned for a given trip and is used as a measurement for unexpected delay. For example, if the PTI value is 1.60, for a 15-minute trip, the total time that should be planned is 24 minutes (15 minutes x 1.60 = 24 minutes). For ICE-OPS, INRIX data was used to generate PTI at the corridor level.
• Event Center Buffer Index recognizes the impact to operations of special events, such as the Iowa State Fair and college football events in Ames and Iowa City. For ICE-OPS, significant event centers were mapped, and a buffer was applied to each location using a radius of one mile for every 7,500 persons in attendance (per event, per day). The buffers were then used to calculate total centerline mileage for each Interstate corridor that fell within one or more of the buffers.
• Weather Sensitive Corridor Mileage was defined by Iowa State University’s Center for Transportation Research and Education (CTRE) in a previous study that looked at winter weather related crashes, conditions, and characteristics. These sites were identified based on input from the Iowa DOT’s Office of Maintenance and district maintenance managers. The ICE-OPS analysis sums the mileage from the defined weather sensitive corridors and the 2013 – 2015 flooding events database created by the working group to arrive at a total weather-sensitive centerline mileage for each interstate corridor.
• Average Annual Daily Traffic (AADT) is a general unit used for traffic measurement representing the daily traffic that travels on a roadway segment. A weighted average by length was applied to each of the Interstate corridors to arrive at a single AADT value.
• Interstate Condition Evaluation (ICE) Rating uses seven criteria including: • Pavement Condition Index (PCI) • International Roughness Index (IRI) • Structure sufficiency ratings (SIA) • Passenger AADT • Combination truck AADT • Single unit truck AADT • Volume-to-capacity (V/C) ratio.
The nine criteria used in the ICE-OPS analysis were assigned normalized values based on a calculated range for each, generally based on the range of observed values for each criterion across all 21 corridors. The associated ranges include:
• All Bottleneck Occurrences Per Mile: 0 - 97+ • Freight Bottleneck Occurrences Per Mile: 0 - 29.46+

56
• Traffic Incident Frequency Per Mile: 0 - 17.54+ • Crash Rate: 41 - 128+ • Planning Time Index (PTI): 1.00 - 1.56+ • Event Center Buffer Index: 0 - 47+ • Weather Sensitive Corridor Mileage: 0 - 45+ • Average Annual Daily Traffic (AADT): 5,981 - 64,019+ • ICE Rating: 54.86 - 84.33+
With the goal of creating a maximum composite score of 100, a common scale of 1 to 10 was used for each of the nine criteria with 1 being the lowest and 10 being the highest. Once the criteria were normalized, the respective weighting percentages were applied. The weighting was defined in terms of distributing a 100 percent total across all of the criteria with higher values indicating greater influence on the final composite score. The percentages were based on OTO and Systems Planning working group discussions and refinements in attempt to accurately reflect the current conditions of the defined Interstate corridors as shown in Table 26.
TABLE 26. ICE-OPS CRITERIA WEIGHTING Criteria Weighting
All Bottleneck Occurrences Per Mile 10% Freight Bottleneck Occurrences Per Mile 10% Traffic Incident Frequency 15% Crash Rate 15% Planning Time Index 10% Event Center Buffer Mileage 5% Weather Sensitive Corridor Mileage 10% Total AADT 20% ICE Rating 5%
TOTAL 100% Once the percentages were assigned to each criterion, multipliers were derived that would allow the composite rating to be a value between 1 and 100. The weighting percentages were divided by 10 to identify the multipliers to each criterion. For example, since crash rate was weighted at 15% the multiplier was defined as 1.5. After the multipliers are applied to each normalized value across all nine criteria, the values are then summed to calculate the final composite score. A low composite value indicates there are more operational issues that need to be addressed and is ranked higher. Results of the ICE-OPS criteria scoring are shown in Tables 27-29.

57
TABLE 27. ICE-OPS CRITERIA SCORING, PART 1 OF 2
TABLE 28. ICE-OPS CRITERIA SCORING, PART 2 OF 2
Value Norm Value Norm Value Norm Value Norm Value NormI-235 (full route) 13.2 510.4 1 4.32 9 78.33 1 128.27 1 1.345 4I-35/80 (east junction of I-80/I-235 to west junction of I-80/I-235) 13.7 208.2 1 176.98 1 64.10 1 64.42 8 1.185 7I-29 (junction of US 20 to South Dakota state line) 7.7 332.7 1 49.12 1 17.54 1 121.93 2 1.560 1I-380 (junction of US 30 to junction of IA-100)* 7.9 33.1 8 29.46 2 10.62 5 54.94 9 1.060 10I-80 (east junction of I-80/I-235 to junction of I-380) 100.5 97.1 1 96.14 1 3.28 9 55.88 9 1.020 10I-74 (full route) 6.0 773.7 1 12.09 7 11.25 5 101.10 4 1.205 7I-35 (east junction of I-80/I-235 to junction of US 30) 23.9 7.6 10 9.41 8 15.13 3 80.08 6 1.000 10I-129 (full route) 0.9 478.9 1 413.26 1 1.09 10 257.00 1 1.060 10I-480 (full route) 0.8 57.6 5 0.00 10 7.85 7 102.92 4 1.140 8I-80 (junction of I-380 to Illinois state line) 68.1 13.1 10 7.70 8 2.95 9 56.37 9 1.015 10I-380 (junction of I-80 to junction of US 30) 16.4 21.9 9 5.11 9 8.15 6 57.61 9 1.025 10I-29 (east junction of I-29/I-80 to junction of I-680) 22.6 44.3 7 16.56 5 5.98 7 61.90 8 1.065 9I-35 (junction of US 30 to junction of US 20) 30.9 29.1 8 19.06 5 0.94 10 53.61 9 1.030 10I-380 (junction of IA 100 to Waterloo) 48.7 60.6 5 3.26 9 1.46 10 70.63 7 1.020 10I-35 (junction of US 20 to Minnesota state line) 75.7 66.8 4 1.18 10 0.28 10 47.56 10 1.000 10I-29 (Missouri state line to east junction of I-29/I-80) 48.2 49.0 6 26.07 3 0.68 10 41.25 10 1.030 10I-80 (Nebraska state line to west junction of I-80/I-235) 118.4 4.4 10 1.03 10 1.44 10 56.26 9 1.015 10I-29 (junction of I-680 to junction of US 20) 72.7 50.6 6 11.22 7 0.56 10 50.77 9 1.025 10I-35 (Missouri state line to west junction of I-80/I-235) 72.4 20.4 9 2.36 10 2.14 9 61.17 8 1.030 10I-680 (full route) 16.0 67.3 4 0.00 10 0.12 10 68.06 8 1.025 10I-280 (full route) 9.8 22.5 9 0.00 10 1.02 10 51.10 9 1.030 10
Incident Frequency per mile (15%)Corridor
Centerline miles
All Bottlenecks per mile (10%)
Freight Bottlenecks per mile (10%)
Crash Rate (15%)Planning Time Index
(PTI) (10%)
Value Norm Value Norm Value Norm Value NormI-235 (full route) 13.2 38 2 11 8 90,026 1 71.4 6I-35/80 (east junction of I-80/I-235 to west junction of I-80/I-235) 13.7 27 4 1 10 89,829 1 59.9 2I-29 (junction of US 20 to South Dakota state line) 7.7 4 10 7 9 31,121 7 76.0 7I-380 (junction of US 30 to junction of IA-100)* 7.9 5 9 1 10 67,982 1 59.8 2I-80 (east junction of I-80/I-235 to junction of I-380) 100.5 47 1 36 3 30,997 7 72.4 6I-74 (full route) 6.0 0 10 0 10 37,537 6 80.4 8I-35 (east junction of I-80/I-235 to junction of US 30) 23.9 26 4 10 8 45,881 4 69.6 5I-129 (full route) 0.9 0 10 0 10 19,261 8 77.8 7I-480 (full route) 0.8 0 10 0 10 37,237 6 68.0 5I-80 (junction of I-380 to Illinois state line) 68.1 33 3 58 1 35,530 6 68.1 5I-380 (junction of I-80 to junction of US 30) 16.4 11 8 0 10 51,754 3 75.0 7I-29 (east junction of I-29/I-80 to junction of I-680) 22.6 4 9 0 10 20,254 8 81.1 9I-35 (junction of US 30 to junction of US 20) 30.9 12 8 15 8 23,828 8 78.4 8I-380 (junction of IA 100 to Waterloo) 48.7 0 10 0 10 21,773 8 78.2 8I-35 (junction of US 20 to Minnesota state line) 75.7 0 10 28 5 16,069 9 84.3 9I-29 (Missouri state line to east junction of I-29/I-80) 48.2 0 10 5 10 16,124 9 83.7 9I-80 (Nebraska state line to west junction of I-80/I-235) 118.4 0 10 12 8 25,053 7 72.2 6I-29 (junction of I-680 to junction of US 20) 72.7 0 10 5 10 14,512 9 83.6 9I-35 (Missouri state line to west junction of I-80/I-235) 72.4 5 9 4 10 18,784 8 82.9 9I-680 (full route) 16.0 0 10 0 10 5,981 10 78.8 8I-280 (full route) 9.8 0 10 0 10 20,349 8 77.9 8
CorridorCenterline
miles
Event Center buffer mileage (5%)
Weather-Sensitive Corridor mileage
(10%)AADT (20%) ICE rating (5%)

58
TABLE 29. OVERALL ICE-OPS CORRIDOR RANKING
Corridor Centerline miles
Composite Value Rank
I-235 (full route) 13.2 31.0 1
Few
er O
pera
tiona
l Iss
ues
<----
-----
--->
Mor
e O
pera
tiona
l Iss
ues
I-35/80 (east junction of I-80/I-235 to west junction of I-80/I-235) 13.7 37.5 2 I-29 (junction of US 20 to South Dakota state line) 7.7 39.0 3 I-380 (junction of US 30 to junction of IA-100) 7.9 58.5 4 I-80 (east junction of I-80/I-235 to junction of I-380) 100.5 59.5 5 I-74 (full route) 6.0 59.5 5 I-35 (east junction of I-80/I-235 to junction of US 30) 23.9 62.0 7 I-129 (full route) 0.9 63.0 8 I-480 (full route) 0.8 69.0 9 I-80 (junction of I-380 to Illinois state line) 68.1 72.0 10 I-380 (junction of I-80 to junction of US 30) 16.4 74.0 11 I-29 (east junction of I-29/I-80 to junction of I-680) 22.6 78.5 12 I-35 (junction of US 30 to junction of US 20) 30.9 83.5 13 I-380 (junction of IA 100 to Waterloo) 48.7 84.5 14 I-35 (junction of US 20 to Minnesota state line) 75.7 86.5 15 I-29 (Missouri state line to east junction of I-29/I-80) 48.2 86.5 15 I-80 (Nebraska state line to west junction of I-80/I-235) 118.4 88.5 17 I-29 (junction of I-680 to junction of US 20) 72.7 89.0 18 I-35 (Missouri state line to west junction of I-80/I-235) 72.4 89.5 19 I-680 (full route) 16.0 90.0 20 I-280 (full route) 9.8 92.5 21
Figures 18-27 graphically highlight the outcomes of the ICE-OPS analysis. In general, as expected a majority of operational issues are around the Des Moines and Cedar Rapids urban areas. The reason for I-29 in the Sioux City area ranking high is related to ongoing reconstruction activities; once the construction activities are complete, the ranking is expected to fall. The high ranking of the eastern half of I-80 from Des Moines to the Quad Cities illustrates some of the issues related to freight movement across the state. I-74 in the Quad Cities experiences a variety of capacity-oriented issues which lead to a significant frequency of traffic incidents and a corresponding high ranking.

59
FIGURE 18. ICE-OPS ANALYSIS - ALL BOTTLENECKS
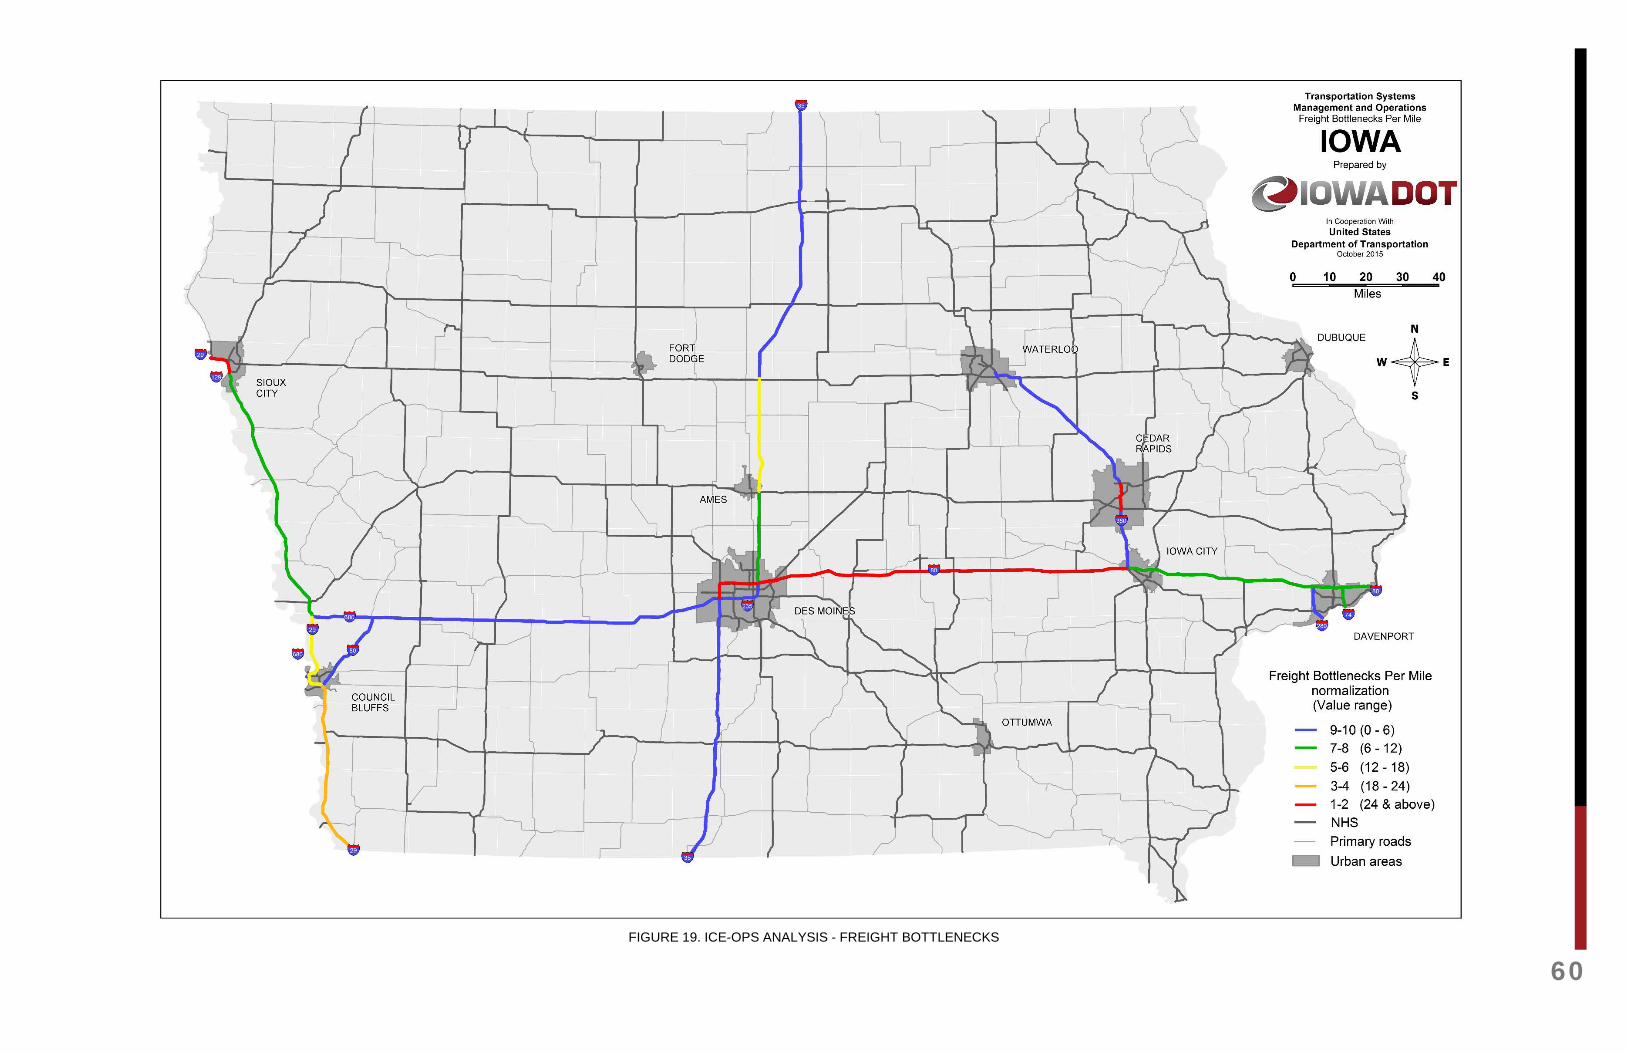
60
FIGURE 19. ICE-OPS ANALYSIS - FREIGHT BOTTLENECKS

61
FIGURE 20. ICE-OPS ANALYSIS - TRAFFIC INCIDENT FREQUENCY

62
FIGURE 21. ICE-OPS ANALYSIS - CRASH RATES

63
FIGURE 22. ICE-OPS ANALYSIS - PLANNING TIME INDEX

64
FIGURE 23. ICE-OPS ANALYSIS - EVENT CENTER MILEAGE

65
FIGURE 24. ICE OPS ANALYSIS - WEATHER SENSITIVE CORRIDOR MILEAGE

66
FIGURE 25. ICE-OPS ANALYSIS - TOTAL AADT

67
FIGURE 26. ICE-OPS ANALYSIS - ICE RATING

68
FIGURE 27. ICE-OPS ANALYSIS - TOTAL COMPOSITE SCORE

69
BORDER BRIDGES TRAFFIC OPERATIONS ASSESSMENT Border bridges is the fourth priority tier, as highlighted in Figure 5. There is a need to focus on border bridges since they facilitate the east-west movement of commerce across the Mississippi and Missouri Rivers. Table 30 highlights the top five border bridges by AADT, percent trucks and AADTT per lane. The I-74 Bridge in the Quad Cities carries the most traffic, while the I-80 Illinois/Iowa Crossing near Le Claire has the highest truck percentage and truck volume per lane.
TABLE 30. BORDER BRIDGES TRAFFIC OPERATIONS CHARACTERISTICS
Border State Location Closest City AADT
(2013) AADT Rank
% Trucks (2013)
% Trucks Rank
AADTT per lane
AADTT per lane
Rank IL I-80 Le Claire 34,100 4 30.03 1 2,560 1
NE I-80 Council Bluffs 65,800 2 17.63 5 1,933 2 IL I 280 Davenport 22,400 7 20.02 4 1,121 3 IL I-74/US 6 Bettendorf 70,500 1 5.04 20 888 4
NE US 30 Missouri Valley 4,940 19 28.02 2 692 5 NE I-129/US 20/US 75 Sioux City 20,800 9 13.17 9 685 6 NE I-480/US 6 Council Bluffs 50,700 3 5.02 21 636 7 IL US 20 Dubuque 17,700 10 6.83 17 605 8
NE NE 2/IA 2 Hamburg 9,100 15 24.8 3 564 9 IL US 30 Clinton 10,000 13 9.53 13 477 10
NE I-680 Crescent 15,700 11 12.1 10 475 11 WI US 61/US 151 Dubuque 21,400 8 8.38 16 448 12 WI US 18/WIS 60 Marquette 8,500 17 9.02 14 384 13 IL US 34 Burlington 9,300 14 14.87 8 346 14
NE NE 370/IA 370 Council Bluffs 4,070 20 11.33 12 231 15 NE US 77 Sioux City 30,700 6 2.65 24 204 16 IL US 67 Davenport 31,300 5 2.25 26 176 17 IL US 136 Keokuk 10,700 12 5.21 19 139 18 IL IA 2/IL 9 Fort Madison 2,750
(2010) 22 9.00
(2010) 15 124 19
WI IA 9/WIS 82 Lansing 1,920 24 11.88 11 114 20 NE US 275/NE 92/ IA 92 Council Bluffs 9,000 16 4.63 23 104 21 NE NE 51/IA 175 Onowa 1,250 26 15.12 6 95 22 IL IA 92/IL 92 Muscatine 3,660 21 4.81 22 88 23 IL IA 136/IL 136 Clinton 7,100 18 2.27 25 81 24 IL US 52/IA 64 Sabula 2,050 23 5.46 18 56 25
NE US 34 Pacific Junction 1,340 25 15.07 7 51 26

70
5-Year TSMO Budget and ITS Program The current level of TSMO funding at Iowa DOT is approximately $20 to 21 million per year for Fiscal Years 2016 and 2017. A series of projects and services have been developed for Fiscal Years 2016-20 in an effort to start synchronizing TSMO projects and services with the 5-Year Program. TSMO Services have been broken into four categories that align with organizational responsibilities:
• Systems and Technical Services • Traffic Incident and Emergency Management • Traffic Operations Research and Decision Support • Traffic Management Center Services
A summary and graph of the proposed TSMO budget for Fiscal Years 2016-20 are shown in Table 31 and Figure 28.
TABLE 31. PROPOSED TSMO SERVICES COST SUMMARY, FY 2016-20
TSMO SERVICESFunding % of total Funding % of total Funding % of total Funding % of total Funding % of total
SYSTEMS AND TECHNICAL SERVICES 11,560,000$ 59.3% 11,900,000$ 56.4% 12,500,000$ 54.9% 11,770,000$ 52.6% 11,720,000$ 51.2%
TRAFFIC INCIDENT AND EMERGENCY MGMT 5,350,000$ 27.4% 5,330,000$ 25.3% 5,900,000$ 25.9% 6,350,000$ 28.4% 6,800,000$ 29.7%
RESEARCH AND DECISION SUPPORT 990,000$ 5.1% 1,510,000$ 7.2% 1,410,000$ 6.2% 1,260,000$ 5.6% 1,380,000$ 6.0%
TRAFFIC MANAGEMENT CENTER SERVICES 1,600,000$ 8.2% 2,350,000$ 11.1% 2,950,000$ 13.0% 3,000,000$ 13.4% 3,000,000$ 13.1%
TSMO SERVICES-TOTAL 19,500,000$ 100.0% 21,090,000$ 100.0% 22,760,000$ 100.0% 22,380,000$ 100.0% 22,900,000$ 100.0%
FY2016 FY2017 FY2018 FY2019 FY2020

71
FIGURE 28. PROPOSED TSMO SERVICES COST SUMMARY, FY 2016-20
Another aspect of TSMO is the deployment of ITS devices and communications to better manage traffic along Iowa’s roadways. Strategically, it is intended to associate ITS deployments with highway improvement projects in the 5-Year Program. Each deployment project will have a unique project number with the same county, route, PIN, and other corresponding Project Scheduling System information as the associated construction project. Collectively, these ITS deployments are referred to as the “ITS Program”. The ITS Program identifies ITS deployments over the next five fiscal years and is updated annually in December. The ITS Program has two main categories:
• Independent ITS Deployments – Stand-alone projects that help meet TSMO needs around the state. These projects are not necessarily associated with a highway improvement project and will be listed in the 5-Year Program.
• ITS Deployments for Highway Projects – ITS devices, intelligent work zones (IWZ) and communications integrated into highway improvement projects. This may also include upgrades of existing systems. On some projects, a significant portion of work is targeted towards IWZ applications to help minimize the work zone impacts of the project during construction.
A summary and graph of the proposed 5-year ITS Program costs by fiscal year are shown in Table 32 and Figure 29.
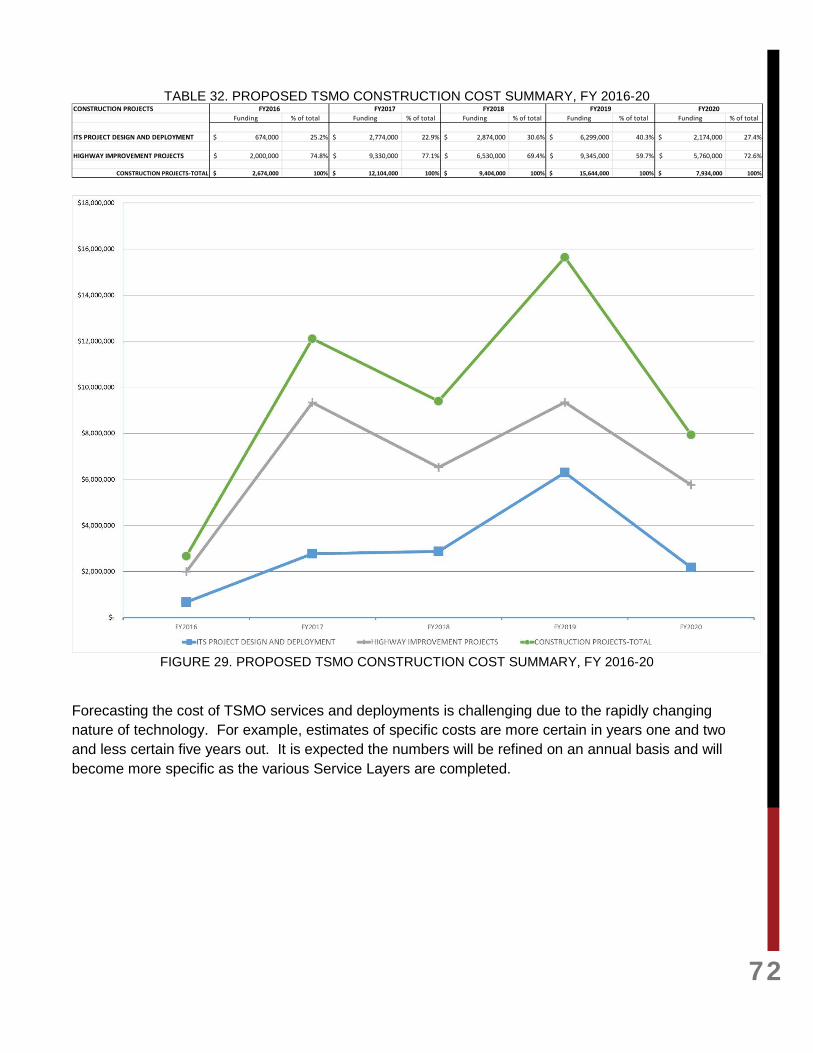
72
TABLE 32. PROPOSED TSMO CONSTRUCTION COST SUMMARY, FY 2016-20
FIGURE 29. PROPOSED TSMO CONSTRUCTION COST SUMMARY, FY 2016-20
Forecasting the cost of TSMO services and deployments is challenging due to the rapidly changing nature of technology. For example, estimates of specific costs are more certain in years one and two and less certain five years out. It is expected the numbers will be refined on an annual basis and will become more specific as the various Service Layers are completed.
CONSTRUCTION PROJECTSFunding % of total Funding % of total Funding % of total Funding % of total Funding % of total
ITS PROJECT DESIGN AND DEPLOYMENT 674,000$ 25.2% 2,774,000$ 22.9% 2,874,000$ 30.6% 6,299,000$ 40.3% 2,174,000$ 27.4%
HIGHWAY IMPROVEMENT PROJECTS 2,000,000$ 74.8% 9,330,000$ 77.1% 6,530,000$ 69.4% 9,345,000$ 59.7% 5,760,000$ 72.6%
CONSTRUCTION PROJECTS-TOTAL 2,674,000$ 100% 12,104,000$ 100% 9,404,000$ 100% 15,644,000$ 100% 7,934,000$ 100%
FY2016 FY2017 FY2018 FY2019 FY2020
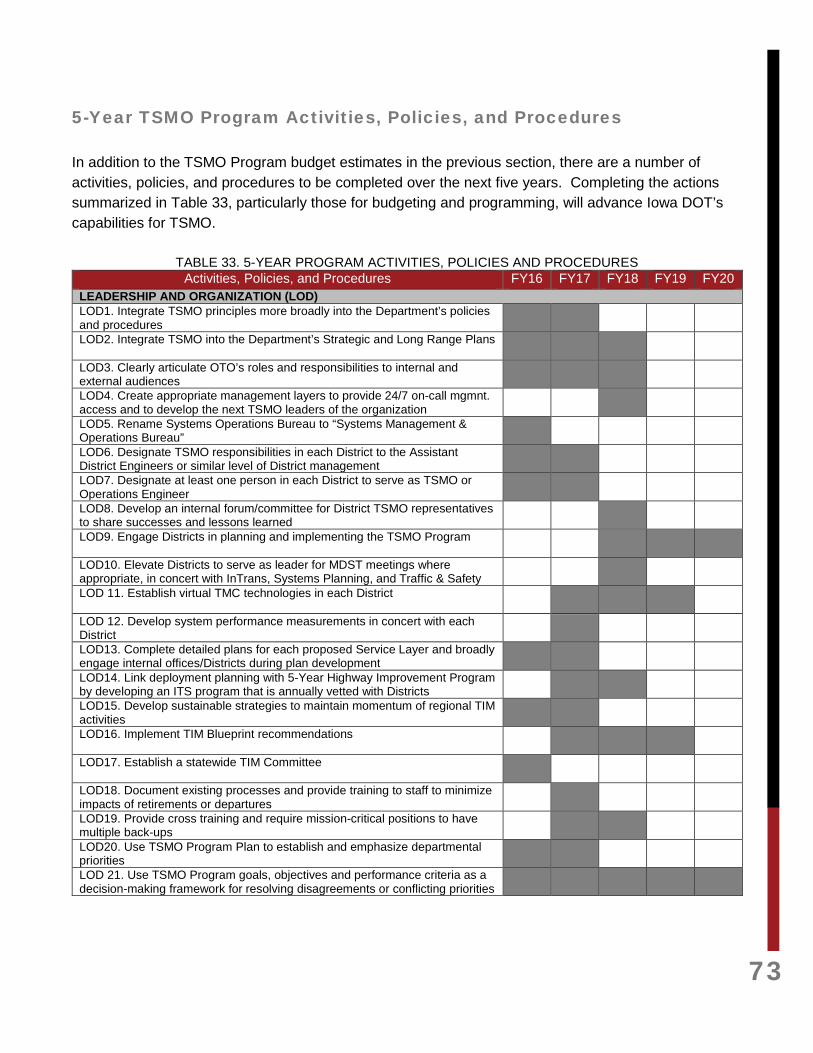
73
5-Year TSMO Program Activities, Policies, and Procedures In addition to the TSMO Program budget estimates in the previous section, there are a number of activities, policies, and procedures to be completed over the next five years. Completing the actions summarized in Table 33, particularly those for budgeting and programming, will advance Iowa DOT’s capabilities for TSMO.
TABLE 33. 5-YEAR PROGRAM ACTIVITIES, POLICIES AND PROCEDURES Activities, Policies, and Procedures FY16 FY17 FY18 FY19 FY20
LEADERSHIP AND ORGANIZATION (LOD) LOD1. Integrate TSMO principles more broadly into the Department’s policies and procedures
LOD2. Integrate TSMO into the Department’s Strategic and Long Range Plans
LOD3. Clearly articulate OTO’s roles and responsibilities to internal and external audiences
LOD4. Create appropriate management layers to provide 24/7 on-call mgmnt. access and to develop the next TSMO leaders of the organization
LOD5. Rename Systems Operations Bureau to “Systems Management & Operations Bureau”
LOD6. Designate TSMO responsibilities in each District to the Assistant District Engineers or similar level of District management
LOD7. Designate at least one person in each District to serve as TSMO or Operations Engineer
LOD8. Develop an internal forum/committee for District TSMO representatives to share successes and lessons learned
LOD9. Engage Districts in planning and implementing the TSMO Program
LOD10. Elevate Districts to serve as leader for MDST meetings where appropriate, in concert with InTrans, Systems Planning, and Traffic & Safety
LOD 11. Establish virtual TMC technologies in each District
LOD 12. Develop system performance measurements in concert with each District
LOD13. Complete detailed plans for each proposed Service Layer and broadly engage internal offices/Districts during plan development
LOD14. Link deployment planning with 5-Year Highway Improvement Program by developing an ITS program that is annually vetted with Districts
LOD15. Develop sustainable strategies to maintain momentum of regional TIM activities
LOD16. Implement TIM Blueprint recommendations
LOD17. Establish a statewide TIM Committee
LOD18. Document existing processes and provide training to staff to minimize impacts of retirements or departures
LOD19. Provide cross training and require mission-critical positions to have multiple back-ups
LOD20. Use TSMO Program Plan to establish and emphasize departmental priorities
LOD 21. Use TSMO Program goals, objectives and performance criteria as a decision-making framework for resolving disagreements or conflicting priorities

74
STAFFING EXPERTISE (S) S1. Identify skill sets needed to deliver services and meet program goals by developing a comprehensive staffing plan, including both DOT and contract employees
S2. Further clarify the roles and related staffing needs between Central Office and Districts
S3. Enhance skills through professional capacity building and additional personnel training
S4. Tie staffing levels and associated knowledge, skills, abilities, and other characteristics to Service Layer Plans
BUDGETING< ACCOUNTING, PROCUREMENT AND CONTRACT MANAGEMENT (BAP) BAP1. Identify and document all funding sources and mechanisms to provide for program planning and sustainable TSMO funding
BAP2. Transition TSMO budgeting activities to a five-year cycle, consistent with the 5-Year Program
BAP3. Clarify technical specification roles of OTO, Purchasing, and Office of Design staff
BAP4. Diversify procurement process expertise in OTO by designating staff authorized to carry out development of RFPs on behalf of OTO
BAP5. Establish streamlined processes for consultant contracting and associated accounts payable activities
PROJECT PROGRAMMING (PP) PP1. Work with the Office of Program Management and the Project Scheduling Engineer to streamline the process for integrating ITS deployments into highway improvement projects in the 5-Year Program
PP2. Identify alternative funding opportunities, such as federal or state grants, public-private partnerships, and research funding
PP3. Support efforts by MPOs to incorporate operations into regional planning
SYSTEMS ENGINEERING (SE) SE1. Update Statewide ITS Architecture, make available online and update regularly on a three-year cycle
SE2. Update regional ITS architectures with MPOs and local agencies
SE3. Develop a process to collect project-level architectures to be tested against statewide and regional plans to improve consistency and to identify integration opportunities
SE4. Define roles for existing staff (or contracted staff) to improve system management duties and minimize issues related to introducing new technology and the potential impacts to the TMC and maintenance activities through systems engineering practices
SE5. Develop a process to convene a Configuration Management Board to discuss and document potential impacts of proposed software and/or hardware modifications
SE6. Work with the Office of Construction and Materials to develop an as-built management information system and assign staff to serve as the primary point of contact for field equipment and network infrastructure inventory
COLLABORATION WITH EXTERNAL PARTNERS (CEP) CEP1. Provide leadership and administrative support to sustain routine MDST TIM coordination in close coordination with Iowa DOT Districts, InTrans, the Office of Systems Planning and the Office of Traffic and Safety
CEP2. Develop tools such as websites and social media channels for sharing information across groups
CEP3. Identify opportunities to engage local agencies responsible for operating traffic signal systems to discuss integrated corridor management (with Office of Traffic and Safety as the lead)
CEP4. Include training needs and opportunities in each of the eight Service Layer Plans.
CEP5. Work with Iowa DOT General Counsel to enable entering into agreements with emerging technology companies to improve mobility and safety

75
PROGRAMMATIC AND ADMINISTRATIVE SUPPORT (PAS) PAS1. Assign OTO staff to engage Office of Systems Planning to continue refining the ICE-OPS analysis on an annual basis, including expansion to the 9,400 mile Primary Roadway Network
PAS2. Assign staff or hire consultant support to perform an annualized TSMO update and to routinely monitor progress of Service Layer Plan development to ensure consistency with the overall TSMO Program Plan
SUSTAINABILITY AND RESILIENCY (SR) SR1. Continue using INVEST as a tool to assess and encourage sound sustainability practices
SR2. Develop a Resiliency Index for the entire Interstate network
COMMUNICATIONS, MARKETING, AND OUTREACH (COM) COM1. Develop business processes for communicating with and educating internal and external customers in coordination with the Office of Strategic Communications
COM2. Develop an Iowa TSMO online presence beyond Iowa 511, including policies, procedures and interactive maps, to educate and inform customers about mobility on Iowa’s transportation system.
COM3. Develop a quarterly mobility report to clearly illustrate the on-going performance of Iowa’s transportation system
DATA MANAGEMENT (DM) DM1. Provide GIS training for staff and supplement with on-call consultant or in-house expertise
DM2. Develop processes and capabilities for using big data to support performance management
DM3. Develop a process to determine how existing and future data sources will be analyzed, archived, curated and accessed
DM4. Extend and expand expertise and IT infrastructure capacity through university partners, such as InTrans/CTRE
DM5. Develop a “TSMO Data Store” to enable open access of archived and near-real-time information to the public and private sectors
CONTINUOUS IMPROVEMENT (CI) CI1. Lean Principles or other continuous improvement training for OTO staff
CI2. Provide frequent Performance Measures Reports for internal and external audiences
CI3. Complete the Capability Maturity Model Self-Assessment on a 5-year basis
RESEARCH AND DEVELOPMENT RD1. Expand the role of CTRE in providing part-time or full-time research staff on site in OTO to assist with performance measure and decision support development
RD2. Establish a mechanism to test new equipment with industry partners and other agencies (e.g., traffic detection sensor test bed and a future TIM training facility)
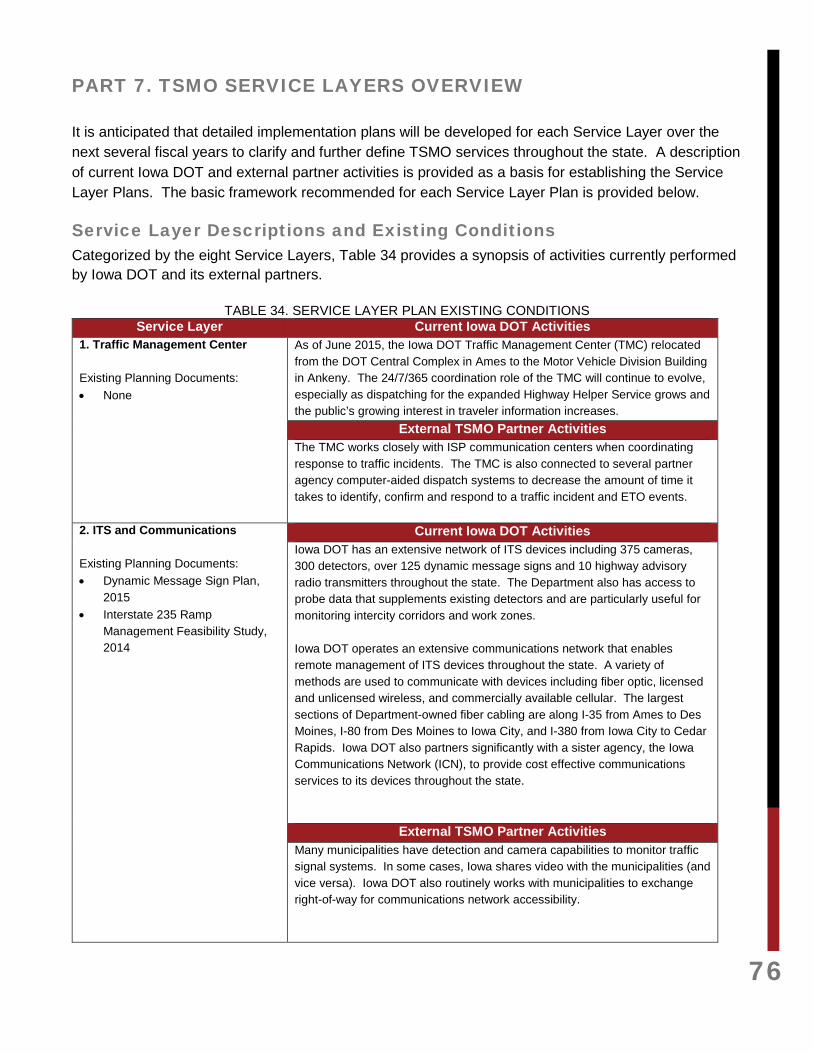
76
PART 7. TSMO SERVICE LAYERS OVERVIEW It is anticipated that detailed implementation plans will be developed for each Service Layer over the next several fiscal years to clarify and further define TSMO services throughout the state. A description of current Iowa DOT and external partner activities is provided as a basis for establishing the Service Layer Plans. The basic framework recommended for each Service Layer Plan is provided below.
Service Layer Descriptions and Existing Conditions Categorized by the eight Service Layers, Table 34 provides a synopsis of activities currently performed by Iowa DOT and its external partners.
TABLE 34. SERVICE LAYER PLAN EXISTING CONDITIONS Service Layer Current Iowa DOT Activities
1. Traffic Management Center Existing Planning Documents: • None
As of June 2015, the Iowa DOT Traffic Management Center (TMC) relocated from the DOT Central Complex in Ames to the Motor Vehicle Division Building in Ankeny. The 24/7/365 coordination role of the TMC will continue to evolve, especially as dispatching for the expanded Highway Helper Service grows and the public’s growing interest in traveler information increases.
External TSMO Partner Activities The TMC works closely with ISP communication centers when coordinating response to traffic incidents. The TMC is also connected to several partner agency computer-aided dispatch systems to decrease the amount of time it takes to identify, confirm and respond to a traffic incident and ETO events.
2. ITS and Communications Existing Planning Documents: • Dynamic Message Sign Plan,
2015 • Interstate 235 Ramp
Management Feasibility Study, 2014
Current Iowa DOT Activities Iowa DOT has an extensive network of ITS devices including 375 cameras, 300 detectors, over 125 dynamic message signs and 10 highway advisory radio transmitters throughout the state. The Department also has access to probe data that supplements existing detectors and are particularly useful for monitoring intercity corridors and work zones. Iowa DOT operates an extensive communications network that enables remote management of ITS devices throughout the state. A variety of methods are used to communicate with devices including fiber optic, licensed and unlicensed wireless, and commercially available cellular. The largest sections of Department-owned fiber cabling are along I-35 from Ames to Des Moines, I-80 from Des Moines to Iowa City, and I-380 from Iowa City to Cedar Rapids. Iowa DOT also partners significantly with a sister agency, the Iowa Communications Network (ICN), to provide cost effective communications services to its devices throughout the state.
External TSMO Partner Activities Many municipalities have detection and camera capabilities to monitor traffic signal systems. In some cases, Iowa shares video with the municipalities (and vice versa). Iowa DOT also routinely works with municipalities to exchange right-of-way for communications network accessibility.

77
3. Traveler Information Existing Planning Documents: • Iowa 511 Traveler Information
System User Analysis, 2015
Current Iowa DOT Activities Iowa DOT plays a critical role in providing traveler information throughout the state. In fact, Iowa is considered a national leader, since it heads a multi-state CARS 511 coalition. In addition to the general public, the Department provides traveler information targeted towards truckers. Beyond 511, Iowa DOT provides traveler information using a variety of social media.
External TSMO Partner Activities Iowa DOT works closely with the emergency response community to provide the most accurate traveler warning and information possible.
4. Traffic Incident Management Existing Planning Documents: • Traffic Incident Management
Blueprint, 2015
Current Iowa DOT Activities A TIM Blueprint was recently completed that helps focus the Department’s efforts throughout the state. Iowa DOT also recently expanded its Highway Helper Service from Des Moines to Council Bluffs and the Cedar Rapids/Iowa City areas. One effort to maintain TIM activities around the state includes routine meetings with existing Multi-disciplinary Safety Teams to discuss recent large scale traffic incident responses and other recommended practices.
External TSMO Partner Activities The TIM Service Layer requires the most external, sustained partner coordination. Iowa State Patrol (ISP) is a significant partner in TIM. Local response agencies, including law enforcement, fire/rescue, EMS, and public works, play an important role in incident response, as does the towing and recovery industry.
5. Emergency Transportation Operations Existing Planning Documents: • ETO Plan, 2013
Current Iowa DOT Activities The Iowa ETO Plan was developed in 2013 to provide a coordinated response between Iowa DOT and Iowa Department of Public Safety to natural disasters and large scale incidents. In addition, OTO serves as the primary Iowa DOT contact for all major emergency management activities, regardless of level of impact to transportation. OTO supports staffing at the Statewide Emergency Operations Center at the Joint Forces Headquarters in Johnston.
External TSMO Partner Activities The Homeland Security and Emergency Management Department (HSEMD) plays a significant role during wide-area emergencies (e.g., flooding, blizzards, etc.) and serves as a bridge between Iowa DOT and FEMA. The Department also coordinates with and provides ETO support to county emergency managers responsible for developing and implementing their county emergency plan.

78
6. Work Zone Management Existing Planning Documents: • Traffic Critical Projects Plan,
Updated Annually
Current Iowa DOT Activities There has been significant effort to proactively monitor work zones that have the potential to create congestion. Through the Traffic Critical Projects (TCPs) initiative, nearly 30 work zones will be equipped with monitoring equipment to warn motorists of back-ups. Special work zone TIM plans are being developed to help emergency response agencies pre-plan responses to incidents in work zones.
External TSMO Partner Activities Work with local agencies to update TIM Plans in vicinity of TCPs.
7. Active Transportation and Demand Management Existing Planning Documents: • Council Bluffs ATDM Concept of
Operations
Current Iowa DOT Activities Iowa DOT plays a less significant role in traffic control. There is a pilot ATDM project in the initial stage on I-35 near Ames to provide weather-related advisory speeds based on friction sensors. Projects in Council Bluffs will likely be the first projects in the state to use lane control strategies to actively manage traffic flow. Also, a ramp meter study for the Des Moines area was completed in 2014 without strong recommendations for implementation.
External TSMO Partner Activities Statewide, traffic signals are operated and maintained by local jurisdictions. There are a few adaptive traffic signal system projects being piloted around the state. Extensive outreach and coordination is required to build relationships with local jurisdictions in order to promote and ultimately implement ATDM including integrated corridor management techniques.
8. Connected and Autonomous Vehicle Existing Planning Documents: • None
Current Iowa DOT Activities Iowa is a PrePass electronic credentialing state, which allows commercial vehicles with appropriate credentials to bypass weight stations. Iowa has also partnered with other states and universities to pursue connected vehicle proof of concept grant opportunities.
External TSMO Partner Activities The University of Iowa is in the process of designating an autonomous vehicle test bed / proving grounds in the Iowa City area, as well as a policy analysis for autonomous vehicles.
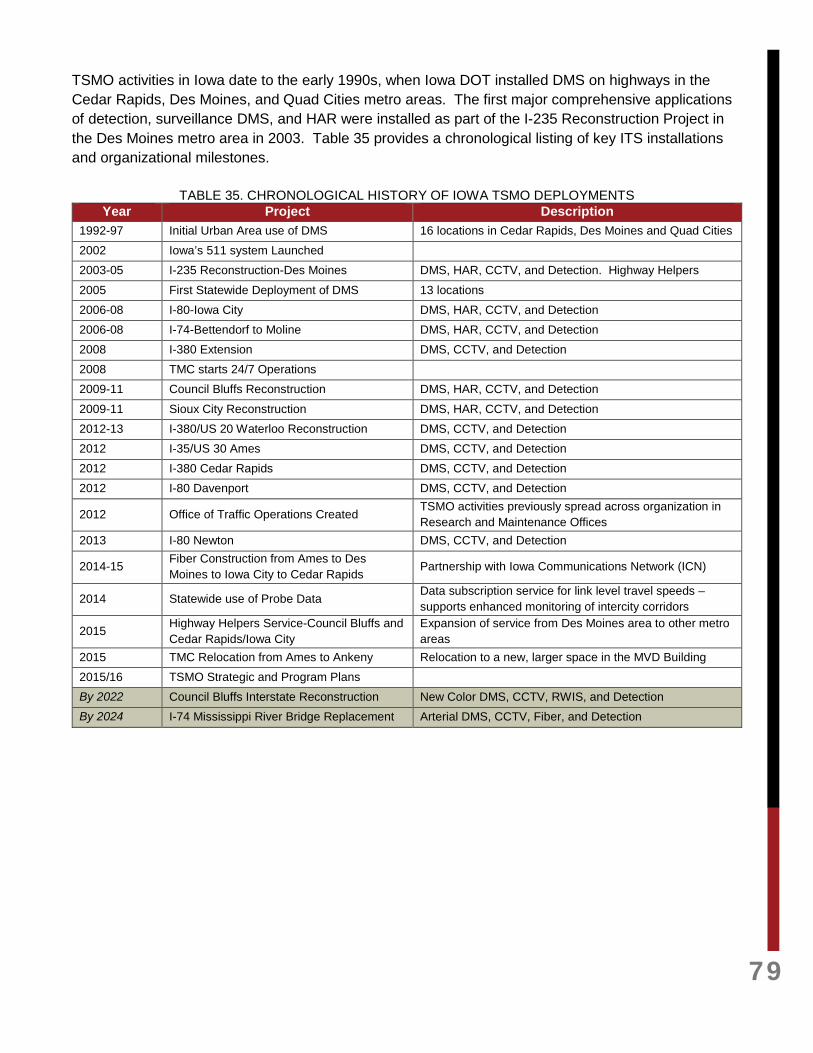
79
TSMO activities in Iowa date to the early 1990s, when Iowa DOT installed DMS on highways in the Cedar Rapids, Des Moines, and Quad Cities metro areas. The first major comprehensive applications of detection, surveillance DMS, and HAR were installed as part of the I-235 Reconstruction Project in the Des Moines metro area in 2003. Table 35 provides a chronological listing of key ITS installations and organizational milestones.
TABLE 35. CHRONOLOGICAL HISTORY OF IOWA TSMO DEPLOYMENTS Year Project Description
1992-97 Initial Urban Area use of DMS 16 locations in Cedar Rapids, Des Moines and Quad Cities 2002 Iowa’s 511 system Launched 2003-05 I-235 Reconstruction-Des Moines DMS, HAR, CCTV, and Detection. Highway Helpers
2005 First Statewide Deployment of DMS 13 locations 2006-08 I-80-Iowa City DMS, HAR, CCTV, and Detection 2006-08 I-74-Bettendorf to Moline DMS, HAR, CCTV, and Detection 2008 I-380 Extension DMS, CCTV, and Detection 2008 TMC starts 24/7 Operations 2009-11 Council Bluffs Reconstruction DMS, HAR, CCTV, and Detection
2009-11 Sioux City Reconstruction DMS, HAR, CCTV, and Detection 2012-13 I-380/US 20 Waterloo Reconstruction DMS, CCTV, and Detection 2012 I-35/US 30 Ames DMS, CCTV, and Detection 2012 I-380 Cedar Rapids DMS, CCTV, and Detection 2012 I-80 Davenport DMS, CCTV, and Detection
2012 Office of Traffic Operations Created TSMO activities previously spread across organization in Research and Maintenance Offices
2013 I-80 Newton DMS, CCTV, and Detection
2014-15 Fiber Construction from Ames to Des Moines to Iowa City to Cedar Rapids
Partnership with Iowa Communications Network (ICN)
2014 Statewide use of Probe Data Data subscription service for link level travel speeds – supports enhanced monitoring of intercity corridors
2015 Highway Helpers Service-Council Bluffs and Cedar Rapids/Iowa City
Expansion of service from Des Moines area to other metro areas
2015 TMC Relocation from Ames to Ankeny Relocation to a new, larger space in the MVD Building 2015/16 TSMO Strategic and Program Plans By 2022 Council Bluffs Interstate Reconstruction New Color DMS, CCTV, RWIS, and Detection By 2024 I-74 Mississippi River Bridge Replacement Arterial DMS, CCTV, Fiber, and Detection

80
The most recent accounting of ITS devices and supporting communication is shown in Table 36 by Transportation District (as illustrated in Figure 30). Districts 1 (Ames) and 6 (Cedar Rapids) combined account for approximately 60% of all ITS devices deployed throughout the state.
TABLE 36. EXISTING ITS AND COMMUNICATIONS DEVICES
ITS Device Type (Responsible Office) Transportation District 1 2 3 4 5 6 Total
Traffic Sensors (Traffic Operations)*
125 18 25 44 0 85 297
Automatic Traffic Recorders (Systems Planning) 24 19 17 22 21 29 132
RWIS with Traffic Detector (Maintenance)
6 7 10 7 9 10 49
Overhead Dynamic Message Signs (Traffic Operations) 19 6 4 15 1 30 75
Side-mounted Dynamic Message Signs (Traffic Operations)
15 4 5 9 0 20 53
Closed Circuit Television Cameras (Traffic Operations)
118 38 35 48 18 118 375
Highway Advisory Radio Transmitters (Traffic Ops)
3 0 2 2 0 3 10
Intersection Conflict Warning System (Traffic Ops)
2 0 0 0 1 3 6
Over Height Detection Systems (Traffic Ops) 1 1 0 0 0 0 2
ATMS Remote Servers (Traffic Operations)
2 1 1 1 0 3 8
Interstate/ Freeway Snow Gates (Traffic Ops and Maintenance)
1 2 1 1 0 0 5
TOTAL ITS Devices 316 96 100 149 50 301 1,012 Miles of Fiber Optic Cable (Traffic Operations)
125 0 25 50 0 110 305
Centerline miles of Detection (Continuous 1- mile spacing) (Traffic Operations)
173 46 48 67 32 140 506
* Fewer than 10 additional detectors located in Illinois
FIGURE 30. IOWA DOT TRANSPORTATION DISTRICTS

81
Iowa DOT also has a fleet of portable ITS devices that can be used to respond to rapidly developing conditions or to support a variety of traffic operations research activities:
• 100 Portable DMS (with TMC connectivity to 82 of them) • 6 Portable Cameras • 12 Speed Display Trailers
Table 37 highlights two of the state’s larger reconstruction projects that will include a variety of additional ITS devices:
• Council Bluffs Interstate (CBIS) Reconstruction – Reconstruction of I-29 and I-80 where they run concurrently in the western part of the state. Construction is anticipated to be completed by 2022.
• Quad Cities I-74 Mississippi River Bridge Reconstruction – Includes building a new bridge and approaches on a different alignment in the Quad Cities area. Overhead DMS signs will be reused and some additional devices will replace aging equipment.
TABLE 37. FUTURE PROGRAMMED ITS DEVICE INSTALLATIONS
TSMO Device Type CBIS I-74 Total Traffic Sensors 41 24 65 Automatic Traffic Recorder 0 0 0
RWIS with Traffic Detector 3 0 3 Overhead Dynamic Message Sign 14 0 14 Side-mounted Dynamic Message Sign 0 0 0 Arterial Dynamic Message Sign 8 4 12 Closed Circuit Television Cameras 31 21 52 Highway Advisory Radio Transmitter 0 0 0
TOTAL-Programmed ITS Devices 97 49 146 Fiber Optic Cable (miles) 0 8 8
Similarly, a variety of TIM Plans have been developed throughout the state, primarily in urban areas, as shown in Table 38.
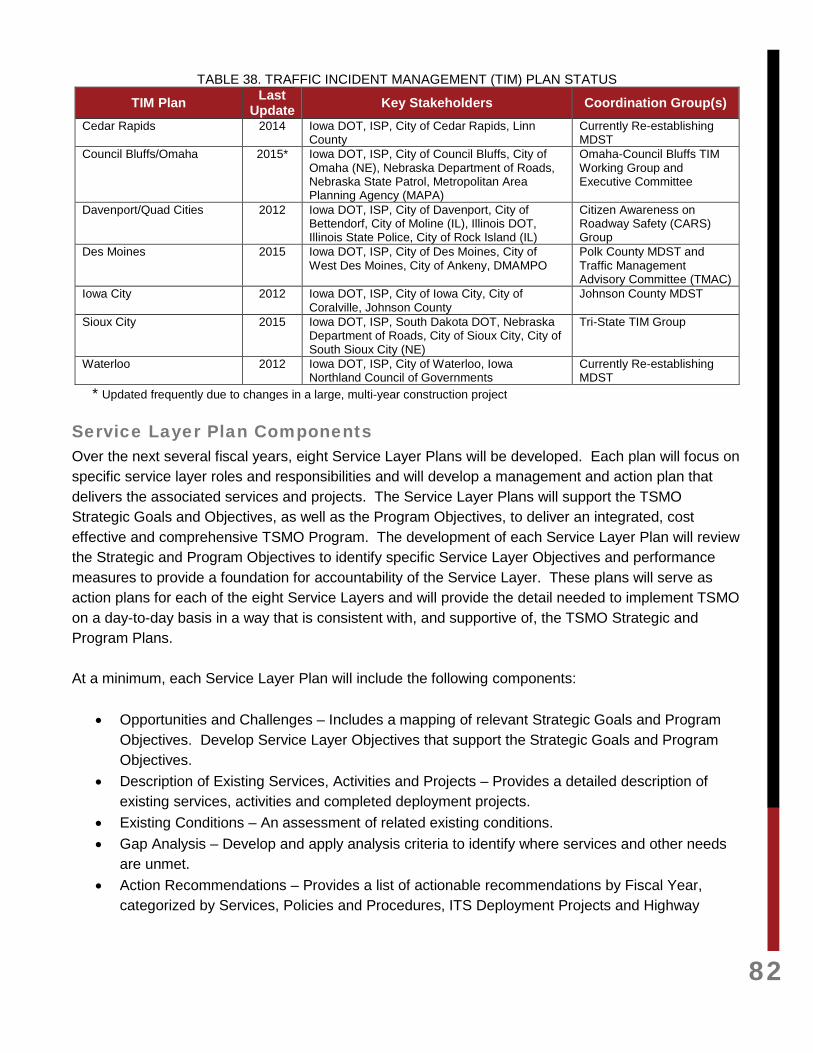
82
TABLE 38. TRAFFIC INCIDENT MANAGEMENT (TIM) PLAN STATUS
TIM Plan Last Update Key Stakeholders Coordination Group(s)
Cedar Rapids 2014 Iowa DOT, ISP, City of Cedar Rapids, Linn County
Currently Re-establishing MDST
Council Bluffs/Omaha 2015* Iowa DOT, ISP, City of Council Bluffs, City of Omaha (NE), Nebraska Department of Roads, Nebraska State Patrol, Metropolitan Area Planning Agency (MAPA)
Omaha-Council Bluffs TIM Working Group and Executive Committee
Davenport/Quad Cities 2012 Iowa DOT, ISP, City of Davenport, City of Bettendorf, City of Moline (IL), Illinois DOT, Illinois State Police, City of Rock Island (IL)
Citizen Awareness on Roadway Safety (CARS) Group
Des Moines 2015 Iowa DOT, ISP, City of Des Moines, City of West Des Moines, City of Ankeny, DMAMPO
Polk County MDST and Traffic Management Advisory Committee (TMAC)
Iowa City 2012 Iowa DOT, ISP, City of Iowa City, City of Coralville, Johnson County
Johnson County MDST
Sioux City 2015 Iowa DOT, ISP, South Dakota DOT, Nebraska Department of Roads, City of Sioux City, City of South Sioux City (NE)
Tri-State TIM Group
Waterloo 2012 Iowa DOT, ISP, City of Waterloo, Iowa Northland Council of Governments
Currently Re-establishing MDST
* Updated frequently due to changes in a large, multi-year construction project
Service Layer Plan Components Over the next several fiscal years, eight Service Layer Plans will be developed. Each plan will focus on specific service layer roles and responsibilities and will develop a management and action plan that delivers the associated services and projects. The Service Layer Plans will support the TSMO Strategic Goals and Objectives, as well as the Program Objectives, to deliver an integrated, cost effective and comprehensive TSMO Program. The development of each Service Layer Plan will review the Strategic and Program Objectives to identify specific Service Layer Objectives and performance measures to provide a foundation for accountability of the Service Layer. These plans will serve as action plans for each of the eight Service Layers and will provide the detail needed to implement TSMO on a day-to-day basis in a way that is consistent with, and supportive of, the TSMO Strategic and Program Plans. At a minimum, each Service Layer Plan will include the following components:
• Opportunities and Challenges – Includes a mapping of relevant Strategic Goals and Program Objectives. Develop Service Layer Objectives that support the Strategic Goals and Program Objectives.
• Description of Existing Services, Activities and Projects – Provides a detailed description of existing services, activities and completed deployment projects.
• Existing Conditions – An assessment of related existing conditions. • Gap Analysis – Develop and apply analysis criteria to identify where services and other needs
are unmet. • Action Recommendations – Provides a list of actionable recommendations by Fiscal Year,
categorized by Services, Policies and Procedures, ITS Deployment Projects and Highway
83
Improvement Projects. The action recommendations are expected to be reflected upwards in future TSMO Program Plan updates.
• Performance Management – Develop specific measures for each Service Layer Objective and a process for evaluating and correcting actions to meet the objectives.
• 5-Year Service Layer Cost Estimate – A detailed cost estimate by fiscal year that will be used to refine the TSMO Program Plan budget estimates.
It is anticipated that Iowa DOT will engage consultants with subject matter expertise in the different service layers to support development of the Service Layer Plans. It is important that Department staff and consultants are familiar with the TSMO Strategic and Program plans in order to align the Service Layer Plans with the overall TSMO Program. This will involve cross-discipline discussions within the Department, as well as outreach to Districts and partner agencies. Although each Service Layer Plan will have its own set of priorities and characteristics, integration with other TSMO and Iowa DOT planning is essential to deliver an integrated TSMO Program.

84
BIBLIOGRAPHY Area Development Magazine. (2014). 28th Annual Survey of Corporate Executives: Availability of
Skilled Labor New Top Priority. Area Development Magazine. Retrieved from http://www.areadevelopment.com/Corporate-Consultants-Survey-Results/Q1-2014/28th-Corporate-Executive-RE-survey-results-6574981.shtml?Page=2
Baird, M. E., & Noyes, P. (2014). Program Planning and Development for Transportation System Management and Operations (TSM&O) in State Departments of Transportation. Washington, DC: National Cooperative Highway Reserch Program at the Nation Academies.
Battelle Memorial Institute. (2014). Iowa Economic Development Authority’s Battelle Report Summary. Columbus, OH: Battelle.
California Department of Transportation. (2014). Intelligent Transportation Systems (ITS)/ Operational Improvement Plan 2014. Marysville: California Department of Transportation.
Cambridge Systematics. (2005). Traffic Congestion and Reliability: Trends and Advanced Strategies for Congestion Mitigation. Washington, DC: Federal Highway Administration. Retrieved from http://www.ops.fhwa.dot.gov/congestion_report/congestion_report_05.pdf
Colorado Department of Transportation. (2013). Transportation System Management and Operations Reorganization Report. Denver, CO.
Delcan, George Mason University School of Public Policy, Philip J. Tarnoff. Housman and Associates. (2012). Institutional Architectures to Improve Systems Operations and Management. Washington, DC: Transportation Research Board of the National Academies.
D'Ignazio, J., & Bowell, B. (2012). Business Case Primer: Communicating the Value of Transportation Systems Management and Operations. Washington, DC: Transportation Research Board of the National Academies.
Federal Highway Administration. (2012). Creating an Effective Program to Advance Transportation System Management and Operations Primer. Washington, DC: Federal Highway Administration.
Federal Motor Carrier Safety Administration. (2014). Large Truck and Bus Crash Facts 2012. Washington, DC: Federal Motor Carrier Safety Administration.
Gopalakrishna, D., Schroeder, J., Huff, A., Thomas, A., & Leibrand, A. (2013). Planning for Systems Management & Operations as part of Climate Chnage Adaptation. Washington, DC: Transportation Research Board of the National Academies.
Hartgen, D., Fields, M., & Feigenbaum, B. (2014). 21st Annual Report on the Performance of State Highway Systems (1984-2012). Washington, DC: Reason Foundation.
Horowitz, Z. W. (2013). CEO Briefing Book on Effective Operations. Washington, DC: Transportation Research Board of the National Academies.
Illinois Department of Transportation. (2014). IDOT Human Capital Strategic Plan. Springfield, IL: Illinois Department of Transportation.
Inrix. (2015). Economic and Environmental Impact of Traffic Congestion in Europe and the US. Retrieved from Inrix: http://inrix.com/economic-environment-cost-congestion/
Iowa Department of Transportation. (2012). Iowa Freight Facts. Retrieved from Iowa Department of Transportation: http://www.iowadot.gov/systems_planning/freight/Iowa%20Freight%20Facts%20and%20Figures.pdf

85
Iowa Department of Transportation. (2012). State Transportation Plan. Ames, IA: Iowa Department of Transportation.
Iowa Department of Transportation. (2013). Iowa Interstate Corridor Plan. Ames, IA: Iowa Department of Transportation.
Iowa Department of Transportation. (2015). 2016-2020 Transportation Improvement Program. Ames, IA: Iowa Department of Transportation.
Iowa Department of Transportation. (2015, May 22). Iowa Work Zone Crashes. Ames, IA: Iowa Department of Transpostation.
Iowa Homeland Security and Emergency Managament Department. (2015). Iowa Strategy for Homeland Security and Emergecny Management, 2015-2017. Des Moines, IA: Iowa Homeland Security and Emergency Management Department.
Jacobs. (2012, April). ITS Planning Guidelines for Smaller Jurisdictions. Phoenix, AZ: Maricopa Association of Governments. Retrieved April 2, 2015, from Maricopa Association of Governments: www.azmag.gov/Documents/ITS_2012-08-14_ITS-Planning-Guidelines-for-Smaller_Jurisdictions.pdf
Karlaftis, M. (1999). ITS Impacts on Safety and Traffic Management: An Investigation of Secondary Crash Causes. ITE Journal, 39-52.
Kittleson & Associates, Inc. (2008, June). Traffic Signal Timing Manual. Washington, DC: Federal Highway Administration. Retrieved March 1, 2015, from Federal Highway Administration: ops.fhwa.dot.gov/publications/fhwahop08024/fhwa_hop_08_024.pdf
Parsons Brinkerhoff, Delcan, George Mason School of Public Policy, Hausman and Associates. (2011). Guide to Improving Capability for Systems Operations and Management. Washington, DC: Transportation Research Board of the National Academies.
SAIC, ATRI. (2010). 2010 Traffic Incident Management Handbook Update. Washington, DC: Federal Highway Administration.
The Road Information Program (TRIP). (2015). Iowa's Top Transportation Challenges. Washington, DC: TRIP, a National Research Group.
Vandervalk, A., & Birenbaum, I. (2013). Florida Transportation Systems Management and Operations Strategic Plan. Talahassee, FL: Florida Department of Transportation.
Wolf, M. B., Folds, D. J., Ray, Jr., J. B., & Blunt, C. T. (2006, January). Transportation Management Center Staffing and Scheduling for Day to Day Operations. Retrieved March 1, 2015, from Federal Highway Administration: http://tmcpfs.ops.fhwa.dot.gov/cfprojects/uploaded_files/Final_Technical_Document1.pdf
Yu, L., Bill, A., Noyce, D., & Chuturri, M. (2013). Characteristics and Contributing Factors of On-Duty 1 Struck-by Crashes. 92th Annual Meeting of the Transportation Research Board (pp. 4-5). Washington, DC: Transportation Research Board at the National Academies. Retrieved from http://www.topslab.wisc.edu/publications/2013/Characteristics%20and%20Contributing%20Factors%20of%20On-Duty%20Struck-by%20Crashes%20(13-3317).pdf

86
APPENDIX A. TRAFFIC INCIDENT MANAGEMENT BLUEPRINT
This space intentionally left blank
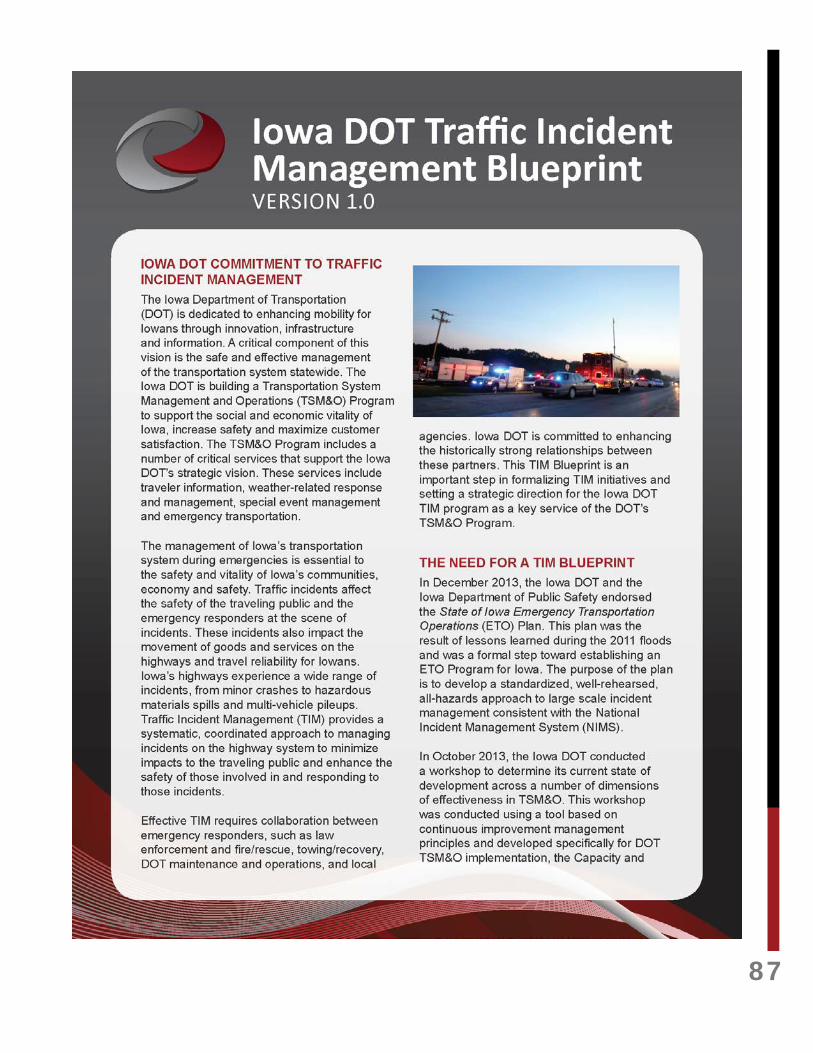
87

88

89

90

91

92

93

94

95
APPENDIX B: ONE-ON-ONE TSMO INTERVIEW SUMMARIES Fourteen (14) one-on-one interviews were held in January and February 2015, with representatives from the following Iowa DOT offices:
• Highway Division • Office of Traffic and Safety • Systems Operations Bureau • Office of Systems Planning • Office of Traffic Operations • District 1(Ames) • Office of Strategic Communications • District 4 (Atlantic) • Office of Construction and Materials • District 6 (Cedar Rapids)
The initial interview findings, grouped by the TSMO planning framework, are shown in A-1.
TABLE A-1. ISSUES IDENTIFIED DURING PHONE INTERVIEWS
Component Issues
Mission, Vision, Goals, Objectives, and Performance Measures
• Need to clearly define and articulate a strategic direction and purpose. • What do our users want and expect? • Strategic initiative, not just a plan. • Need to know where the target is so we can hit it. • Need some strategic direction – program in infancy – important first steps. • What are we capable of doing and sustaining? • Need to define the goal – what is TSMO and what can it deliver? • Need strong messaging to DOT leadership and decision making. • Common goal so that service layers are connected and coordinated • Need a business case to support investment in TSMO for public and decision makers. • Delivery system for the economy and commerce; TSMO cornerstone for successful
economy. • Need to define customer-driven vision.
Leadership and Organization
• OTO does not own the TSMO program; it serves as its champion. • Family of plans framework. • Need strong, consistent leadership over time. • Need clearly defined roles and responsibilities. • Districts need to develop structure to support TSMO – move beyond project delivery
and maintenance. • Work with metropolitan planning organizations (MPOs) to develop regional
approaches.
Business Processes • Current budgeting made up of back of the program, outside services and traffic services.
• Move beyond ad hoc processes. • Need processes for managing staff/vendor relations. • Involve the districts and frontline perspective. • Need annual reevaluation process. • Steps to accomplish goals and performance measures. • Program/process for historic and current data analysis. • Maintain agility to shift direction as needed – adaptable technology. • Prioritization process for projects and services. • Asset management. • Process to integrate TSMO in project development. • Reorganizational challenges at the District level. • Need communications strategies to build messaging, tying it all to vision, mission, and
goals. • Customer/public information processes.

96
Component Issues
Resources (Financial, Human, Infrastructure, and Technology)
• Staffing skills in the right positions. • Develop skills in data analytics. • Need additional TSMO staff at district level. • Need TSMO budget at district level. • Formalize and define staffing roles and skills. • Central, online repository of plans and program documents. • Need staff with media skill in TMC and in districts.
Packages of Services, Projects, and Activities with Related Policies and Guidelines
• Early win areas: TIM, weather, work zones and signals. • Service layers for TMC should address business planning elements: champions, costs,
benefits, implementation steps.

97
APPENDIX C: INTERNAL AND EXTERNAL TSMO FOCUS GROUP SUMMARIES Four focus groups were held in March and April 2015. Two were internally directed, and two included external customers and partners. The internal focus groups had between 8-12 participants from different Iowa DOT disciplines to discuss opportunities. As shown in Figure B-1, a good cross section of the Department was represented, including:
• Office of Traffic Operations • Office of Systems Planning • Office of Traffic and Safety • Organizational Improvement • Office of Strategic Communications • Districts 1, 2, 3, 4, 5 and 6 • Office of Maintenance • Office of Motor Vehicle Enforcement • Office of Construction and Materials
FIGURE B-1. INTERNAL FOCUS GROUPS IN CEDAR RAPIDS AND COUNCIL BLUFFS
Key findings from the internal focus groups include.
• The focus groups reinforced that TSMO activities are at the heart of Iowa DOT’s vision, “Smarter, Simpler, and Customer Driven.”
• There was an interest in leveraging work completed under Interstate Corridor Plan methodology and extending to a set of operation-oriented criteria.
• TSMO Program Plan should guide departmental priorities and clarify how various customers will benefit from sustained investment and focus.
• The Traffic Critical Projects initiative was mentioned many times as a great strategy for managing work zone mobility and safety, and as a good example of how TSMO can crosscut multiple disciplines within the Department. Increased coordination with the TMP process would further enhance this effort.
• Participants indicated a need for projects and services to be customer-driven. However, very little customer engagement occurs beyond traditional project development public involvement.

98
• From an organizational standpoint, there was an interest in distributing TSMO roles and responsibilities more explicitly to the Districts. Creation of a statewide TSMO Group with District representation was suggested.
• Very little mention was made of the need to coordinate with local partners, who control nearly all traffic signals throughout the state.
The external focus groups included one customer-focused and one partner-oriented group, as shown in Table B-1 and Figure B-2. Participants in the customer focus group were chosen to represent a wide range of transportation interests. The partner focus group represented agencies that routinely work in close coordination with Iowa DOT on a variety of TSMO activities.
TABLE B-1. EXTERNAL FOCUS GROUP PARTICIPATION External Customer Focus Group Participants External Partner Focus Group Participants
• ABATE of Iowa • Agribusiness Association of Iowa • Iowa Association of Business and Industry (ABI) • Petroleum Marketers & Convenience Stores of Iowa
(PMCI) • Iowa Tourism Office, Iowa Economic Development
Authority • International Traders of Iowa (ITI) • Des Moines West Side Chamber of Commerce • Highway 61 Coalition • Associated General Contractors (AGC) Iowa
• Iowa Emergency Management Association • Corridor MPO – Cedar Rapids area • Associated General Contractors (AGC) of Iowa • Iowa Chapter of the American Traffic Safety Services
Association (ATSSA) • Iowa EMS Association • Iowa Northland Regional Council of Governments
(INRCOG) – Waterloo/Cedar Falls MPO • City of Ames and Ames Area MPO • Des Moines Area Metropolitan Planning Organization
(DMAMPO)
FIGURE B-2. EXTERNAL CUSTOMER AND PARTNER FOCUS GROUPS
The input from the customer focus group centered on what was most important to them about the functions and services provided by Iowa DOT.
• The overwhelming priority for the group was safety, noting that other areas of importance, such as road conditions, reliability, information and maintenance, all support the objective of safe travel.
• Education and public information were noted as important to user safety. Programs such as buckle-up, share the road, commercial driver training and multimodal education were suggested as important.

99
• TSMO activities should focus beyond Interstates to the complete state highway system, should coordinate with local agencies to serve all users (e.g., agricultural interests who depend on lower level roadways), and should support economic development statewide.
• Traffic incident management, enhanced system reliability for shippers, public information, safe work zones, adequate rest areas and traveler information at Welcome Centers were all noted as important to the customer focus group participants.
The external partner focus group discussed how Iowa DOT traffic operations efforts currently support them and what is important to them in developing a TSMO Program. The following suggestions were made:
• Need to optimize the transportation system due to limited funds. • Support current culture shift to multimodal transportation. • Need clear and consistent policies in areas where local agencies and Iowa DOT interface (e.g.,
red-light-running cameras, right-of-way access for signal maintenance). • Expand the use of GPS technology and other data sources for speed monitoring. • Continue to focus on and improve emergency management coordination through enhanced
communication and preplanning. • Re-evaluate and update regional ITS architectures to make them more useful to Iowa DOT and
local agencies. • Areas of particular success were noted and included the multidisciplinary safety teams
(MDST), the Traffic Critical Projects initiative, and District/MPO planning coordination.

100
APPENDIX D: ACCOMPLISHMENT YEAR PLAN-FY2016
Iowa DOT Transportation Systems Management and Operations (TSMO) Accomplishment Year Plan
State Fiscal Year 2016 July 1, 2015 to June 30, 2016
1. FY 2016 TSMO PROGRAM OBJECTIVES • Fiscal Year 2016 will be a transition year as the Office of Traffic Operations completes its TSMO
Strategic and Program plans and migrates into its TSMO Service Layer development phase, which will detail where and when a variety of TSMO deployment activities should occur over the next 5-years.
• One of the major activities planned at the beginning of the fiscal year is the relocation of the Traffic
Operations Center in Ames to a new, rebranded Traffic Management Center in the Ankeny Motor Vehicle Division Building.
• The Highway Helper Program will also go over a major overhaul. Service will be provided through a
new contractor and expanded from the Des Moines area to Cedar Rapids/Iowa City and Council Bluffs.
• From an ITS deployment perspective, FY 2016 can be categorized as a year of limited installation
of new roadway ITS Devices.
• Due to ongoing maintenance issues, automatic gates positioned along the Interstate will be removed.
• The Traffic Critical Projects (TCP) Program will continue to strategically identify highway work zones
that require enhanced monitoring and management through use of Intelligent Work Zone (IWZ) technology, Work Zone TIM Plans, and/or alternative closure times.
• Advancements in ATMS software will be slowed down as OTO starts to investigate alternatives for
its next generation traffic management solution. • A variety of performance measures will increasingly continue to drive the decisions we make in
managing the highway network. • The partnership with Iowa State University and University of Iowa will continue to grow as the need
for specialized skills in data management, big data analysis and connected/autonomous vehicles continue to grow.

101
2. ACTIVITIES, POLICIES, AND PROCEDURES
Activities, Policies, and Procedures Status LEADERSHIP AND ORGANIZATION (LOD) LOD1. Integrate TSMO principles more broadly into the Department’s policies and procedures
LOD2. Integrate TSMO into the Department’s Strategic and Long Range Plans
LOD3. Clearly articulate OTO’s roles and responsibilities to internal and external audiences
LOD5. Rename Systems Operations Bureau to “Systems Management & Operations Bureau”
LOD6. Designate TSMO responsibilities in each District to the Assistant District Engineers or similar level of District management
LOD7. Designate at least one person in each District to serve as TSMO or Operations Engineer
LOD13. Complete detailed plans for each proposed Service Layer and broadly engage internal offices/Districts during plan development
LOD15. Develop sustainable strategies to maintain momentum of regional TIM activities
LOD17. Establish a statewide TIM Committee LOD20. Use TSMO Program Plan to establish and emphasize departmental priorities
LOD 21. Use TSMO Program goals, objectives and performance criteria as a decision-making framework for resolving disagreements or conflicting priorities
STAFFING EXPERTISE (S) No Activities, Policies, and Procedures Planned
BUDGETING< ACCOUNTING, PROCUREMENT AND CONTRACT MANAGEMENT (BAP) BAP2. Transition TSMO budgeting activities to a five-year cycle, consistent with the 5-Year Program
BAP3. Clarify technical specification roles of OTO, Purchasing, and Office of Design staff
BAP5. Establish streamlined processes for consultant contracting and associated accounts payable activities
PROJECT PROGRAMMING (PP) PP1. Work with the Office of Program Management and the Project Scheduling Engineer to streamline the process for integrating ITS deployments into highway improvement projects in the 5-Year Program
SYSTEMS ENGINEERING (SE) SE4. Define roles for existing staff (or contracted staff) to improve system management duties and minimize issues related to introducing new technology and the potential impacts to the TMC and maintenance activities through systems engineering practices
SE6. Work with the Office of Construction and Materials to develop an as-built management information system and assign staff to serve as the primary point of contact for field equipment and network infrastructure inventory
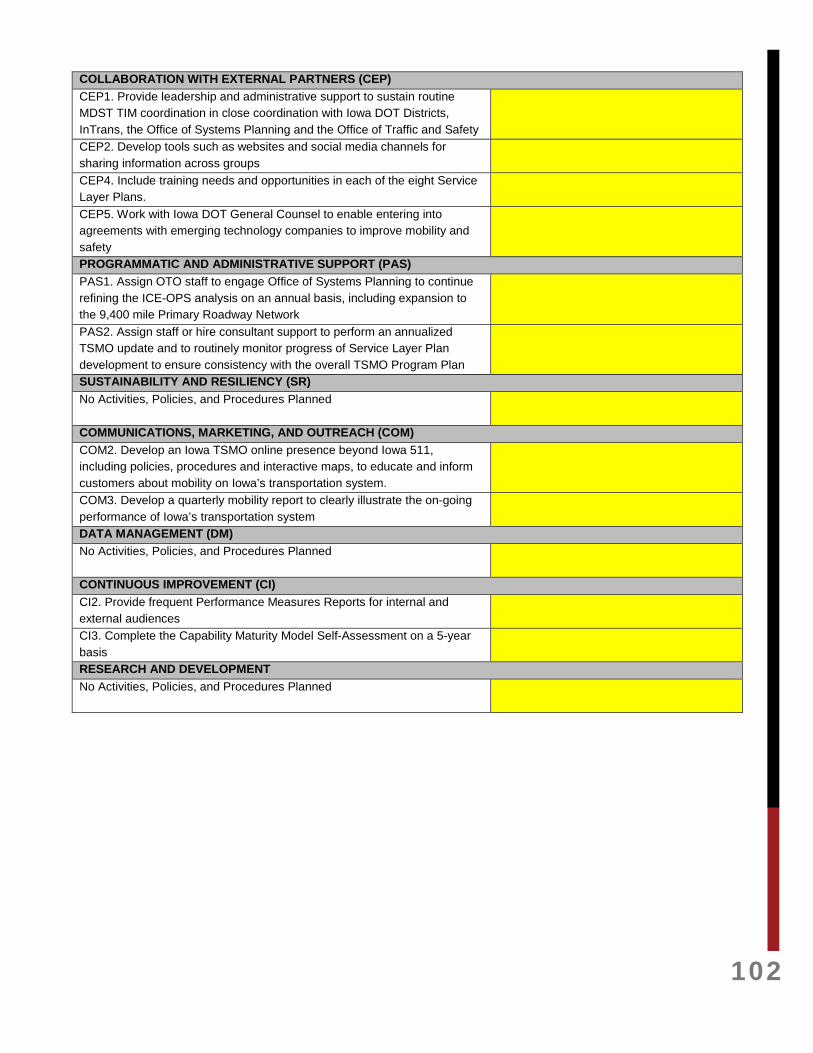
102
COLLABORATION WITH EXTERNAL PARTNERS (CEP) CEP1. Provide leadership and administrative support to sustain routine MDST TIM coordination in close coordination with Iowa DOT Districts, InTrans, the Office of Systems Planning and the Office of Traffic and Safety
CEP2. Develop tools such as websites and social media channels for sharing information across groups
CEP4. Include training needs and opportunities in each of the eight Service Layer Plans.
CEP5. Work with Iowa DOT General Counsel to enable entering into agreements with emerging technology companies to improve mobility and safety
PROGRAMMATIC AND ADMINISTRATIVE SUPPORT (PAS) PAS1. Assign OTO staff to engage Office of Systems Planning to continue refining the ICE-OPS analysis on an annual basis, including expansion to the 9,400 mile Primary Roadway Network
PAS2. Assign staff or hire consultant support to perform an annualized TSMO update and to routinely monitor progress of Service Layer Plan development to ensure consistency with the overall TSMO Program Plan
SUSTAINABILITY AND RESILIENCY (SR) No Activities, Policies, and Procedures Planned
COMMUNICATIONS, MARKETING, AND OUTREACH (COM) COM2. Develop an Iowa TSMO online presence beyond Iowa 511, including policies, procedures and interactive maps, to educate and inform customers about mobility on Iowa’s transportation system.
COM3. Develop a quarterly mobility report to clearly illustrate the on-going performance of Iowa’s transportation system
DATA MANAGEMENT (DM) No Activities, Policies, and Procedures Planned
CONTINUOUS IMPROVEMENT (CI) CI2. Provide frequent Performance Measures Reports for internal and external audiences
CI3. Complete the Capability Maturity Model Self-Assessment on a 5-year basis
RESEARCH AND DEVELOPMENT No Activities, Policies, and Procedures Planned
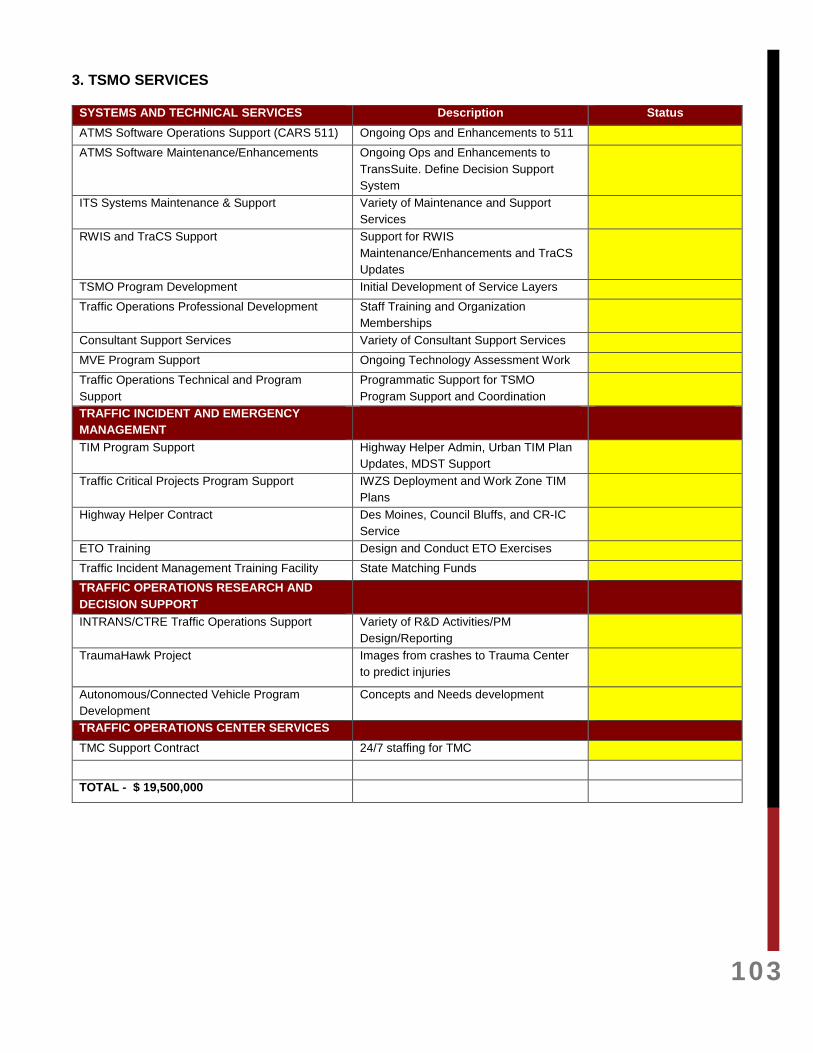
103
3. TSMO SERVICES
SYSTEMS AND TECHNICAL SERVICES Description Status ATMS Software Operations Support (CARS 511) Ongoing Ops and Enhancements to 511 ATMS Software Maintenance/Enhancements Ongoing Ops and Enhancements to
TransSuite. Define Decision Support System
ITS Systems Maintenance & Support Variety of Maintenance and Support Services
RWIS and TraCS Support Support for RWIS Maintenance/Enhancements and TraCS Updates
TSMO Program Development Initial Development of Service Layers Traffic Operations Professional Development Staff Training and Organization
Memberships
Consultant Support Services Variety of Consultant Support Services MVE Program Support Ongoing Technology Assessment Work Traffic Operations Technical and Program Support
Programmatic Support for TSMO Program Support and Coordination
TRAFFIC INCIDENT AND EMERGENCY MANAGEMENT
TIM Program Support Highway Helper Admin, Urban TIM Plan Updates, MDST Support
Traffic Critical Projects Program Support IWZS Deployment and Work Zone TIM Plans
Highway Helper Contract Des Moines, Council Bluffs, and CR-IC Service
ETO Training Design and Conduct ETO Exercises Traffic Incident Management Training Facility State Matching Funds TRAFFIC OPERATIONS RESEARCH AND DECISION SUPPORT
INTRANS/CTRE Traffic Operations Support Variety of R&D Activities/PM Design/Reporting
TraumaHawk Project Images from crashes to Trauma Center to predict injuries
Autonomous/Connected Vehicle Program Development
Concepts and Needs development
TRAFFIC OPERATIONS CENTER SERVICES TMC Support Contract 24/7 staffing for TMC TOTAL - $ 19,500,000

104
4. ITS PROGRAM (DEPLOYMENTS)
INDEPENDENT ITS DEPLOYMENTS Description Status Urban Deployments None Corridor Deployments None
Border Bridge Deployments None Statewide ITS Deployments None Specialized ITS Deployments Match for TIGER Grant Truck Parking
Design Work-
RWIS RWIS stations ITS DEPLOYMENTS FOR HIGHWAY PROJECTS
Council Bluffs Interstate (CBIS) Reconstruction Devices, Fiber, and IWZ
I-29 Reconstruction-Sioux City Devices and IWZ TOTAL - $ 2,674,000