transportpackaging transport packaging · pdf filenot stretch or shrink wrapñis a...
TRANSCRIPT
Prepared by Headley Prax Consulting in association with J. Leslie Bell for
`e Minnesota O2ce of Environmental Assistanceand the American Plastics Council
August 1998
T r a n s p o r t P a c k a g i n g
TransportPackagingCost-Efective Strategies for Reducing, Reusing,
and Recycling in the Grocery Industry
Acknowledgements
The Minnesota Office of Environmental Assistance, theAmerican Plastics Council, and Headley Pratt Consultingwould like to thank the following people for theirassistance on this project. Without their time and effort,the project would not have been possible.
Alan AndersonDale AndersonLyle BigwoodPaul BuhrmannTom Clasen
This report is printed on recycled paper made from 100 percent post-consumer waste.
Design: Jeff Fillion Design [email protected]
Transport PackagingCost-Efective Strategies for Reducing, Reusing,
and Recycling in the Grocery Industry
For more information on this project, contact:
Ken BrownMinnesota Office of Environmental Assistance520 Lafayette Road North, 2nd FloorSt. Paul, MN 51555651-215-0241
Barbara HalpinAmerican Plastics Council1801 K Street, N.W.–Suite 701LWashington, D.C. 20006202-974-5400
Linda HeadleyHeadley Pratt Consulting2709 Norwich Rd.Lansing, MI 48911517-394-7350
Notice and Disclaimer of WarrantiesAPC makes no warranty, express or implied, respecting the accuracy or completeness of the information provided herein including, but not limitedto, implied warranties of merchantability or fitness for a particular use or purpose. APC shall not be responsible for any direct, indirect, incidental orconsequential damages, damages from loss or use or profits, or cost of procurement substitute goods or services in contract, tort or otherwise,arising out of or in connection with the information contained herein. Use of this information is voluntary and reliance on it should only beundertaken after an independent review of its accuracy and completeness.
W. R. (Bob) KingJudy LambDan MohsJohn VectorBob Walfoort
The project partners would like to extend a special thankyou to Bruce Trippet, Operations Manager withSUPERVALU, who spent a great deal of time gatheringdata and working with the project team to quantify theeconomic advantages and disadvantages of plastic pallets.His willingness to answer questions, review data, anddiscuss methodologies was extremely helpful and madethis a more valuable report.

Executive Summary——v
The Project 1
Lessons on Old Corrugated Containers——5
Lessons on Plastic Film——11
Lessons on Pallets——19
Store 1: A Pro0le——26
Store 2: A Pro0le——37
Store 3: A Pro0le——45
Appendix A: Markets for OCC, Wood Pallets, and Plastic Pallets——56
Appendix B: Markets for Plastic Film——58
Appendix C: Publication Resource List——61
Appendix D: SUPERVALU Pallet Payback Analysis——64
Con
tent
s

Exec
utiv
e Su
mm
ary

Transport packaging—which the Minnesota Office of Environmen-tal Assistance (OEA) defines as old corrugated containers (OCC),plastic film, and wooden pallets—comprises about one-fifth ofMinnesota’s total municipal solid waste stream. Therefore, whenthe state set a goal to reduce its packaging discards by 25 percent, ittargeted transport packaging as the most logical place to look foropportunities to reduce, reuse, and recycle.
In addition, the state identified the grocery industry as one of thelargest generators (and, hence, disposers) of transport packaging.Thus, working with stores, distributors, wholesalers, farmers,growers, processors, and product manufacturers to better managetheir transport packaging waste was established as a high priority.
The state realized early on that a cooperative effort was key toachieving its waste reduction goals. Therefore, in a first step, ameeting was held with the OEA, the Minnesota Grocers Associa-tion, and senior managers from several grocery corporations todiscuss possible options. At that meeting, the grocery industryindicated that before it could make changes it needed more infor-mation about cost-effective strategies (or “best practices”) formanaging transport packaging waste. The group also decided that ahands-on examination of waste management practices at stores andwith wholesaler/distributors would be beneficial.
In a second step, the American Plastics Council (APC) joinedforces with the OEA to help gather the information that the groceryindustry needed. The APC was a logical partner because of itsprevious experience working with the grocery industry to implementstretch wrap recycling programs, and because of the growing use ofplastics in transport packaging applications.
Together, the OEA and APC launched a project to
determine how much transport packaging waste was generated bygrocery stores;
Executive Summary
Tranport packagng—
which the Minnesota
O2ce of Environmental
Assistance de0nes as old
corrugated containers,
plastic 0lm, and wooden
pallets—comprises about
one-0th of Minnesota’s
total municual solid
waste stream.
TRANSPORT PACKAGING
v

learn how that waste was being managed;
develop “real world” data showing thepotential economic advantages (anddisadvantages) of making certain wastemanagement decisions;
identify viable reduction, reuse, andrecycling options that grocers couldrealistically implement (given that wastemanagement is not part of their corebusiness); and
compile the information into a reportthat grocers in Minnesota and across thecountry could use to make informeddecisions about the economic and envi-ronmental benefits of reducing, reusing,and recycling transport packaging.
Three grocery stores—and, to a lesser extent,three wholesaler/distributors—also joinedthe effort. These facilities agreed to opentheir doors to the project team and provideit with a wealth of information on wastemanagement costs and practices. By workingcooperatively, the project team learned anumber of valuable lessons about the poten-tial for reducing, reusing, and recyclingOCC, plastic film, and wooden pallets inthe grocery industry.
Following are some of the key lessonslearned.
OLD CORRUGATED CONTAINERSThere is a strong economic incentive forstores to recycle OCC. Using data fromthe three participating stores, it is esti-mated that a typical grocery store willgenerate about 396 tons of OCC per
year and pay an average of $89.88 perton to dispose of it. If, however, it wereto recycle that OCC, it could realizemore than $35,000 in avoided disposalcosts. (See the sidebar entitled “Defin-ing a Typical Store.”)
There is an even greater economicincentive for recycling OCC if oneincludes the revenue generated fromrecovering it. Using a point-in-timeaverage of prices received by the threestores participating in this project, thetypical store could expect to generatemore than $24,000 per year in revenuefrom recycling OCC.
The typical store could realize an averageof $4,800 per year in avoided disposalcosts and $3,500 in additional recyclingrevenue by recovering recyclable OCCthat currently is thrown away due toconfusion with wax-coated OCC. Inaddition, the typical store could accruemore than $700 per year in avoideddisposal costs by eliminating wax-coatedOCC altogether, bringing the totaleconomic benefit to about $9,000.
All three stores participating in theproject have mature OCC recyclingprograms. (They estimate their OCCrecovery rate at about 95 percent.)Therefore, aside from changes with wax-coated OCC, the programs probablycannot grow significantly in terms ofgreater recovery. If OCC recyclingprograms in other stores are equallymature, then source reduction and reuseoptions should be emphasized withgrocers to achieve greater diversion.
EXECUTIVE SUMMARY
vi

While several options are available forreducing the amount of OCC gener-ated, the most significant effort in thegrocery industry relates to the growinguse of tray/shrink packaging. (A tray/shrink package is composed of a corru-gated tray and shrink wrap, which is usedto secure goods to the tray.) Whencomparing full corrugated cases (whichcompletely enclose products in corru-gated) with tray/shrink packages, theproject team found that the latter pack-aging strategy cuts the weight of a trans-port package in half. Industry sourcesmaintain that this reduction in weighttranslates into better shipping efficien-cies, improved processing capabilities,and lower material costs.
PLASTIC FILMThere is not a strong economic incentivefor grocery stores to recycle plastic film.Using data from the three participatingstores, it is estimated that the typicalgrocery store will generate more than10,000 pounds of stretch and shrinkwrap per year, and realize only $500 peryear in avoided disposal costs by recy-cling it. (Stretch wrap typically is used tosecure goods to pallets, and shrink wrapis used to secure smaller quantities oflike goods either together or to a corru-gated tray.)
There is, however, a greater economicincentive for wholesaler/distributors to re-cycle their own film as well as that gener-ated by the stores they serve. Using datafrom one of the participating whole-saler/distributors, the project teamcalculated that it could expect net rev-
enue of more than $45,000 per year byrecycling its own and it stores’ stretchand shrink wrap (given estimated vol-umes and its current market price). Evenat a per-pound price that is 2-centslower, the wholesaler/distributor wouldstill realize net revenue of more than$7,500 per year. (At a price below$.025 per pound, however, the eco-nomics of film recycling for this whole-saler/distributor becomes questionable.)
A typical grocery store today generatesmore shrink wrap than it does stretchwrap. Unfortunately, many recycling
Defining A Typical Store
Clearly, there is no such thing as a “typical” grocerystore. They come in all shapes, sizes, and locations.But for this report, the data assigned to a typicalstore are simply an average of the data provided bythe three stores participating in the project.
What should you know about these stores? All threewere located in suburban areas, they had an aver-age of 62,000 square feet, and their annual sales av-eraged $33 million. This information is importantbecause other stores that want to use the data willneed to adjust it accordingly. For example, a largerstore with higher annual sales will probably gener-ate more transport packaging waste than the “typi-cal” store, whereas a smaller store with lower an-nual sales will generate less.
Keep in mind that the purpose of collecting this datawas not only to inform grocers about how muchtransport packaging waste they generate, but, moreimportant, to demonstrate the “real world” eco-nomic advantages and disadvantages of differentreuse, reduction, and recycling options.
TRANSPORT PACKAGING
vii
programs in the grocery sector focusonly on stretch wrap, which means thatthe most significant portion of a store’sfilm waste is not being recovered. Thisdoes not appear to be a market-drivendecision, since 18 of the 22 film recy-cling companies interviewed for thisproject accept both stretch and shrinkwrap. Given that many stores currentlydo not recycle any of their film, and thatmany others recycle only stretch wrap, itappears that there is significant room forgrowth in recycling plastic film in thegrocery sector, particularly throughwholesaler/retailer partnerships.
Contamination—that is, anything that isnot stretch or shrink wrap—is a concernin film recycling programs. Two of thethree stores participating in this projecthad contamination levels above what isnormally accepted by markets. Thiscould be remedied, however, with fairlysimple education programs designed toinform employees about what is and isnot acceptable.
While film itself has many source reduc-tion benefits, there are products on themarket that may enable the groceryindustry to use less film. For example,one product that was discovered duringthe research phase of the project isScotch™ Brand Stretchable Tape, whichits manufacturer claims can reduce theamount of material needed to stabilizepallet loads by 77 percent. Using datafrom one participating wholesaler/distributor, it was found that the facilitywould generate 7.7 fewer tons of filmwaste per year by switching from stretch
wrap to Scotch™ Brand StretchableTape. (The manufacturer also maintainsthat Stretchable Tape is compatible withstretch wrap in recycling and, therefore,will not contaminate remaining filmstreams.)
PALLETSIndividual grocery stores do not com-monly purchase or dispose of pallets;therefore, there is little incentive forthem to explore opportunities for re-duction, reuse, or recycling. Stores do,however, benefit economically from thecurrent pallet management system.Because all pallets—whether they arewood or plastic, intact or damaged—arereturned to grocery suppliers (or givenaway to employees or consumers), storesdo not have to pay for their disposal.Because of that return and reuse system,the typical grocery store can expect torealize about $31,000 in annual avoideddisposal costs.
The most significant reuse effort under-way in the grocery industry involvesreplacing wood pallets with plastic palletsin order to extend a pallet’s useful life(thereby reducing costs and minimizingpallet waste). Any economic benefits ofsuch a switch will be minimal at thegrocery store level, but it appears thatthey may be substantial at the wholesaler/distributor level. Data provided by oneof the wholesaler/distributors participat-ing in this project showed that the facil-ity realized a savings of 63 cents per tripby using plastic pallets instead of wood.In addition, it had the potential toreduce its workers’ compensation, labor,
EXECUTIVE SUMMARY
viii
and shipping costs by about $556,000per year (or $3.70 per plastic pallet).Furthermore, the wholesaler/distributorachieved payback for its initial up-frontinvestment shortly after the second yearof use.
Although they do not realize directeconomic benefits, the grocery storesparticipating in this project said theyprefer working with plastic pallets be-cause they are lightweight, nestable, takeup less space, have four-way entry, andappear to work with all types of products,including frozen and perishable goods.The most significant drawback, accord-ing to the stores, is that plastic palletscannot be stored on existing store andwarehouse racks. (The racks are designedto hold pallets with flat boards extendingthe full length and width of the palletplatform. Plastic pallets, however, havenine small, protruding legs which arenot compatible with current rackingsystems.) In addition, the stores indi-cated that plastic pallets are more likelyto slide—particularly on truck beds infreezing weather—than their woodencounterparts which have rougher surfaces.
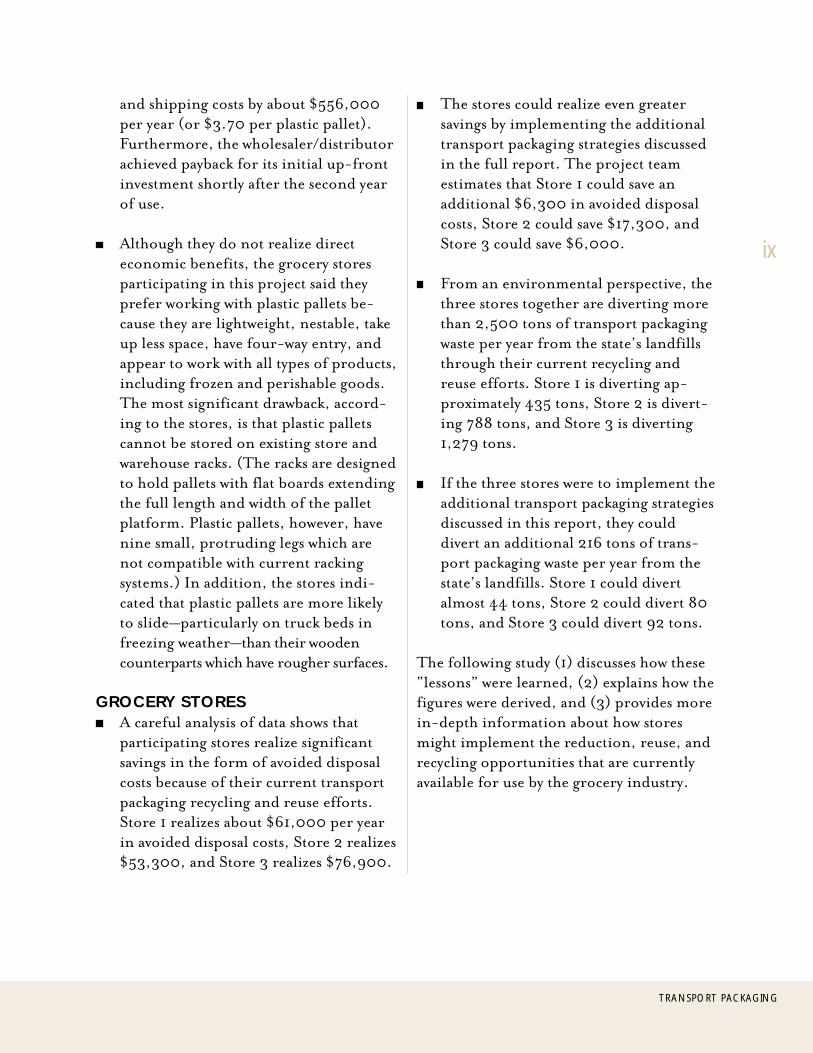
GROCERY STORESA careful analysis of data shows thatparticipating stores realize significantsavings in the form of avoided disposalcosts because of their current transportpackaging recycling and reuse efforts.Store 1 realizes about $61,000 per yearin avoided disposal costs, Store 2 realizes$53,300, and Store 3 realizes $76,900.
The stores could realize even greatersavings by implementing the additionaltransport packaging strategies discussedin the full report. The project teamestimates that Store 1 could save anadditional $6,300 in avoided disposalcosts, Store 2 could save $17,300, andStore 3 could save $6,000.
From an environmental perspective, thethree stores together are diverting morethan 2,500 tons of transport packagingwaste per year from the state’s landfillsthrough their current recycling andreuse efforts. Store 1 is diverting ap-proximately 435 tons, Store 2 is divert-ing 788 tons, and Store 3 is diverting1,279 tons.
If the three stores were to implement theadditional transport packaging strategiesdiscussed in this report, they coulddivert an additional 216 tons of trans-port packaging waste per year from thestate’s landfills. Store 1 could divertalmost 44 tons, Store 2 could divert 80tons, and Store 3 could divert 92 tons.
The following study (1) discusses how these“lessons” were learned, (2) explains how thefigures were derived, and (3) provides morein-depth information about how storesmight implement the reduction, reuse, andrecycling opportunities that are currentlyavailable for use by the grocery industry.
TRANSPORT PACKAGING
ix

Cha
pter
One

TRANSPORT PACKAGING
The Project
INTRODUCTIONIn 1992, the Minnesota Legislature set a goal for the state to reduceits packaging discards by 25 percent within three years and autho-rized that any combination of reduction, reuse, and recycling couldbe used to meet that goal. After the law was passed, the MinnesotaOffice of Environmental Assistance (OEA) embarked on severalsubsequent projects to determine (1) which components of thepackaging waste stream offered the greatest opportunities for reduc-tion, reuse, and recycling, and (2) which sectors generated thosecomponents in large quantities.
The follow-up studies all indicated that transport packaging—whichthe OEA defines as old corrugated containers (OCC), plastic film,and wooden pallets—offered more significant opportunities forreduction, reuse, and recycling than any other packaging type. Thestudies also found that the grocery industry was one of the largestgenerators of transport packaging waste and, therefore, a goodcandidate for reduction, reuse, and recycling programs.
As a result of these findings (and a 1996 study which found that thestate had not reached its 25 percent goal), the OEA formed a part-nership with the Minnesota Grocers Association and individualgrocery corporations to examine ways to address issues related totransport packaging waste. Later, the American Plastics Council(APC) joined the effort and worked cooperatively with the OEA tolearn more about how grocers manage their transport packagingwaste and what options are available to reduce, reuse, and/or recycleit. Since the APC has worked with the grocery industry on previousprojects, and since plastics are being used in greater quantities in trans-port packaging, the APC seemed a logical partner.
The OEA and the APC agreed that, to be effective, the projectshould focus primarily on individual grocery stores (since very littleinformation is available from that point in the distribution system),and on the economics of reducing, reusing, and recycling at thestore level (since economics are the primary driving factor behindall business decisions). The following report is what the two organi-zations learned over the course of the study.
1
In 1992, the Minnesota
Legslature set a goal for
the state to reduce its
packagng discards by 25
percent wihin thre years
and authorized that any
combination of
reducion, reuse, and
recycling could be used to
met that goal.
THE PURPOSEThe purpose of conducting the study wasfourfold. First, there is a great deal oftheoretical discussion about what happenswith transport packaging in the groceryindustry. Unfortunately, there is very littleconcrete information about what happensin practice, particularly at the grocery storelevel. By sponsoring this project, the OEAand the APC hoped to obtain “real world”information about how grocery storesmanage their waste.
Second, the project team wanted to putnumbers to different waste managementoptions to show grocers how implementingreduction, reuse, and recycling programscould affect their bottom lines. Because thegrocery industry is highly competitive andoperates on extremely low margins, it isunlikely that stores will implement programsunless they have some positive economiceffect. Thus, the team wanted to use “realworld” data to determine the potentialeconomic impact of making certain wastemanagement decisions.
Third, the project team wanted to identifyrealistic alternative waste managementoptions that stores could use. There are avariety of reduction, reuse, and recyclingoptions available, but it is unclear which ofthose options make the most sense forgrocery stores.
Finally, the OEA and the APC wanted totake the data gathered in this project and putit into an easy-to-read report so that othergrocery stores could benefit from the re-search. By seeing what was being done (and
could be done) at three participating gro-cery facilities, the project partners hopedthat other grocers may be more motivated tomake reduction, reuse, and/or recycling apart of their day-to-day operations.
The project team realizes that this study hassome shortcomings—it did not includeactual waste sorts which would have providedvaluable information; the data, in someinstances, are limited; and the economicanalyses focus primarily on avoided wastedisposal costs because other types of eco-nomic information either were not availableor were unreliable. Furthermore, time andbudget constraints (inherent in all projects)did not allow for a full investigation of everyreduction and reuse option—only those thatpartipating grocers deemed most significantand/or most viable. The study is, however,an excellent place to start looking at severalcost-effective opportunities to reduce,reuse, and/or recycle transport packaging inthe grocery industry.
THE REPORTWhile studying and working with the threestores and, to a lesser extent, the threewholesaler/distributors that agreed to par-ticipate in this effort, the project teamlearned a number of valuable lessons aboutthe potential for reducing, reusing, andrecycling transport packaging at the grocerystore level. These lessons, or “best prac-tices,” have been summarized in Chapters 2,3, and 4 of the report, and should helpothers in the grocery industry decidewhether or not similar efforts could orshould be undertaken in their own facilities.
2
CHAPTER ONE THE PROJECT
3
TRANSPORT PACKAGING
The project team also wanted to includedetailed information on each of the partici-pating stores. Therefore, Chapters 5, 6, and7 include the analyses that were prepared foreach store showing how they currentlymanage transport packaging waste, the costsassociated with those waste managementpractices, and proposed options for furtherreducing, reusing, and/or recycling thematerial. These analyses have been includedfor readers who want more detailed infor-mation on where the numbers in previouschapters came from, and for those who maywant to compare themselves to a particularstore.
Finally, included in this report are threeother educational pieces. The first piece is alist of companies that currently acceptOCC, wood pallets, and plastic pallets forrecycling. The project team found that alack of knowledge about available markets isone of the barriers preventing grocers frommaximizing their recycling efforts. This listshould provide the assistance that grocersneed to make better program choices. (SeeAppendix A.)
The second piece is similar, but it focuseson markets that accept plastic film forrecycling. This list is more detailed than the
first: In addition to basic contact informa-tion, it includes details on the quantity offilm the markets require, the form they wantthe material in, their quality specifications,current pricing information, and an indica-tion of whether they currently accept filmfrom the grocery sector. This more compre-hensive list was prepared because the projectteam learned that grocers (as well as whole-saler/distributors) were not aware of thequestions they should ask when trying tomarket plastic film. (See Appendix B.)
The final educational piece is a list of publi-cations that the project team read whilepreparing this report. These reports can beused by grocers that want to further exploretheir own reduction, reuse, and recyclingoptions. A brief synopsis of what waslearned from the reports has been includedto help grocers determine which ones will beof most use. (See Appendix C.)
As mentioned earlier, the project partnershope that grocers—in Minnesota and acrossthe country— will use this report to makemore informed decisions about the eco-nomic and environmental benefits of re-ducing, reusing, and recycling transportpackaging waste.
While studying and working with the thre stores and, to a lesser
extent, the thre wholesaler/distributors that agreed to
particuate in this efort, the projec team learned a number of
valuable lessons about the potential for reducing, reusing, and
recycling tranport packagng at the grocery store level.

4
Cha
pter
Tw
o
5
TRANSPORT PACKAGING
Lessons on Old Corrugated Containers
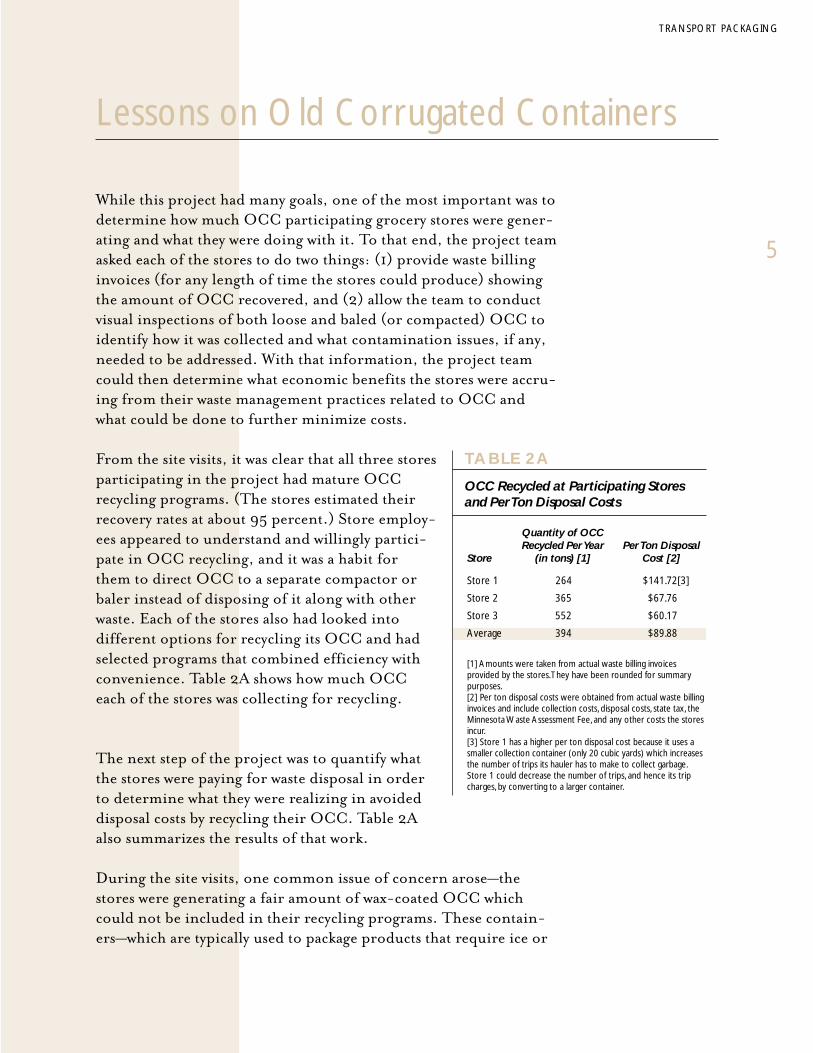
While this project had many goals, one of the most important was todetermine how much OCC participating grocery stores were gener-ating and what they were doing with it. To that end, the project teamasked each of the stores to do two things: (1) provide waste billinginvoices (for any length of time the stores could produce) showingthe amount of OCC recovered, and (2) allow the team to conductvisual inspections of both loose and baled (or compacted) OCC toidentify how it was collected and what contamination issues, if any,needed to be addressed. With that information, the project teamcould then determine what economic benefits the stores were accru-ing from their waste management practices related to OCC andwhat could be done to further minimize costs.
From the site visits, it was clear that all three storesparticipating in the project had mature OCCrecycling programs. (The stores estimated theirrecovery rates at about 95 percent.) Store employ-ees appeared to understand and willingly partici-pate in OCC recycling, and it was a habit forthem to direct OCC to a separate compactor orbaler instead of disposing of it along with otherwaste. Each of the stores also had looked intodifferent options for recycling its OCC and hadselected programs that combined efficiency withconvenience. Table 2A shows how much OCCeach of the stores was collecting for recycling.
The next step of the project was to quantify whatthe stores were paying for waste disposal in orderto determine what they were realizing in avoideddisposal costs by recycling their OCC. Table 2Aalso summarizes the results of that work.
During the site visits, one common issue of concern arose—thestores were generating a fair amount of wax-coated OCC whichcould not be included in their recycling programs. These contain-ers—which are typically used to package products that require ice or
TABLE 2A
OCC Recycled at Participating Storesand Per Ton Disposal Costs
Quantity of OCCRecycled Per Year Per Ton Disposal
Store (in tons) [1] Cost [2]
Store 1 264 $141.72[3]
Store 2 365 $67.76
Store 3 552 $60.17
Average 394 $89.88
[1] Amounts were taken from actual waste billing invoicesprovided by the stores. They have been rounded for summarypurposes.[2] Per ton disposal costs were obtained from actual waste billinginvoices and include collection costs, disposal costs, state tax, theMinnesota Waste Assessment Fee, and any other costs the storesincur.[3] Store 1 has a higher per ton disposal cost because it uses asmaller collection container (only 20 cubic yards) which increasesthe number of trips its hauler has to make to collect garbage.Store 1 could decrease the number of trips, and hence its tripcharges, by converting to a larger container.
moisture to maintain freshness, such asmeat, poultry, broccoli, leaf lettuce, andcarrots—are considered contaminants bymost markets for corrugated and, therefore,must be thrown away.
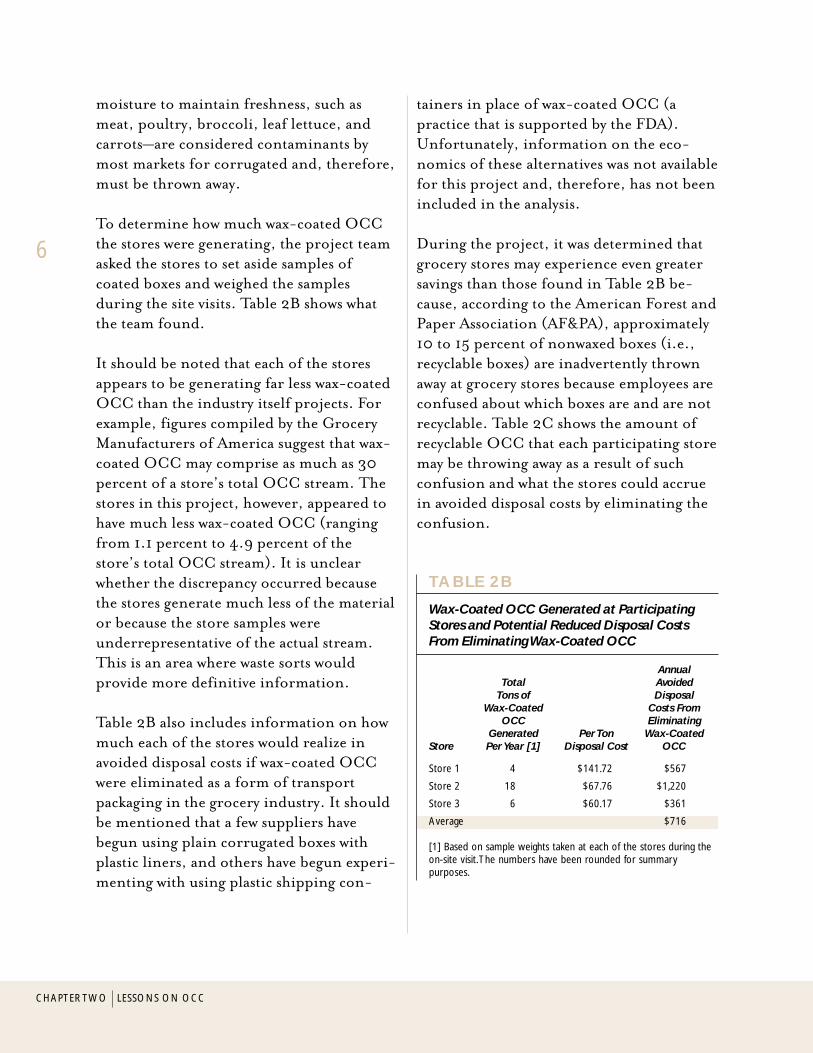
To determine how much wax-coated OCCthe stores were generating, the project teamasked the stores to set aside samples ofcoated boxes and weighed the samplesduring the site visits. Table 2B shows whatthe team found.
It should be noted that each of the storesappears to be generating far less wax-coatedOCC than the industry itself projects. Forexample, figures compiled by the GroceryManufacturers of America suggest that wax-coated OCC may comprise as much as 30percent of a store’s total OCC stream. Thestores in this project, however, appeared tohave much less wax-coated OCC (rangingfrom 1.1 percent to 4.9 percent of thestore’s total OCC stream). It is unclearwhether the discrepancy occurred becausethe stores generate much less of the materialor because the store samples wereunderrepresentative of the actual stream.This is an area where waste sorts wouldprovide more definitive information.
Table 2B also includes information on howmuch each of the stores would realize inavoided disposal costs if wax-coated OCCwere eliminated as a form of transportpackaging in the grocery industry. It shouldbe mentioned that a few suppliers havebegun using plain corrugated boxes withplastic liners, and others have begun experi-menting with using plastic shipping con-
tainers in place of wax-coated OCC (apractice that is supported by the FDA).Unfortunately, information on the eco-nomics of these alternatives was not availablefor this project and, therefore, has not beenincluded in the analysis.
During the project, it was determined thatgrocery stores may experience even greatersavings than those found in Table 2B be-cause, according to the American Forest andPaper Association (AF&PA), approximately10 to 15 percent of nonwaxed boxes (i.e.,recyclable boxes) are inadvertently thrownaway at grocery stores because employees areconfused about which boxes are and are notrecyclable. Table 2C shows the amount ofrecyclable OCC that each participating storemay be throwing away as a result of suchconfusion and what the stores could accruein avoided disposal costs by eliminating theconfusion.
6
CHAPTER TWO LESSONS ON OCC
TABLE 2B
Wax-Coated OCC Generated at ParticipatingStores and Potential Reduced Disposal CostsFrom Eliminating Wax-Coated OCC
AnnualTotal Avoided
Tons of DisposalWax-Coated Costs From
OCC EliminatingGenerated Per Ton Wax-Coated
Store Per Year [1] Disposal Cost OCC
Store 1 4 $141.72 $567
Store 2 18 $67.76 $1,220
Store 3 6 $60.17 $361
Average $716
[1] Based on sample weights taken at each of the stores during theon-site visit. The numbers have been rounded for summarypurposes.

Another thing the project team discovered isthat all of the participating grocery storeswere generating a significant portion ofheavily inked OCC, which is found prima-rily in the vegetable and fruit sections of thestores. In speaking with market representa-tives, however, the presence of this materialdoes not appear to have negatively affectedthe revenue that stores receive for theirOCC. In fact, sources indicated that the vastmajority of OCC recovery programs suc-cessfully comply with the Paper StockIndustry’s specifications for Grade 11 re-quirements. (Those specifications are forcorrugated containers having liners ofeither test liner, jute, or kraft, and contain-ing no more than 1 percent prohibitivematerials and no more than 5 percent totaloutthrows.)
The project team learned a number ofvaluable lessons while working with thestores to analyze their OCC streams andwaste management practices.
Lesson 1: Avoided Disposal CostsClearly, there is a strong economic incen-tive for grocery stores to recycle their OCC,particularly since it is generated in suchlarge quantities (making up the greatestproportion of transport packaging waste in astore’s waste stream). Using data gatheredfrom the three participating stores, a typicalstore could expect to generate an average of396 tons of OCC per year and pay anaverage of $89.88 per ton to dispose of it.If, however, it were to recycle that OCC, itcould realize more than $35,000 in avoideddisposal costs. (See sidebar entitled “Defin-ing a Typical Store.”)
Lesson 2: Recycling RevenueThere is an even greater economic incentivefor recycling OCC if one includes therevenue generated from recycling the mate-rial. Using a point-in-time average of pricesreceived by the three stores participating inthis project, the typical store could expect togenerate more than $24,000 per year inrevenue from recycling OCC. This figureshould be used with caution when makingprogrammatic decisions, however, sinceOCC prices fluctuate over time and varygreatly among stores. For example, wastebilling invoices show that Store 1 received$65 per ton for its baled OCC, Store 2received $36.55 per ton for its loose OCC,and Store 3 received $75 per ton for itsloose OCC (combined with office paperand kraft bags). None of the stores receivedthe national average per ton price for baledOCC, which industry trade publications putat $76.50 for 1997. These wide variationsindicate that any decisions that includerecycling revenue as a factor must be basedon local market prices and conditions.
7
TRANSPORT PACKAGING
TABLE 2C
Quantities of Recyclable OCC Thrown AwayDue to Confusion with Wax-Coated OCC andPotential Avoided Disposal Costs fromEliminating Confusion
Amount of Potential forRecyclable Reducing
OCC that May AnnualBe Thrown DisposalAway Due Costs by
to Confusion Per Ton EliminatingStore (in tons) Disposal Cost Confusion
Store 1 269 x 15% = 40 $141.72 $5,669
Store 2 365 x 15% = 55 $67.76 $3,727
Store 3 555 x 15% = 83 $60.17 $4,994
Average $4,797
Lesson 3: Eliminating Confusion Related toWax-Coated OCCMaking changes related to wax-coated OCCrepresents the single biggest area wherestores could accrue additional economicbenefits. Using data from the three partici-pating stores, it was found that the typicalstore could realize an average of $4,800 peryear in avoided disposal costs and $3,500 inadditional recycling revenue by recoveringrecyclable OCC that currently may bethrown away due to confusion with wax-coated OCC. (Recycling revenue is based onthe average price received by the threeparticipating stores during a specific pointin time.) In addition, the typical store couldaccrue more than $700 per year in avoideddisposal costs by eliminating wax-coatedOCC altogether. That brings the totaleconomic benefit of making changes relatedto wax-coated OCC to about $9,000 perstore per year.
Lesson 4: Alternatives to Wax-Coated OCCSome people in the grocery industry believethat wax-coated OCC cannot be replaced.This does not, however, appear to be thecase. According to the stores participating inthe project, some suppliers of meat, poul-try, vegetables, and fruit have already begunshipping their goods in alternative contain-ers, such as plastic bags that are then con-tained inside recyclable corrugated boxes.An example of such a box was found at Store2 for hydrocooled carrots distributed byGolden Valley Produce. A similar box wasused by Golden Plump Poultry to shipchicken parts. (A competitor’s chicken partswere sent in a plastic bag inside a wax-coatedbox.) In fact, Store 3 states that it no longerreceives any meat or poultry in wax-coatedcontainers.
The stores also point out that sometimesidentical products from the same manufac-turer come in both wax-coated andnonwaxed boxes. At Store 2, an employeeshowed the team a waxed box of bananas anda nonwaxed box of bananas shipped by thesame company. This, perhaps, indicates thatthe type of transport package used may notalways be driven solely by performanceissues but also by the preference of thesupplier and/or the availability of a certaintype of package. Regardless of the reasons,apparently some manufacturers/growershave already begun to reduce their relianceon wax-coated containers.
Lesson 5: Reusable Shipping ContainersWhile researching alternatives to wax-coatedOCC, the project team learned that somegrocery systems have begun replacing bothrecyclable and wax-coated OCC with re-turnable plastic shipping containers. Forexample, in a study entitled “TransportationPackaging and the Environment (1997),” itwas reported that Shaw’s Supermarkets—achain of 46 stores in Massachusetts—starteda waste reduction program in 1993 in whichreusable plastic shipping containers weresubstituted for corrugated containers,plastic bags, and polystyrene boxes whenshipping perishable goods. As a result of theswitch, the 46 stores realized a 70 percentdecrease in the amount of waste they gener-ated. While it is impossible to draw anyconclusions about what the stores partici-pating in this project might expect in theway of source reduction if they were toswitch to returnable plastic shipping con-tainers, it is worth mentioning that thispractice has been supported by the FDA forperishable goods and appears to be workingin practice within other grocery systems.
8
CHAPTER TWO LESSONS ON OCC
A precedent has been set at each of theparticipating stores for using returnableplastic shipping containers. For years theirdistributors have been shipping such thingsas health and beauty products, magazines,and general merchandise in plastic totes. Inaddition, bakeries commonly use returnableplastic trays to deliver baked goods. Obvi-ously the issues of using returnable plasticcontainers in vegetable, produce, meat, andpoultry applications are much more com-plex—such as the variety of products avail-able, the number of growers and farmersinvolved, the need to pre-cool some prod-ucts, and the shipping of wet goods—butthese programs do demonstrate that return-able systems can be developed and workeffectively in the grocery sector.
Lesson 6: Maturity of OCC RecyclingProgramsThe OCC recycling programs in the threeparticipating grocery stores appear to befairly mature. (The stores estimate theirrecovery rates at 95 percent.) Therefore,aside from changes with wax-coated con-tainers, the programs probably cannot growsignificantly in terms of greater recovery. IfOCC recycling programs in other stores areequally mature, then source reduction andreuse options should be pursued with gro-cers to achieve greater diversion. The suc-cess of store OCC recycling programsindicates that stores can effectively recyclematerials if (1) there is an economic incen-tive to do so, (2) there is support from storemanagement, and (3) the programs are easyand accessible.
Lesson 7: ContaminationThe project team did not notice any signifi-cant contamination issues associated withOCC. Two of the stores put their OCC in adesignated compactor for storage anddensification, and the project team foundfew contaminants except for an occasionalpiece of writing paper. One store—Store 1—bales its OCC, and the project team notedthat it stores the bales outside on an un-paved lot without pallets. The store’s mar-ket, however, did not have a problem withits storage practices or the fact that palletswere not used.
Lesson 8: Tray/Shrink PackagingWhile several source reduction options existfor OCC—such as replacing full corrugatedcontainers with kraft bags and source-reducing the flaps of corrugated boxes—themost significant source reduction trend inthe grocery industry is the shift from fullcorrugated containers to tray/shrink packag-ing (where goods are placed on corrugatedtrays and sealed with shrink wrap). Thesidebar entitled “Source Reduction Benefitsand Other Issues Related to Tray/ShrinkPackaging” shows that this packaging shiftcuts the weight of a transport package inhalf. This reduction translates into lowershipping costs, lower material costs, and areduction in processing costs, all of whichhelp improve the efficiency of the grocerydistribution system and reduce the amountof transport packaging waste that must behandled. (See the sidebar for more detailedinformation about the source reduction andcost benefits of tray/shrink packaging as wellas grocers’ perceptions of the package.)
9
TRANSPORT PACKAGING

10
Cha
pter
Thr
ee
11
TRANSPORT PACKAGING
Lessons on Plastic Film
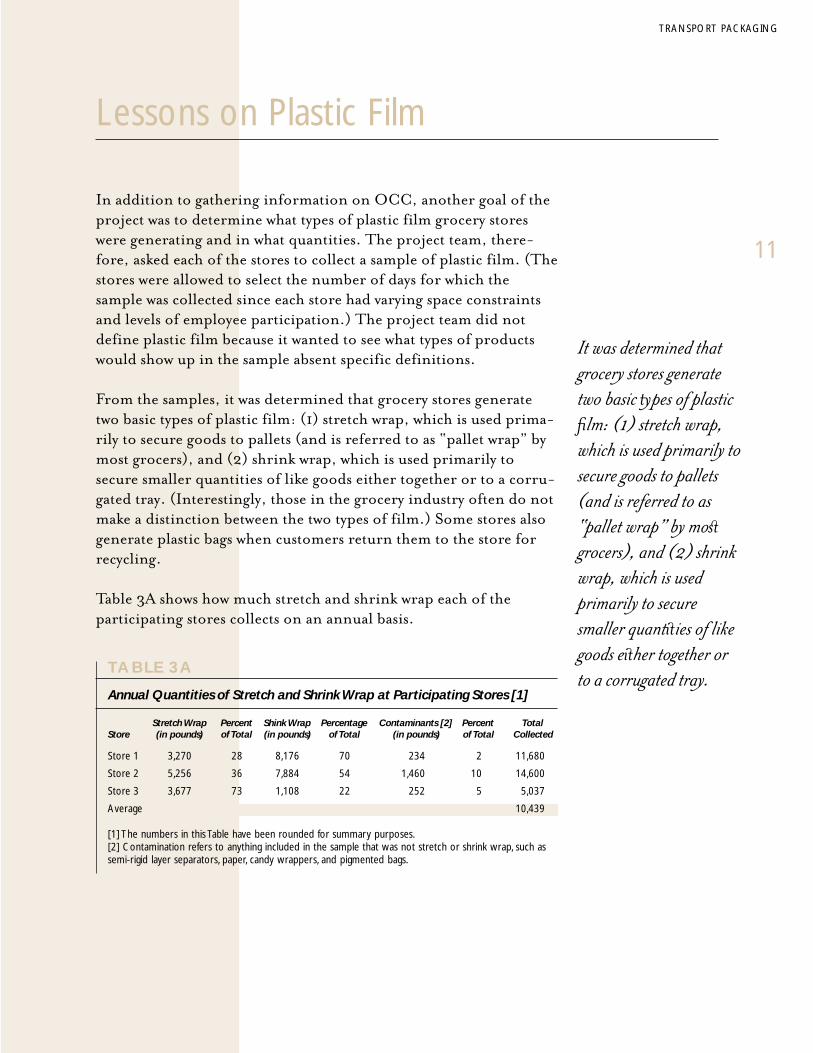
In addition to gathering information on OCC, another goal of theproject was to determine what types of plastic film grocery storeswere generating and in what quantities. The project team, there-fore, asked each of the stores to collect a sample of plastic film. (Thestores were allowed to select the number of days for which thesample was collected since each store had varying space constraintsand levels of employee participation.) The project team did notdefine plastic film because it wanted to see what types of productswould show up in the sample absent specific definitions.
From the samples, it was determined that grocery stores generatetwo basic types of plastic film: (1) stretch wrap, which is used prima-rily to secure goods to pallets (and is referred to as “pallet wrap” bymost grocers), and (2) shrink wrap, which is used primarily tosecure smaller quantities of like goods either together or to a corru-gated tray. (Interestingly, those in the grocery industry often do notmake a distinction between the two types of film.) Some stores alsogenerate plastic bags when customers return them to the store forrecycling.
Table 3A shows how much stretch and shrink wrap each of theparticipating stores collects on an annual basis.
It was determined that
grocery stores generate
two basic ypes of plastic
0lm: (1) stretch wrap,
which is used primarily to
secure goods to pallets
(and is referred to as
“pallet wrap” by mos
grocers), and (2) shrink
wrap, which is used
primarily to secure
smaller quantiies of like
goods eiher together or
to a corrugated tray.TABLE 3A
Annual Quantities of Stretch and Shrink Wrap at Participating Stores [1]
Stretch Wrap Percent Shink Wrap Percentage Contaminants [2] Percent TotalStore (in pounds) of Total (in pounds) of Total (in pounds) of Total Collected
Store 1 3,270 28 8,176 70 234 2 11,680
Store 2 5,256 36 7,884 54 1,460 10 14,600
Store 3 3,677 73 1,108 22 252 5 5,037
Average 10,439
[1] The numbers in this Table have been rounded for summary purposes.[2] Contamination refers to anything included in the sample that was not stretch or shrink wrap, such assemi-rigid layer separators, paper, candy wrappers, and pigmented bags.

12
CHAPTER THREE LESSONS ON PLASTIC FILM
The next step in the project was to quantifywhat each of the participating stores was payingfor waste disposal and what they could expect torealize in avoided disposal costs if they were torecycle their stretch and shrink wrap instead ofthrowing it away. Table 3B summarizes theresults of that work.
Of the three stores that participated in theproject, only Store 1 was actively recyclingplastic film. The store collects both stretchand shrink wrap, as well as plastic bags, andships the material through a backhaul ar-rangement to its wholesaler/distributor.The wholesaler/distributor puts the filmfrom Store 1 (along with that collected fromother stores) into a holding area where it iscombined with the stretch wrap generated bythe distribution center. The wholesaler/distributor bales the material, and it ispicked up on a regular basis by Bunzl Recy-
cling, a local market. No revenue is receivedfor the film by the store or the wholesaler/distributor; therefore, the only economicbenefit is in the form of avoided disposalcosts.
As Table 3A indicates, Store 1 does a fairlygood job of keeping contaminants out of itsfilm stream. The other two stores, however,had fairly high contamination rates in theirsamples. The contaminants included suchthings as green and blue semi-rigid layerseparators (used with produce), red andbeige potato bags, bag liners from produceboxes, strapping, plastic bottles, candywrappers, and fresh flower wraps. Most ofthese contaminants could be avoided if afairly simple, straightforward educationprogram were developed. (Keep in mindthat no education was done prior to samplecollection.)
Two of the three stores participating in theproject—Store 1 and Store 3—also collectplastic bags from customers for recycling.Samples from the stores indicate that theformer collects approximately 1,144 poundsof plastic bags per year and the latter collectsabout 1,059 pounds per year. In bothprograms, the bags are sent back to thestores’ wholesaler/distributors, where theyare consolidated for Bunzl Recycling. AtStore 1, the bags are marketed along withstretch and shrink wrap, whereas at Store 3they are marketed alone. (Store 3’s whole-saler/distributor collects its own stretch wrapfor recycling but sells it to a different market.)
The project team learned a number ofvaluable lessons while working with thestores to collect stretch and shrink wrap.
TABLE 3B
Potential Annual Avoided Disposal Costs atParticipating Stores From Recycling Stretch andShrink Wrap
PotentialQuantity of Annual Avoided
Film Collected Per Ton Disposal Costs(in tons) [1] Disposal Through
Store Per Year Cost [2] Recycling
Store 1 6 $141.72 850
Store 2 7 $67.76 474
Store 3 3 [3] $60.17 181
Average 502
[1] Quantities are based on samples collected and weighed duringthe site visits. The numbers have been rounded for summarypurposes.[2] Per ton disposal costs were obtained from actual waste billinginvoices and include collection costs, disposal costs, state tax, theMinnesota Waste Assessment Fee, and any other costs the storesincur.[3] It should be noted that Store 3’s sample was much smaller thanthat of other stores and probably represents about half of what itcould actually collect.
13
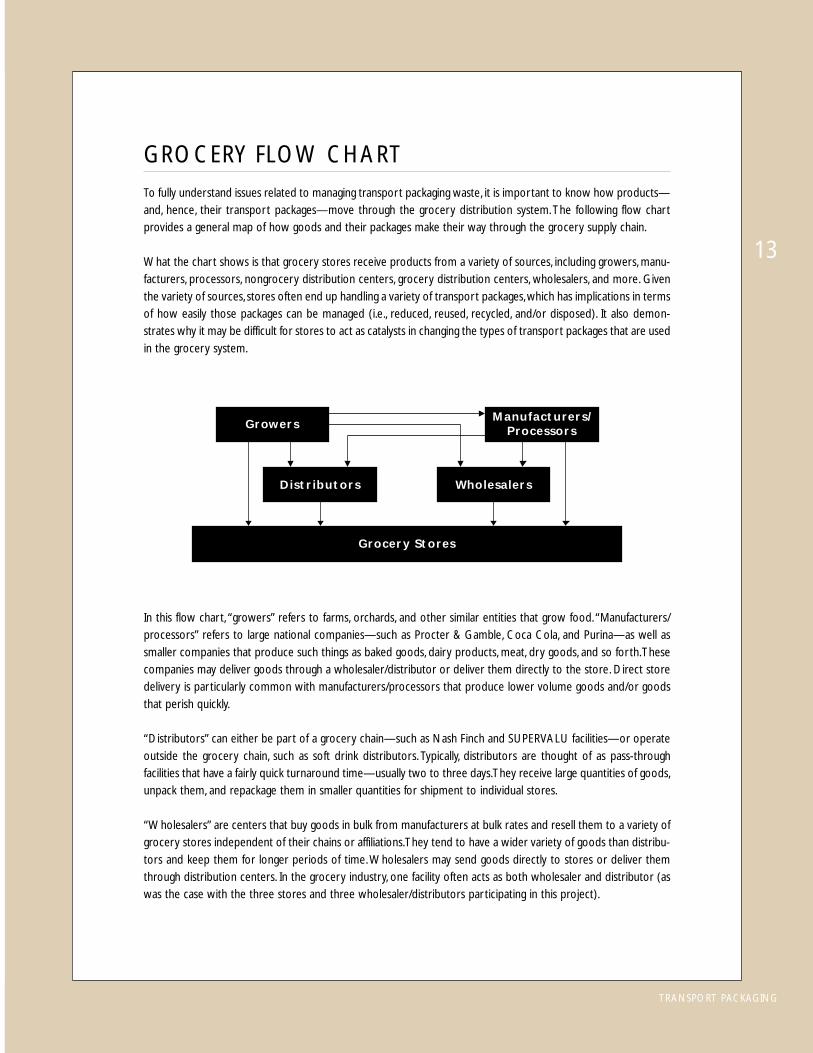
To fully understand issues related to managing transport packaging waste, it is important to know how products—
and, hence, their transport packages—move through the grocery distribution system. The following flow chart
provides a general map of how goods and their packages make their way through the grocery supply chain.
What the chart shows is that grocery stores receive products from a variety of sources, including growers, manu-
facturers, processors, nongrocery distribution centers, grocery distribution centers, wholesalers, and more. Given
the variety of sources, stores often end up handling a variety of transport packages, which has implications in terms
of how easily those packages can be managed (i.e., reduced, reused, recycled, and/or disposed). It also demon-
strates why it may be difficult for stores to act as catalysts in changing the types of transport packages that are used
in the grocery system.
In this flow chart, “growers” refers to farms, orchards, and other similar entities that grow food. “Manufacturers/
processors” refers to large national companies—such as Procter & Gamble, Coca Cola, and Purina—as well as
smaller companies that produce such things as baked goods, dairy products, meat, dry goods, and so forth. These
companies may deliver goods through a wholesaler/distributor or deliver them directly to the store. Direct store
delivery is particularly common with manufacturers/processors that produce lower volume goods and/or goods
that perish quickly.
“Distributors” can either be part of a grocery chain—such as Nash Finch and SUPERVALU facilities—or operate
outside the grocery chain, such as soft drink distributors. Typically, distributors are thought of as pass-through
facilities that have a fairly quick turnaround time—usually two to three days. They receive large quantities of goods,
unpack them, and repackage them in smaller quantities for shipment to individual stores.
“Wholesalers” are centers that buy goods in bulk from manufacturers at bulk rates and resell them to a variety of
grocery stores independent of their chains or affiliations. They tend to have a wider variety of goods than distribu-
tors and keep them for longer periods of time. Wholesalers may send goods directly to stores or deliver them
through distribution centers. In the grocery industry, one facility often acts as both wholesaler and distributor (as
was the case with the three stores and three wholesaler/distributors participating in this project).
GROCERY FLOW CHART
Grocery Stores
Distributors Wholesalers
GrowersManufacturers/
Processors
TRANSPORT PACKAGING
Lesson 1: Quantities of Plastic FilmUsing an average of the data gathered atthree participating stores, a typical grocerystore could expect to collect more than10,000 pounds of stretch and shrink wrapper year for recycling. (This is without anyconcerted collection efforts and withoutemployee education.) While this amountmay seem like a lot from a grocery store’sperspective, it is not a lot from a market’sperspective. Of the 22 markets contacted forthis project, only 9 have no minimumquantity requirements. One market acceptsminimum loads of 1,000 pounds, anotherfour markets accept minimum loads of5,000 pounds, and two markets have10,000-pound requirements. The remain-ing six markets require more material than agrocery store is likely to generate in a year.Thus, it may be difficult (although notimpossible) for stores to market stretch andshrink wrap on their own. Instead, as dem-onstrated by Store 1, it may be easier forgrocery stores to recycle their film through abackhaul arrangement with their wholesaler/distributor.
Lesson 2: Avoided Disposal CostsFrom a grocery store’s perspective, there isnot much economic incentive to recyclefilm. As Table 3B shows, the typical grocerystore can expect to save an average of only$500 per year in avoided disposal costs byrecycling stretch and shrink wrap. It isimportant to remember, however, thatdecreased costs of any amount may bevaluable in the highly competitive, low-margin grocery industry. And if film con-tinues to replace OCC in transport packag-ing, then the amount of film available forrecycling will grow and the economic ben-efits of recycling it will improve.
Lesson 3: Economic Benefits forWholesaler/DistributorsWhile there may not be an economic incen-tive for stores to recycle film, there may bean economic incentive for wholesaler/distributors to do so. For example, oneparticipating wholesaler/distributor serves180 stores in Minnesota. If each of thosestores sent an average of 10,000 pounds ofstretch and shrink wrap back to the whole-saler/distributor for recycling, that wouldequate to 1,854,000 pounds (or 927 tons)of film per year. Add to that the 34,600pounds (or 17.3 tons) of stretch wrap thatthe wholesaler/distributor generates itself,and the total annual quantity of film avail-able for recycling would be 1,888,600pounds (or 946 tons). The wholesaler/distributor reported that it currently re-ceives 5 cents per pound for its material,which means the total revenue from recy-cling film would be $94,430 per year.
The wholesaler/distributor will also incursome costs. An APC study entitled “StretchWrap Recycling: A How-To Guide” esti-mates that stretch wrap recycling programscost about $.026 per pound, includingexpenses related to employee training,special containers, baling labor, bale wire/strapping, and labor related to collectingand upgrading the material. Using thisestimate, the wholesaler/distributor couldexpect to incur costs of about $49,104.After program costs, therefore, the whole-saler/distributor could expect net revenue of$45,326 per year by recycling stretch andshrink wrap. (In addition, it would keepnearly 950 tons of waste out of the landfill.)
14
CHAPTER THREE LESSONS ON PLASTIC FILM
Even if you were to make a more conserva-tive revenue estimate of 3 cents per pound,the wholesaler/distributor would still expe-rience net gains of $7,554 per year fromrecycling film. If avoided disposal costs werefigured into the equation, that same whole-saler/distributor would realize an additional$1,716 per year. (The wholesaler/distributorreported its disposal costs at $99.18 per ton.If that figure is multiplied by the 34,600pounds of film it generates, it equates to$1,716 in avoided disposal costs per year.)
Lesson 4: Opportunities for IncreasedRecyclingIt is a commonly held belief that mostgrocery stores and wholesaler/distributorsare currently recycling their stretch andshrink wrap. This does not, however, appearto be true. Only one of the three storesparticipating in this project was recyclingplastic film, and only one wholesaler/dis-tributor was accepting film back from itsstores for recycling. (The other two whole-saler/distributors were recycling their ownfilm but not accepting it back from theirstores.) Therefore, it appears that there isconsiderable room for growth in recoveringplastic film from grocery stores.
Lesson 5: Recycling Stretch and ShrinkWrap TogetherAs Table 3A demonstrates, stores can expectto generate more shrink wrap than stretchwrap, which is not commonly known. (Store3 was the one exception to that rule, but itssample was problematic in terms of both sizeand composition.) To date, many filmrecycling programs in the grocery sectorhave focused only on stretch wrap, whichmeans the most significant portion of astore’s film waste is not being collected.This does not appear to be a market-drivendecision since 18 of the 22 film recyclingmarkets contacted during this project acceptboth stretch and shrink wrap. It may, how-ever, be driven by wholesaler/distributorswhich generate only stretch wrap and maynot be aware that the two films can be mar-keted together.
Lesson 6: ContaminationContamination is a problem that needs tobe addressed in the grocery sector. As Table3A shows, the amount of contaminationfound in the film samples at two of the threeparticipating stores exceeded typical marketspecifications. Therefore, stores that want torecycle stretch and shrink wrap need toeducate employees about what is and is notacceptable. As proven by Store 1, this bar-
15
TRANSPORT PACKAGING
It is a commonly held belief that mos grocery stores and
wholesaler/distributors are currently recycling their stretch
and shrink wrap. `is dos not, however, appear to be true.
rier is not insurmountable. A simple train-ing session in which employees learn whatstretch wrap and shrink wrap is and where itis generated will go a long way toward im-proving quality. Samples of acceptablematerials should be posted near collectioncontainers so that employees can check thematerial prior to putting it in the collectionbox or bag. During the training session,employees should also be shown commoncontaminants—such as those mentionedearlier—so they know what not to include.
Lesson 7: Management SupportEnthusiasm for recycling film varies widelyamong stores. One of the stores participat-ing in this project wanted very much torecycle film and was aggressive in obtainingits sample. Another store had its filmsample thrown away twice prior to the sitevisit, and the third store was less than en-thusiastic about obtaining a sample eventhough it had willingly agreed to participatein the project. The varying levels of enthusi-asm are a reminder that recycling is not partof a grocery store’s core business, and unlessmanagement is excited about recycling andcommitted to making its programs work,then stores cannot succeed.
Lesson 8: Storage SpaceWhile all of the participating stores men-tioned concerns about space constraints,none of them appeared to have problems inpractice. They simply put the film in what-ever type of container was available—rangingfrom gaylord boxes and carts to bags andmetal cages—and stored it in any availablespace. Stores working with wholesaler/distributors on backhaul programs for filmwill have trucks coming and going on a daily
basis, which should allow them to movestretch and shrink as often as necessary tokeep it from taking up floor space.
Lesson 9: Marketing FilmThe project team learned that one of thebiggest barriers to recycling film at thegrocery store and wholesaler/distributorlevel is the fact that people are not aware ofthe markets that are available for film, norare they aware of what they must do to meetmarket specifications. For that reason, theproject team developed a market listing(found in Appendix B) of companies inMinnesota and select companies fromaround the country that accept film fromthe grocery sector for recycling. For eachcompany, the project team has listed thecompany name, location, and telephonenumber, as well as the quantity of film itrequires, the form it wants its material in,its quality requirements, and pricing infor-mation where available. This listing can beused by grocers and wholesaler/distributorsthat want to start new film recycling programsor look for alternatives to current markets.
Lesson 10: Source ReductionWhen working with one grocery store, theproject team learned about a product beingmanufactured by 3M called Scotch™ BrandStretchable Tape (ST). 3M maintains thatthe product—which is made with linear lowdensity polyethylene (as is most stretch andshrink wrap), is 4 or 6 mils thick, and has asolventless adhesive—offers significantsource reduction opportunities over tradi-tional stretch film. In its product literature,the company indicates that 2.1 ounces (or60 grams) of ST can replace 9.1 ounces (or260 grams) of stretch wrap on a typical load,resulting in a 77 percent material savings.
16
CHAPTER THREE LESSONS ON PLASTIC FILM

17
TRANSPORT PACKAGING
Using ST probably would not result in anysignificant benefits at the grocery store level(except for modest avoided disposal costs ifthe store were not recycling its stretch wrap),but it may provide a more significant op-portunity for source reduction at the whole-saler/distributor level. For example, one ofthe wholesaler/distributors participating inthis project reported that it purchases ap-proximately 20,000 pounds (or 10 tons) ofstretch wrap per year to secure goods topallets and, in most instances, the stretchwrap is discarded by its stores. If the whole-saler/distributor were to use ST instead ofstretch film, it would generate only 4,600pounds (or 2.3 tons) of transport packagingwaste, which is preferable from an economicperspective because eliminating waste at thesource is more cost-effective than recyclingit at the back end.
ST may also appeal to others in the grocerydistribution system. For example, 3Mreports that a meat packing house was pack-ing 48-50 pounds of ham into 10-inch-high boxes. The boxes were then stacked inseven layers on a 48" x 40" pallet, securedwith stretch film and cornerboards, andtransported to an off-site blast freezer. At
the freezer, the cornerboards and stretchfilm were removed to improve cold air flowto the hams and reduce freezing time. Afterthat process, the hams were rewrapped andsent to a distributor.
When exploring ways to reduce its costs, themeat packing house found that ST was agood alternative to stretch wrap because (1)it allowed air to flow through the pallet loadand, therefore, did not have to be removedduring freezing, and (2) it required less rawmaterial. The meat packer was using 15.7ounces of stretch wrap each time the palletwas wrapped, which meant that a total of31.4 ounces of material was being used forshipment. The same pallet configurationrequired a total of only 3.3 ounces of ST,resulting in 28.1 fewer ounces of transportpackaging waste per pallet load. In addition,the meat packing house saved 42.5 percentin material costs.
It should be noted that the project team didnot conduct any of its own research on theperformance or cost of ST. The example isincluded only to apprise those in the grocerydistribution system of a potential sourcereduction option they may want to investigate.

Cha
pter
Fou
r

TRANSPORT PACKAGING
Lessons on Pallets
19
As with OCC and plastic film, one of the project goals was to deter-mine how many pallets stores receive; what they do with them afteruse; what reduction, reuse, and recycling options are available; andwhat the economic impact of those options would be on individualgrocery stores. To that end, the project team worked with the storesto estimate how many pallets they receive on a regular basis. Table4A shows the results of that work.
TABLE 4A
Tons of Pallets (48"x 40") Rotating in Stock Per Year
Number of Total Weight Number of Total WeightWood Units of Wood Plastic Pallets of Plastic
Rotating Pallets Rotating Pallets Total AnnualStore in Stock (in tons) in Stock (in tons) Tonnage [1]
Store 1 10,400 159.5 0 0 160
Store 2 15,695 372.8 4,380 50.37 423
Store 3 27,375 636.5 9,125 86.7 724
[1] The numbers have been rounded for summary purposes.
The stores participating in the project do not dispose of pallets attheir facilities. Instead, when goods are unloaded, the pallets arestacked near the loading/unloading area and returned to the sup-plier, whether that be the store’s wholesaler/distributor, a grower/farmer, or a processor/manufacturer. Even when pallets are dam-aged, they are returned to suppliers for repair or recycling, or givento customers and employees for their own use. This fully “return-able” pallet system, which has been in operation for many years,benefits stores economically in the form of avoided disposal costs.Table 4B shows the avoided costs that each store experiences becauseit does not have to dispose of pallets.
TABLE 4B
Avoided Disposal Costs that Result from Returnable Pallet Programs
Annual Tons of Per Ton Annual AvoidedStore Pallets Generated Disposal Cost Disposal Costs
Store 1 160 $141.72 $22,675
Store 2 423 $67.76 $28,662
Store 3 724 $60.17 $43,563
Average $31,633
During the project, it was noted that two ofthe three participating stores are currentlyreceiving goods on plastic pallets (or ship-ping platforms). In both instances, thepallets are part of a pilot project being runby the store’s wholesaler/distributor to testthe feasibility of using reusable plasticpallets in the grocery distribution system.Both stores report that they like plasticpallets because they are lightweight,nestable, uniform in size, and easier andsafer to handle than their wood counter-parts. The only drawback is that plasticpallets do not work with the stores’ existingracking systems, which means that if goodsare not immediately unloaded, the palletsmust be stored on the ground (thus, takingup valuable floor space). This did not,however, appear to be a significant problemat either facility.
Since grocery stores do not purchase ordispose of pallets, there is little incentive forthem to explore opportunities for reducing,reusing, or recycling. For that reason, theproject team refocused its efforts on palletissues that arise at the wholesaler/distributorlevel.1 At present, one of the most pressingissues related to pallets (and the issue thatwas ultimately chosen for research in thisproject) is whether plastic is an economicallyviable alternative to wood.
To answer that question, the project teamturned to SUPERVALU—the nation’s largestgrocery wholesaler/distributor headquar-tered in Eden Prairie, Minnesota—which
volunteered to provide “real world” data onthe economics of using returnable plasticpallets. Using SUPERVALU’s data, theproject team found that
SUPERVALU saved 63 cents per tripover the course of three years by usingplastic pallets instead of wood;
it could potentially reduce its “indirect”or “soft” costs by approximately$556,000 per year (or $3.70 per pal-let); and
it achieved payback on its initial invest-ment shortly after the second year ofuse.
Following is an explanation of howSUPERVALU and the project team arrivedat those figures. It should be noted that,while the numbers were derived from actualdata provided by SUPERVALU, they arebased on a series of assumptions made byboth SUPERVALU and the project team—assumptions that must be taken into consid-eration when trying to interpret the eco-nomic value of using plastic pallets. It alsoshould be noted that neither SUPERVALUnor the project team purport that plasticpallets are a panacea; instead, they are oneoption that the grocery industry can explorein its efforts to implment economicallyviable reduction, reuse, and recycling pro-grams.
COST ANALYSIS: DIRECTECONOMIC BENEFITSAt present, SUPERVALU uses approxi-mately 20 million pallets, which can bebroken down into three basic categories: (1)
20
CHAPTER FOUR LESSONS ON PALLETS
1 Slip sheets are another option that could have been explored, but thestores participating in this project believed that reusable plastic palletswere more prevalent and a better option to study given limited time andresources.
about 3.5 million are wood CHEP pallets,which are leased through a third-partysystem, (2) about 16.35 million are standardwhite wood pallets that SUPERVALU some-times purchases and manages, and (3)150,000 are standard plastic shippingplatforms that it purchases and manages.(The latter pallets are used for transportinggoods to stores only and are not rackable.)
If the grocery industry were to make astraight cost comparison based only on theinitial purchase price of a pallet, plasticpallets would not fare well. SUPERVALUreports that plastic pallets cost an average of$21, whereas white wood pallets cost only$7. SUPERVALU is quick to point out,however, that while the initial purchaseprice of a plastic pallet is three times that ofa wood pallet, plastic pallets have a signifi-cantly longer life. For example,SUPERVALU reports that its plastic palletsmake an average of 100 trips per year, andfor the past three years have required mini-mal repair and replacement, putting theirlifetime trippage to date at about 300cycles. Comparatively, its wood palletstypically make only 10 cycles before needingreplacement.
Put in financial terms, the average plasticpallet costs SUPERVALU 7 cents per trip($21.00 divided by 300 trips), compared tothe average wood pallet which costs 70 centsper trip ($7.00 pallet cost divided by 10trips). Therefore, SUPERVALU is saving 63cents per trip by using plastic pallets. (Inpractice, the savings are probably evengreater since this analysis does not includeexpenses related to repairing wooden pal-lets—expenses that are usually incurred twice
during the life of a wood pallet. In addition,the savings are based on three years of use,but SUPERVALU believes that plastic palletswill be used for a much longer period.)
A common question from grocery industryrepresentatives regarding plastic pallets is:“How soon can we expect to achieve pay-back?” In other words, if they make a sub-stantial upfront investment in plastic pal-lets, when will the savings start outweighingthe expense? While there are several waysthat one can make that calculation, theproject team used a formula that took intoaccount (1) the initial purchase price ofboth wood and plastic pallets, (2) repaircosts for wood pallets, and (3) replacementcosts for wood and plastic pallets. The teamthen projected these costs over a five-yearperiod and found that SUPERVALUachieved payback sometime after the secondyear of using plastic pallets. The results alsoindicate that SUPERVALU can expect netsavings of about $2.9 million over thecourse of five years by using 150,000 plasticpallets. (See Appendix D for more informa-tion on how these numbers were calculated.)
Another question that grocers ask is whetherreplacing wood pallets with plastic palletswill result in avoided disposal costs (anotherpotential economic benefit). ForSUPERVALU, the answer is no because itsdistribution centers do not dispose of woodpallets. Instead, wood pallets come into thedistribution centers filled with goods frommanufacturers. The goods are then removedfrom the pallets, broken down into smallerlots, reloaded on wood pallets, shipped tothe stores that SUPERVALU serves, andshipped back to one of SUPERVALU’s
21
TRANSPORT PACKAGING
distribution centers. The distributioncenters then contract with local third-partypallet recyclers and remanufacturers to takethe pallets, repair the damaged ones, recyclethe ones beyond repair, and return theintact ones. While some SUPERVALUdistribution centers pay for this service,others receive revenue (over and above thecost) from the wood stream they generate.When looking across the entire corporation,SUPERVALU believes that the total cost ofhandling wood pallet waste is offset by therevenues generated by recycling. Therefore,if wood shipping platforms were replacedwith plastic shipping platforms, there wouldnot be an economic benefit in the form ofavoided disposal costs. (Similarly, mostplastic pallet vendors will pay a small fee forreturned damaged plastic pallets, butSUPERVALU believes these revenues wouldbe offset by transportation costs.)
COST ANALYSIS: INDIRECTECONOMIC BENEFITSWhile several studies have been conductedon the potential direct economic benefits ofusing plastic pallets, very little informationexists on potential “indirect” or “soft”benefits, such as savings that may resultfrom reduced workers’ compensationclaims, reduced labor, or reduced shippingcosts. In an effort to try to generate suchdata, SUPERVALU helped the project teamdevelop a system for measuring indirectbenefits. Following are the results of theproject team’s analysis using SUPERVALU’sdata and proposed methodology.
Reduced Workers’ Compensation ClaimsIn 1997, SUPERVALU had a total of 186pallet-related injuries, which generated
$900,000 in workers compensation claims.Although the company does not distinguishbetween claims related to wood or plasticpallets, it does track general types of pallet-related injuries, including (1) stress injuries(that result from lifting, pushing, or pullingpallets); (2) slivers and cuts; (3) crushedextremities; and (4) injuries from steppingon pallets (such as falls, twisted ankles, andso forth).
In 1997, the greatest percentage of palletinjuries at SUPERVALU were stress-related.Of the 186 injuries, between 30 and 35 per-cent were stress-related (56-65 injuries), andthose injuries accounted for 60 percent ofSUPERVALU’s pallet-related workers’ com-pensation costs (or $540,000). SUPERVALUfeels that stress-related claims probably aremore likely to occur with wood pallets thanwith plastic pallets since the latter weighconsiderably less. (The project teamweighed SUPERVALU pallets at one of itsstores and found that plastic pallets weighedonly 19 pounds whereas its wood counter-parts weighed 46.5 pounds.) Therefore, ifSUPERVALU were to use all plastic pallets,it could reduce stress-related workers’ com-pensation claims by as much as one-third or$178,200 per year. If those cost savings areapplied on a per-pallet basis, SUPERVALUcould save as much as $.009 per pallet inworkers’ compensation claims by switchingentirely from wood to plastic ($178,200/20million pallets in circulation = $.009 perpallet).
In addition, SUPERVALU reports that 5percent of all injuries in 1997 were relatedto slivers and cuts, which are most likely tooccur when using wood pallets. Considering
22
CHAPTER FOUR LESSONS ON PALLETS

that those injuries accounted for about 2percent of SUPERVALU’s total workers’compensation costs that year (or $18,000),it could save an additional $ .001 per palletby switching from wood to plastic ($18,000/20 million pallets).
Adding the $.009 per pallet in reducedclaims related to stress injuries to the $.001in reduced claims related to cuts and sliversindicates that SUPERVALU could reduce itstotal workers’ compensation claims by asmuch as $.01 per pallet by switching fromwood to plastic. Since SUPERVALU cur-rently has 150,000 plastic pallets in circula-tion, it probably has reduced its actual costsby about $1,500 per year.
Reduced Labor CostsThe way that SUPERVALU calculates re-duced labor costs relates to the way in whichpallets are moved within the system. Withplastic pallets, SUPERVALU engineers havecalculated that they can save 6 seconds perpallet in movement time each time a plasticpallet makes a trip. Therefore, sinceSUPERVALU has 150,000 plastic palletsthat each make 100 trips per year, it has atotal potential time savings of 90 millionseconds, or 1.5 million minutes, or 25,000hours.
To translate that into dollars, SUPERVALUcalculates warehouse employee salaries at$22 per hour ($15 per hour in wages plus $8per hour in benefits). Using that figure andthe 25,000 hours saved by using plasticpallets instead of wood, SUPERVALU couldrealize an annual savings of $550,000 peryear, or approximately $3.66 per pallet.
Reduced Shipping CostsBecause plastic pallets have “four-way en-try,” SUPERVALU maintains that you can“spin” them when loading the truck. Thatspinning capability translates into spacesavings on the vehicle which, in turn, allowsSUPERVALU to load more goods onto onetruck. SUPERVALU estimates that by spin-ning pallets, it can get four extra palletsonto a vehicle, thereby increasing truckcapacity by 10 percent.
It follows that if SUPERVALU can increase theamount of product it can load onto everyvehicle, then there can be fewer deliveries,which should result in fewer total miles trav-eled. In 1997, SUPERVALU trucks traveled atotal of 95 million miles at a conservative costestimate of $1.25 per mile; therefore, its travelcosts that year were $118,750,000. IfSUPERVALU used all plastic pallets, it couldreduce that cost by 10 percent or $1,187,500.Since it does not always send full loads to itsparticipating stores, SUPERVALU recom-mends that that number be cut in half, mean-ing that it would really save about $593,750 inshipping costs by switching entirely from woodto plastic pallets. Dividing $593,750 by 20million equates to a per-pallet savings of 3cents (or $.030). Of course, at present,SUPERVALU has only 150,000 plastic palletsin circulation, which puts its actual annualsavings at about $4,500.
Total Indirect Economic BenefitsAs Table 4C shows, if you add up all of thepreceding numbers, SUPERVALU couldpotentially reduce its “indirect” or “soft”costs by approximately $556,000 per year(or $3.70 per pallet) by using 150,000plastic pallets.
23
TRANSPORT PACKAGING
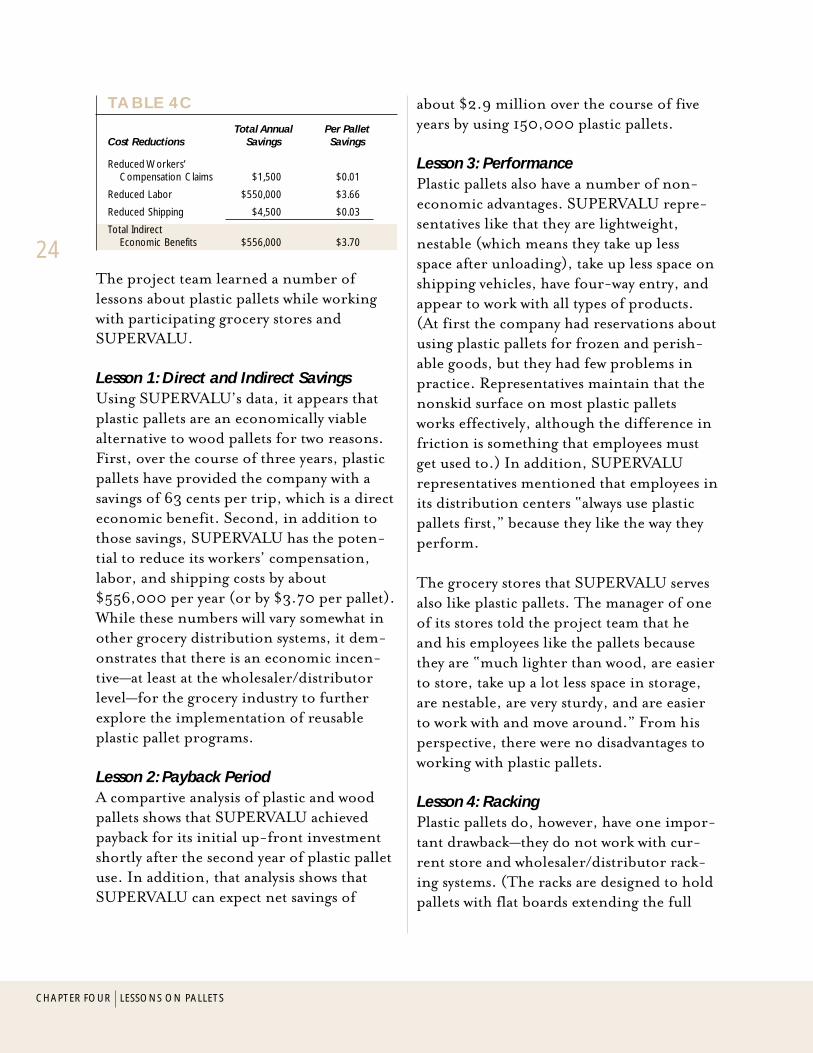
TABLE 4C
Total Annual Per PalletCost Reductions Savings Savings
Reduced Workers’Compensation Claims $1,500 $0.01
Reduced Labor $550,000 $3.66
Reduced Shipping $4,500 $0.03
Total IndirectEconomic Benefits $556,000 $3.70
The project team learned a number oflessons about plastic pallets while workingwith participating grocery stores andSUPERVALU.
Lesson 1: Direct and Indirect SavingsUsing SUPERVALU’s data, it appears thatplastic pallets are an economically viablealternative to wood pallets for two reasons.First, over the course of three years, plasticpallets have provided the company with asavings of 63 cents per trip, which is a directeconomic benefit. Second, in addition tothose savings, SUPERVALU has the poten-tial to reduce its workers’ compensation,labor, and shipping costs by about$556,000 per year (or by $3.70 per pallet).While these numbers will vary somewhat inother grocery distribution systems, it dem-onstrates that there is an economic incen-tive—at least at the wholesaler/distributorlevel—for the grocery industry to furtherexplore the implementation of reusableplastic pallet programs.
Lesson 2: Payback PeriodA compartive analysis of plastic and woodpallets shows that SUPERVALU achievedpayback for its initial up-front investmentshortly after the second year of plastic palletuse. In addition, that analysis shows thatSUPERVALU can expect net savings of
about $2.9 million over the course of fiveyears by using 150,000 plastic pallets.
Lesson 3: PerformancePlastic pallets also have a number of non-economic advantages. SUPERVALU repre-sentatives like that they are lightweight,nestable (which means they take up lessspace after unloading), take up less space onshipping vehicles, have four-way entry, andappear to work with all types of products.(At first the company had reservations aboutusing plastic pallets for frozen and perish-able goods, but they had few problems inpractice. Representatives maintain that thenonskid surface on most plastic palletsworks effectively, although the difference infriction is something that employees mustget used to.) In addition, SUPERVALUrepresentatives mentioned that employees inits distribution centers “always use plasticpallets first,” because they like the way theyperform.
The grocery stores that SUPERVALU servesalso like plastic pallets. The manager of oneof its stores told the project team that heand his employees like the pallets becausethey are “much lighter than wood, are easierto store, take up a lot less space in storage,are nestable, are very sturdy, and are easierto work with and move around.” From hisperspective, there were no disadvantages toworking with plastic pallets.
Lesson 4: RackingPlastic pallets do, however, have one impor-tant drawback—they do not work with cur-rent store and wholesaler/distributor rack-ing systems. (The racks are designed to holdpallets with flat boards extending the full
24
CHAPTER FOUR LESSONS ON PALLETS
length and width of the platform. Plasticpallets, however, have nine small, protrud-ing legs which do not work with currentracks.) SUPERVALU said that if the plasticpallet industry were to make a lightweightrackable plastic pallet, it would be interestedin using them. (Right now, rackable plasticpallets do not weigh much less than wood,which limits their advantages.) Anothergrocery industry representative mentionedthat a different option would be for thepallet industry to make a new racking systemthat is compatible with plastic shippingplatforms or to retrofit existing systems.
SUPERVALU representatives also indicatedthat plastic pallets are probably best used ina closed-loop system where return policies(such as small deposits) can be imple-mented. At an initial purchase price of $21per pallet, companies cannot afford to haveplastic pallets disappear, particularly sincetheir value to the company increases over time.
Lesson 5: Wholesalers as AdvocatesSince grocery stores do not purchase, dis-pose of, or manage pallets, it is unlikely thatthey will be drivers of change in convertingfrom wood to plastic pallets. Wholesaler/distributors such as SUPERVALU, however,can strongly advocate for their use withmanufacturers and third-party leasingcompanies (such as CHEP) because they candemonstrate the economic advantages thatcan be gained through the use of plasticpallets.
Lesson 6: Indirect Benefits for StoresWhile individual grocery stores will notexperience direct economic benefits if thesystem switches from wood to plastic pallets,
they may receive some “indirect” economicbenefits. For example, if SUPERVALU saved$.01 per pallet through reduced workers’compensation costs, it stands to reason thatgrocery stores would accrue similar savings.If that is the case, the typical store can expectto save approximately $200 per year if itspallet inventory was switched entirely toplastic. (It also is likely that stores wouldreduce labor time by using plastic pallets,but data to support that belief are notcurrently available.)
The stores may also experience a reductionin future “passed on” costs if their whole-saler/distributors can improve the efficiencyand cost-effectiveness of the distributionsystem by using plastic pallets. If each store’swholesaler/distributor were able to save$556,000 per year in “indirect” costs andsave 63 cents per trip by using plastic pallets(as SUPERVALU did), then one couldassume that at least a portion of those sav-ings may be used to defray future cost in-creases for the stores.
Lesson 7: Avoided Disposal CostsIndividual grocery stores benefit economi-cally from the current returnable palletsystem (regardless of whether the pallets arewood or plastic) because they do not have tothrow any pallets away. Using data from thethree stores participating in this project, thetypical grocery store can expect to save morethan $31,000 per year in avoided landfillcosts by being able to return both intact anddamaged pallets to its suppliers.
25
TRANSPORT PACKAGING
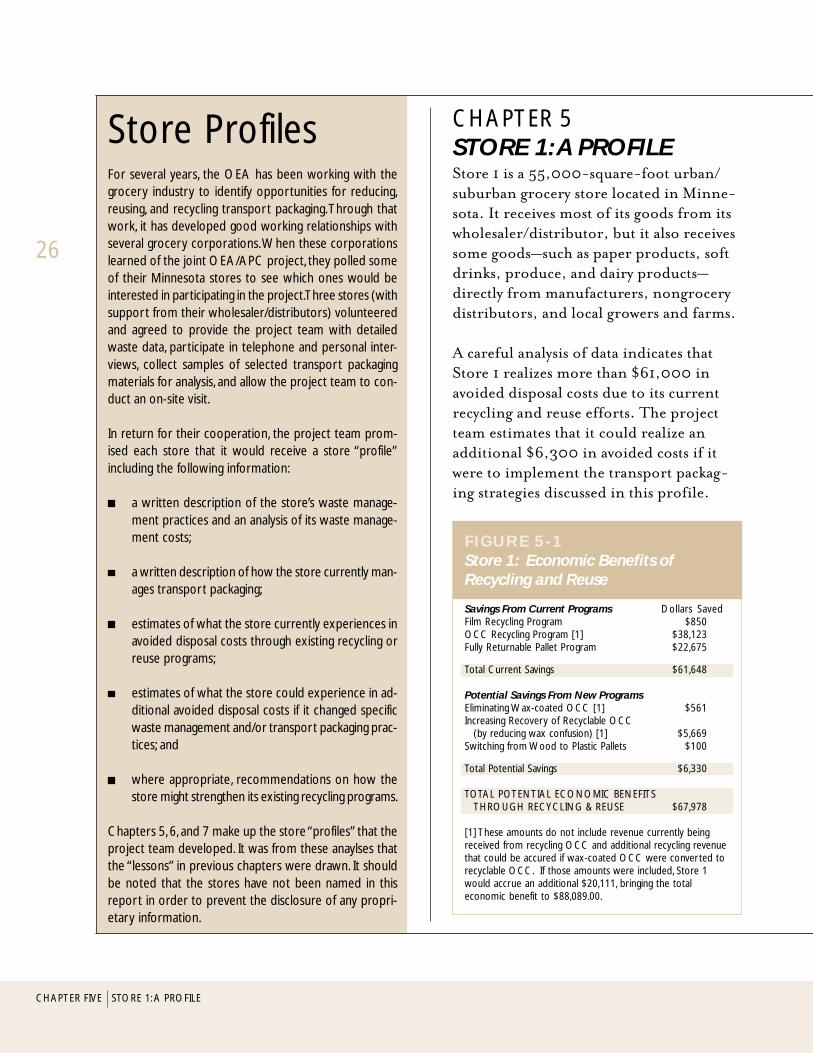
26
CHAPTER FIVE STORE 1: A PROFILE
CHAPTER 5STORE 1: A PROFILEStore 1 is a 55,000-square-foot urban/suburban grocery store located in Minne-sota. It receives most of its goods from itswholesaler/distributor, but it also receivessome goods—such as paper products, softdrinks, produce, and dairy products—directly from manufacturers, nongrocerydistributors, and local growers and farms.
A careful analysis of data indicates thatStore 1 realizes more than $61,000 inavoided disposal costs due to its currentrecycling and reuse efforts. The projectteam estimates that it could realize anadditional $6,300 in avoided costs if itwere to implement the transport packag-ing strategies discussed in this profile.
FIGURE 5-1Store 1: Economic Benefits ofRecycling and Reuse
Savings From Current Programs Dollars SavedFilm Recycling Program $850OCC Recycling Program [1] $38,123Fully Returnable Pallet Program $22,675
Total Current Savings $61,648
Potential Savings From New ProgramsEliminating Wax-coated OCC [1] $561Increasing Recovery of Recyclable OCC
(by reducing wax confusion) [1] $5,669Switching from Wood to Plastic Pallets $100
Total Potential Savings $6,330
TOTAL POTENTIAL ECONOMIC BENEFITSTHROUGH RECYCLING & REUSE $67,978
[1] These amounts do not include revenue currently beingreceived from recycling OCC and additional recycling revenuethat could be accured if wax-coated OCC were converted torecyclable OCC. If those amounts were included, Store 1would accrue an additional $20,111, bringing the totaleconomic benefit to $88,089.00.
Store ProfilesFor several years, the OEA has been working with thegrocery industry to identify opportunities for reducing,reusing, and recycling transport packaging. Through thatwork, it has developed good working relationships withseveral grocery corporations. When these corporationslearned of the joint OEA/APC project, they polled someof their Minnesota stores to see which ones would beinterested in participating in the project. Three stores (withsupport from their wholesaler/distributors) volunteeredand agreed to provide the project team with detailedwaste data, participate in telephone and personal inter-views, collect samples of selected transport packagingmaterials for analysis, and allow the project team to con-duct an on-site visit.
In return for their cooperation, the project team prom-ised each store that it would receive a store “profile”including the following information:
a written description of the store’s waste manage-ment practices and an analysis of its waste manage-ment costs;
a written description of how the store currently man-ages transport packaging;
estimates of what the store currently experiences inavoided disposal costs through existing recycling orreuse programs;
estimates of what the store could experience in ad-ditional avoided disposal costs if it changed specificwaste management and/or transport packaging prac-tices; and
where appropriate, recommendations on how thestore might strengthen its existing recycling programs.
Chapters 5, 6, and 7 make up the store “profiles” that theproject team developed. It was from these anaylses thatthe “lessons” in previous chapters were drawn. It shouldbe noted that the stores have not been named in thisreport in order to prevent the disclosure of any propri-etary information.
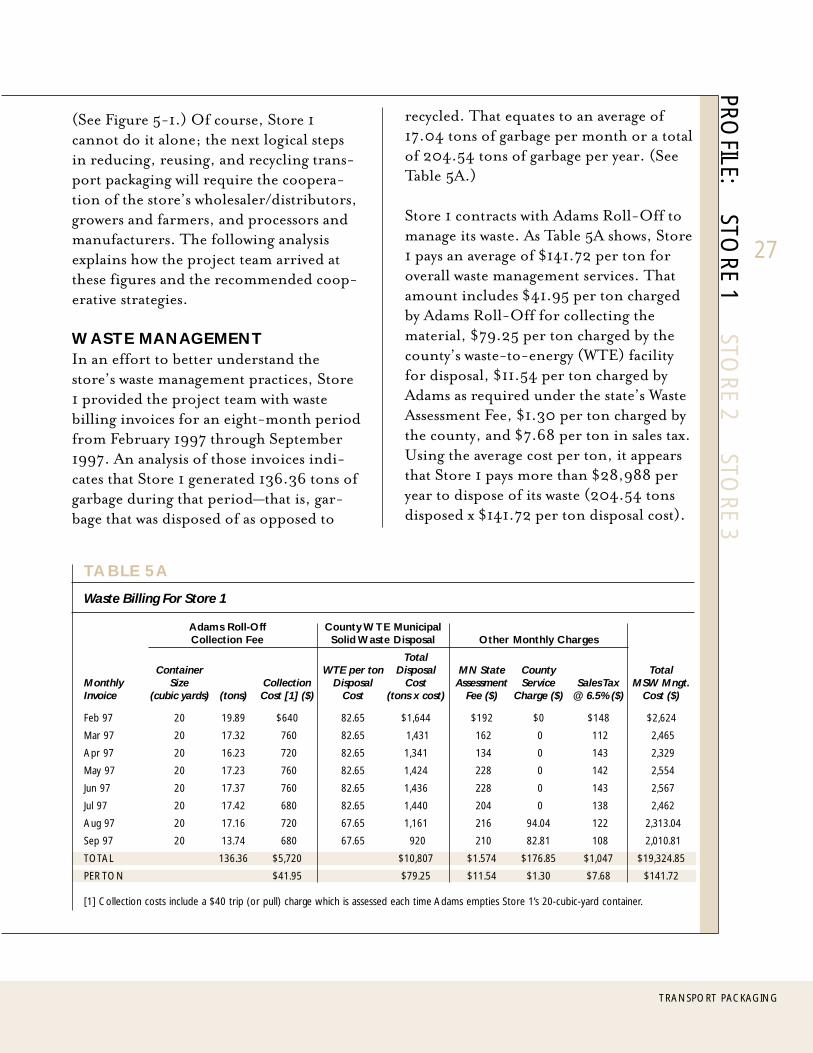
27
TRANSPORT PACKAGING
(See Figure 5-1.) Of course, Store 1cannot do it alone; the next logical stepsin reducing, reusing, and recycling trans-port packaging will require the coopera-tion of the store’s wholesaler/distributors,growers and farmers, and processors andmanufacturers. The following analysisexplains how the project team arrived atthese figures and the recommended coop-erative strategies.
WASTE MANAGEMENTIn an effort to better understand thestore’s waste management practices, Store1 provided the project team with wastebilling invoices for an eight-month periodfrom February 1997 through September1997. An analysis of those invoices indi-cates that Store 1 generated 136.36 tons ofgarbage during that period—that is, gar-bage that was disposed of as opposed to
recycled. That equates to an average of17.04 tons of garbage per month or a totalof 204.54 tons of garbage per year. (SeeTable 5A.)
Store 1 contracts with Adams Roll-Off tomanage its waste. As Table 5A shows, Store1 pays an average of $141.72 per ton foroverall waste management services. Thatamount includes $41.95 per ton chargedby Adams Roll-Off for collecting thematerial, $79.25 per ton charged by thecounty’s waste-to-energy (WTE) facilityfor disposal, $11.54 per ton charged byAdams as required under the state’s WasteAssessment Fee, $1.30 per ton charged bythe county, and $7.68 per ton in sales tax.Using the average cost per ton, it appearsthat Store 1 pays more than $28,988 peryear to dispose of its waste (204.54 tonsdisposed x $141.72 per ton disposal cost).
TABLE 5A
Waste Billing For Store 1
Adams Roll-Off County WTE MunicipalCollection Fee Solid Waste Disposal Other Monthly Charges
TotalContainer WTE per ton Disposal MN State County Total
Monthly Size Collection Disposal Cost Assessment Service Sales Tax MSW Mngt.Invoice (cubic yards) (tons) Cost [1] ($) Cost (tons x cost) Fee ($) Charge ($) @ 6.5% ($) Cost ($)
Feb 97 20 19.89 $640 82.65 $1,644 $192 $0 $148 $2,624
Mar 97 20 17.32 760 82.65 1,431 162 0 112 2,465
Apr 97 20 16.23 720 82.65 1,341 134 0 143 2,329
May 97 20 17.23 760 82.65 1,424 228 0 142 2,554
Jun 97 20 17.37 760 82.65 1,436 228 0 143 2,567
Jul 97 20 17.42 680 82.65 1,440 204 0 138 2,462
Aug 97 20 17.16 720 67.65 1,161 216 94.04 122 2,313.04
Sep 97 20 13.74 680 67.65 920 210 82.81 108 2,010.81
TOTAL 136.36 $5,720 $10,807 $1.574 $176.85 $1,047 $19,324.85
PER TON $41.95 $79.25 $11.54 $1.30 $7.68 $141.72
[1] Collection costs include a $40 trip (or pull) charge which is assessed each time Adams empties Store 1’s 20-cubic-yard container.
PROFILE:
STORE 1
STORE 2
STORE 3
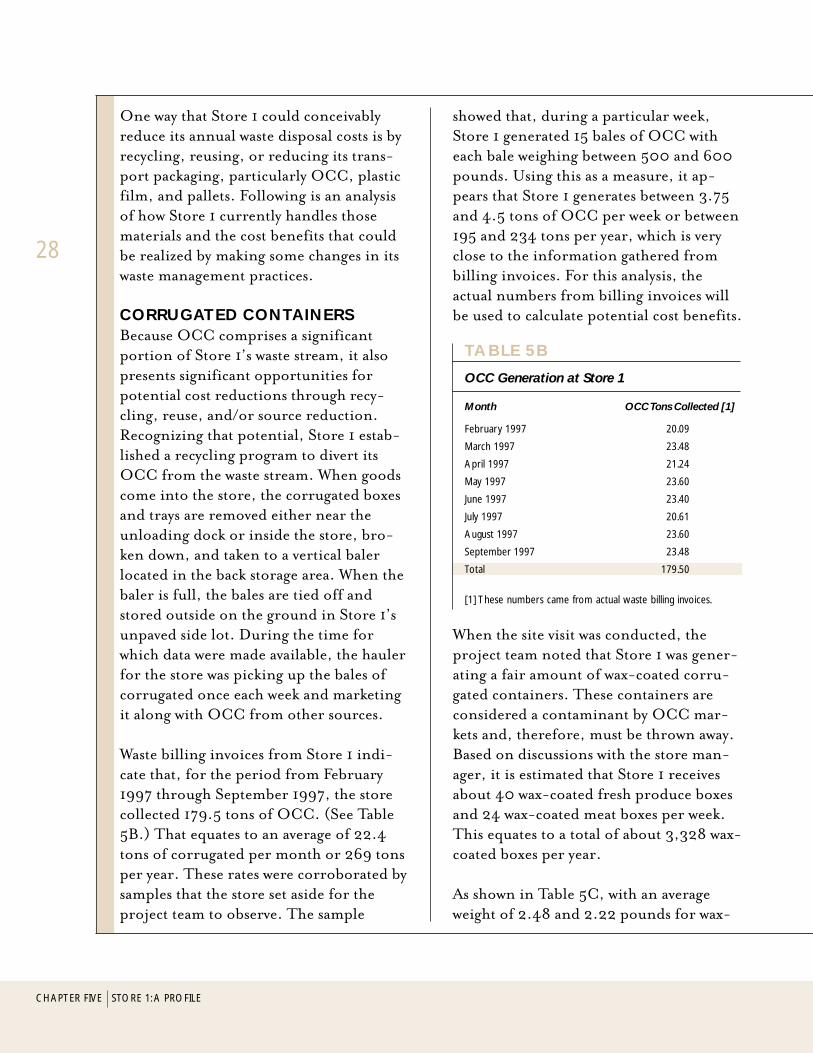
One way that Store 1 could conceivablyreduce its annual waste disposal costs is byrecycling, reusing, or reducing its trans-port packaging, particularly OCC, plasticfilm, and pallets. Following is an analysisof how Store 1 currently handles thosematerials and the cost benefits that couldbe realized by making some changes in itswaste management practices.
CORRUGATED CONTAINERSBecause OCC comprises a significantportion of Store 1’s waste stream, it alsopresents significant opportunities forpotential cost reductions through recy-cling, reuse, and/or source reduction.Recognizing that potential, Store 1 estab-lished a recycling program to divert itsOCC from the waste stream. When goodscome into the store, the corrugated boxesand trays are removed either near theunloading dock or inside the store, bro-ken down, and taken to a vertical balerlocated in the back storage area. When thebaler is full, the bales are tied off andstored outside on the ground in Store 1’sunpaved side lot. During the time forwhich data were made available, the haulerfor the store was picking up the bales ofcorrugated once each week and marketingit along with OCC from other sources.
Waste billing invoices from Store 1 indi-cate that, for the period from February1997 through September 1997, the storecollected 179.5 tons of OCC. (See Table5B.) That equates to an average of 22.4tons of corrugated per month or 269 tonsper year. These rates were corroborated bysamples that the store set aside for theproject team to observe. The sample
CHAPTER FIVE STORE 1: A PROFILE
28
showed that, during a particular week,Store 1 generated 15 bales of OCC witheach bale weighing between 500 and 600pounds. Using this as a measure, it ap-pears that Store 1 generates between 3.75and 4.5 tons of OCC per week or between195 and 234 tons per year, which is veryclose to the information gathered frombilling invoices. For this analysis, theactual numbers from billing invoices willbe used to calculate potential cost benefits.
When the site visit was conducted, theproject team noted that Store 1 was gener-ating a fair amount of wax-coated corru-gated containers. These containers areconsidered a contaminant by OCC mar-kets and, therefore, must be thrown away.Based on discussions with the store man-ager, it is estimated that Store 1 receivesabout 40 wax-coated fresh produce boxesand 24 wax-coated meat boxes per week.This equates to a total of about 3,328 wax-coated boxes per year.
As shown in Table 5C, with an averageweight of 2.48 and 2.22 pounds for wax-
TABLE 5B
OCC Generation at Store 1
Month OCC Tons Collected [1]
February 1997 20.09
March 1997 23.48
April 1997 21.24
May 1997 23.60
June 1997 23.40
July 1997 20.61
August 1997 23.60
September 1997 23.48
Total 179.50
[1] These numbers came from actual waste billing invoices.
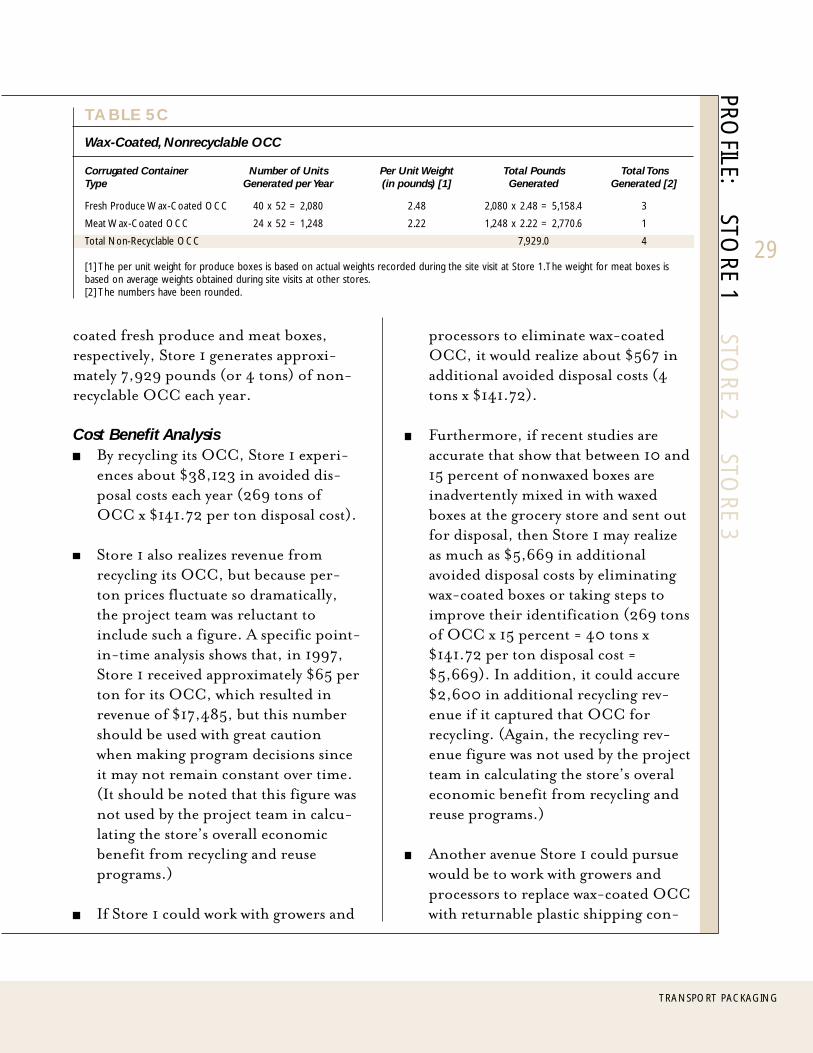
processors to eliminate wax-coatedOCC, it would realize about $567 inadditional avoided disposal costs (4tons x $141.72).
Furthermore, if recent studies areaccurate that show that between 10 and15 percent of nonwaxed boxes areinadvertently mixed in with waxedboxes at the grocery store and sent outfor disposal, then Store 1 may realizeas much as $5,669 in additionalavoided disposal costs by eliminatingwax-coated boxes or taking steps toimprove their identification (269 tonsof OCC x 15 percent = 40 tons x$141.72 per ton disposal cost =$5,669). In addition, it could accure$2,600 in additional recycling rev-enue if it captured that OCC forrecycling. (Again, the recycling rev-enue figure was not used by the projectteam in calculating the store’s overaleconomic benefit from recycling andreuse programs.)
Another avenue Store 1 could pursuewould be to work with growers andprocessors to replace wax-coated OCCwith returnable plastic shipping con-
TRANSPORT PACKAGING
29
coated fresh produce and meat boxes,respectively, Store 1 generates approxi-mately 7,929 pounds (or 4 tons) of non-recyclable OCC each year.
Cost Benefit AnalysisBy recycling its OCC, Store 1 experi-ences about $38,123 in avoided dis-posal costs each year (269 tons ofOCC x $141.72 per ton disposal cost).
Store 1 also realizes revenue fromrecycling its OCC, but because per-ton prices fluctuate so dramatically,the project team was reluctant toinclude such a figure. A specific point-in-time analysis shows that, in 1997,Store 1 received approximately $65 perton for its OCC, which resulted inrevenue of $17,485, but this numbershould be used with great cautionwhen making program decisions sinceit may not remain constant over time.(It should be noted that this figure wasnot used by the project team in calcu-lating the store’s overall economicbenefit from recycling and reuseprograms.)
If Store 1 could work with growers and
TABLE 5C
Wax-Coated, Nonrecyclable OCC
Corrugated Container Number of Units Per Unit Weight Total Pounds Total TonsType Generated per Year (in pounds) [1] Generated Generated [2]
Fresh Produce Wax-Coated OCC 40 x 52 = 2,080 2.48 2,080 x 2.48 = 5,158.4 3
Meat Wax-Coated OCC 24 x 52 = 1,248 2.22 1,248 x 2.22 = 2,770.6 1
Total Non-Recyclable OCC 7,929.0 4
[1] The per unit weight for produce boxes is based on actual weights recorded during the site visit at Store 1. The weight for meat boxes isbased on average weights obtained during site visits at other stores.[2] The numbers have been rounded.
PROFILE:
STORE 1
STORE 2
STORE 3
tainers. A precedent for using return-able plastic shipping containers hasbeen set at Store 1: Its wholesaler/distributor and its Health & BeautyCare and General Merchandise dis-tributor have both been using return-able plastic totes for years to deliverhealth and beauty products and gen-eral merchandise to the store. Whilethe issues of using returnable plasticcontainers in produce and meat appli-cations are much more complex, theseprograms do demonstrate that return-able systems can be developed andwork effectively in the grocery sector.(See Chapter 2, Lesson 5 for moreinformation.)
Opportunities to Strengthen the ProgramOne thing that was noted during thesite visit is that Store 1 stores its baledOCC outside on the ground in anunpaved area. Placing that material onthe ground increases the chances thatdirt, moisture, and gravel will getmixed in with the material and, hence,lower its value. Store 1 may want toexplore returning to its one-timepractice of storing OCC bales onpallets (unless its market prefers thecurrent practice).
After the project team’s site visit andwaste calculations, Store 1 took a stepto optimize its OCC recycling pro-gram. Instead of marketing looseOCC through its waste hauler, Store 1contracted directly with a local endmarket to take its OCC. That endmarket provided Store 1 with a baler ata small monthly rental fee, but did not
CHAPTER FIVE STORE 1: A PROFILE
30
charge to pick up the material. Thus,while Store 1 is not getting a higherper-ton price for its baled OCC (anyhigher revenues are offset by the rentalfees), it does not have to pay a pull ortrip charge which has improved theeconomics of its overall OCC recyclingprogram. The store did not share theexact cost benefits with the projectteam, but indicated that other storesmay want to explore this model formarketing OCC.
PLASTIC FILMAt present, Store 1 generates three types ofplastic film: (1) stretch wrap, which is usedprimarily to secure loads of goods to pallets,(2) shrink wrap, which is used primarily tosecure smaller quantities of like goodstogether or to a corrugated tray (i.e., tray/shrink), and (3) plastic grocery bags. AtStore 1, the first two types of plastic film(stretch and shrink wrap) are handled to-gether and the latter is handled separately.
Stretch and Shrink WrapStretch and Shrink WrapStretch and Shrink WrapStretch and Shrink WrapStretch and Shrink Wrap
The store’s stretch and shrink wrap istaken off of pallet loads of goods either atthe unloading area at the back of the storeor in the store where pallets of selectproducts are stored on metal racks. Whenemployees remove the film, they take it tothe back storage area and put it in twogaylord boxes that are used as both storageand shipping containers. Then the store’swholesaler/distributor picks up the filmand takes it back to its facility for recy-cling. Store 1 estimates that the film ispicked up about once every other weekalthough it is totally at the discretion ofthe driver.
When analyzing a three-day sample setaside by the store, it was found that Store1 generated about 95 pounds of stretchand shrink wrap. Dividing that number bythree shows that the store generates anaverage of 32 pounds of stretch andshrink wrap per day which equates to11,680 pounds (or 6 tons) per year. Ofthat amount, approximately 70 percent isshrink wrap, 28 percent is stretch wrap,and 2 percent is contamination. Con-taminants included such things as plasticstrapping, diaper overwraps, red pig-mented potato bags, and bubble wrap.
When the site visit was conducted, onething in particular was noted about Store1’s film recycling efforts—the store hadtemporarily stopped collecting stretch andshrink wrap due to heavy traffic duringthe holiday season. The store managerindicated that employees were too busyand storage space was at too high of apremium to worry about recycling film.In addition to cost implications, thereasons for program suspension highlighttwo important barriers to grocery filmrecycling efforts in general: (1) there mustbe adequate space for the storage of film,and (2) there must be a strong commit-ment to recycling film since it is not partof a store’s core business.
Cost Benefit AnalysisBy recycling its film instead of dispos-ing of it, Store 1 saves about $850 peryear in avoided disposal costs (6 tons x$141.72 per ton disposal cost). Whilethis amount is quite small, any de-creased costs in the highly competitive,low-margin grocery industry can
TRANSPORT PACKAGING
31
positively affect the bottom line. Inaddition, if current trends continueand film continues to replace OCC intransport packaging, then the amountof film available for recycling will growand the economic benefits of recyclingit will improve.
Labor costs associated with recyclingfilm at Store 1 are very small. The storedoes not have special containers, doesnot bale its film, and has no formaltraining/education program. Evenemployee handling costs are minimalsince the store does not do any up-grading of the material—employeessimply put the film in gaylord boxesinstead of putting it in the garbagecompactor. The simplicity of the pro-gram has two benefits: (1) any costsincurred from running the program areminimal, and (2) because it is so simple,it is easy for employees to participate.
Store 1 does not receive any revenue forits film since it is shipped in a backhaulprogram to its wholesaler/distributor.Under its current program, the whole-saler/distributor does not receive anyrevenue either because it simply passesthe material through to Bunzl Recyclingalong with its own stretch wrap. If thewholesaler/distributor were to obtain adifferent market for the film—one thatwas willing to pay for the material—itcould conceivably “pass on” some of theeconomic benefit to Store 1, making itsfilm recycling program more attractive.(For an example of possible revenues, seeChapter 3, Lesson 3. It shows the poten-tial economic benefits that a wholesaler/
PROFILE:
STORE 1
STORE 2
STORE 3

distributor might realize from recyclingfilm.) The film market listing in Appen-dix B shows that there are markets thatare currently paying for stretch andshrink wrap as long as quality is main-tained. (Many of those markets willaccept plastic bags as well.)
As mentioned earlier, suspending thefilm recycling program during theholiday season had a cost. The film wasdisposed of for at least 70 days at atotal volume of 2,100 pounds (or 1.1tons) and, thus, a total disposal cost of$156.00.
Opportunities to Strengthen the ProgramAs with most grocery stores, Store 1does not have a great deal of storagespace. For that reason, every effortshould be made to minimize theamount of floor space required torecycle film. There are several optionsStore 1 could explore. One is placing acovered (and locked) storage containeroutside the facility near where thebales of corrugated are stored. (Thecover is critical since it will keep mois-ture—a contaminant—out of the film.)There would be an initial investmentrequired to purchase such a container,but having one would eliminate theneed to store film inside. If the con-tainer had compacting abilities, itcould reduce the number of times thestore’s wholesaler/distributor had topick up the film, thus further stream-lining the program.
Another option (and from a qualityperspective a better option) Store 1
CHAPTER FIVE STORE 1: A PROFILE
32
could explore is to work with its whole-saler/distributor to pick up film moreregularly during busy times so that itwould not have to be stored as longand, hence, would not take up as muchspace (perhaps moving to once-a-weekpickup instead of once-every-other-week.) Since the wholesaler/distribu-tor has trucks coming to the store on adaily basis, a cooperative effort to pickup film more regularly could provehelpful and assist in correcting storageproblems at the store level.
If Store 1 continues to collect andstore film inside, having designatedstorage containers that are not stan-dard corrugated boxes may improvethe store’s film recycling program intwo important ways. First, it wouldsend a message to store employees thatthe program is important and perma-nent—not something that can bestopped and started throughout theyear. Second, it would reduce thechances of film being thrown away.(Collected film samples were mistak-enly thrown away by employees twotimes prior to the project team’s sitevisit.) A permanent, carefully markedcollection container that has signagesaying “plastic film only” would behelpful. In addition, the store couldattach samples of the kinds of filmaccepted in its program to help em-ployees make better decisions aboutwhat should and should not be in-cluded.
All successful grocery film recyclingprograms have one thing in common—
a committed store manager and com-mitted, educated employees. Whilefilm recycling is not part of a store’score business, a manager can impressupon employees the importance ofrecovering film for recycling. Devel-opment of a simple training brochureshowing employees how and what torecycle, a memo stating the store’ssupport for the program, and brief,periodic educational sessions showinghow much film has been recycled (aswell as other materials) would helpdemonstrate the value of such a pro-gram. Even enlisting one or moreemployees to help oversee the pro-gram could improve storewide com-mitment.
During the site visit at Store 1, theproject team learned that in order tostore pallet loads of goods inside thestore, employees must use a forklift toplace certain pallets onto high shelves.In instances where employees believe apallet load is too unstable to move,they often wrap adhesive tape aroundthe film to stabilize the goods. Oncetape has been used on the film, it canno longer be recycled in the store’sprogram and must be disposed of.
In order to capture that film, Store 1essentially has two options: (1) to find atape that is more compatible with film inrecycling, or (2) remove the film prior totaping the load. Recently, 3M introduceda new product called Stretchable Tape(ST), which the company maintains iscompatible with low density polyethylenefilm in recycling. The tape is made of
TRANSPORT PACKAGING
33
linear low density polyethylene whichcomes from the same family of plasticresins and, because the tape detackifieswhen stretched, adhesives pose less of aproblem to recyclers than traditionaltapes. Of course, Store 1 would need toapprove the use of this product with themarket of its wholesaler/distributor, but itcould potentially solve the problem.
Another option is that Store 1 couldremove the film prior to taping. ST is saidto have sufficient strength to secure palletloads, can be applied by hand, and be-cause it detackifies when stretched, willnot tear labels and graphics from productswhen removed.1 Therefore, if Store 1could use this product after removing thefilm, contamination concerns would beeliminated. (See Chapter 3, Lesson 10 formore information.)
Plastic BagsPlastic BagsPlastic BagsPlastic BagsPlastic Bags
While plastic bags are considered “film,”Store 1 does not handle them in the sameway as it handles stretch and shrink wrap,partly because the bags are generated bythe public not by the store. The point ofgeneration for the bags is at the front ofthe facility, where Store 1 has placed onecollection container—a metal hangingrack that holds one large plastic bag. Asign above the rack says “plastic bags,” butotherwise there are no instructions for thepublic to follow.
1 This suggestion should be viewed only as that—a suggestion. The 3Mproduct mentioned has not been tested by the project team todetermine its compatibility with stretch wrap in recycling nor has ittested the product for performance. Therefore, this should not beviewed as an endorsement of the product, but simply an example ofone potential solution the store can explore.
PROFILE:
STORE 1
STORE 2
STORE 3
When the collection bag is full, employeestie the bag off and take it to the back store-room where it is stored on the floor near thecollection containers for stretch and shrinkwrap or placed into a large metal cage. Thesebags are then placed in produce bins,gaylord boxes, or whatever else is availableand shipped back to the wholesaler/distributor through a backhaul arrange-ment. The driver determines the frequencyof pickup, but it appears that collectionoccurs about once every other week as withthe plastic stretch and shrink wrap.
During the site visit, the project team wasable to work with a two-week sample ofcollected plastic bags. At that time therewere 12 bags of material each weighing anaverage of 3.67 pounds. Using that infor-mation, it can be estimated that Store 1generates about 44 pounds of material ona two-week basis (12 x 3.67), or 1,144pounds of plastic bags per year (44 x 26).
Cost Benefit AnalysisIt is difficult to connect any cost benefitto recycling plastic bags in terms ofavoided disposal costs because the storewould not be collecting the bags if theywere simply going to throw them away.Similarly, the store does not generateany revenue through the recycling of bagsbecause the bags are backhauled to itswholesaler/distributor which then passesthem along to Bunzl Recycling. There-fore, the only potential economic ben-efit to Store 1 from recycling bags is theservice it provides for its customers,which may give the store a competitiveedge in a highly competitive industry.Common thinking is that if you can
CHAPTER FIVE STORE 1: A PROFILE
34
increase store traffic by offering servicesthat customers want, then you canpotentially increase sales. Unfortunately,there are no available data to determinewhat such a service is worth to patrons orwhat it may translate into in terms ofincreased purchases.
There also is some overall benefit tothe surrounding community. If Store 1did not collect the bags for recycling,consumers would presumably have tothrow them away at home. By havingthe program, Store 1 is helping thecommunity divert 1,144 pounds ofwaste from area landfills.
Opportunities to Strengthen the ProgramVisual inspection of the plastic bagscollected in the Store 1 program showedthat shoppers bring a wide variety of bagsinto the store—some low density polyeth-ylene, some high density polyethylene,and many bags from other retail outlets.There also were several heavily pig-mented bags (with red, black, white,blue, and purple dyes and pigments) aswell as one windshield wiper fluid bottle,one plastic food bucket, and several typesof overwrap, such as that used with toilettissue and diapers. While the projectteam did not weigh the contaminants atthis store, it is estimated that they com-prised about 2 percent of the totalsample. One relatively simple way thatStore 1 could reduce contaminationwould be to have better signage at thefront of the store where plastic bags arecollected. A sign that had samples ofacceptable materials attached would helpconsumers make better choices, as would

a sign listing acceptable materials (suchas LDPE and HDPE bags) and unac-ceptable materials (such as diaperoverwraps, colored bags, paper bags, andplastic bottles). Since the bags arecollected in a clear bag, periodicinspection by store staff to removeunacceptable items would help reducecontamination as well.
PALLETSAccording to estimates by the store manager,Store 1 currently receives about 200 stan-dard 48" x 40" pallets each week. Of thatamount, 25 pallets (or 13 percent) areshipped directly from Pepsi Cola and re-turned via backhaul arrangements with thesoft drink distributor. The Pepsi Colapallets, which are distinguished from otherpallets by their light blue solid platform, arestored separately from other pallets in adesignated area of the storeroom and pickedup once per month by the distributor.
A similar program is operated by MortonSalt. Each week Store 1 receives about sixpallets (or 3 percent of its total palletinventory) from the manufacturer, whichare used to transport salt for outdoor use.Each pallet carries a $3 deposit for whichthe store “pays” at delivery and receives a$3 “credit” upon return. (These transac-tions are carried out on paper and recordedin the store’s monthly invoices.) MortonSalt pallets are stored outside in the coveredparcel pickup area at the front of the storeand are picked up on an as needed basisthrough a backhaul arrangement.
The remaining 169 pallets that Store 1receives each week are used to transport
TRANSPORT PACKAGING
35
general merchandise items and groceryproducts. Once goods are removed, thepallets are stored in a designated areainside the back storage room. When thestore’s wholesaler/distributor delivers newgoods on pallets, the empty ones arebackhauled to the distribution center.
There are three things that should benoted about pallets at Store 1. First, allbroken pallets are accepted back by PepsiCola, Morton Salt, and the store’s whole-saler/distributor. Occasionally damagedpallets will be given away to customersand/or employees, but for the most partthey are shipped back along with thefunctional pallets. Second, because of itsbackhaul arrangements and its “give-away”program, Store 1 does not have to disposeof any pallets. Therefore, there would beno avoided disposal costs for the store if itwere to make a transport packagingchange, such as switching from wood toplastic pallets. Third, at this time, all ofthe pallets used in the Store 1 deliverysystem are wood—there has been no ex-perimentation with plastic pallets.
Table 5D provides information on theestimated weight and quantity of each ofthe three types of pallets found at Store 1.
Cost Benefit AnalysisAs Table 5D shows, by having a fullyreturnable pallet program, Store 1 ispreventing 160 tons of waste from goinginto the landfill each year at the storelevel. That translates into about $22,675per year in avoided disposal costs (160tons of pallets x $141.72 per ton disposalcost). This calculation assumes that
PROFILE:
STORE 1
STORE 2
STORE 3

CHAPTER FIVE STORE 1: A PROFILE
36
Adams Roll-Off would charge Store 1the same rate to dispose of pallets as itcharges for disposing of municipal solidwaste. This may or may not be the case,however, since some haulers have differ-ent fee structures for handling pallets.
Since Store 1 does not buy pallets ordispose of them, the store would notrealize any direct economic benefitsfrom switching from wood to plasticpallets. The store may, however, realizereduced “future” costs. For example, inChapter 4 of this report, it was notedthat SUPERVALU (a Minnesota-basedwholesaler/distributor) saved 63 centsper trip over three years for every plasticpallet in its inventory, and realized$556,000 per year in reduced workers’compensation, labor, and shipping costs(or $3.70 per pallet). If Store 1’swholesaler/distributor were to realize
similar cost savings by using plasticpallets instead of wood, Store 1 maybenefit in the form of lower future“passed on” costs.
In addition, Store 1 may experiencesome indirect economic benefits. Forexample, data show that SUPERVALUcould experience a one-cent cost reduc-tion per pallet in workers’ compensationclaims as a result of switching from woodto plastic. If Store 1 saw its entire inven-tory of pallets switched from wood toplastic, it would decrease workers’ com-pensation claims by about $100 per year(10,400 pallets x $.01). It is possiblethat the store may also experience adecrease in labor costs as a result ofswitching from wood to plastic pallets,but data to support that claim are notcurrently available.
TABLE 5D
Pallet System at Store 1
Estimated NumberPer Unit Size of Units Rotating in Weight per Unit Annual
Pallet Types Origin (in inches) Stock Per Year in Pounds [1] Tonnage [1]
Wooden Pallet Pepsi Cola 48 x 40 25 x 52 = 1,300 50 33
Wooden Pallet Morton Salt 48 x 40 6 x 52 = 312 54 8
Wooden Pallet Wholesaler/Distributor 48 x 40 169 x 52 = 8,788 27 119
Total 10,400 160
[1] Per unit weights for each wooden pallet are based on actual weights recorded during the site visit.[2] The numbers have been rounded.
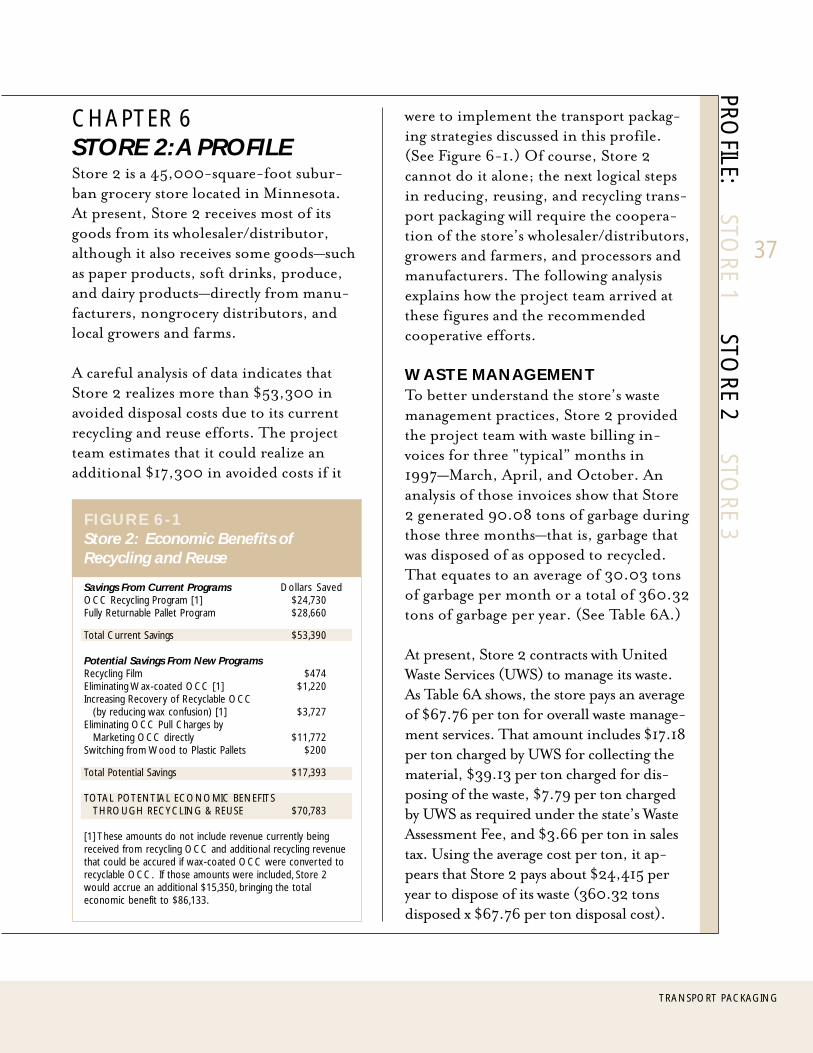
TRANSPORT PACKAGING
PROFILE:
STORE 1
STORE 2
STORE 3
37
FIGURE 6-1Store 2: Economic Benefits ofRecycling and Reuse
Savings From Current Programs Dollars SavedOCC Recycling Program [1] $24,730Fully Returnable Pallet Program $28,660
Total Current Savings $53,390
Potential Savings From New ProgramsRecycling Film $474Eliminating Wax-coated OCC [1] $1,220Increasing Recovery of Recyclable OCC
(by reducing wax confusion) [1] $3,727Eliminating OCC Pull Charges by
Marketing OCC directly $11,772Switching from Wood to Plastic Pallets $200
Total Potential Savings $17,393
TOTAL POTENTIAL ECONOMIC BENEFITSTHROUGH RECYCLING & REUSE $70,783
[1] These amounts do not include revenue currently beingreceived from recycling OCC and additional recycling revenuethat could be accured if wax-coated OCC were converted torecyclable OCC. If those amounts were included, Store 2would accrue an additional $15,350, bringing the totaleconomic benefit to $86,133.
CHAPTER 6STORE 2: A PROFILEStore 2 is a 45,000-square-foot subur-ban grocery store located in Minnesota.At present, Store 2 receives most of itsgoods from its wholesaler/distributor,although it also receives some goods—suchas paper products, soft drinks, produce,and dairy products—directly from manu-facturers, nongrocery distributors, andlocal growers and farms.
A careful analysis of data indicates thatStore 2 realizes more than $53,300 inavoided disposal costs due to its currentrecycling and reuse efforts. The projectteam estimates that it could realize anadditional $17,300 in avoided costs if it
were to implement the transport packag-ing strategies discussed in this profile.(See Figure 6-1.) Of course, Store 2cannot do it alone; the next logical stepsin reducing, reusing, and recycling trans-port packaging will require the coopera-tion of the store’s wholesaler/distributors,growers and farmers, and processors andmanufacturers. The following analysisexplains how the project team arrived atthese figures and the recommendedcooperative efforts.
WASTE MANAGEMENTTo better understand the store’s wastemanagement practices, Store 2 providedthe project team with waste billing in-voices for three “typical” months in1997—March, April, and October. Ananalysis of those invoices show that Store2 generated 90.08 tons of garbage duringthose three months—that is, garbage thatwas disposed of as opposed to recycled.That equates to an average of 30.03 tonsof garbage per month or a total of 360.32tons of garbage per year. (See Table 6A.)
At present, Store 2 contracts with UnitedWaste Services (UWS) to manage its waste.As Table 6A shows, the store pays an averageof $67.76 per ton for overall waste manage-ment services. That amount includes $17.18per ton charged by UWS for collecting thematerial, $39.13 per ton charged for dis-posing of the waste, $7.79 per ton chargedby UWS as required under the state’s WasteAssessment Fee, and $3.66 per ton in salestax. Using the average cost per ton, it ap-pears that Store 2 pays about $24,415 peryear to dispose of its waste (360.32 tonsdisposed x $67.76 per ton disposal cost).
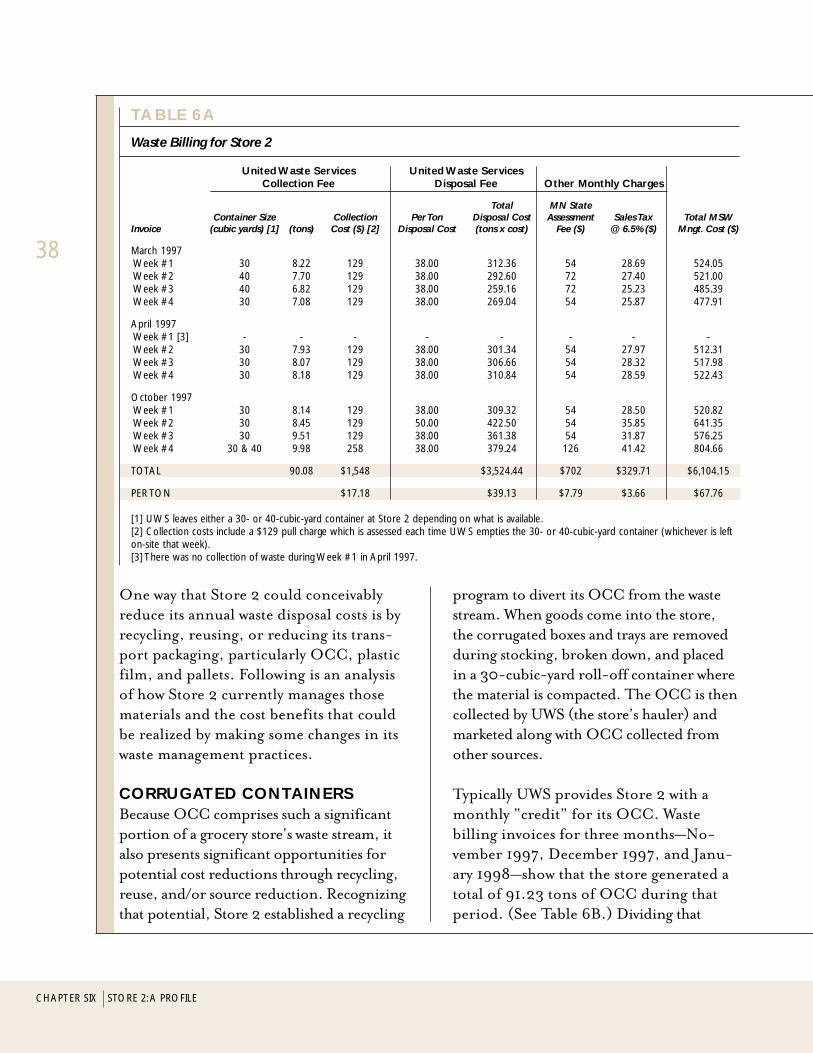
CHAPTER SIX STORE 2: A PROFILE
38
One way that Store 2 could conceivablyreduce its annual waste disposal costs is byrecycling, reusing, or reducing its trans-port packaging, particularly OCC, plasticfilm, and pallets. Following is an analysisof how Store 2 currently manages thosematerials and the cost benefits that couldbe realized by making some changes in itswaste management practices.
CORRUGATED CONTAINERSBecause OCC comprises such a significantportion of a grocery store’s waste stream, italso presents significant opportunities forpotential cost reductions through recycling,reuse, and/or source reduction. Recognizingthat potential, Store 2 established a recycling
program to divert its OCC from the wastestream. When goods come into the store,the corrugated boxes and trays are removedduring stocking, broken down, and placedin a 30-cubic-yard roll-off container wherethe material is compacted. The OCC is thencollected by UWS (the store’s hauler) andmarketed along with OCC collected fromother sources.
Typically UWS provides Store 2 with amonthly “credit” for its OCC. Wastebilling invoices for three months—No-vember 1997, December 1997, and Janu-ary 1998—show that the store generated atotal of 91.23 tons of OCC during thatperiod. (See Table 6B.) Dividing that
TABLE 6A
Waste Billing for Store 2
United Waste Services United Waste ServicesCollection Fee Disposal Fee Other Monthly Charges
Total MN StateContainer Size Collection Per Ton Disposal Cost Assessment Sales Tax Total MSW
Invoice (cubic yards) [1] (tons) Cost ($) [2] Disposal Cost (tons x cost) Fee ($) @ 6.5% ($) Mngt. Cost ($)
March 1997 Week #1 30 8.22 129 38.00 312.36 54 28.69 524.05 Week #2 40 7.70 129 38.00 292.60 72 27.40 521.00 Week #3 40 6.82 129 38.00 259.16 72 25.23 485.39 Week #4 30 7.08 129 38.00 269.04 54 25.87 477.91
April 1997 Week #1 [3] - - - - - - - - Week #2 30 7.93 129 38.00 301.34 54 27.97 512.31 Week #3 30 8.07 129 38.00 306.66 54 28.32 517.98 Week #4 30 8.18 129 38.00 310.84 54 28.59 522.43
October 1997 Week #1 30 8.14 129 38.00 309.32 54 28.50 520.82 Week #2 30 8.45 129 50.00 422.50 54 35.85 641.35 Week #3 30 9.51 129 38.00 361.38 54 31.87 576.25 Week #4 30 & 40 9.98 258 38.00 379.24 126 41.42 804.66
TOTAL 90.08 $1,548 $3,524.44 $702 $329.71 $6,104.15
PER TON $17.18 $39.13 $7.79 $3.66 $67.76
[1] UWS leaves either a 30- or 40-cubic-yard container at Store 2 depending on what is available.[2] Collection costs include a $129 pull charge which is assessed each time UWS empties the 30- or 40-cubic-yard container (whichever is lefton-site that week).[3] There was no collection of waste during Week #1 in April 1997.
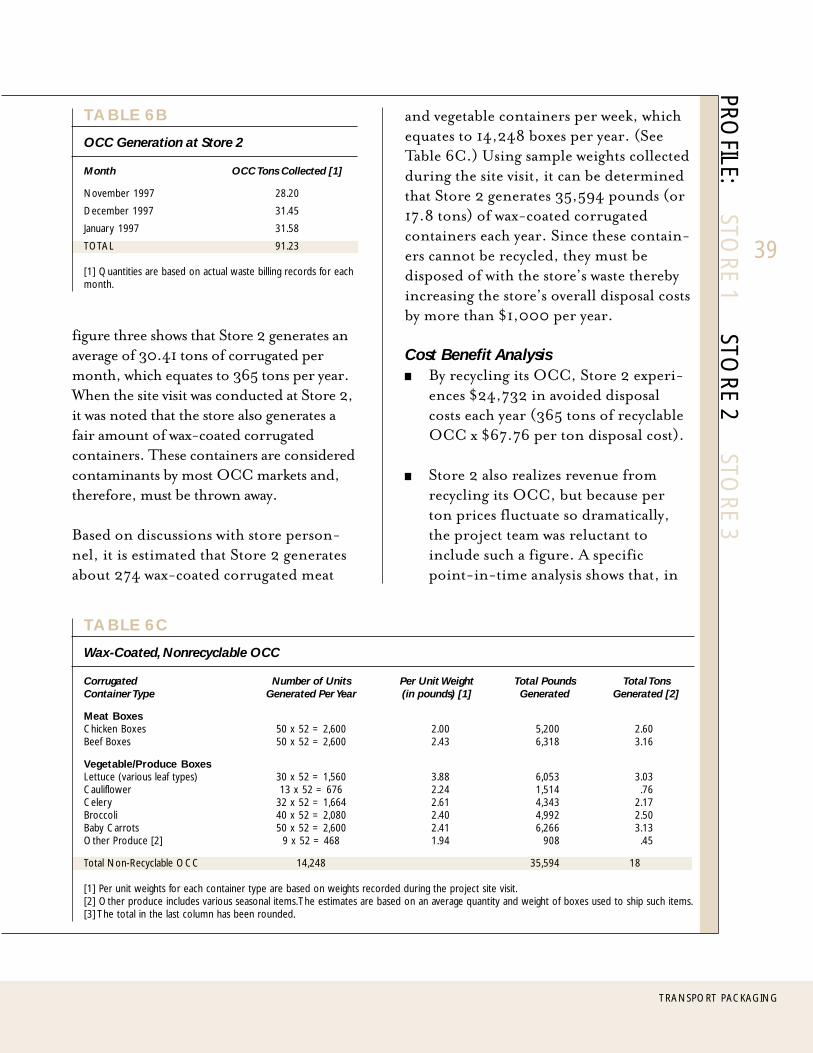
TRANSPORT PACKAGING
39
PROFILE:
STORE 1
STORE 2
STORE 3
figure three shows that Store 2 generates anaverage of 30.41 tons of corrugated permonth, which equates to 365 tons per year.When the site visit was conducted at Store 2,it was noted that the store also generates afair amount of wax-coated corrugatedcontainers. These containers are consideredcontaminants by most OCC markets and,therefore, must be thrown away.
Based on discussions with store person-nel, it is estimated that Store 2 generatesabout 274 wax-coated corrugated meat
and vegetable containers per week, whichequates to 14,248 boxes per year. (SeeTable 6C.) Using sample weights collectedduring the site visit, it can be determinedthat Store 2 generates 35,594 pounds (or17.8 tons) of wax-coated corrugatedcontainers each year. Since these contain-ers cannot be recycled, they must bedisposed of with the store’s waste therebyincreasing the store’s overall disposal costsby more than $1,000 per year.
Cost Benefit AnalysisBy recycling its OCC, Store 2 experi-ences $24,732 in avoided disposalcosts each year (365 tons of recyclableOCC x $67.76 per ton disposal cost).
Store 2 also realizes revenue fromrecycling its OCC, but because perton prices fluctuate so dramatically,the project team was reluctant toinclude such a figure. A specificpoint-in-time analysis shows that, in
TABLE 6B
OCC Generation at Store 2
Month OCC Tons Collected [1]
November 1997 28.20
December 1997 31.45
January 1997 31.58
TOTAL 91.23
[1] Quantities are based on actual waste billing records for eachmonth.
TABLE 6C
Wax-Coated, Nonrecyclable OCC
Corrugated Number of Units Per Unit Weight Total Pounds Total TonsContainer Type Generated Per Year (in pounds) [1] Generated Generated [2]
Meat BoxesChicken Boxes 50 x 52 = 2,600 2.00 5,200 2.60Beef Boxes 50 x 52 = 2,600 2.43 6,318 3.16
Vegetable/Produce BoxesLettuce (various leaf types) 30 x 52 = 1,560 3.88 6,053 3.03Cauliflower 13 x 52 = 676 2.24 1,514 .76Celery 32 x 52 = 1,664 2.61 4,343 2.17Broccoli 40 x 52 = 2,080 2.40 4,992 2.50Baby Carrots 50 x 52 = 2,600 2.41 6,266 3.13Other Produce [2] 9 x 52 = 468 1.94 908 .45
Total Non-Recyclable OCC 14,248 35,594 18
[1] Per unit weights for each container type are based on weights recorded during the project site visit.[2] Other produce includes various seasonal items. The estimates are based on an average quantity and weight of boxes used to ship such items.[3] The total in the last column has been rounded.
40
CHAPTER SIX STORE 2: A PROFILE
1997, Store 2 received an average of$36.55 per ton for its OCC, whichresulted in revenue of $13,340, butthis number should be used with greatcaution when making program deci-sions since it may not remain constantover time. (It should be noted that thisfigure was not used by the project teamin calculating the store’s overall eco-nomic benefit from recycling andreuse programs.)
If Store 2 could work cooperativelywith growers and processors to elimi-nate wax-coated OCC, it could accruean additional $1,220 in avoideddisposal costs (18 tons of wax-coatedOCC x $67.76 per ton disposal cost).
Furthermore, if recent studies areaccurate that show that between 10 and15 percent of nonwaxed boxes are inad-vertently mixed in with waxed boxes atthe grocery store and sent out for dis-posal, then Store 2 may realize as muchas $3,727 in additional avoided disposalcosts by eliminating wax-coated boxes ortaking steps to improve their identifica-tion (365 tons of OCC x 15 percent = 55tons x $67.76 per ton disposal cost). Inaddition, it could accrue about $2,010in additional recycling revenue if itcaptured that OCC for recycling.(Again, this figure was not included inthe project team’s calculation of thestore’s overall economic benefit fromrecycling and reuse programs.)
Another avenue that Store 2 couldpursue would be to work with growersand processors to explore the feasibility
of replacing wax-coated OCC withreusable plastic shipping containers. Aprecedent for using returnable plasticshipping containers has been set at Store2: Its wholesaler/distributor has beenusing returnable plastic totes for years todeliver health and beauty products andgeneral merchandise to the store andusing returnable plastic trays for bakeryproducts. While the issues of usingreturnable plastic containers in produceand meat applications are more com-plex, these programs do demonstratethat returnable systems can be developedand work effectively in the grocerysector. (See Chapter 2, Lesson 5 formore information.)
Opportunities to Strengthen the ProgramOne way in which Store 2 could opti-mize its current OCC recycling programis to try selling its OCC directly to amarket instead of going through itshauler. For example, it could start aprogram similar to that at Store 1 wherethe store was able to improve its programby baling its material which allowed it toship OCC directly to market. (Themarket provided Store 1 with a baler forwhich it charges a small monthly rentalfee.) While Store 1 did not experiencean increase in its per ton revenue forOCC, it did eliminate the trip fee thatthe hauler was charging to pull thestore’s OCC. If Store 2 could do thesame, it would accrue annual savings ofup to $11,772 per year. (This is based onactual billing invoices which show thatStore 2 averages 9 pulls of OCC permonth or 108 pulls per year at a cost of$109 per pull.) Store 2 may also be able
TRANSPORT PACKAGING
41
PROFILE:
STORE 1
STORE 2
STORE 3
to increase its revenue for OCC (evenover and above any baler rental charges)because it is currently getting such a lowprice for its OCC ($36.55 per ton).The March 16, 1998 issue of Recycling Times
shows that markets were paying between$60 and $80 per ton for baled OCC inthe East Central Region of which Min-nesota is a part. Of course, these poten-tial cost savings need to be weighedagainst the time required to identify andwork with a market as opposed to theease of working with the store’s desig-nated hauler.
PLASTIC FILMStore 2 currently generates two types ofplastic film: (1) stretch wrap, which isused primarily to secure loads of goods topallets, and (2) shrink wrap, which is usedprimarily to secure smaller quantities oflike goods either together or to corru-gated trays. Unlike the other two stores inthe project, Store 2 does not generate anyplastic bags because it does not have a bagcollection program.
Store 2 does not currently recycle any ofthe plastic film generated in its store.Instead, when pallets are unwrapped, thestretch film is thrown into the garbagecompactor along with the store’s waste.Similarly, when shrink wrap is removedfrom products or corrugated trays, it isthrown into the garbage compactor andremoved for disposal.
The store manager indicates that the reasonthe store is not recycling film is simplybecause he has not had an opportunity toexplore the feasibility of establishing a
program. He mentioned that he was con-cerned about potential space constraints andissues related to sanitation, but confirmedthat the store was open to exploring thepossibility of recycling its film.
To better understand the types and quan-tities of film generated by Store 2, theproject team asked it to collect a five-daysample of stretch and shrink wrap. Theteam purposefully did not define “stretchand shrink wrap” so that it could deter-mine what employees would likely includein a recycling program without explicitinstructions. It should be noted that theemployees at Store 2 were very enthusias-tic and cooperative in obtaining thesample and were meticulous in identifyingmaterial for inclusion.
When analyzing the five-day sample setaside by the store, it was found that Store2 generated 198 pounds of plastic film.That equates to an average of 40 poundsof film per day or 14,600 pounds (or 7tons) per year. Of that amount, approxi-mately 54 percent is shrink wrap, 36percent is stretch wrap, and 10 percent iscontamination. The contaminants in-cluded such things as green and bluesemirigid layer separators for produce,red and beige potato bags, bag liners fromproduce boxes, paper, fresh flower wraps,six-pack ring holders, and some white,yellow, and blue plastic strapping.
Cost Benefit AnalysisIf Store 2 were to recycle its filminstead of disposing of it, it could saveabout $474 in avoided disposal costsper year (7 tons x $67.76 per ton
42
CHAPTER SIX STORE 2: A PROFILE
disposal cost). While this amount isquite small, any decreased costs in thehighly competitive, low-margin gro-cery industry can positively affect thebottom line. In addition, if currenttrends continue and film continues toreplace OCC in transport packaging,then the amount of film available forrecycling will grow and the economicbenefits of recycling it will improve.
Opportunities for Establishing a ProgramThis store has three key ingredientsfor a successful recycling program: (1)a store manager that is committed toenvironmental programs and explor-ing ways to improve the efficiency ofhis operation, (2) employees who areenthusiastic about recycling andcommitted to making programs work,and (3) ample storage space for filmcollection. (Compared to the othertwo grocery stores in the study, Store 2appeared to have the most availablestorage space.) Given these three keyingredients, the store is an idealcandidate for film recycling.
As is true of most grocery stores, Store2 generates a fairly small amount offilm compared to other types of orga-nizations. It generates only 14,600pounds of stretch and shrink wrap peryear. While that may seem like a lotfrom the store’s perspective, it is a verysmall amount from a market’s per-spective. Only 9 of the 22 film mar-kets surveyed for this project have nominimum load requirements. Onemarket accepts loads of 1,000 pounds,another four accept minimum loads
of 5,000 pounds, and two have10,000-pound requirements. Theremaining six markets require morematerial that a grocery store is likely togenerate in a year. (See Appendix Bfor a list of those markets.) Thus, itmay be difficult for Store 2 to try torecycle film on its own.
Another option that Store 2 couldexplore is establishing a backhaularrangement for plastic film with itswholesaler/distributor. It already has abackhaul arrangement for pallets andplastic totes. Therefore, a precedentexists that could work for film recy-cling. (See Chapter 3, Lesson 3 formore information on the feasibility ofrecycling at the wholesaler/distributorlevel.)
In order for a film recycling programto work at Store 2, an educationalprogram will need to be implemented.As mentioned above, 10 percent ofthe film sample was made up of whatmost markets consider contaminants.Since markets typically do not acceptfilm with more than 0-3 percentcontamination, the store would needto educate employees about whatshould and should not be included ina film recycling program. Conductinga training session with employees andposting signs indicating what types offilm should be included, where theyshould be stored (usually in gaylordbox, plastic bag, cart, or cage), andhow they should be prepared would goa long way toward improving quality.(Many markets will help stores develop
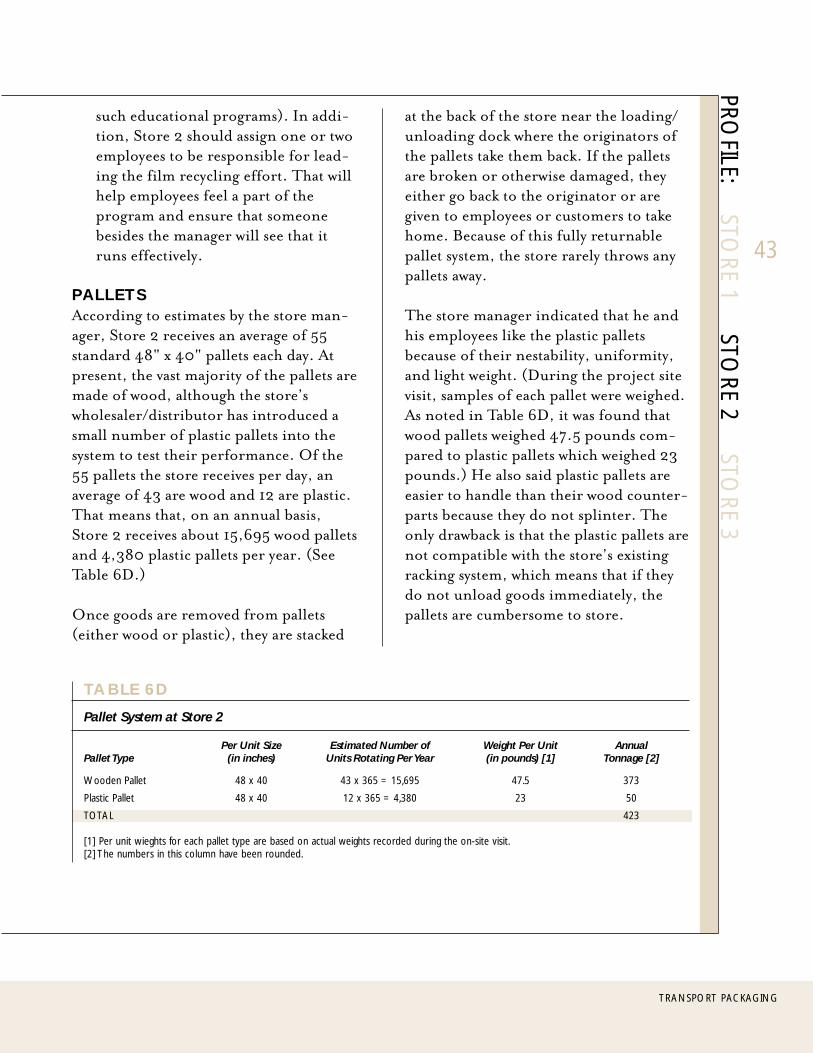
TRANSPORT PACKAGING
43
PROFILE:
STORE 1
STORE 2
STORE 3
such educational programs). In addi-tion, Store 2 should assign one or twoemployees to be responsible for lead-ing the film recycling effort. That willhelp employees feel a part of theprogram and ensure that someonebesides the manager will see that itruns effectively.
PALLETSAccording to estimates by the store man-ager, Store 2 receives an average of 55standard 48" x 40" pallets each day. Atpresent, the vast majority of the pallets aremade of wood, although the store’swholesaler/distributor has introduced asmall number of plastic pallets into thesystem to test their performance. Of the55 pallets the store receives per day, anaverage of 43 are wood and 12 are plastic.That means that, on an annual basis,Store 2 receives about 15,695 wood palletsand 4,380 plastic pallets per year. (SeeTable 6D.)
Once goods are removed from pallets(either wood or plastic), they are stacked
at the back of the store near the loading/unloading dock where the originators ofthe pallets take them back. If the palletsare broken or otherwise damaged, theyeither go back to the originator or aregiven to employees or customers to takehome. Because of this fully returnablepallet system, the store rarely throws anypallets away.
The store manager indicated that he andhis employees like the plastic palletsbecause of their nestability, uniformity,and light weight. (During the project sitevisit, samples of each pallet were weighed.As noted in Table 6D, it was found thatwood pallets weighed 47.5 pounds com-pared to plastic pallets which weighed 23pounds.) He also said plastic pallets areeasier to handle than their wood counter-parts because they do not splinter. Theonly drawback is that the plastic pallets arenot compatible with the store’s existingracking system, which means that if theydo not unload goods immediately, thepallets are cumbersome to store.
TABLE 6D
Pallet System at Store 2
Per Unit Size Estimated Number of Weight Per Unit AnnualPallet Type (in inches) Units Rotating Per Year (in pounds) [1] Tonnage [2]
Wooden Pallet 48 x 40 43 x 365 = 15,695 47.5 373
Plastic Pallet 48 x 40 12 x 365 = 4,380 23 50
TOTAL 423
[1] Per unit wieghts for each pallet type are based on actual weights recorded during the on-site visit.[2] The numbers in this column have been rounded.
44
CHAPTER SIX STORE 2: A PROFILE
Cost Benefit AnalysisAs Table 6D shows, by having a fullyreturnable pallet program, Store 2 ispreventing 423 tons of waste fromgoing into the landfill each year at thestore level. That translates into morethan $28,662 per year in avoideddisposal costs (423 tons x $67.76 perton disposal cost). This calculationassumes that UWS would charge Store2 the same rate to dispose of pallets asit charges for disposing of municipalsolid waste. This may or may not bethe case, however, since some haulershave different fee structures for han-dling pallets.
Since Store 2 does not buy pallets ordispose of them, the store would notrealize any direct economic benefitsfrom switching more of the palletinventory from wood to plastic. Thestore may, however, realize reduced“future” costs. For example, in Chap-ter 4 of this report, it was noted thatSUPERVALU (a Minnesota-basedwholesaler/distributor) saved 63 centsper trip over three years for every
plastic pallet in its inventory, andrealized $556,000 per year in re-duced workers’ compensation, labor,and shipping costs (or $3.70 perpallet). If Store 2’s wholesaler/dis-tributor were to realize similar costsavings by using plastic pallets insteadof wood, Store 2 may benefit in theform of lower future “passed on”costs.
In addition, Store 2 may experiencesome indirect economic benefits. Forexample, data show that SUPERVALUcould experience a one-cent costreduction per pallet in workers’compensation claims as a result ofswitching from wood to plastic. IfStore 2 saw its entire inventory ofpallets switched from wood to plastic,it could expect to decrease its workers’compensation claims by about $200per year (20,075 pallets x $.01). It ispossible that the store may also expe-rience a decrease in labor costs as aresult of switching from wood toplastic pallets, but supporting data arenot currently available.
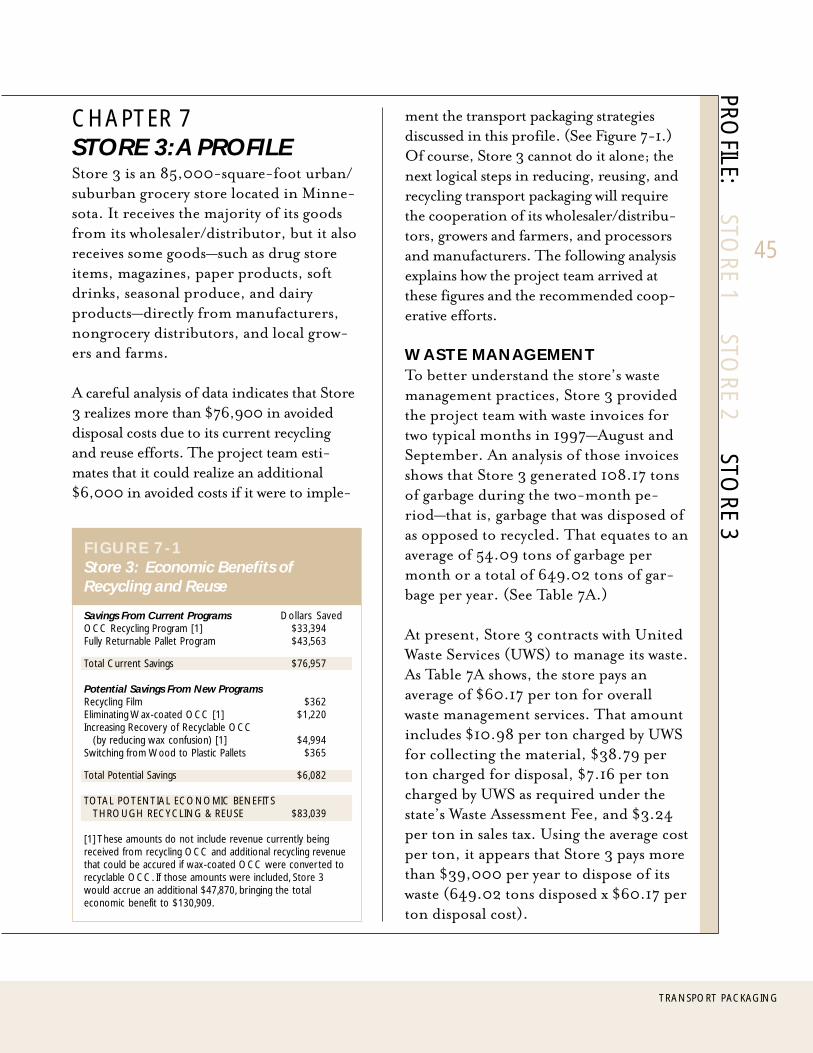
TRANSPORT PACKAGING
45
PROFILE:
STORE 1
STORE 2
STORE 3
FIGURE 7-1Store 3: Economic Benefits ofRecycling and Reuse
Savings From Current Programs Dollars SavedOCC Recycling Program [1] $33,394Fully Returnable Pallet Program $43,563
Total Current Savings $76,957
Potential Savings From New ProgramsRecycling Film $362Eliminating Wax-coated OCC [1] $1,220Increasing Recovery of Recyclable OCC
(by reducing wax confusion) [1] $4,994Switching from Wood to Plastic Pallets $365
Total Potential Savings $6,082
TOTAL POTENTIAL ECONOMIC BENEFITSTHROUGH RECYCLING & REUSE $83,039
[1] These amounts do not include revenue currently beingreceived from recycling OCC and additional recycling revenuethat could be accured if wax-coated OCC were converted torecyclable OCC. If those amounts were included, Store 3would accrue an additional $47,870, bringing the totaleconomic benefit to $130,909.
CHAPTER 7STORE 3: A PROFILEStore 3 is an 85,000-square-foot urban/suburban grocery store located in Minne-sota. It receives the majority of its goodsfrom its wholesaler/distributor, but it alsoreceives some goods—such as drug storeitems, magazines, paper products, softdrinks, seasonal produce, and dairyproducts—directly from manufacturers,nongrocery distributors, and local grow-ers and farms.
A careful analysis of data indicates that Store3 realizes more than $76,900 in avoideddisposal costs due to its current recyclingand reuse efforts. The project team esti-mates that it could realize an additional$6,000 in avoided costs if it were to imple-
ment the transport packaging strategiesdiscussed in this profile. (See Figure 7-1.)Of course, Store 3 cannot do it alone; thenext logical steps in reducing, reusing, andrecycling transport packaging will requirethe cooperation of its wholesaler/distribu-tors, growers and farmers, and processorsand manufacturers. The following analysisexplains how the project team arrived atthese figures and the recommended coop-erative efforts.
WASTE MANAGEMENTTo better understand the store’s wastemanagement practices, Store 3 providedthe project team with waste invoices fortwo typical months in 1997—August andSeptember. An analysis of those invoicesshows that Store 3 generated 108.17 tonsof garbage during the two-month pe-riod—that is, garbage that was disposed ofas opposed to recycled. That equates to anaverage of 54.09 tons of garbage permonth or a total of 649.02 tons of gar-bage per year. (See Table 7A.)
At present, Store 3 contracts with UnitedWaste Services (UWS) to manage its waste.As Table 7A shows, the store pays anaverage of $60.17 per ton for overallwaste management services. That amountincludes $10.98 per ton charged by UWSfor collecting the material, $38.79 perton charged for disposal, $7.16 per toncharged by UWS as required under thestate’s Waste Assessment Fee, and $3.24per ton in sales tax. Using the average costper ton, it appears that Store 3 pays morethan $39,000 per year to dispose of itswaste (649.02 tons disposed x $60.17 perton disposal cost).
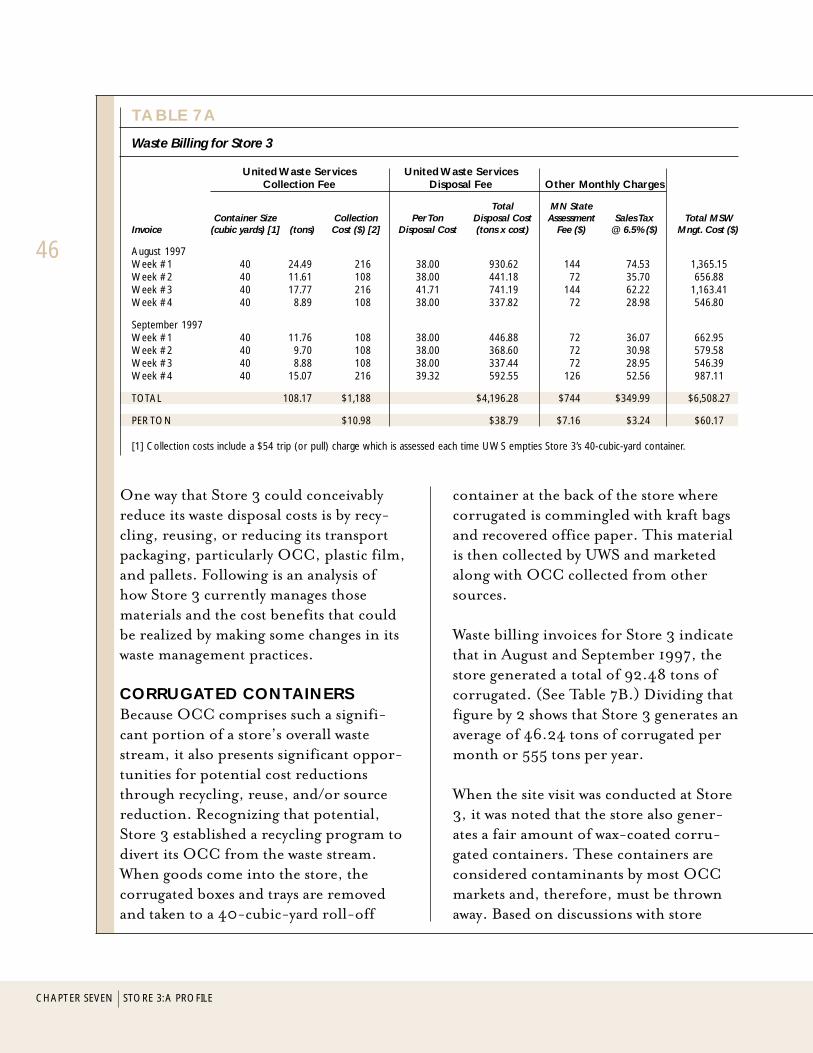
46
CHAPTER SEVEN STORE 3: A PROFILE
One way that Store 3 could conceivablyreduce its waste disposal costs is by recy-cling, reusing, or reducing its transportpackaging, particularly OCC, plastic film,and pallets. Following is an analysis ofhow Store 3 currently manages thosematerials and the cost benefits that couldbe realized by making some changes in itswaste management practices.
CORRUGATED CONTAINERSBecause OCC comprises such a signifi-cant portion of a store’s overall wastestream, it also presents significant oppor-tunities for potential cost reductionsthrough recycling, reuse, and/or sourcereduction. Recognizing that potential,Store 3 established a recycling program todivert its OCC from the waste stream.When goods come into the store, thecorrugated boxes and trays are removedand taken to a 40-cubic-yard roll-off
container at the back of the store wherecorrugated is commingled with kraft bagsand recovered office paper. This materialis then collected by UWS and marketedalong with OCC collected from othersources.
Waste billing invoices for Store 3 indicatethat in August and September 1997, thestore generated a total of 92.48 tons ofcorrugated. (See Table 7B.) Dividing thatfigure by 2 shows that Store 3 generates anaverage of 46.24 tons of corrugated permonth or 555 tons per year.
When the site visit was conducted at Store3, it was noted that the store also gener-ates a fair amount of wax-coated corru-gated containers. These containers areconsidered contaminants by most OCCmarkets and, therefore, must be thrownaway. Based on discussions with store
TABLE 7A
Waste Billing for Store 3
United Waste Services United Waste ServicesCollection Fee Disposal Fee Other Monthly Charges
Total MN StateContainer Size Collection Per Ton Disposal Cost Assessment Sales Tax Total MSW
Invoice (cubic yards) [1] (tons) Cost ($) [2] Disposal Cost (tons x cost) Fee ($) @ 6.5% ($) Mngt. Cost ($)
August 1997Week #1 40 24.49 216 38.00 930.62 144 74.53 1,365.15Week #2 40 11.61 108 38.00 441.18 72 35.70 656.88Week #3 40 17.77 216 41.71 741.19 144 62.22 1,163.41Week #4 40 8.89 108 38.00 337.82 72 28.98 546.80
September 1997Week #1 40 11.76 108 38.00 446.88 72 36.07 662.95Week #2 40 9.70 108 38.00 368.60 72 30.98 579.58Week #3 40 8.88 108 38.00 337.44 72 28.95 546.39Week #4 40 15.07 216 39.32 592.55 126 52.56 987.11
TOTAL 108.17 $1,188 $4,196.28 $744 $349.99 $6,508.27
PER TON $10.98 $38.79 $7.16 $3.24 $60.17
[1] Collection costs include a $54 trip (or pull) charge which is assessed each time UWS empties Store 3’s 40-cubic-yard container.

TRANSPORT PACKAGING
47
personnel, it is estimated that Store 3receives about 100 wax-coated freshproduce boxes per week, which equates toa total of 5,200 wax-coated boxes peryear. (Interestingly, Store 3 maintainsthat it no longer receives any meat orpoultry in wax-coated boxes except theoccasional box of neck bones and suet,both of which are seasonal products.Instead, meat and poultry now comepackaged in plastic bags which are housedinside traditional corrugated boxes.) Withan average weight of 2.4 pounds for wax-coated fresh produce boxes, Store 3 gener-ates approximately 12,480 pounds (or 6tons) of nonrecyclable OCC each year.
Cost Benefit AnalysisBy recycling its OCC, Store 3 experi-ences $33,394 in avoided disposalcosts each year (555 tons of recyclableOCC x $60.17 per ton disposal cost).
Store 3 also realizes revenue fromrecycling its OCC, but because perton prices fluctuate dramatically, the
project team was reluctant to includesuch a figure. A specific point-in-time analysis shows that, in 1997,Store 3 received approximately $75per ton for its OCC, which resulted inrevenue of $41,625, but this numbershould be used with great cautionwhen making program decisions sinceit may not remain constant over time.(It should be noted that this figure wasnot used by the project team in calcu-lating the store’s overall economicbenefit from recycling and reuseprograms.)
If Store 3 could work cooperativelywith growers and processors to elimi-nate wax-coated OCC, it could accruean additional $361 in avoided disposalcosts (6 tons of wax-coated OCC x$60.17 per ton disposal cost).
Furthermore, if recent studies areaccurate that show that between 10 and15 percent of nonwaxed boxes areinadvertently mixed in with waxedboxes at the grocery store and sent outfor disposal, then Store 3 may realizeas much as $4,994 in additionalavoided disposal costs by eliminatingwax-coated boxes or taking steps toimprove their identification (555 tonsof OCC x 15 percent = 83 x $60.17per ton disposal cost). In addition, itwould realize $6,245 in additionalrevenue if that OCC were capturedfor recycling. (Again, the recyclingrevenue figure was not used in calcu-lating the store’s overall economicbenefit from recycling and reuseprograms.)
TABLE 7B
OCC Generation at Store 3
Month OCC Tons Collected [1]
August 1997 Week #1 10.74 Week #2 14.13 Week #3 13.93 Week #4 8.95
September 1997 Week #1 14.19 Week #2 6.06 Week #3 7.07 Week #4 17.41
TOTAL 92.48
[1] OCC quantities are from actual waste billing invoices.
PROFILE:
STORE 1
STORE 2
STORE 3

48
Another avenue that Store 3 couldpursue would be to work with growersand processors to explore the feasibil-ity of replacing wax-coated OCC withreusable plastic shipping containers. Aprecedent for using returnable plasticshipping containers has been set atStore 3: Its wholesaler/distributor hasbeen using returnable plastic totes foryears to deliver health and beautyproducts and general merchandise tothe store; using returnable plastic traysfor bakery products; and using re-turnable plastic pallets for shippinggoods. While the issues of using re-turnable plastic containers in produceand meat applications are more com-plex, these programs do demonstratethat returnable systems can be devel-oped and work effectively in the gro-cery sector. (See Chapter 2, Lesson 5for more information.)
Opportunities to Strengthen the ProgramStore 3 has a mature OCC recyclingprogram that generates considerablerevenue (at the high end for looseOCC), and the mechanics of theprogram appear to be working effec-tively. Therefore, there are no recom-mendations for improvement.
PLASTIC FILMStore 3 currently generates three types ofplastic film: (1) stretch wrap, which is usedprimarily to secure loads of goods topallets, (2) shrink wrap, which is usedprimarily to secure smaller quantities oflike goods together or to corrugated trays,and (3) plastic bags, which are collectedfrom the public. At Store 3, the first two
types of plastic film are handled togetherand the latter is handled separately.
Stretch and Shrink WrapStretch and Shrink WrapStretch and Shrink WrapStretch and Shrink WrapStretch and Shrink Wrap
At present, Store 3 does not recycle itsstretch and shrink wrap. Instead, whenpallets are unwrapped, the stretch film isthrown into the garbage compactor alongwith the store’s waste. Similarly, whenshrink wrap is removed from products orcorrugated trays, it is thrown into thegarbage compactor and picked up by UWSfor disposal.
To better understand the quantities ofstretch and shrink wrap generated, theproject team asked the store to collect asample of the material, which Store 3 didfor two days. When analyzing that sample,it was found that the store generated atotal of 27.5 pounds of plastic film. Thatequates to an average of 13.8 pounds offilm per day, or 5,037 pounds (or 3 tons)per year. Of that amount, 73 percent wasstretch wrap, 22 percent was shrink wrap,and 5 percent was contamination. Thecontaminants included such things asboxboard liners, wrapping paper, oneplastic bottle, a polypropylene tray, paperlabels, one candy wrapper, and a smallamount of blue strapping.
Cost Benefit AnalysisIf Store 3 were to recycle its stretchand shrink wrap instead of disposingof it, it could save about $181 per yearin avoided disposal costs (3 tons x$60.17 per ton disposal cost.) Theactual savings, however, would likelybe higher because the sample at Store3 was very small, particularly when
CHAPTER SEVEN STORE 3: A PROFILE
TRANSPORT PACKAGING
49
compared to the two other stores inthis project. One of those storesgenerated 6 tons of film per year(exactly twice that of Store 3) and theother generated 7 tons of film per year(more than twice that of Store 3).This leads the project team to believethat Store 3 did not capture most ofthe stretch and shrink wrap that wasavailable for inclusion in its sample.Given that assumption, it is probablysafe to say that Store 3 would realize atleast double that amount—or $362—inavoided disposal costs if it were torecycle its stretch and shrink wrap.
Another indication that the sample atStore 3 was problematic is that shrinkwrap—at 22 percent—comprised amuch smaller portion of the totalsample than at the other stores. AtStore 1, shrink wrap comprised 70percent of the sample, and at Store 2it comprised 54 percent of the sample.Again, this indicates that the sample atStore 3 probably did not accuratelyrepresent the store’s actual filmstream.
Opportunities for Establishing a ProgramAs is true of most grocery stores, Store3 generates a fairly small amount offilm compared to other types of orga-nizations and compared to other typesof waste. According to its sample, thestore generates only 5,037 pounds ofstretch and shrink wrap per year.While that may seem like a lot from astore’s perspective, it is a very smallamount from a market’s perspective.Only 9 of the 22 film markets sur-
veyed for this project have no mini-mum load requirements. One marketaccepts loads of 1,000 pounds, an-other four accept minimum loads of5,000 pounds, and two have 10,000-pound requirements. The remainingsix markets require more materialthan a grocery store is likely to gener-ate in one year. (See Appendix B for alist of those markets.) Thus, it may bedifficult for Store 3 to try to recyclefilm on its own.
Another option that Store 3 couldexplore is establishing a backhaularrangement for plastic film with itswholesaler/distributor. It already has abackhaul arrangement for pallets andfor plastic totes; therefore, a prece-dent exists that could work for filmrecycling. At present, Store 3’s whole-saler/distributor is recycling thestretch wrap generated at its ownfacility, so it may not be that difficultto incorporate film coming back fromits stores. (See Chapter 3, Lesson 3for more information on the eco-nomics of recycling film at the whole-saler/distributor level.)
Based on the small size of the sample,it appears that the first thing Store 3would need to do to establish a filmrecycling program is to educate itsemployees about where they are likelyto find film and what types of filmshould be collected for recycling. Astart-up meeting at the commence-ment of the program to show samplesof film that employees should collectwould help, as would brief educational
PROFILE:
STORE 1
STORE 2
STORE 3
50
brochures and clear signs near thefilm collection containers. Placingactual “acceptable” examples of filmon or near the collection containersalso would help employees make gooddecisions about what to collect andwhat not to collect.
Another way to ensure participationin a film recycling program is to makeit as easy as possible so that employeeswill want to participate and will nothave to go out of their way to do so.Since employees already have to re-move stretch wrap from pallets andshrink wrap from corrugated trays andtake it to the store’s garbage compac-tor, it would make sense to placecollection containers as close as pos-sible to the garbage compactor. Thatway, employees would simply have toplace the film in the collection con-tainers instead of in the trash.
In order for a film recycling programto be successful, it also has to havesupport from the top down. Thus, ifStore 3 wants to recycle plastic film,the store manager needs to be fullycommitted to the program, and oneor two employees need to be put incharge of implementing and oversee-ing the program to make sure it works.Without this buy-in and accountabil-ity on the part of the employees—fromthe top down—a recycling program willnot succeed.
Plastic BagsPlastic BagsPlastic BagsPlastic BagsPlastic Bags
Interestingly, while Store 3 does notrecycle its stretch and shrink wrap, it does
recycle plastic bags, which are collected bythe public and returned to the store forrecycling. A sample of bags collected atStore 3 shows that the store recovered17.5 pounds of bags over a six-day period,which equates to 2.9 pounds per day or1,059 pounds per year.
Store 3 has four carts positioned at thefront of the store—one to collect paperbags for recycling and the other three tocollect plastic bags. Each cart has a signon top indicating what type of bag shouldbe included, and inside are large, blackplastic collection bags. When the blackbags are full, employees remove them, tiethem off, and return them to the loading/unloading dock where the wholesaler/distributor loads them onto empty ve-hicles and returns them to the warehouse/distribution center. Store 3’s wholesaler/distributor, however, does not recycle thebags. Instead, it has agreed to keep atrailer from Bunzl Recycling on site sothat Store 3’s chain can continue recy-cling bags. Bunzl, however, is solelyresponsible for making sure that the bags,which are consolidated in the trailer, aremoved to market. Store 3 does not receiveany revenue from its bag recycling pro-gram but considers it an important publicservice.
Cost Benefit AnalysisIt is difficult to connect any costbenefit to recycling plastic bags interms of avoided disposal costs be-cause the store would not be collectingbags from the public if they weresimply going to throw them away.Similarly, the store does not generate
CHAPTER SEVEN STORE 3: A PROFILE
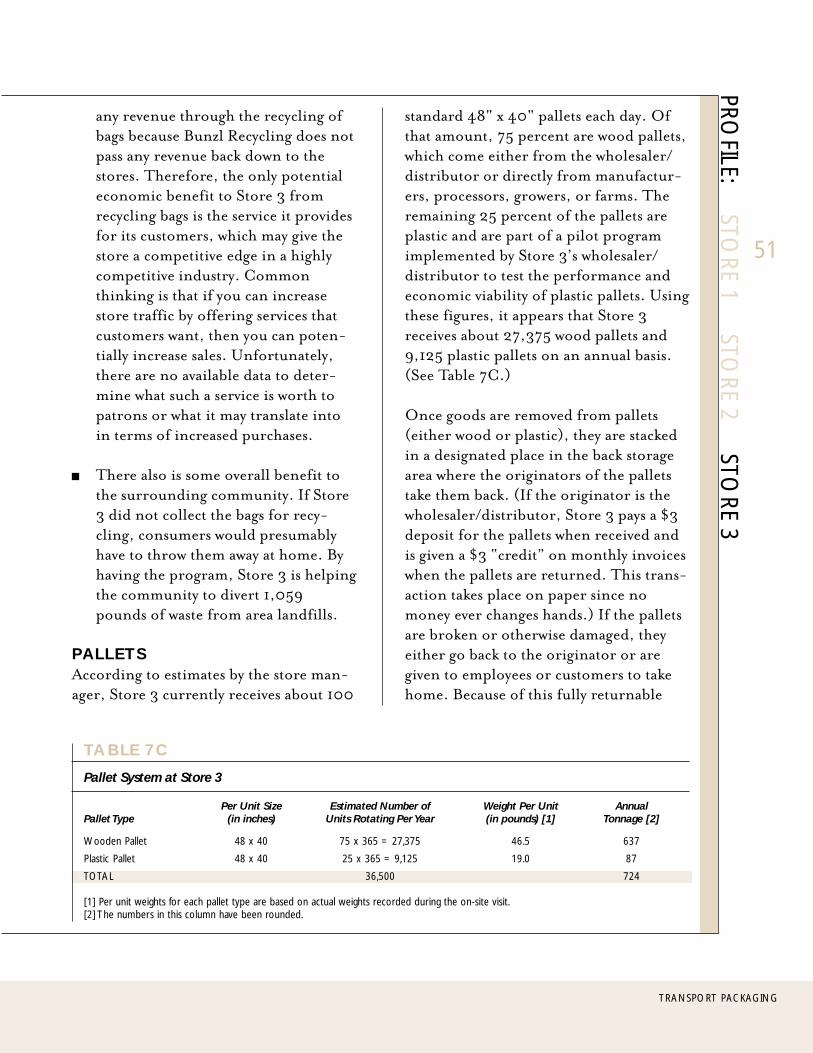
TRANSPORT PACKAGING
51
any revenue through the recycling ofbags because Bunzl Recycling does notpass any revenue back down to thestores. Therefore, the only potentialeconomic benefit to Store 3 fromrecycling bags is the service it providesfor its customers, which may give thestore a competitive edge in a highlycompetitive industry. Commonthinking is that if you can increasestore traffic by offering services thatcustomers want, then you can poten-tially increase sales. Unfortunately,there are no available data to deter-mine what such a service is worth topatrons or what it may translate intoin terms of increased purchases.
There also is some overall benefit tothe surrounding community. If Store3 did not collect the bags for recy-cling, consumers would presumablyhave to throw them away at home. Byhaving the program, Store 3 is helpingthe community to divert 1,059pounds of waste from area landfills.
PALLETSAccording to estimates by the store man-ager, Store 3 currently receives about 100
standard 48" x 40" pallets each day. Ofthat amount, 75 percent are wood pallets,which come either from the wholesaler/distributor or directly from manufactur-ers, processors, growers, or farms. Theremaining 25 percent of the pallets areplastic and are part of a pilot programimplemented by Store 3’s wholesaler/distributor to test the performance andeconomic viability of plastic pallets. Usingthese figures, it appears that Store 3receives about 27,375 wood pallets and9,125 plastic pallets on an annual basis.(See Table 7C.)
Once goods are removed from pallets(either wood or plastic), they are stackedin a designated place in the back storagearea where the originators of the palletstake them back. (If the originator is thewholesaler/distributor, Store 3 pays a $3deposit for the pallets when received andis given a $3 “credit” on monthly invoiceswhen the pallets are returned. This trans-action takes place on paper since nomoney ever changes hands.) If the palletsare broken or otherwise damaged, theyeither go back to the originator or aregiven to employees or customers to takehome. Because of this fully returnable
TABLE 7C
Pallet System at Store 3
Per Unit Size Estimated Number of Weight Per Unit AnnualPallet Type (in inches) Units Rotating Per Year (in pounds) [1] Tonnage [2]
Wooden Pallet 48 x 40 75 x 365 = 27,375 46.5 637
Plastic Pallet 48 x 40 25 x 365 = 9,125 19.0 87
TOTAL 36,500 724
[1] Per unit weights for each pallet type are based on actual weights recorded during the on-site visit.[2] The numbers in this column have been rounded.
PROFILE:
STORE 1
STORE 2
STORE 3
52
pallet system, the store rarely throws anypallets away.
Cost Benefit AnalysisBy having a fully returnable palletsystem, Store 3 is diverting 724 tonsof waste from the landfill each year atthe store level. That translates into$43,563 per year in avoided disposalcosts for Store 3 (724 tons x $60.17per ton disposal cost). This calcula-tion assumes that UWS would chargeStore 3 the same rate to dispose ofpallets as it charges for disposing ofmunicipal solid waste. This may ormay not be the case, however, sincesome haulers have different fee struc-tures for handling pallets.
Since Store 3 does not buy pallets ordispose of them, the store would notrealize any direct economic benefitsfrom seeing more of its pallet inven-tory switched from wood to plastic.The store may, however, realize re-duced “future” costs. For example, inChapter 4 of this report, it was notedthat SUPERVALU saved 63 cents pertrip over three years for every plastic
pallet in its inventory, and realized$556,000 per year in reduced work-ers’ compensation, labor, and ship-ping costs (or $3.70 per pallet). IfStore 3’s wholesaler/distributor experi-enced similar savings, it is conceivablethat some of those savings may be passedalong to Store 3 in the form of lowerfuture “passed on” costs.
In addition, Store 3 may experiencesome indirect economic benefits. Forexample, data show that SUPERVALUcould experience a one-cent costreduction per pallet in workers’compensation claims as a result ofswitching from wood to plastic. IfStore 3 saw its entire inventory ofpallets switched from wood to plastic,it could expect to decrease its ownworkers’ compensation claims byabout $365 per year (36,500 pallets x$.01 = $365.00). It is possible thatthe store may also experience a de-crease in labor costs as a result ofswitching from wood to plastic pallets,but supporting data currently are notavailable.
CHAPTER SEVEN STORE 3: A PROFILE
53
TRANSPORT PACKAGING
BACKGROUNDIn recent years, the grocery industry has
started seeing a new transport packaging
option emerge. It is called a “tray/shrink”
package, and it has steadily been replacing
the use of full corrugated containers in
certain grocery applications. With this
package, grocery items are stacked on a
corrugated tray and sealed with shrink
wrap. The shrink wrap typically is made of
LDPE or a polyethylene blend and ranges
in thickness from 1.5 mils (for lighter prod-
ucts) to 3 mils (for heavier products). In-
dustry sources indicate that the tray/shrink
package is used predominantly to transport
canned goods, although it has been making
headway into other product areas.
Industry sources indicate that consumer
product manufacturers are making the
switch from traditional corrugated con-
tainers to tray/shrink because the eco-
nomics are appealing. They maintain that,
by using tray/shrink packaging, manufac-
turers can
reduce shipping costs (because tray/
shrink packages weigh less than prod-
ucts packaged in full corrugated
cases);
reduce material costs (since the
amount of film required to complete
the package is much less than the
amount of corrugated); and
reduce processing costs (since it
takes less time to shrink a package
than it does to enclose it in a wrap-
around corrugated case).
SOURCE REDUCTION BENEFITS AND OTHER ISSUESRELATED TO TRAY/SHRINK PACKAGING
The project team tried to quantify these
benefits, but consumer product manufac-
turers were unwilling to share such infor-
mation due to its proprietary nature.
Equipment manufacturers also maintain
that it would be too difficult to estimate
potential cost savings since the amount
would vary depending on the size of the
product, the speed of the packaging line,
the resin and mil thickness of shrink wrap
used, the current costs of corrugated, and
the current costs of film. One industrysource said that consumer productmanufacturers could expect to reducepackaging costs by about 25 percentby making the switch to tray/shrinkpackages, but that was the most detailed
estimate that any contact would provide.
SOURCE REDUCTIONBENEFITS OF TRAY/SHRINKThe tray/shrink package also has environ-
mental benefits—particularly in the area of
source reduction. At Store 2, the project
team weighed a corrugated box that had
been used to ship twelve jars of peanut
butter and a tray/shrink package that had
been used to ship twelve similarly sized jars
of peanut butter. The corrugated box
weighed .40 pounds, and the tray/shrink
package weighed .20 pounds, or half as much
as the full corrugated container. Thus, tray/shrink has the potential to cut theweight of a transport package in half.It should be noted that, on the tray/shrink
package, the corrugated tray accounted
for 90 percent of the total package weight
(at .18 pounds) and the shrink wrap ac-
counted for 10 percent (at .02 pounds).
To get a sense of the prevalence of tray/
shrink packages in the grocery industry,
the project team asked two wholesaler/
distributors headquartered in Minnesota
what percentage of their canned goods
currently come packaged in tray/shrink. The
first wholesaler/distributor reported that
10 percent of its canned goods currently
come in tray/shrink, 90 percent come in
full corrugated containers, and 70 percent
of those still coming in corrugated con-
tainers would be “good candidates” for
tray/shrink packaging (i.e., they were not
too heavy or tall). The second wholesaler/
distributor reported that 35 percent of
its canned goods currently come in tray/
shrink, 65 percent come in full corrugated
containers, and 20 percent of those still
coming in corrugated containers would
be “good candidates” for tray/shrink pack-
aging. Thus, if all of the remaining canned
goods that were “good candidates” for
tray/shrink were actually converted from
corrugated containers to tray/shrink, it
appears that the grocery distribution sys-
tem would realize a significant reduction
in the amount (by weight) of transport
packaging.
To determine the potential reduction in
these two systems, the wholesaler/distribu-
tors would need to (1) ascertain the total
number of canned goods coming into their
facilities, (2) multiply that amount by 90
percent and 65 percent respectively, and
(3) multiply those amounts by 70 percent
and 20 percent respectively to determine
the remaining number of canned goods
that could likely be converted from cor-

54
rugated containers to tray/shrink packag-
ing. Then they would need to (1) deter-
mine how many corrugated containers
would be needed to transport those re-
maining canned goods from the manufac-
turer to the wholesaler/distributor, (2) mul-
tiply that amount by the average weight
of a standard corrugated case, and (3) di-
vide that number by two to determine
how much less material could be gener-
ated if tray/shrink packages were substi-
tuted for full corrugated boxes.
While that calculation may appear simple,
the project team and one of its whole-
saler/distributors tried to do it for this
project and ran into several stumbling
blocks. First, without doing considerable
investigative work, the wholesaler/distribu-
tor could not estimate, with any certainty,
how many canned goods it purchases.
Second, the industry ships in several dif-
ferent sized cases (predominantly 24-
packs, but also 12-packs, 48-packs, and a
few odd-sized packs for small cans). Thus,
there is no “average” or “standard” corru-
gated case to weigh.
Despite these problems, the project team
and the wholesaler/distributor attempted
to make a rough calculation by making
some very broad assumptions. Using the
number of cases as a proxy for the num-
ber of canned goods, the wholesaler/dis-
tributor estimates that it brings in 48,000
cases of canned goods per week or
2,496,000 cases per year (48,000 x 52). If
10 percent of its canned goods are already
in tray-shrink (2,496,000 x .10 = 249,000),
and 70 percent of the remaining 90 per-
cent are “good candidates” for tray/shrink,
that leaves 1,572,480 cases of canned
goods that could be converted.
If you assume that all of those canned
goods would be coming in 12-pack cases
(which we know is not accurate, but it is
the only size case for which we have a
corrugated and tray shrink comparison),
then the wholesaler/distributor would be
generating 628,992 pounds of corrugated
cases per year (1,572,480 x .40 pounds).
If it were to fully convert those corru-gated cases to tray/shrink packaging,the change would result in 314,496fewer pounds (or 157.3 fewer tons) oftransport packaging being generatedper year (628,992 divided by 2) by thatwholesaler/distributor alone.
ECONOMIC EFFECTS OFTRAY/SHRINK ON THEGROCERY DISTRIBUTIONSYSTEMWhen looking at any transport packaging
change, it is important to understand how
such a change will affect each component
within the grocery distribution system,
because it will determine (1) where the
impetus for change is likely to come from
within the system, and (2) how readily and
by whom the change will be embraced.
As the following analysis shows, switching
from full corrugated cases to tray/shrink
packaging may be very attractive for prod-
uct manufacturers and wholesaler/distribu-
tors, but not for individual grocery stores.
Product ManufacturersAs mentioned above, it appears that prod-
uct manufacturers have the most to gain
by switching from corrugated boxes to
tray/shrink packages. With an estimatedpackaging cost reduction of 25 per-cent and an estimated raw materialreduction of 50 percent (by weight),tray/shrink appears to be an idealtransport package from a productmanufacturer’s perspective. It also
makes sense that if product manufactur-
ers can be more efficient by transporting
their goods in tray/shrink, then wholesaler/
distributors and grocery stores will ben-
efit economically as well through lower
“passed on” costs.
Wholesaler/DistributorsFrom the perspective of the whole-saler/distributor, tray/shrink packagesshould have at least one positive eco-nomic effect—if their products aretransported in lighter packages, thenthey should experience lower shippingcosts (particularly since transportation
costs are based on weight). Tray/shrink
packages also will not add to the waste
stream of the wholesaler/distributor be-
cause the packages are simply passed
through from the manufacturer to the
store—that is, they are not broken down
and repackaged like full corrugated cases.
Wholesaler/distributors may, however, ex-
perience a decrease in their OCC recy-
cling revenue because the amount of cor-
rugated available in their facilities for recy-
cling will decrease as the use of tray/shrink
increases.
Some of the wholesaler/distributors that
the team met with during the project
raised the following concerns regarding the
performance of tray/shrink packages.
1. Wholesaler/distributors prefer greater
mil thickness in shrink wrap because
they need the wrap to act as a handle
when they pull packages off pallets.
2. Wholesaler/distr ibutor s prefer
greater mil thickness because film
must be strong enough to withstand
repalletization.
3. While tray/shrink packaging is ideal for
most canned goods, it does not work
as well on products packaged in pa-
perboard cartons. It needs to be used
with goods that are structurally sound.
4. When tray/shr ink packages are
palletized, they require more pallet
wrap than full corrugated boxes be-
cause the containers are no longer
square.
54
SOURCE REDUCTION BENEFITS
55
TRANSPORT PACKAGING
5. While shrink wrap adds stability to
pallet loads during transport because
there is greater friction with the film
than with corrugated boxes, that
same friction increases labor time
because the products tend to stick
together and, thus, make loading and
unloading more difficult.
6. Tray/shrink packages have rounded
corners and nonuniform tops which
make stacking more difficult. Stack-
ing would be easier for wholesaler/
distributors if manufacturers used
corrugated trays on both the top and
bottom of tray/shrink packages, al-
though that may decrease their eco-
nomic and source reduction benefits.
Grocery StoresFor an individual grocery store, anygrowth in tray/shrink packaging mayhave a negative economic effect. From
a waste disposal perspective, the effects
of the tray/shrink package will be negli-
gible since the corrugated trays can be
recycled along with traditional corrugated
boxes and, if a store has a film recycling
program, the shrink wrap can be recycled
along with its stretch wrap.
If, however, grocery stores do not have
film recycling programs, then the shrink
wrap will add somewhat to their waste
disposal costs. Using averages from the
three stores studied in this report, a typi-
cal suburban grocery store might expect
to generate 4.31 tons of shrink wrap per
year at an average disposal cost of $89.98
per ton, which equates to $386 in annual
disposal costs.
Grocery stores also can expect to see a
decrease in their corrugated recycling rev-
enues because the stores will be generat-
ing smaller quantities of OCC. Using Store
1 as an example, it currently generates
269.25 tons of OCC per year, and receives
revenue of $65 per ton for recycling it. If
its OCC quantities were reduced by 15
percent (as an example) as a result of
manufacturers switching from full corru-
gated containers to tray/shrink packages,
it could expect its annual OCC recycling
revenue to decrease by $2,625.
These costs may, however, be offset some-
what by the improved efficiency in the
overall grocery distribution system which,
in turn, should enable product manufac-
turers and wholesaler/distributors to limit
future cost increases that typically are
“passed on” to the stores.
In addition, store managers reported that
tray/shrink packages were (1) faster to
open and stock, (2) required fewer trips
to the storage room to empty waste into
the baler, and (3) resulted in fewer inju-
ries (as compared to opening corrugated
boxes). The store managers participating
in this project estimated their labor sav-
ings (as a result of tray/shrink packaging)
at 10 percent, which may further offset
any recycling revenue losses due to de-
creased OCC quantities.
1This amount is based on actual quantities generated at Store 1 and Store 2. It also includes twice the quantity found in the sample at Store 3 because, as was
discussed in the full report, the sample at Store 3 was very small compared to what that store could realistically expect to generate.
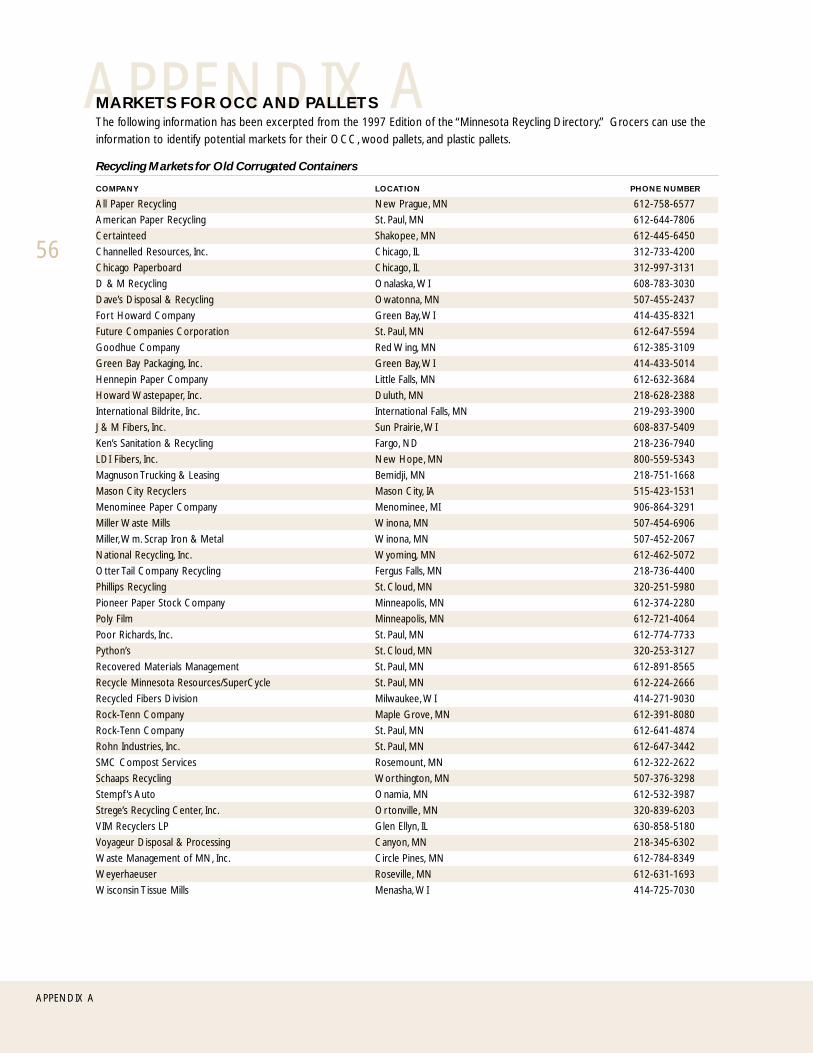
APPENDIX AMARKETS FOR OCC AND PALLETSThe following information has been excerpted from the 1997 Edition of the “Minnesota Reycling Directory.” Grocers can use the
information to identify potential markets for their OCC, wood pallets, and plastic pallets.
Recycling Markets for Old Corrugated Containers
COMPANY LOCATION PHONE NUMBER
All Paper Recycling New Prague, MN 612-758-6577
American Paper Recycling St. Paul, MN 612-644-7806
Certainteed Shakopee, MN 612-445-6450
Channelled Resources, Inc. Chicago, IL 312-733-4200
Chicago Paperboard Chicago, IL 312-997-3131
D & M Recycling Onalaska, WI 608-783-3030
Dave’s Disposal & Recycling Owatonna, MN 507-455-2437
Fort Howard Company Green Bay, WI 414-435-8321
Future Companies Corporation St. Paul, MN 612-647-5594
Goodhue Company Red Wing, MN 612-385-3109
Green Bay Packaging, Inc. Green Bay, WI 414-433-5014
Hennepin Paper Company Little Falls, MN 612-632-3684
Howard Wastepaper, Inc. Duluth, MN 218-628-2388
International Bildrite, Inc. International Falls, MN 219-293-3900
J & M Fibers, Inc. Sun Prairie, WI 608-837-5409
Ken’s Sanitation & Recycling Fargo, ND 218-236-7940
LDI Fibers, Inc. New Hope, MN 800-559-5343
Magnuson Trucking & Leasing Bemidji, MN 218-751-1668
Mason City Recyclers Mason City, IA 515-423-1531
Menominee Paper Company Menominee, MI 906-864-3291
Miller Waste Mills Winona, MN 507-454-6906
Miller, Wm. Scrap Iron & Metal Winona, MN 507-452-2067
National Recycling, Inc. Wyoming, MN 612-462-5072
Otter Tail Company Recycling Fergus Falls, MN 218-736-4400
Phillips Recycling St. Cloud, MN 320-251-5980
Pioneer Paper Stock Company Minneapolis, MN 612-374-2280
Poly Film Minneapolis, MN 612-721-4064
Poor Richards, Inc. St. Paul, MN 612-774-7733
Python’s St. Cloud, MN 320-253-3127
Recovered Materials Management St. Paul, MN 612-891-8565
Recycle Minnesota Resources/SuperCycle St. Paul, MN 612-224-2666
Recycled Fibers Division Milwaukee, WI 414-271-9030
Rock-Tenn Company Maple Grove, MN 612-391-8080
Rock-Tenn Company St. Paul, MN 612-641-4874
Rohn Industries, Inc. St. Paul, MN 612-647-3442
SMC Compost Services Rosemount, MN 612-322-2622
Schaaps Recycling Worthington, MN 507-376-3298
Stempf ’s Auto Onamia, MN 612-532-3987
Strege’s Recycling Center, Inc. Ortonville, MN 320-839-6203
VIM Recyclers LP Glen Ellyn, IL 630-858-5180
Voyageur Disposal & Processing Canyon, MN 218-345-6302
Waste Management of MN, Inc. Circle Pines, MN 612-784-8349
Weyerhaeuser Roseville, MN 612-631-1693
Wisconsin Tissue Mills Menasha, WI 414-725-7030
56
APPENDIX A
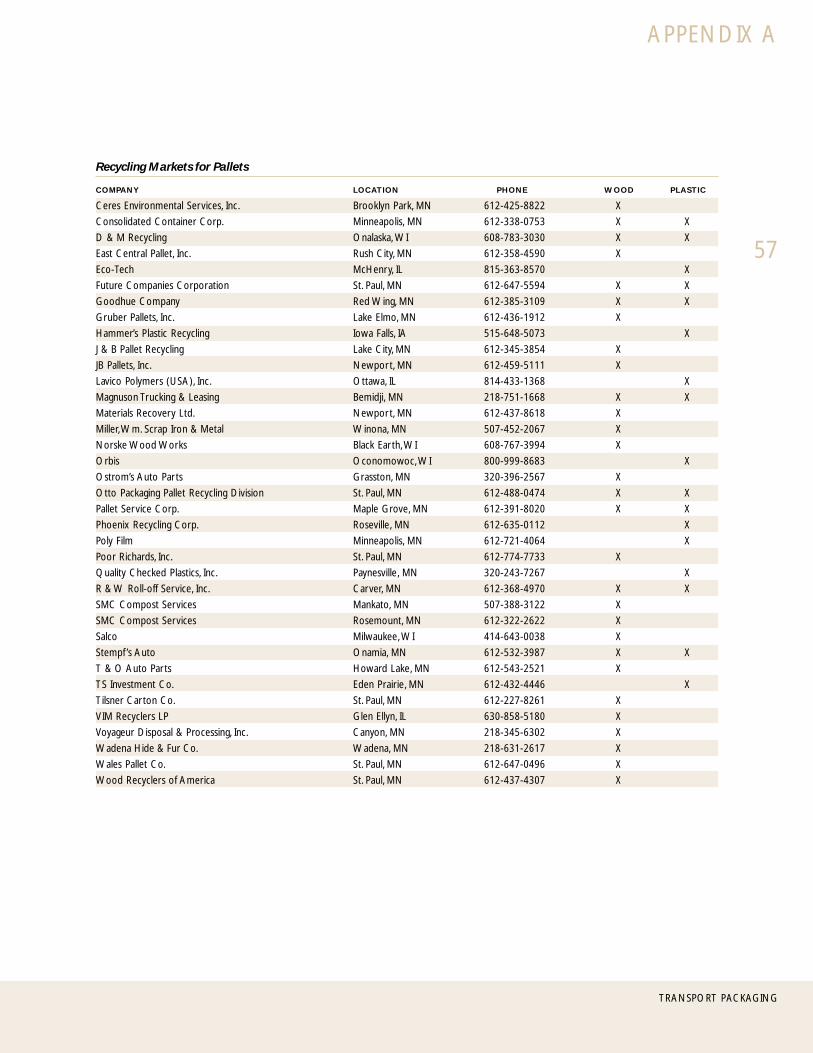
57
TRANSPORT PACKAGING
Recycling Markets for Pallets
COMPANY LOCATION PHONE WOOD PLASTIC
Ceres Environmental Services, Inc. Brooklyn Park, MN 612-425-8822 X
Consolidated Container Corp. Minneapolis, MN 612-338-0753 X X
D & M Recycling Onalaska, WI 608-783-3030 X X
East Central Pallet, Inc. Rush City, MN 612-358-4590 X
Eco-Tech McHenry, IL 815-363-8570 X
Future Companies Corporation St. Paul, MN 612-647-5594 X X
Goodhue Company Red Wing, MN 612-385-3109 X X
Gruber Pallets, Inc. Lake Elmo, MN 612-436-1912 X
Hammer’s Plastic Recycling Iowa Falls, IA 515-648-5073 X
J & B Pallet Recycling Lake City, MN 612-345-3854 X
JB Pallets, Inc. Newport, MN 612-459-5111 X
Lavico Polymers (USA), Inc. Ottawa, IL 814-433-1368 X
Magnuson Trucking & Leasing Bemidji, MN 218-751-1668 X X
Materials Recovery Ltd. Newport, MN 612-437-8618 X
Miller, Wm. Scrap Iron & Metal Winona, MN 507-452-2067 X
Norske Wood Works Black Earth, WI 608-767-3994 X
Orbis Oconomowoc, WI 800-999-8683 X
Ostrom’s Auto Parts Grasston, MN 320-396-2567 X
Otto Packaging Pallet Recycling Division St. Paul, MN 612-488-0474 X X
Pallet Service Corp. Maple Grove, MN 612-391-8020 X X
Phoenix Recycling Corp. Roseville, MN 612-635-0112 X
Poly Film Minneapolis, MN 612-721-4064 X
Poor Richards, Inc. St. Paul, MN 612-774-7733 X
Quality Checked Plastics, Inc. Paynesville, MN 320-243-7267 X
R & W Roll-off Service, Inc. Carver, MN 612-368-4970 X X
SMC Compost Services Mankato, MN 507-388-3122 X
SMC Compost Services Rosemount, MN 612-322-2622 X
Salco Milwaukee, WI 414-643-0038 X
Stempf ’s Auto Onamia, MN 612-532-3987 X X
T & O Auto Parts Howard Lake, MN 612-543-2521 X
TS Investment Co. Eden Prairie, MN 612-432-4446 X
Tilsner Carton Co. St. Paul, MN 612-227-8261 X
VIM Recyclers LP Glen Ellyn, IL 630-858-5180 X
Voyageur Disposal & Processing, Inc. Canyon, MN 218-345-6302 X
Wadena Hide & Fur Co. Wadena, MN 218-631-2617 X
Wales Pallet Co. St. Paul, MN 612-647-0496 X
Wood Recyclers of America St. Paul, MN 612-437-4307 X
APPENDIX A
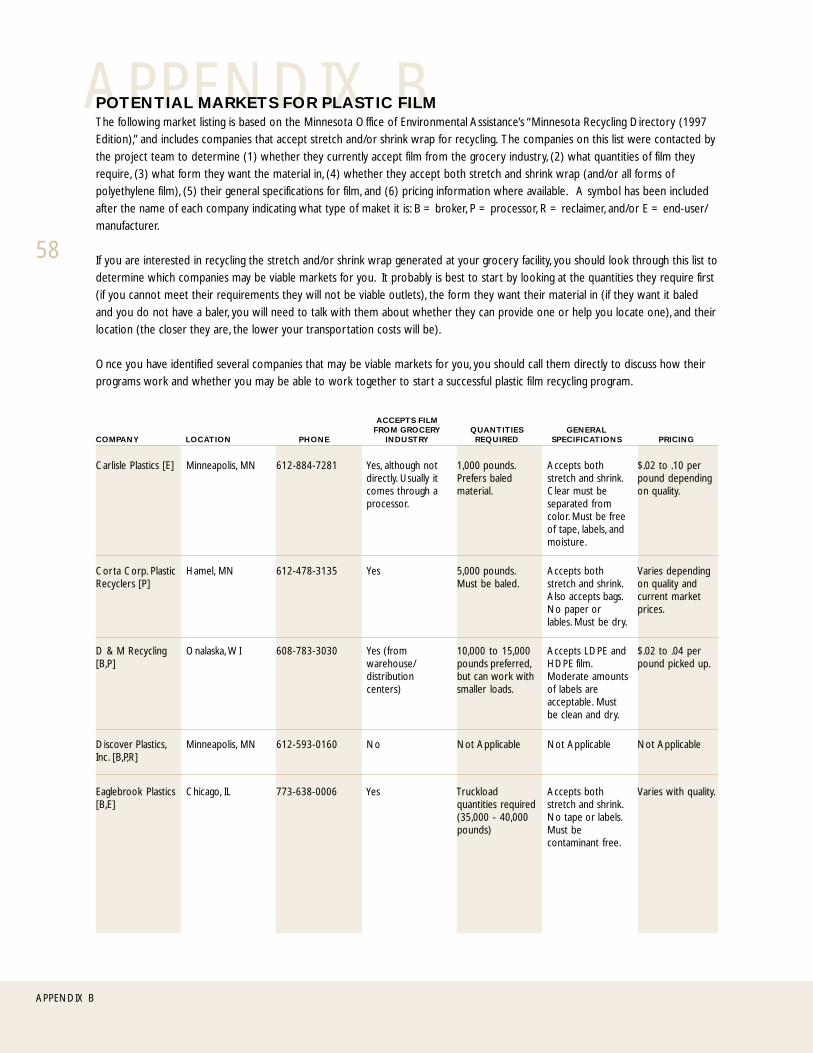
APPENDIX B
58
APPENDIX B
POTENTIAL MARKETS FOR PLASTIC FILMThe following market listing is based on the Minnesota Office of Environmental Assistance’s “Minnesota Recycling Directory (1997
Edition),” and includes companies that accept stretch and/or shrink wrap for recycling. The companies on this list were contacted by
the project team to determine (1) whether they currently accept film from the grocery industry, (2) what quantities of film they
require, (3) what form they want the material in, (4) whether they accept both stretch and shrink wrap (and/or all forms of
polyethylene film), (5) their general specifications for film, and (6) pricing information where available. A symbol has been included
after the name of each company indicating what type of maket it is: B = broker, P = processor, R = reclaimer, and/or E = end-user/
manufacturer.
If you are interested in recycling the stretch and/or shrink wrap generated at your grocery facility, you should look through this list to
determine which companies may be viable markets for you. It probably is best to start by looking at the quantities they require first
(if you cannot meet their requirements they will not be viable outlets), the form they want their material in (if they want it baled
and you do not have a baler, you will need to talk with them about whether they can provide one or help you locate one), and their
location (the closer they are, the lower your transportation costs will be).
Once you have identified several companies that may be viable markets for you, you should call them directly to discuss how their
programs work and whether you may be able to work together to start a successful plastic film recycling program.
ACCEPTS FILMFROM GROCERY QUANTITIES GENERAL
COMPANY LOCATION PHONE INDUSTRY REQUIRED SPECIFICATIONS PRICING
Carlisle Plastics [E] Minneapolis, MN 612-884-7281 Yes, although notdirectly. Usually itcomes through aprocessor.
1,000 pounds.Prefers baledmaterial.
Accepts bothstretch and shrink.Clear must beseparated fromcolor. Must be freeof tape, labels, andmoisture.
$.02 to .10 perpound dependingon quality.
Corta Corp. PlasticRecyclers [P]
Varies dependingon quality andcurrent marketprices.
Accepts bothstretch and shrink.Also accepts bags.No paper orlables. Must be dry.
5,000 pounds.Must be baled.
Yes612-478-3135Hamel, MN
$.02 to .04 perpound picked up.
D & M Recycling[B,P]
Onalaska, WI 608-783-3030 Yes (fromwarehouse/distributioncenters)
10,000 to 15,000pounds preferred,but can work withsmaller loads.
Accepts LDPE andHDPE film.Moderate amountsof labels areacceptable. Mustbe clean and dry.
Discover Plastics,Inc. [B,P,R]
Minneapolis, MN 612-593-0160 No Not Applicable Not Applicable Not Applicable
Varies with quality.Eaglebrook Plastics[B,E]
Chicago, IL 773-638-0006 Yes Truckloadquantities required(35,000 - 40,000pounds)
Accepts bothstretch and shrink.No tape or labels.Must becontaminant free.

TRANSPORT PACKAGING
59
APPENDIX B
Varies dependingon quality andquantity.
ACCEPTS FILMFROM GROCERY QUANTITIES GENERAL
COMPANY LOCATION PHONE INDUSTRY REQUIRED SPECIFICATIONS PRICING
Eco-Tech [B,P,E] McHenry, IL 815-363-8570 Yes If Eco-Tech paysthe freight, itrequires loads of20,000 pounds ormore. If supplierpays, there are nominimumrequirements. Mustbe baled.
Accepts bothstretch and shrink.Also accepts PEbags. Prefers clear.Must be dry.Labels and tapeare not a problemunless there is asignificant quantity.
Determined oncase-by-case basis.
Hammer’s PlasticRecycling [E]
Iowa Falls, IA 515-648-5073 Yes Prefers truckloadquantities. Must bebaled.
Accepts bothstretch and shrink.Must be clean anddry. Labels andtape areacceptable.
Determined oncase-by-case basis.
Lavico Polymers(USA) [B,P]
Ottawa, IL 814-433-1368 Yes Prefers truckloadquantities ifmaterial is fromout of state.
Accepts bothstretch and shrink,mixed orseparated. Must bedry. Lables andtape areacceptable.
Vaires with time,quality, andquantity.
Maine Plastics, Inc.[B,P]
Chicago, IL 847-473-3553 Yes If supplier paysfreight, nominimum. If Mainepays, 5,000 poundsare required. Mustbe baled.
Accepts bothstretch and shrink,but prefers that itbe spearated. Notape or labels. Alsoaccepts bags.
Monarch PlasticProcessing [P,E]
Little Falls, MN 320-632-3625 Yes No minimumquantities. Prefersloose (boxed orbagged).
Accepts bothstretch and shrink.No tape or paper.Must be dry.
Does not pay formaterial, but willaccept it ifdelivered.
National Recycling,Inc.
Wyoming, MN 612-462-5072 No Not Applicable Not Applicable Not Applicable
$.03 to .10 perpound dependingon quality.
Poly Film [P] Minneapolis, MN 612-721-4064 Yes No minimum. Ifpicked up, must bebaled. If delivered,can be loose orbaled.
Accepts bothstretch and shrink.Prefer no tape orlabels. Must be dry.
Varies with quality,quantity, and time.Will pay more forbaled material.Bags accepted butnot paid for.
Python’s, Inc. [B,P] St. Cloud, MN 320-253-3127 Yes No minimum.Prefers baledmaterial, but willaccept in boxes orbags.
Accepts bothstretch and shrink.Also accepts bags.Limited printingacceptable, nopaper or labels,must be clean.
Varies with timeand quality.
RecoveredMaterials Mngt. [B]
St. Paul, MN 612-891-8565 Yes Must be baled.Minimum of sixbales required inany one pick up.
Accepts bothstretch and shrink.Bags should bekept separate.

60
APPENDIX B
ACCEPTS FILMFROM GROCERY QUANTITIES GENERAL
COMPANY LOCATION PHONE INDUSTRY REQUIRED SPECIFICATIONS PRICING
Up to $.05 perpound dependingon quality.
Varies with timeand quality.
Schaaps Recycling[B,P]
Worthington, MN 507-376-3298 Yes No minimum.Accepts baled,loose, or boxed.
Accepts bothstretch and shrink.Clear only.Remove as muchpaper as possible.
$.00 to .06 perpound for baledmaterial delivered.Not paying forloose material.
SilvercrestRecycling, Inc. [P]
Des Moines, IA 515-266-7306 Yes No minimum.Prefers baled, butwill accept looseor boxed.
Accepts bothstretch and shrink.Clear only. Willaccept coloredbags.
$.00 to .05 perpound.
Strout Plastics [P,E] Lakeville, MN 612-469-1771 Yes No quantityrequirements. Anyform accepted(loose, baled,boxed, rolls).
Accepts LDPE &LLDPE film. Mustbe clear, dry, freeof labels.
Varies with timeand quality.
TS Investment Co.[B,P]
Eden Prairie, MN 612-432-4446 Yes Within 50 miles,accepts minimumloads of 5,000pounds. Within100 miles, accepts10,000 pounds.Beyond needs25,000 pounds.Prefers bales.
Accepts LDPE &LLDPE film, andsmall amounts ofHDPE film(primarily bags).Prefers clear. Mustbe free from otherplastics and non-film contaminants.
Tenneco Packaging[E]
Jacksonville, IL 217-479-1249 No Not Applicable Not Applicable Not Applicable
Straight stretchwrap = $.05/lb;straight grocerysacks = $.03/lb;mixed = $.04/lb
Trex Company,LCC [E]
Wichester, VA 800-742-1035 Yes Prefers and willpay freight for fulltruckloads. Willwork with smallerloads if needed.Material must bebaled.
Prefers stretch.(Will considershrink on case-by-case basis.) Goodfaith effort toeliminatecontamination.
Depends onquality andquantity.
Up North Plastics[P,E]
Cottage Grove,MN
800-527-3322 Yes Within 200 miles,10,000 poundsrequired. 25,000pounds requiredotherwise. Acceptsloose, baled, androlls.
Buys all forms ofPE clear film. Nodirt, rocks, otherplastics, metal,food, moisture, orpaper.
VIM Recyclers, LP[B]
Glen Ellyn, IL 630-858-5180 Yes Material must bebaled. Nominimumquantities if VIMprovides baler.Requires fulltruckloadsotherwise.
Accepts bothstretch and shrink.No otherspecifications.
APPENDIX B
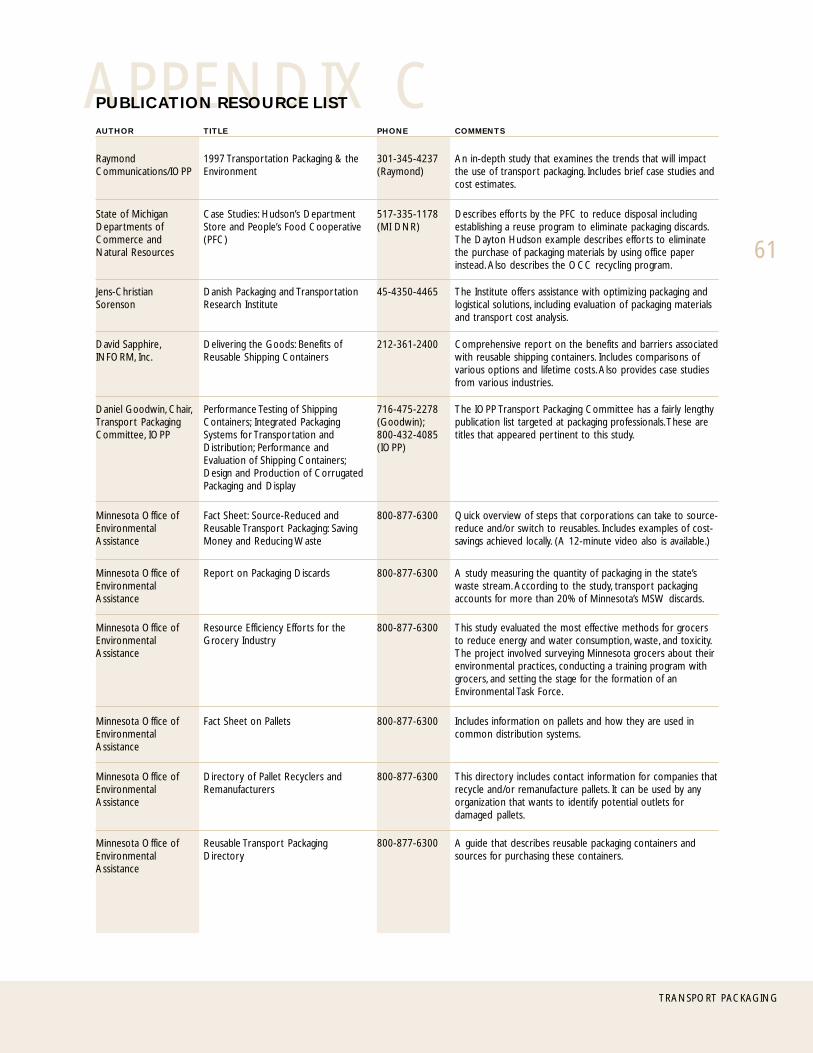
TRANSPORT PACKAGING
61
APPENDIX CPUBLICATION RESOURCE LIST
AUTHOR TITLE PHONE COMMENTS
Describes efforts by the PFC to reduce disposal includingestablishing a reuse program to eliminate packaging discards.The Dayton Hudson example describes efforts to eliminatethe purchase of packaging materials by using office paperinstead. Also describes the OCC recycling program.
RaymondCommunications/IOPP
1997 Transportation Packaging & theEnvironment
301-345-4237(Raymond)
An in-depth study that examines the trends that will impactthe use of transport packaging. Includes brief case studies andcost estimates.
State of MichiganDepartments ofCommerce andNatural Resources
Case Studies: Hudson’s DepartmentStore and People’s Food Cooperative(PFC)
517-335-1178(MI DNR)
The Institute offers assistance with optimizing packaging andlogistical solutions, including evaluation of packaging materialsand transport cost analysis.
Jens-ChristianSorenson
Danish Packaging and TransportationResearch Institute
45-4350-4465
Comprehensive report on the benefits and barriers associatedwith reusable shipping containers. Includes comparisons ofvarious options and lifetime costs. Also provides case studiesfrom various industries.
David Sapphire,INFORM, Inc.
Delivering the Goods: Benefits ofReusable Shipping Containers
212-361-2400
The IOPP Transport Packaging Committee has a fairly lengthypublication list targeted at packaging professionals. These aretitles that appeared pertinent to this study.
Daniel Goodwin, Chair,Transport PackagingCommittee, IOPP
Performance Testing of ShippingContainers; Integrated PackagingSystems for Transportation andDistribution; Performance andEvaluation of Shipping Containers;Design and Production of CorrugatedPackaging and Display
716-475-2278(Goodwin);800-432-4085(IOPP)
Quick overview of steps that corporations can take to source-reduce and/or switch to reusables. Includes examples of cost-savings achieved locally. (A 12-minute video also is available.)
Minnesota Office ofEnvironmentalAssistance
Fact Sheet: Source-Reduced andReusable Transport Packaging: SavingMoney and Reducing Waste
800-877-6300
A study measuring the quantity of packaging in the state’swaste stream. According to the study, transport packagingaccounts for more than 20% of Minnesota’s MSW discards.
Minnesota Office ofEnvironmentalAssistance
Report on Packaging Discards 800-877-6300
This study evaluated the most effective methods for grocersto reduce energy and water consumption, waste, and toxicity.The project involved surveying Minnesota grocers about theirenvironmental practices, conducting a training program withgrocers, and setting the stage for the formation of anEnvironmental Task Force.
Minnesota Office ofEnvironmentalAssistance
Resource Efficiency Efforts for theGrocery Industry
800-877-6300
Includes information on pallets and how they are used incommon distribution systems.
Minnesota Office ofEnvironmentalAssistance
Fact Sheet on Pallets 800-877-6300
This directory includes contact information for companies thatrecycle and/or remanufacture pallets. It can be used by anyorganization that wants to identify potential outlets fordamaged pallets.
Minnesota Office ofEnvironmentalAssistance
Directory of Pallet Recyclers andRemanufacturers
800-877-6300
A guide that describes reusable packaging containers andsources for purchasing these containers.
Minnesota Office ofEnvironmentalAssistance
Reusable Transport PackagingDirectory
800-877-6300
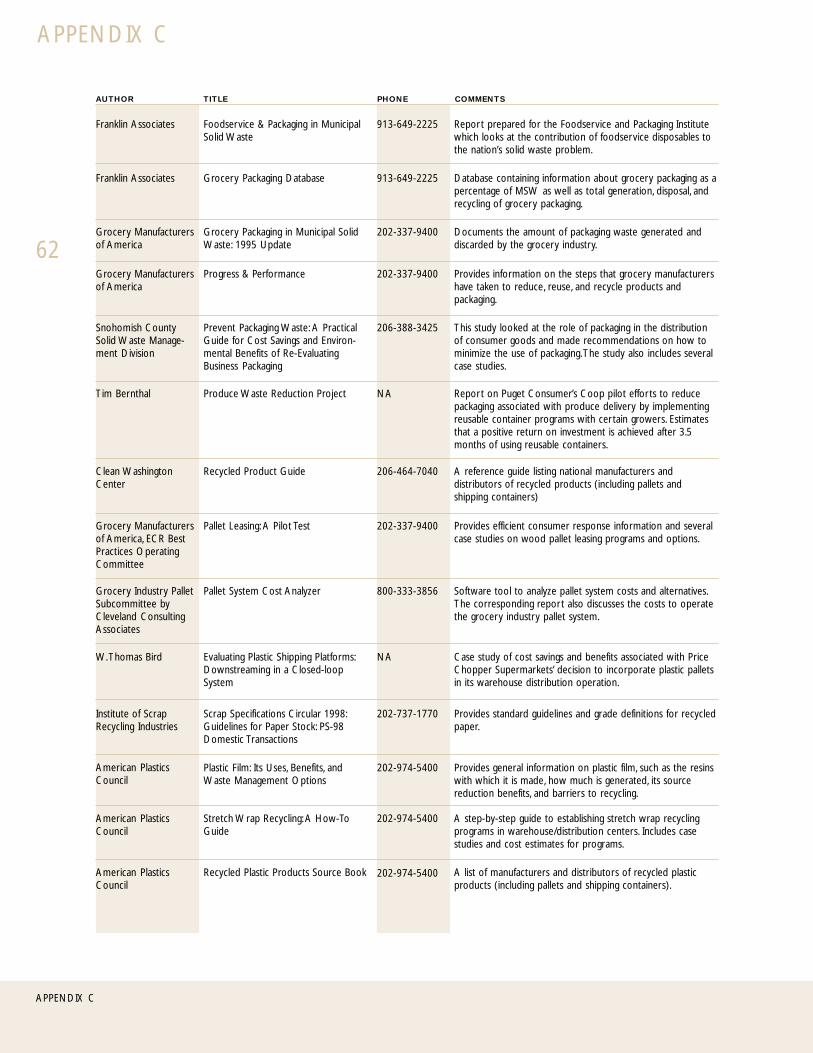
62
APPENDIX C
APPENDIX C
AUTHOR TITLE PHONE COMMENTS
Report prepared for the Foodservice and Packaging Institutewhich looks at the contribution of foodservice disposables tothe nation’s solid waste problem.
Franklin Associates Foodservice & Packaging in MunicipalSolid Waste
913-649-2225
Database containing information about grocery packaging as apercentage of MSW as well as total generation, disposal, andrecycling of grocery packaging.
Franklin Associates Grocery Packaging Database 913-649-2225
Documents the amount of packaging waste generated anddiscarded by the grocery industry.
Grocery Manufacturersof America
Grocery Packaging in Municipal SolidWaste: 1995 Update
202-337-9400
Provides information on the steps that grocery manufacturershave taken to reduce, reuse, and recycle products andpackaging.
Grocery Manufacturersof America
Progress & Performance 202-337-9400
This study looked at the role of packaging in the distributionof consumer goods and made recommendations on how tominimize the use of packaging. The study also includes severalcase studies.
Snohomish CountySolid Waste Manage-ment Division
Prevent Packaging Waste: A PracticalGuide for Cost Savings and Environ-mental Benefits of Re-EvaluatingBusiness Packaging
206-388-3425
Report on Puget Consumer’s Coop pilot efforts to reducepackaging associated with produce delivery by implementingreusable container programs with certain growers. Estimatesthat a positive return on investment is achieved after 3.5months of using reusable containers.
Tim Bernthal Produce Waste Reduction Project NA
A reference guide listing national manufacturers anddistributors of recycled products (including pallets andshipping containers)
Clean WashingtonCenter
Recycled Product Guide 206-464-7040
Provides efficient consumer response information and severalcase studies on wood pallet leasing programs and options.
Grocery Manufacturersof America, ECR BestPractices OperatingCommittee
Pallet Leasing: A Pilot Test 202-337-9400
Software tool to analyze pallet system costs and alternatives.The corresponding report also discusses the costs to operatethe grocery industry pallet system.
Grocery Industry PalletSubcommittee byCleveland ConsultingAssociates
Pallet System Cost Analyzer 800-333-3856
Case study of cost savings and benefits associated with PriceChopper Supermarkets’ decision to incorporate plastic palletsin its warehouse distribution operation.
W. Thomas Bird Evaluating Plastic Shipping Platforms:Downstreaming in a Closed-loopSystem
NA
Provides standard guidelines and grade definitions for recycledpaper.
Institute of ScrapRecycling Industries
Scrap Specifications Circular 1998:Guidelines for Paper Stock: PS-98Domestic Transactions
202-737-1770
Provides general information on plastic film, such as the resinswith which it is made, how much is generated, its sourcereduction benefits, and barriers to recycling.
American PlasticsCouncil
Plastic Film: Its Uses, Benefits, andWaste Management Options
202-974-5400
A step-by-step guide to establishing stretch wrap recyclingprograms in warehouse/distribution centers. Includes casestudies and cost estimates for programs.
American PlasticsCouncil
Stretch Wrap Recycling: A How-ToGuide
202-974-5400
A list of manufacturers and distributors of recycled plasticproducts (including pallets and shipping containers).
American PlasticsCouncil
Recycled Plastic Products Source Book 202-974-5400
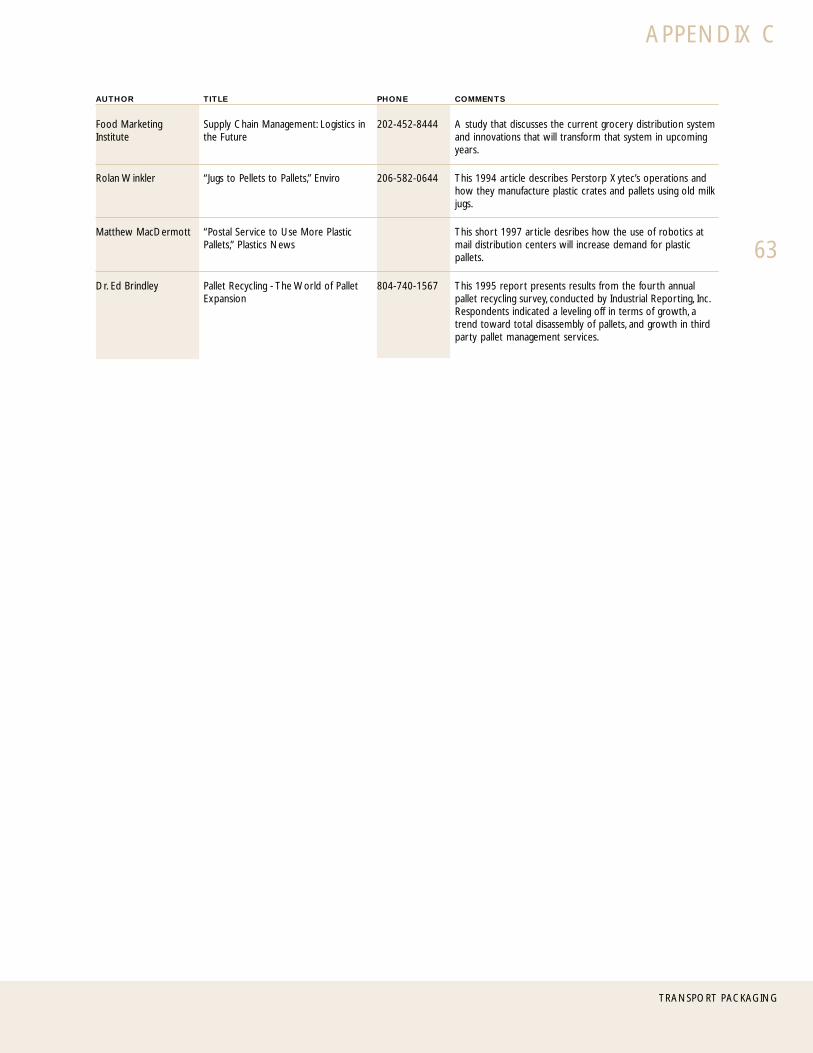
TRANSPORT PACKAGING
63This 1995 report presents results from the fourth annualpallet recycling survey, conducted by Industrial Reporting, Inc.Respondents indicated a leveling off in terms of growth, atrend toward total disassembly of pallets, and growth in thirdparty pallet management services.
APPENDIX C
AUTHOR TITLE PHONE COMMENTS
Food MarketingInstitute
Supply Chain Management: Logistics inthe Future
202-452-8444 A study that discusses the current grocery distribution systemand innovations that will transform that system in upcomingyears.
Rolan Winkler “Jugs to Pellets to Pallets,” Enviro 206-582-0644 This 1994 article describes Perstorp Xytec’s operations andhow they manufacture plastic crates and pallets using old milkjugs.
Matthew MacDermott “Postal Service to Use More PlasticPallets,” Plastics News
This short 1997 article desribes how the use of robotics atmail distribution centers will increase demand for plasticpallets.
Dr. Ed Brindley Pallet Recycling - The World of PalletExpansion
804-740-1567
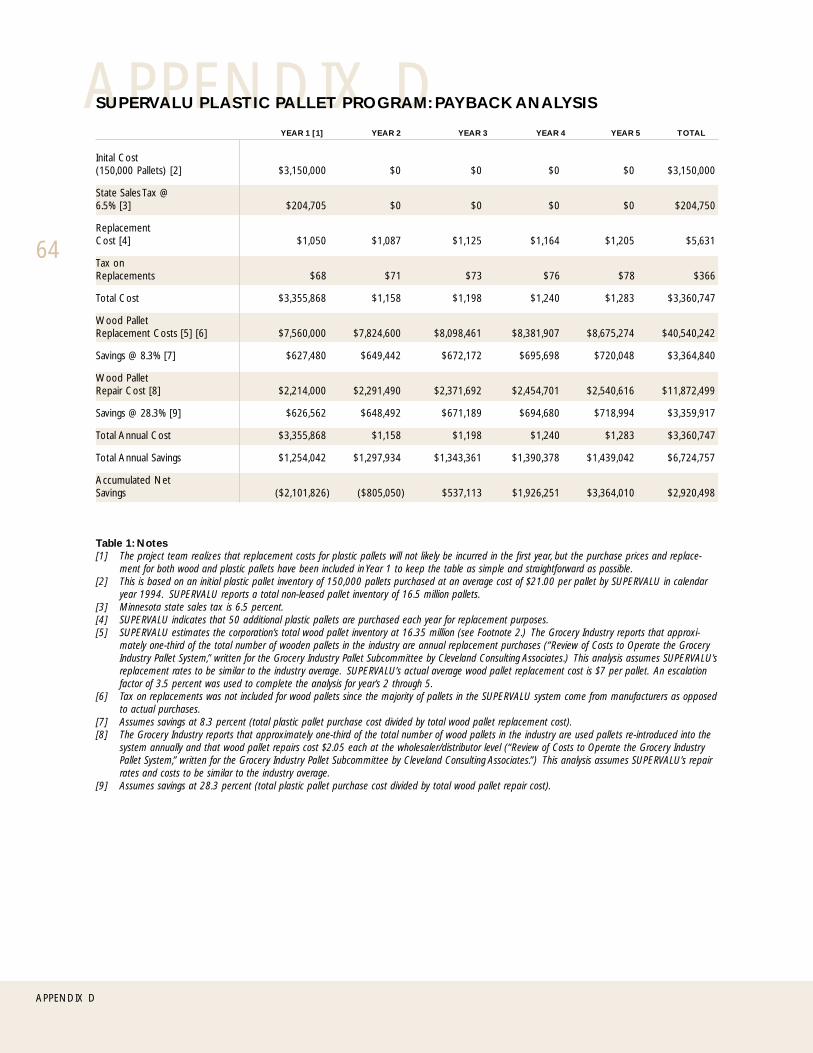
APPENDIX D
64
APPENDIX D
SUPERVALU PLASTIC PALLET PROGRAM: PAYBACK ANALYSIS
YEAR 1 [1] YEAR 2 YEAR 3 YEAR 4 YEAR 5 TOTAL
Inital Cost(150,000 Pallets) [2] $3,150,000 $0 $0 $0 $0 $3,150,000
State Sales Tax @6.5% [3] $204,705 $0 $0 $0 $0 $204,750
ReplacementCost [4] $1,050 $1,087 $1,125 $1,164 $1,205 $5,631
Tax onReplacements $68 $71 $73 $76 $78 $366
Total Cost $3,355,868 $1,158 $1,198 $1,240 $1,283 $3,360,747
Wood PalletReplacement Costs [5] [6] $7,560,000 $7,824,600 $8,098,461 $8,381,907 $8,675,274 $40,540,242
Savings @ 8.3% [7] $627,480 $649,442 $672,172 $695,698 $720,048 $3,364,840
Wood PalletRepair Cost [8] $2,214,000 $2,291,490 $2,371,692 $2,454,701 $2,540,616 $11,872,499
Savings @ 28.3% [9] $626,562 $648,492 $671,189 $694,680 $718,994 $3,359,917
Total Annual Cost $3,355,868 $1,158 $1,198 $1,240 $1,283 $3,360,747
Total Annual Savings $1,254,042 $1,297,934 $1,343,361 $1,390,378 $1,439,042 $6,724,757
Accumulated NetSavings ($2,101,826) ($805,050) $537,113 $1,926,251 $3,364,010 $2,920,498
Table 1: Notes[1] The project team realizes that replacement costs for plastic pallets will not likely be incurred in the first year, but the purchase prices and replace-
ment for both wood and plastic pallets have been included in Year 1 to keep the table as simple and straightforward as possible.[2] This is based on an initial plastic pallet inventory of 150,000 pallets purchased at an average cost of $21.00 per pallet by SUPERVALU in calendar
year 1994. SUPERVALU reports a total non-leased pallet inventory of 16.5 million pallets.[3] Minnesota state sales tax is 6.5 percent.[4] SUPERVALU indicates that 50 additional plastic pallets are purchased each year for replacement purposes.[5] SUPERVALU estimates the corporation’s total wood pallet inventory at 16.35 million (see Footnote 2.) The Grocery Industry reports that approxi-
mately one-third of the total number of wooden pallets in the industry are annual replacement purchases (“Review of Costs to Operate the GroceryIndustry Pallet System,” written for the Grocery Industry Pallet Subcommittee by Cleveland Consulting Associates.) This analysis assumes SUPERVALU’sreplacement rates to be similar to the industry average. SUPERVALU’s actual average wood pallet replacement cost is $7 per pallet. An escalationfactor of 3.5 percent was used to complete the analysis for year’s 2 through 5.
[6] Tax on replacements was not included for wood pallets since the majority of pallets in the SUPERVALU system come from manufacturers as opposedto actual purchases.
[7] Assumes savings at 8.3 percent (total plastic pallet purchase cost divided by total wood pallet replacement cost).[8] The Grocery Industry reports that approximately one-third of the total number of wood pallets in the industry are used pallets re-introduced into the
system annually and that wood pallet repairs cost $2.05 each at the wholesaler/distributor level (“Review of Costs to Operate the Grocery IndustryPallet System,” written for the Grocery Industry Pallet Subcommittee by Cleveland Consulting Associates.”) This analysis assumes SUPERVALU’s repairrates and costs to be similar to the industry average.
[9] Assumes savings at 28.3 percent (total plastic pallet purchase cost divided by total wood pallet repair cost).