travel times in the great lakes connecting channels · the great lakes connecting channels are used...
TRANSCRIPT

u.s. DEPARTMENT OF COMMERCE
National Oceanic and Atmospheric Administration
Environmental Research Laboratories
•
TRAVEL TIMES IN THE GREAT LAKES CONNECTING CHANNELS·
by
Jan A. Derecki
*GLERL Contribution No. 370.
Open File Report
Great Lakes Environmental Research Laboratory2300 Washtenaw Avenue
Ann Arbor, Michigan 48104
June 1983
" I

CONTENTS
1• INTRODUCTION
2• TRAVEL TIME TABLES
3. REFERENCES
Appendix--MEMO FROM J. RODSTEIN
FIGURES
1. St. Clair River travel time sections.
2. Detroit River travel time sections.
3. Upper St. Lawrence River travel time sections.
TABLES
1. St. Clair River flow time in hours.
2. Detroit River flow time in hours.
3. Upper St. Lawrence River time-of-travel in hours.
iii
Page
1
1
6
11
4
5
10
2
3
7

1. INTRODUCTION
The Great Lakes connecting channels are used extensively for navigation,and a large number of industrial concerns and municipalities are locatedthere, as well. Thus, there is a risk of oil and other spills in these channels. Because of concern about this risk, in January 1982 the Director of theGreat Lakes Environmental Research Laboratory (GLERL) requested that traveltime tables be prepared for the St. Clair and Detroit Rivers in support ofGLERL staff on the Joint Regional Response Team. The travel time tables forthese two rivers were prepared the following month. These tables, classifiedas preliminary, indicate travel times for the normal flows. In March 1982 therequest was broadened to include all five connecting channels of the GreatLakes and other connected waterways, namely, the Illinois River complex(Illinois Waterway). A survey of the available information on travel timesindicated there is adequate information at various agencies (U.S. Army Corpsof Engineers, U.S. Coast Guard, and Illinois State Water Survey) for the St.Marys, St. Clair, Detroit, and Niagara Rivers and for the lower IllinoisWaterway (the Illinois River proper below the confluence of the Des Plainesand Kankakee Rivers). There is inadequate information on travel times for theSt. Lawrence River and the upper Illinois Waterway (consisting of the DesPlaines River, the Chicago Sanitary and Ship Canal, and the Calumet SagChannel). The survey also showed that the preliminary travel time table forthe St. Clair River is sufficiently accurate for operational use, while theaccuracy of a similar table for the Detroit River is questionable and shouldbe reevaluated.
2. TRAVEL TIME TABLES
The initial travel time tables for the St. Clair and Detroit Rivers weredeveloped for the mean flow conditions; available velocity data at approxima-
, tely 20 locations along the St. Clair River and 15 locations along the DetroitRiver were used. Since the initial table for the Detroit River was found tobe insufficiently accurate for operational applications, the travel times forthis river were reevaluated. This time more detailed velocity informationavailable from the Corps of Engineers (about 25 locations) was used, so theGLERL information for both of these rivers is sufficiently accurate for operational use. The final travel times determined for the St. Clair and DetroitRivers are listed in tables 1 and 2, respectively. The river locations usedin computing travel times for the two tables are shown in figures 1 and 2,respectively.
Derivation of additional travel time tables was limited to rivers forwhich such information was not available from other agencies, namely, the St.Lawrence River and the upper Illinois Waterway. Because these rivers represent completely regulated complex hydraulic systems with large short-termfluctuations in flows, travel time tables developed for these rivers indicatethe low and high flow conditions in addition to the mean or normal flows. TheGLERL St. Lawrence River one-dimensional dynamic flow model (Potok, 1978) wasmodified to provide detailed velocity information along the international section of the river for the preparation of travel time tables for the three flowconditions. Velocity measurements available for a limited number of locations
1

TABLE 1.--St. Clai~ Rive~ f!ow time in hou~8--mean f!ow
0 2 3 4 5 6 7 8 9 10 11 12 13 14 15 16 17 18 19
1. Blue Water Bridge 0.12. Ft. Gratiot Range 0.3 0.13. Black River 1.0 0.9 0.74. Grand Trunk Tunnel 1.5 1.4 1.2 0.55. Detroit Edison 2.7 2.6 2.4 1.7 1.26. Head, Stag Is. 3.2 3.1 2.9 2.2 1.7 0.57. Middle, Stag Is. 3.7 3.6 3.5 2.8 2.3 1.1 0.58. Stag Is. Shoal Lt. 4.5 4.4 4.3 3.6 3.1 1.9 1.3 0.89. Bench Mark 645 5.5 5.3 5.2 4.4 4.0 2.8 2.3 1.7 0.9
N 10. St. Clair City 6.1 6.0 5.9 5.1 4.6 3.4 2.9 2.4 1.6 0.611. Harts Landing 7.4 7.2 7.1 6.4 5.9 4.7 4.2 3.6 2.8 1.9 1.312. Bowens Creek 7.7 7.6 7.5 6.7 6.2 5.0 4.5 4.0 3.2 2.3 1.6 0.413. Clay Creek 8.4 8.3 8.1 7.4 6.9 5.7 5.2 4.6 3.9 2.9 2.3 1.0 0.714. Marine City 10.0 9.8 9.7 9.0 8.5 7.3 6.8 6.2 5.4 4.5 3.9 2.6 2.2 1.615. W. Fawn Is. 10.5 10.5 10.3 9.6 9.0 7.9 7.3 6.8 6.0 5.1 4.4 3.2 2.8 2.2 0.616. Salt Dock Lt. 11.1 11.0 10.8 10.1 9.6 8.4 7.9 7.3 6.5 5.6 5.0 3.7 3.4 2.7 1.1 0.517. Roberts Landing 12.1 12.0 11.9 11.1 10.6 9.4 8.9 8.4 7.6 6.6 6.0 4.8 4.4 3.7 2.2 1.6 1.018. Algonac Lt. 118 12.7 12.6 12.4 11.7 11.2 10.0 9.5 8.9 8.1 7.2 6.6 5.3 5.0 4.3 2.7 2.1 1.6 0.619. S.E. Bend Lt. 18.1 17.9 17.8 17.1 16.6 15.4 14.9 14.3 13.5 12.6 12.0 10.7 10.4 9.7 8.1 7.5 7.0 6.0 5.420. Lake st. Clair 21.2 21.1 20.9 20.2 19.7 18.5 18.0 17.4 16.7 15.7 15.1 13.8 13.5 12.8 11.2 10.6 10.1 9.1 8.5 3.1
Key: 0) Ft. Gratiot Lt., 1) Blue Water Bridge, 2) Ft. Gratiot Range, 3) Black River, 4) Grand Trunk Tunnel, 5) Detroit Edison, 6) Head, StagIs., 7) Middle, Stag Is., 8) Stag Is. Shoal Lt., 9) Bench Mark 145, 10) St. Clair City, II) Harts Landing, 12) Bowens Creek, 13) ClayCreek, 14) Marine City, 15) W. Fawn Is., 16) Salt Dock Lt., 17) Roberts Landing, 18) Algonac Lt. 118, 19) S.E. Bend Lt.

TABLE 2.--Det~oit Rive~ flo~ time in hou~8--mean flo~
0 2 3 4 5 6 7 8 9 10 11 12 1.3
1. Head, Belle Isle 1.1
2. Foot, Belle IsleA. Main Ch. 3.5 2.4B. West Ch. 4.3* 3.2*
3. Auto Tunnel 4.9 3.8 1.4
4. Ambassador Bridge 6.3 5.2 2.8 1.4
5. Ft. Wayne 1.3 6.2 3.8 2.4 1.0
6. Rouge River 8.4 7.3 4.9 3.5 2.1 1.1
1. Foot, Anchorage Area 9.6 8.5 6.1 4.1 3.3 2.3 1.2
8. Head, Trenton Ch. 10.4 9.3 6.9 5.5 4.1 3.1 2.0 0.8
9. Foot, Grassy Is.A. Main Ch. 11.6 10.5 8.1 6.1 5.3 4.3 3.2 2.0 1.2B. Trenton Ch. 12.1 11.0 8.6 1.2 5.8 4.8 3.1 2.5 1.1
10. pt. HennepinA. Main Ch. 12.5 11.4 9.0 7.6 6.2 5.2 4.1 2.9 2.1 0.9B. Trenton Ch. 13.1 12.0 9.6 8.2 6.8 5.8 4.1 3.5 2.1 1.0
11. Fighting Is. Shoal Lt.A. Main Ch. 14.3 13.2 10.8 9.4 8.0 1.0 5.9 4.1 3.9 2.1 1.8B. Trenton Ch.
(Upper Br Idge) 14.8 13.1 11.3 9.9 8.5 1.5 6.4 5.2 4.4 2.1 1.1
12. Head, Livingstone Ch.A. Main Ch. 16.5 15.4 13.0 11.6 10.2 9.2 8.1 6.9 6.1 4.9 4.0 2.2B. Trenton Ch.
(Lower Bridge) 17.6 16.5 14.1 12.1 11.3 10.3 9.2 8.0 1.2 5.5 4.5 2.8
13. Head, Bois Blanc Is.A. Amherstburg Ch. 17.6 16.5 14.1 12.1 11.3 10.3 9.2 8.0 1.2 6.0 5.1 3.3 1.1B. Livingstone Ch. 17.5 16.4 14.0 12.6 11.2 10.2 9.1 1.9 7.1 5.9 5.0 3.2 1.0C. Trenton Ch.
(Head, Calf Is.) 18.8 17.1 15.3 13.9 12.5 11.5 10.4 9.2 8.4 6.1 5.1 4.0 1.2
14. lake ErieA. Amherstburg Ch. 19.3 18.2 15.8 14.4 13.0 12.0 10.9 9.1 8.9 7.1 6.8 5.0 2.8 1.7
B. LI vIngstone Ch. 19.1 18.0 15.6 14.2 12.8 11.8 10.1 9.5 8.7 7.5 6.6 4.8 2.6 1.6
C. Trenton Ch.(Foot, Caleron Is.) 20.9 19.8 11.4 16.0 14.6 13.6 12.5 11.3 10.5 8.8 7.8 6.1 3.3 2.1
*Note: For spills occurring In the chennal west of Bella Isle, add 0.8 h to downstream travel times.
Key: 0) Windmill Pt., 1) Head, Belle Isle, 2) Foot, Belle Isle, 3) Auto Tunnel, 4) Ambassador Bridge,S) Ft.Wayne, 6) Rouge River, 1) Foot, Anchorage Area, 8) Head, Trenton Ch., 9) Foot, Grassy Is., 10) Pt.Hennepin, II) FIghting Is. Shoal Lt., 12) Head, Livingstone Ch., 13) Head, Bois Blanc Is.
3

:...,-.:;~~::::=JI---J_=====--
ST. CLAIR RIVER
!It
J
-
u
,..,..........
:F,;-'fiw+..L.;e--
7~""""'-8
o
-
o
FIGURE l.--St. CLai~ Rive~ ~veZ time seotions.
4
..

a.lI.
2
DETROIT RIVER
.Clt••t MUait
• • •-.:-.,-.".__ ..-------_•..--~~
E II I E
FIGURE 2.--De~oit Rive~ ~ve time seetions.
5
NT '.'LAIII
.M.
on the St. Lawrence River were used to verify computed velocities to ensurecorrect travel times for listed flow conditions. The travel times determinedfor the low, mean, and high flow conditions of the upper St. Lawrence Riverare listed in tables 3a-3c, respectively, and the locations of the river sections used in the computations are shown in figure 3.
Preparation of travel time tables for the upper Illinois Waterway wasstarted, but was subsequently found to be unnecessary and so was terminated.(See memo from J. Rodstein, dated April 25, 1983, in appendix.) A techniquewas developed for computing velocities in the lower Des Plaines River and theChicago Sanitary and Ship Canal and Calumet Sag Channel, constituting thelower portion and upper branches of the upper Illinois Waterway. This technique includes an extension of the river slope method developed for theIllinois River proper by the Illinois State Water Survey (Stall and Hiestand,1969) and velocity approximations based on estimated flows and derived crosssectional areas. To be of practial value, these velocity estimates needverification; thus limited velocity measurements in the upper IllinoisWaterway were scheduled for summer 1983. Portable current meters for this andsimilar work were ordered in 1982 and tested extensively during spring 1983 bythe GLERL marine instrumentation laboratory. However, as indicated in theattached memo, the required information is presently available from otheragencies. Consequently, development of travel time tables for the upperIllinois Waterway has been cancelled and the study terminated.
3. REFERENCES
Potok, A. J. (1978): Upper St. Lawrence River hydraulic transient model, NOAATech. memo. ERL GLERL-24, National Technical Information Service,Springfield, Va. 22151. 101 pp.
Stall, J. B., and Hiestand, D. W. (1969): Provisional time-of-travel forIllinois streams, Report of Investigation 63, Illinois State WaterSurvey, Urbana, Ill. XX pp.
6

TABLE 3a.--Uppep St. La~penoe Rivep time-of-tPavel in houps,loU} flo~ (188 tofs)
65.4 53.0 27.5141.7 96.9 70.0
o
1. Midpoint, Wolfe Is.a. Head, Carleton Is. 12.4b. The Spectacles Is. 44.8
2. Lower Wol fe Is.a. Murray Bay (Meln Ch.) 37.9 25.5b. Holiday pt. (North Ch.)71.7 26.9
3. Head, Grindstone Is.a. Main Ch.b. North Ch.
2 3 4 5 6 7 8 9 10 11 12 13
4. Foot, Grindstone Is.8. Main Ch.b. North Ch.
5. Head, Grenadier Is.a. American Narrowsb. Raft Narrows
6. Ch Ippewa Pt.
7. Brockvllle, Ont.
8. Ogdensburg, N.Y.
9. Cardinal, Ontoa. Main Ch.b. South Ch.
83.2 70.8 45.3 17.8164.3 119.5 92.6 22.6
117.0 104.6 79.1 51.6 33.8196.5 151.7 124.8 54.8 32.2*
134.3 121.9 96.4 68.9 51.1 17.3
149.2 136.8 111.3 83.8 66.0 32.2 14.9
167.8 155.4 129.9 102.4 84.6 50.8 33.5 18.6
174.0 161.6 136.1 108.6 90.8 57.0 39.7 24.8 6.2176.7 164.3 138.8 111.3 93.5 59.7 42.4 27.5 8.9*
203.5 191.1 165.6 138.1 120.3 86.5 69.2 54.3 35.7 29.5 20.2 12.0206.1 193.7 168.2 140.7 122.9 89.1 71.8 56.9 38.3 32.1 22.8 14.6
191.5 179.1 153.6 126.1 108.3 74.5 57.2 42.3 23.7 17.5 8.2
198.3 185.9 160.4 132.9 115.1 81.3 64.0 49.1 30.5 24.3 15.0 6.8
10. Morrlsburg, Ontoa. Main Ch.b. LIttle River
11. Bradford Is.
12. Head, Croll Is.
13. Head, Long Sault Is.a. Main Ch.b. North Ch.
183.3 170.9 145.4 117.9 100.1 66.3 49.0 34.1184.3 171.9 146.4 118.9 101.1 67.3 50.0 35.1
15.5 9.316.5 10.3*
5.27.8*
14. Midpoint, Barnhart Is. 216.2 203.8 178.3 150.8 133.0 99.2 81.9 67.0 48.4 42.2 32.9 24.7 17.9 12.7
*For spills occurring In the fol lowing mInor channels, add the correspondIng value to downstream travel times-Raft Narrows: 79.5 h., Channel South of Galop Is.: 2.7 h., Little River (Ogden Is.): 1.0 h, Channel North ofCroll Is.: 2.6 hrs.
Key: 0) Lake Ontario (Kingston/Cape VIncent), 1) MidpoInt, Wolfe Is., 2) Lower Wolfe Is., 3) Head, Grindstone Is.,4) Foot, Grindstone Is., 5) Head, Grenadier Is., 6) Chippewa pt., 7) Brockvllle, Ont., 8) Ogdensburg, N.Y.,9) CardInal, Ont., 10) Morrlsburg, Ont., 11) Bradford Is., 12) Head, Croll Is., 13) Head, Long Sault Is.
7

TABLE 3b.--Uppe1" St. La:b]7"ene8 Rive1" time-of-tmveZ in hou1"s,mean fZo'W (254 tofs)
o
1. Midpoint, Wolfe Is.a. Head, Carleton Is. 9.4b. The Spectacles Is. 33.6
2. Lower Wo Ife Is.a. Murray Bay (MaIn Ch.) 28.9 19.5b. Holiday Pt. (North Ch.) 53.8 20.2
2 3 4 5 6 7 8 9 10 11 12 13
3. Head, Grindstone Is.a. MaIn Ch.b. North Ch.
4. Foot, Grindstone Is.a. MaIn Ch.b. North Ch.
5. Head, GrenadIer Is.a. AmerIcan Narrowsb. Ra ft Narrows
6. Chippewa Pt.
7. Brockvllle, Onto
8. Ogdensburg, N.Y.
9. CardInal, Ontoa. MaIn Ch.b. South Ch.
10. Morrlsburg, Ont.a. Main Ch.b. LIttle RIver
11. Bradford Is.
12. Head, Crol I Is.
13. Head, Long Sault Is.a. Main Ch.b. North Ch.
14. MidpoInt, Barnhart Is.
49.8 40.4 20.9106.6 73.0 52.8
63.5 54.1 34.6 13.7123.8 90.2 70.0 17.2
89.2 79.8 60.3 39.4 25.7148.0 114.4 94.2 41.4 24.2*
102.4 93.0 73.5 52.6 38.9 13.2
113.8 104.4 84.9 64.0 50.3 24.6 11.4
127.9 118.5 99.0 78.1 64.4 38.7 25.5 14.1
132.6 123.2 103.7 82.8 69.1 43.4 30.2 18.8134.6 125.2 105.7 84.8 71.1 45.4 32.2 20.8
139.5 130.1 110.6 89.1 76.0 50.3 37.1 25.7 11.6 6.9140.2 130.8 111.3 90.4 76.7 51.0 37.8 26.4 12.3 1.6*
145.5 136.1 116.6 95.7 82.0 56.3 43.1 31.7 17.6 12.9 6.0
150.5 141.1 121.6 100.7 81.0 61.3 48.1 36.7 22.6 17.9 11.0 5.0
154.3 144.9 125.4 104.5 90.8 65.1 51.9 40.5 26.4 21.7 14.8 8.8156.2 146.8 127.3 106.4 92.1 61.0 53.8 42.4 28.3 23.6 16.1 10.1
163.6 154.2 134.1 113.8 100.1 14.4 61.2 49.8 35.7 31.0 24.1 18.1 13.1 9.3
*For spIlls occurrIng In the following minor channels, add the correspondIng value to downstream travel tImes--Raft Narrows: 58.8 h, Channel South of Galop Island: 2.0 h, little River (Ogden Is.): 0.7 h, Channel North ofCroll Is.: 1.9 hrs.
Key: 0) Lake Ontario (Kingston/Cape Vincent), 1) Midpoint, Wolfe Is., 2) Lower Wolfe Is., 3) Head, Grindstone Is.,4) Foot, Grindstone Is., 5) Head, Grenadier Is., 6) Chippewa pt., 7) Brockvllle, Ont., 8) Ogdensburg, N.Y.,9) CardInal, Ont., 10) Morrlsburg, Ont., 11) Bradford Is., 12) Head, Croll Is., 13) Head, Long Sault Is.
8
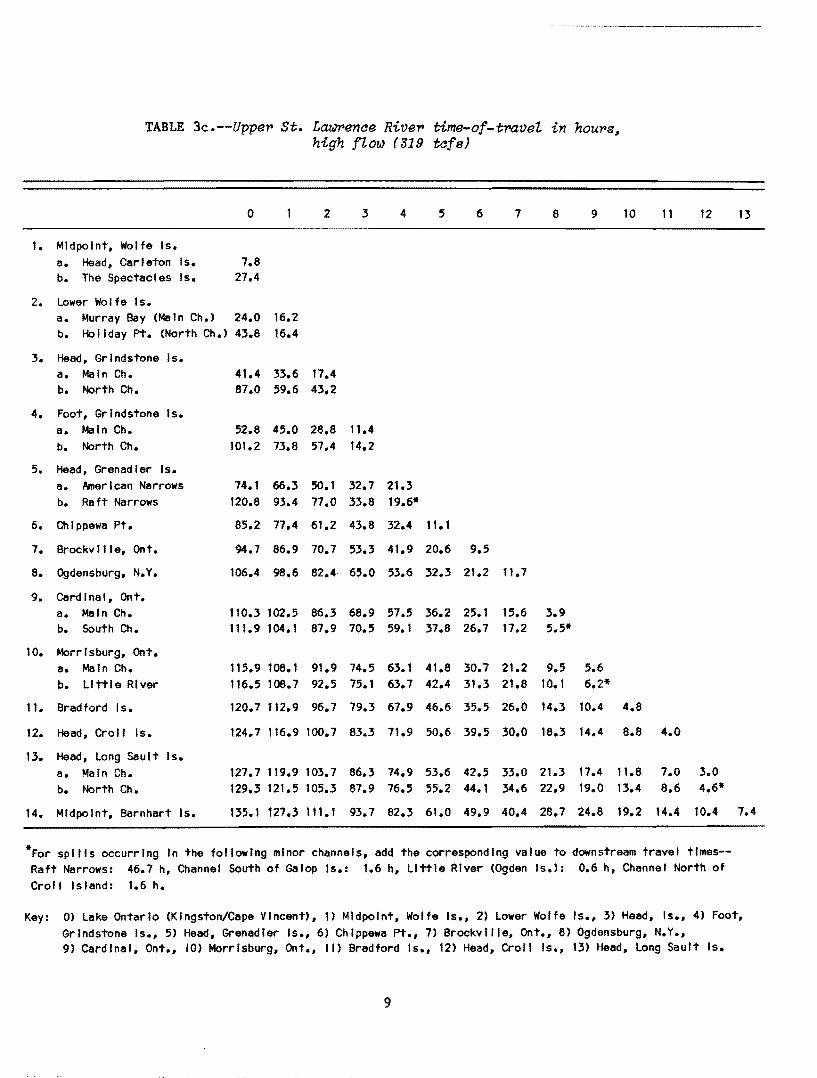
TABLE 3c.--Uppe~ St. La~ence Rive~ time-of-~vel in hou~s~
high flolJJ (319 tcfs)
0 2 3 4 5 6 7 8 9 10 11 12 13
1. MidpoInt, Wolfe Is.a. Head, Carleton Is. 7.8b. The Spectacles Is. 27.4
2. Lower Wol fe Is.a. Murray Bay (Main Ch.) 24.0 16.2b. HolIday Pt. (North Ch.) 43.8 16.4
3. Head, Grindstone Is.a. Main Ch. 41.4 33.6 17.4b. North Ch. 87.0 59.6 43.2
4. Foot, GrIndstone Is.a. Main Ch. 52.8 45.0 28.8 11.4b. North Ch. 101.2 73.8 57.4 14.2
5. Head, Grenadier Is.a. American Narrows 74.1 66.3 SO.l 32.7 21.3b. Raft Narrows 120.8 93.4 77.0 33.8 19.6*
6. Chippewa Pt. 85.2 77.4 61.2 43.8 32.4 11.1
7. Brockvllle, Onto 94.7 86.9 70.7 53.3 41.9 20.6 9.5
8. Ogdensburg, N.Y. 106.4 98.6 82.4 65.0 53.6 32.3 21.2 11.7
9. Cardinal, Ontoa. Main Ch. 110.3 102.5 86.3 68.9 57.5 36.2 25.1 15.6 3.9b. South Ch. 111.9104.1 87.9 70.5 59.1 37.8 26.7 17.2 5.5*
10. Morrlsburg, Ont.a. Main Ch. 115.9 108.1 91.9 74.5 63.1 41.8 30.7 21.2 9.5 5.6b. Little River 116.5 108.7 92.5 75.1 63.7 42.4 31.3 21.8 10.1 6.2*
11. Bradford Is. 120.7 112.9 96.7 79.3 67.9 46.6 35.5 26.0 14.3 10.4 4.8
12. Head, Croll Is. 124.7 116.9 100.7 83.3 71.9 50.6 39.5 30.0 18.3 14.4 8.8 4.0
13. Head, Long Sault Is.a. Main Ch. 127.7 119.9 103.7 86.3 74.9 53.6 42.5 33.0 21.3 17.4 11.8 7.0 3.0b. North Ch. 129.3 121.5 105.3 87.9 76.5 55.2 44.1 34.6 22.9 19.0 13.4 8.6 4.6*
14. Midpoint, Barnhart Is. 135.1 127.3 111.1 93.7 82.3 61.0 49.9 40.4 28.7 24.8 19.2 14.4 10.4 7.4
*For spIlls occurring In the following minor channels, add the corresponding value to downstream travel times--Raft Narrows: 46.7 h, Channel South of Salop 15.: 1.6 h, LIttle River (Ogden Is.): 0.6 h, Channel North ofCroll Island: 1.6 h.
Key: 0) Lake Ontario (Kingston/Cape Vincent), 1) Midpoint, Wolfe Is., 2) Lower Wolfe Is., 3) Head, Is., 4) Foot,Grindstone Is., 5) Head, Grenadier Is., 6) Chippewa Pt., 7) Brockvllle, Ont., 8) Ogdensburg, N.Y.,9) cardInal, Ont., 10) Morrlsburg, Ont., II) Bradford Is., 12) Head, Croll Is., 13) Head, Long Sault Is.
9

34
SCALE OF MILES2 I 0 2 4 6
I*Is
7 MAITLAND
CK~MOnr(ISTOWtl
FIGURE 3.--Uppe~ St. La~enae Rive~ ~vet time seations.

11
NI~lsao~orWOMaOW~--xlPuaddv

u.s. DEPARTMENT OF COMMERCENational Oceanic and Atmospheric AdministrationENVIRONMENTAL RESEARCH LABORATORIES
Great Lakes Environmental Research Laboratory2300 Washtenaw AvenueAnn Arbor, Michigan 48104
TO:
FROM:
SUBJECT:
April 25, 1983
Dr. Frank Quinn
Jay Rodstein~
Illinois River Hydraulic Model
Communications with the U.S. Coast Guard Chicago MarineSafety Office and Chicago Corps of Engineers indicates thatthere is adequate knowledge of the hydraulics of the IllinoisRiver System. Therefore, there is no present need for yourgroup to pursue this project.
12