treasure valley ozone precursor study, july – september 2007
TRANSCRIPT
Treasure Valley Ozone Precursor Study, July – September 2007
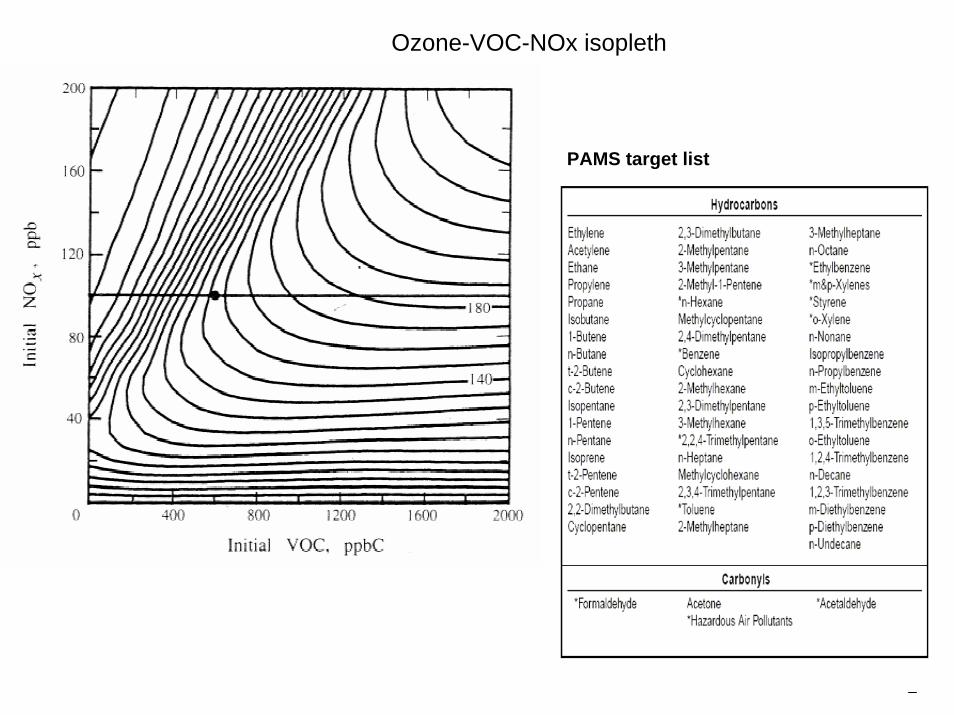
Ozone-VOC-NOx isopleth
PAMS target list

Treasure Valley Airshed Nox - 2005 EI
48.5%
20.6%
6.6%
3.7%
3.4%
3.3%
2.6%
2.5%
2.4%
1.8%4.5%
Mobile
NonRoad Mobile
Industrial Coal Boilers
Industrial Wood Boilers
Biogenics
Industrial NG Boilers
Military Aircraft
Diesel Line Haul Locomotives
Residential NG Furnaces
Open Burning Res Household Waste
Other (<2%)
Treasre
Valley
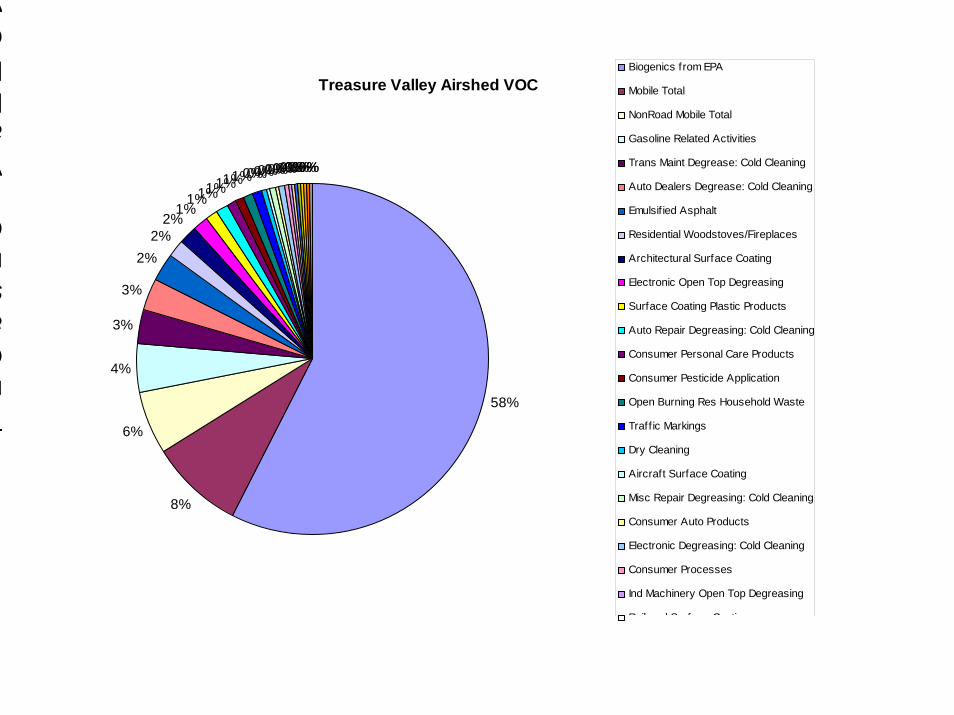
Treasure Valley Airshed VOC
58%
8%
6%
4%
3%
3%
2%2%
2%1%
1%1%1%1%1%1%0%0%0%0%0%0%0%0%0%0%0%0%0%0%0%0%
Biogenics from EPA
Mobile Total
NonRoad Mobile Total
Gasoline Related Activities
Trans Maint Degrease: Cold Cleaning
Auto Dealers Degrease: Cold Cleaning
Emulsif ied Asphalt
Residential Woodstoves/Fireplaces
Architectural Surface Coating
Electronic Open Top Degreasing
Surface Coating Plastic Products
Auto Repair Degreasing: Cold Cleaning
Consumer Personal Care Products
Consumer Pesticide Application
Open Burning Res Household Waste
Traff ic Markings
Dry Cleaning
Aircraft Surface Coating
Misc Repair Degreasing: Cold Cleaning
Consumer Auto Products
Electronic Degreasing: Cold Cleaning
Consumer Processes
Ind Machinery Open Top Degreasing
R il d S f C ti

2004 Ozone Saturation Study (Ogawa Passive Samplers)

2007 Study – Monitoring Sites

0
10
20
30
40
50
60
70
0 3 6 9 12 15 18 21Hour
Ozo
ne C
onc
(ppb
v)
PAR NNUWHP MOUITD WHTSTL
Spatial/temporal variation of ozone
Urban background ~ 33ppbv
Uniform temporal variation

0
10
20
30
40
50
60
0 3 6 9 12 15 18 21Time
Ozo
ne, N
O a
nd N
O2
(ppb
v)
0
0.2
0.4
0.6
0.8
1
1.2
1.4
1.6
VO
Cs (
ppbv
)
NO NO2 O3Butane isoButane t2PenteneBenzene Toluene Hexeneo-Xylene
1
10
100
0 3 6 9 12 15 18 21Time
Win
d sp
eed
and
tem
pera
ture
0
90
180
270
360
450
540
630
Win
d di
rect
ion,
sola
r rad
iatio
n an
d re
lativ
e hu
mid
ity
Wind speedTemp.%RHSolar RadiationWind direction
Ozone-VOC-NOx, meteorology and topography

0
10
20
30
40
50
60
0 3 6 9 12 15 18 21Time
Ozo
ne a
nd N
O c
onc.
(ppb
v)
NO ThuO3 ThuNO SunO3 Sun
ThursdaytNO=O3
SundaytNO=O3
tO3acc
0
3
6
9
12
15
18
21
Mon Tue Wed Thu Fri Sat SunDay
Tim
e
0
1
2
3
4
5
6
7
8
Ozo
ne a
cc. r
ate
(ppb
/hr)
tNO=O3 tO3acc Rate
Ozone inhibition and accumulation
•Weekday vs. weekend effect
•Role of precursor reductions
0.1
1
10
100
Sun Mon Tue Wed Thu Fri SatDay of week
VO
C/N
Ox
ratio
ITDSt. Lukes
VOC/NOx = 5.5

Regional sources of ozone and its precursors
State Number of fires Burnt area (in acres)
Idaho 26 2,113,227
Nevada 16 512,012
Oregon 21 454,728
Washington 12 172,739
California 18 421,924
Montana 22 549,933

July 10-14, 2007

Lessons LearnedSize (and resources) of field studies may vary (coordinate with
modeling efforts)Both local and regional characteristics should be addressed
• Local and regional characteristics of ozone sources and impacts• Continental background• Ozone precursors defines the conditions of photochemistry and
provide directions for future efforts• Meteorology and topography defines the spatial and temporal
variation• Local sources (and for non-stagnant conditions) are responsible
for significant increase of ozone concentrations• Stagnant conditions and regional events/sources add on ozone
(and its precursors) concentrations

Data analysis and modelingMonitoring ↔ Data Analysis ↔ Modeling
1. “Traditional” ozone data analysis
2. Integration of regional meteorology and air mass trajectories- backward trajectories to determine if “high-ozone” air mass intercepted an area or large point source
- forward trajectories to determine whether or not contaminated plumes (e.g wildfires) are mixed with surface air.