trend-adjusted actual production history standards handbook
TRANSCRIPT

United States
Department of
Agriculture
Federal Crop
Insurance
Corporation
Risk
Management
Agency
Product
Administration
and Standards
Division
FCIC-20220-1
(11-2020)
TREND-
ADJUSTED
ACTUAL
PRODUCTION
HISTORY
STANDARDS
HANDBOOK
2021 and Succeeding Crop
Years


November 2020 FCIC-20220-1 TP 1
RISK MANAGEMENT AGENCY
KANSAS CITY, MO 64133
TITLE: TREND-ADJUSTED ACTUAL
PRODUCTION HISTORY
STANDARDS HANDBOOK
NUMBER: FCIC-20220-1
EFFECTIVE DATE: Effective Upon
Approval and Until Obsoleted
ISSUE DATE: November 24, 2020
SUJECT:
Provides the procedures to administer the
Trend-Adjusted Actual Production
History Program
OPI: PRODUCT ADMINISTRATION
AND STANDARDS DIVISON
APPROVED:
/s/ John W. Underwood for
Deputy Administrator for Product
Management
REASON FOR ISSUANCE
The FCIC 20220-1 Trend-Adjusted APH Standards Handbook is being issued to provide
procedures to administer the Trend-Adjusted APH program for the 2021 and succeeding crop
years.
SUMMARY OF CHANGE
1. Para. 21H Added clarification that the approved APH yield is limited to the highest
actual/pre-quality actual yield when QL is elected and used.
2. Para. 21H Added an example to show the clarification for QL.
3. Para. 21 and 22 Minor editorial/grammar edits.
.
November 2020 FCIC-20220-1 TP 2
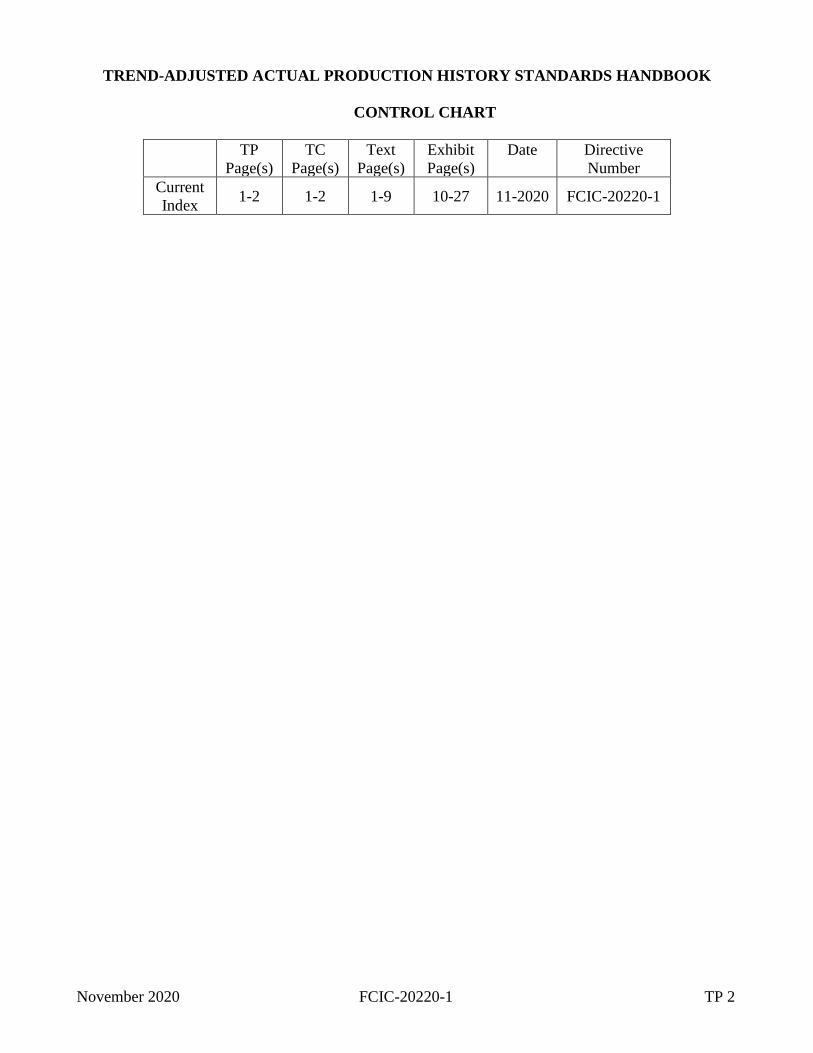
TREND-ADJUSTED ACTUAL PRODUCTION HISTORY STANDARDS HANDBOOK
CONTROL CHART
TP
Page(s)
TC
Page(s)
Text
Page(s)
Exhibit
Page(s)
Date Directive
Number
Current
Index 1-2 1-2 1-9 10-27 11-2020 FCIC-20220-1

November 2020-1 FCIC-20220-1 TC 1
TREND-ADJUSTED ACTUAL PRODUCTION HISTORY STANDARDS HANDBOOK
TABLE OF CONTENTS
PAGE NO.
PART 1 OVERVIEW AND GENERAL REQUIREMENTS
1 Overview ............................................................................................................................... 1
2 Availability ............................................................................................................................ 1
3 Eligibility ............................................................................................................................... 1
4 Applicability of Yield Limitations, Yield Reductions, YA and YE .................................... 2
5-10 (Reserved)
PART 2 APPLICABILITY OF TREND–ADJUSTED APH
11 APH Database Qualifications ............................................................................................... 4
12 Yields Eligible for Trend Adjustment ................................................................................... 4
13 Master Yields (MY) .............................................................................................................. 4
14 Yield Not Eligible for Trend Adjustment ............................................................................ 4
15 Written Agreements .............................................................................................................. 5
16 Production Reporting ............................................................................................................ 5
17-20 (Reserved)
PART 3 CALCULATIONS
21 Trend-Adjusted APH Calculation ......................................................................................... 6
22 Steps for Calculating the Approved APH Yield When Trend-Adjusted APH Elected ........ 8
23-30 (Reserved)

November 2020-1 FCIC-20220-1 TC 2
TREND-ADJUSTED ACTUAL PRODUCTION HISTORY STANDARDS HANDBOOK
TABLE OF CONTENTS
PAGE NO.
EXHIBITS
1 Acronyms and Abbreviations .............................................................................................. 10
2 (Reserved) ...............................................................................................................................
3 (Reserved) ...............................................................................................................................
4 Example Trend-Adjusted APH Databases .......................................................................... 13
5 Example APH Databases with Different Percentage of Trend-Adjusted Factor ............... 15
6 Example of APH Database with YE, YA and TA where TA limits the Approved APH
Yield .................................................................................................................................... 23
7 Example of Approved APH Yield Calculation with YA, YE, TA and YC Elected ........... 25
8 Example of Trend-Adjusted APH Database with QL ......................................................... 26

November 2020 FCIC-20220-1 1
PART 1 OVERVIEW AND GENERAL REQUIREMENTS
1 Overview
Trend-Adjusted APH, if elected, adjusts yields in APH databases to reflect increases in yields
through time in the county. Trend adjustments are made on each eligible yield within a
qualifying APH database based on the county’s historical yield trend. The actuarial documents
provide the historical yield trend. The approved APH yield is calculated using trend-adjusted
yields and any other applicable yields within the APH database.
2 Availability
See actuarial documents for the applicable county/crop/P/Ts available for Trend-Adjusted APH.
3 Eligibility
A. Insureds’ Eligibility
An insured must be in an eligible county and have at least one APH database with an actual
yield in one of the four most recent crop years for the crop/county.
B. Election
To be applicable for the current crop year, the insured must elect Trend-Adjusted APH:
(1) by the applicable SCD;
(2) on a crop/county basis; and
(3) on an application or policy change form by including the option code of “TA.”
C. Coverage Levels
Trend–Adjusted APH is available for additional coverage level policies. Trend–Adjusted
APH is not available for CAT policies.
D. Continuous
Trend–Adjusted APH is a continuous election that remains in effect unless:
(1) cancelled in writing on or before the applicable cancellation date for the effective crop
year; or
(2) terminated by the FCIC.

November 2020 FCIC-20220-1 2
3 Eligibility (Continued)
E. Cancellation of Trend-Adjusted APH by Insured
When an insured cancels Trend–Adjusted APH:
(1) trend adjustments to any yield will no longer apply;
(2) if SA T-Yields were calculated from approved APH yields containing actual yields
with trend adjustments, the SA T-Yields must be replaced with the variable T-Yield;
(3) the 10 percent yield limitation (cup) will not apply the year trend is cancelled; and
(4) yield substitution and yield floors may apply, when elected, and as applicable.
F. Termination of Trend-Adjusted APH by FCIC
If Trend-Adjusted APH is terminated by FCIC:
(1) trend adjustments to any yield will no longer apply;
(2) if SA T-Yields were calculated from approved APH yields containing actual yields
with trend adjustments, SA T-Yields must be recalculated based on the current year’s
approved APH yields without trend adjustments;
(3) the 10 percent limitation (cup) will not apply the year trend is terminated; and
(4) yield substitution and yield floors may apply, when elected, and as applicable.
G. Transfers
When the crop’s policy is transferred to a different AIP, Trend–Adjusted APH will be
considered cancelled at the time the crop policy is cancelled. If the crop policy is
transferred to a different AIP, the insured may elect Trend–Adjusted APH with the
assuming AIP on or before the SCD.
4 Applicability of Yield Floors, Yield Reductions, YA and YE
A. Yield Floors
If Trend-Adjusted APH is elected for a crop/county, yield limitations do not apply
regardless of whether an APH database qualifies for trend adjustment.
Exception: If Trend-Adjusted APH is elected for a crop/county and the actuarial
documents do not authorize a yield trend for a specific P/T, yield floors are
applicable for those APH databases, if they otherwise qualify.

November 2020 FCIC-20220-1 3
4 Applicability of Yield Limitations, Yield Reductions, YA and YE (Continued)
B. Yield Reductions
Procedures concerning yield reductions contained in the CIH Part 15 Section 5 are
unaffected when Trend–Adjusted APH is elected.
(1) Actual yields that have been reduced due to excessive yields are not eligible for trend
adjustment. See CIH Para. 1573 for excessive actual yield procedures.
(2) Reductions of approved APH yields due to inconsistent approved APH yields or
different production methods will apply even when yields within the APH database
have been adjusted for trend. See CIH Para. 1574 and 1575 for reductions due to
inconsistent approved APH yields or different production methods.
C. Yield Adjustments (YA) (Substitutions)
Yield substitutions apply when elected by the insured. Yield substitutions are based on 60
percent of the applicable T-Yield before adjustment for yield trend, as applicable.
Exception: For BFRs, yield substitions are based on 80 percent of the applicable T-
Yield.
D. Yield Exclusions (YE)
YE applies when elected by the insured. When an actual yield in an eligible crop year is
excluded, an excluded actual yield is not considered for TA purposes when determining:
(1) whether an APH database qualifies for TA by having at least an actual yield in one of
the four most recent crop years, see Para. 11;
(2) the applicable TA percentages, see Para. 21B; and
(3) the highest actual yield in the APH database with one year of trend adjustment applied
for the TA limitation of the approved APH yield for the APH database (Para. 21H).
E. Yield Cups (YC)
YC applies when elected by the insured. Application of YA,YE, or TA on an actual yield
for an eligible crop year within an APH database will not affect the calculation of the
approved APH yield if a yield cup applies to the APH database.
F. Quality Loss Option (QL)
When an actual yield is replaced with the pre-quality actual yield for QL and TA has been
elected, TA will apply to the pre-quality actual yield that replaced the actual yield.
5-10 (Reserved)

November 2020 FCIC-20220-1 4
PART 2 APPLICABILITY OF TREND–ADJUSTED APH
11 APH Database Qualifications
(1) The APH database must have at least an actual yield in one of the four most recent crop
years.
(2) If the APH database contains fewer than four actual yields in the 12 most recent crop years
the trend adjustment is reduced. See Part 3 Para. 21B for the applicable percentage of
reduction.
(3) For the purposes of Trend-Adjusted APH, yields identified with the following yield
descriptors are considered actuals: A, AP, AY, AX, BF, DA, FA, J, NA, NW, P, PA, PW,
and WY, see CIH Exh. 15.
12 Yields Eligible for Trend Adjustment
Yields contained in a qualifying APH database identified with the following yield descriptors are
eligible for trend adjustment: A, AP, AY, BF, DA, FA, NA, NW, PA, PW, and WY, see CIH
Exh. 15.
13 Master Yields (MY)
If available for the crop and elected by the insured, MYs are eligible for Trend-Adjusted APH.
Trend adjustments will be made to the actual yields in the MY summary APH database.
14 Yield Not Eligible for Trend Adjustment
A. Added Land and New Crop/Practice/Type (P/T)
(1) For Added land and new crop/P/T APH databases using SA T-Yields identified with
an “L”, “IL”, or “C” yield descriptors, trend adjustments do not apply. Trend
adjustments only apply to actual yields.
(2) While added land and new crop/P/T procedures (CIH Part 17, Sections 9 and 10) are
not affected by the election of TA, the calculation for SA T-Yields is changed when
an approved APH yield includes trend adjustment. SA T-Yields will continue to be
determined based on the crop year the APH database is established, by
crop/P/T/TMA. However, instead of using the approved APH yield from each of the
insured’s existing APH databases for the policy that have at least one year of
actual/assigned yields, by crop/P/T/TMA to calculate the SA T-Yield, use:
(a) the adjusted yield for APH databases with yields that have trend adjustment with
at least one actual/assigned yield; and
(b) the approved APH yield for APH databases where actual yields have not been
trended with at least one actual/assigned yield.

November 2020 FCIC-20220-1 5
14 Yield Not Eligible for Trend Adjustment (Continued)
A. Added Land and New Crop/Practice/Type (P/T) (Continued)
All other calculations and requirements for use of the SA T-Yield remain unchanged.
B. New Producer
Trend-adjustment will not apply to new producer T-Yields. New producer T-Yields
(identified with an “I” or “IL” yield descriptor) will not be adjusted for trend. However,
actual yields, when qualified, may be trended even when contained in an APH database
with new producer T-Yields.
C. North Dakota Personal Transitional Yield (PTY)
For APH databases using the PTY (identified with the “K” yield indicator), T-Yields based
on the PTY will not be adjusted for trend. Trend-Adjusted APH does not change the PTY
calculation. The PTY is calculated by dividing total production by the total acreage for a
crop/P/T/TMA for each year, with the sum of all years divided by the number of years.
Therefore, actual yields are not trended in the PTY calculation. However, actual yields
within the APH database may be trend adjusted.
15 Written Agreements
Trend-Adjusted APH will not apply to any APH databases insured under a written agreement,
with the following exceptions:
(1) High Risk Land Written Agreement (HR); and
(2) Written Unit Agreement (UA).
16 Production Reporting
Selecting Trend-Adjusted APH requires no additional production reporting by the insured.
17-20 (Reserved)

November 2020 FCIC-20220-1 6
PART 3 CALCULATIONS
21 Trend-Adjusted APH Calculation
The following subparagraphs explain the process and calculations of the Trend-Adjusted APH
program.
A. Crop/County Trend Adjustment
Each eligible crop/county/P/T will have a trend adjustment established in the actuarial
documents.
B. Applicable Trend Adjustment Percentages
Each eligible yield in a qualifying APH database will be adjusted by the applicable trend
adjustment percentage determined by the number of actual yields in the previous 12 crop
years in the APH database, see Part 2 Para. 11 above for applicable actual yields. The
applicable trend adjustment percentages are as follows:
(1) one actual yield = 25 percent of trend adjustment;
(2) two actual yields = 50 percent of trend adjustment;
(3) three actual yields = 75 percent of trend adjustment; or
(4) four or more actual yields = 100 percent of trend adjustment.
C. Trend Adjustment for Age of Eligible Yield
The trend adjustment is applied to each eligible yield in a qualifying APH database and will
be adjusted upward by the trend adjustment multiplied by the age of the eligible yield. The
age of the eligible yield is determined by subtracting the yield year from the current crop
year.
Example: The crop year is 2021, the trend adjustment is 2 in the actuarial documents,
and the insured has eligible yields in 2020, 2019, 2018 and 2017 crop years.
Below are the trend adjustments to be applied for each specific yield year:
(1) 2020 (2021-2020) * 2 bushels = 2,
(2) 2019 (2021-2019) * 2 bushels = 4,
(3) 2018 (2021-2018) * 2 bushels = 6, and
(4) 2017 (2021-2017) * 2 bushels = 8.
D. Applying Trend Adjustment
The trend adjustment, adjusted by the applicable trend adjustment percentage, will be added
to each eligible yield, see Part 2 Para. 12 in each qualifying APH database. This is a
calculation only, the yields within the APH database remain unchanged.

November 2020 FCIC-20220-1 7
21 Trend-Adjusted APH Calculation (Continued)
E. Calculation of Approved APH Yield
The calculation of the approved APH yield is unchanged, except trend adjustments are
applied to eligible yields before averaging.
F. Calculation of the Rate Yield
The rate yield is equal to the average yield when Trend-Adjusted APH applies to an APH
database with the following exceptions:
(1) the approved APH yield is reduced due to inconsistent approved APH yields, see CIH
Para. 1574 for inconsistent approved APH yield determination procedures. In these
situations, the rate yield will be equal to the approved APH yield; and
(2) the approved APH yield is reduced due to different production methods being carried
out for the current crop year which results in lower actual yields, see CIH Para. 1575
for different production method determination procedures. In these situations, the rate
yield will be equal to the approved APH Yield.
G. Calculation of Adjusted Yield (APH Yield without Trend Adjustment)
AIPs must also calculate the adjusted yield which is the APH yield without trend
adjustment and is calculated by the average of the yields in the APH database:
(1) without trend adjustment;
(2) without yield limitations (cups and yield floors);
(3) prior to any yield exclusions; and
(4) with yield substitutions, if YA has been elected by the insured.
The adjusted yield is not the same as the rate yield. The increase in coverage resulting from
the Trend-Adjusted APH yield relative to the APH yield without trend adjustment (adjusted
yield) is used to determine the appropriate premium rate.
Exception: When yield reductions apply to the APH database the adjusted yield must
equal the approved APH yield.
H. Trend Adjustment Limitation of the Approved APH Yield
The approved APH yield for the APH database is limited to the highest actual yield (or pre-
quality actual yield if QL has been elected and an actual yield has been replaced with a pre-
quality actual yield) in the APH database with 1 year of trend adjustment applied.
Example 1: The highest actual yield within the APH database is 150 bushels and the
trend adjustment is 2. Therefore, the trend adjustment limitation is 152
(150+2). The average of all yields in the APH database is 154; however,
the approved APH yield is limited to 152 due to the trend adjustment
limitation.

November 2020 FCIC-20220-1 8
21 Trend-Adjusted APH Calculation (Continued)
H. Trend Adjustment Limitation of the Approved APH Yield (Continued)
Example 2: The highest actual yield within the APH database is 100 bushels and the
trend adjustment is 2; however, QL was elected and used, and the highest
pre-quality actual yield is 140. Therefore, the trend adjustment limitation
is 142 (140+2). The average of all yields in the APH database is now 130.
The approved APH yield is not limited to 102 (actual yield) due to QL
being elected and used.
Exception: The approved APH yield will not be less than the adjusted yield, see G
above.
Example: The applicable T-Yield is 100 bushels and the trend
adjustment factor is 2. The APH database has only one
actual yield equal to 10 bushels. Therefore, the trend
adjustment limitation is 12 (10+2). Due to this exception,
the approved APH yield would be 90 bushels
(100T+100T+100T+10A/4 years = 90), rather than being
limited to 12 bushels due to the trend adjustment
limitation.
22 Steps for Calculating the Approved APH Yield When Trend-Adjusted APH is Elected
Follow the steps below to calculate the approved APH yield for an APH database when Trend-
Adjusted APH elected.
Step 1: Determine if the APH database has at least an actual yield in one of the four most
recent crop years to determine if the APH database qualifies for trend adjustment.
If not, APH database is not eligible for trend adjustment. If there is, continue to
next step;
Step 2: Determine the number of actual yields in the most recent 12 crop years to
determine the trend adjustment percentage for the APH database, see 21B above;
Step 3: Multiply the trend adjustment contained in the actuarial documents by the trend
adjustment percentage determined in Step 2. Round result to four decimal places;
Step 4: Determine age of each eligible yield, see 21C above;
Step 5: Multiply the age of each eligible yield by the trend adjustment, adjusted by
applicable trend adjustment percentage determined in Step 3. Round result to four
decimal places;
Step 6: Add the result of step 5 to each eligible yield to obtain the trend adjustment yield
for each crop year, see 21D above. Round result to whole number;

November 2020 FCIC-20220-1 9
22 Steps for Calculating the Approved APH Yield ….. Trend-Adjusted APH is Elected (cont.)
Step 7: Calculate the approved APH yield by summing trend-adjusted yields and all other
yields within the APH database and dividing by the number of yields in the APH
database, see 21E; and
Step 8: Compare the approved APH yield to the trend adjustment limitation, see 21H
above. If the approved APH yield is less than the trend adjustment limitation,
then the final approved APH yield equals the Trend-Adjusted APH yield from
step 7. If the yield calculated in step 7 is greater than the trend adjustment
limitation, then the final approved APH yield equals the trend adjustment
limitation.
Exception: If the insured elected yield cup option, and does not opt-out of the
cup applying to an APH database and the APH database qualifies
for the cup in accordance with CIH Part 15 Section 5, then the
approved APH yield is the prior year’s approved APH yield times
0.9.
Step 9: Calculate the adjusted yield, see 21G above.
23-30 (Reserved)

November 2020 FCIC-20220-1 10
Exhibit 1
Acronyms and Abbreviations
The following table provides the acronyms and abbreviations used in this handbook.
Approved
Acronyms/Abbreviations
Term
AIP Approved Insurance Provider
APH Actual Production History
BFR Beginning Farmer and Rancher
CAT Catastrophic Risk Protection
CIH Crop Insurance Handbook
FCIC Federal Crop Insurance Corporation
PASS Policy Acceptance Storage System
PTY Personal Transitional Yield
P/T Practice/Type
RMA Risk Management Agency
SA T-Yield Simple Average Transitional-Yield
SCD Sales Closing Date
T-Yield Transitional-Yield
November 2020 FCIC-20220-1 11
Exhibit 2
(Reserved)

November 2020 FCIC-20220-1 12
Exhibit 3
(Reserved)

November 2020 FCIC-20220-1 13
Exhibit 4
Example Trend-Adjusted APH Databases
Insured has produced corn in a single basic unit (BU) APH database since 2017. The county T-Yield
is 166 bushels. For 2021, the insured has elected YA (60 percent of T-Yield = 100 bushels); however,
it does not apply to any of the actual yields reported. The insured has also elected Trend-Adjusted
APH. The trend adjustment for corn in the insured’s county is 2. The insured provides an acceptable
production report in 2021 and APH database is updated.
Original APH Database
2021 Corn
(0041)
NI
(003)
Grain
(016)
Unit # 0001-0000 BU
Year Prod. Acres Yield
2017 22500 150 A 150
2018 19300 100 A 193
2019 26400 150 A 176
2020 19700 100 A 197
T-Yield=166 Approved APH 179
Average Yield 179
Rate Yield 179
To calculate the approved APH yield using trend adjustment:
Step 1: The APH database has at least an actual yield in one of the four most recent crop years,
qualifying for trend adjustment.
Step 2: The APH database has four actual yields in the most recent 12 crop years; therefore, the
applicable trend adjustment percentage is 100 percent.
Step 3: 1.00 * 2 = 2
Step 4: (a) 2020: 2021 - 2020 = 1
(b) 2019: 2021 - 2019 = 2
(c) 2018: 2021 - 2018 = 3
(d) 2017: 2021 - 2017 = 4
Step 5: (a) 2020: 1 * 2 = 2
(b) 2019: 2 * 2 = 4
(c) 2018: 3 * 2 = 6
(d) 2017: 4 * 2 = 8
Step 6: (a) 2020: 197 + 2 = 199
(b) 2019: 176 + 4 = 180
(c) 2018: 193 + 6 = 199
(d) 2017: 150 + 8 = 158
Step 7: (199 + 180 + 199 + 158) / 4 = 184
November 2020 FCIC-20220-1 14
Exhibit 4
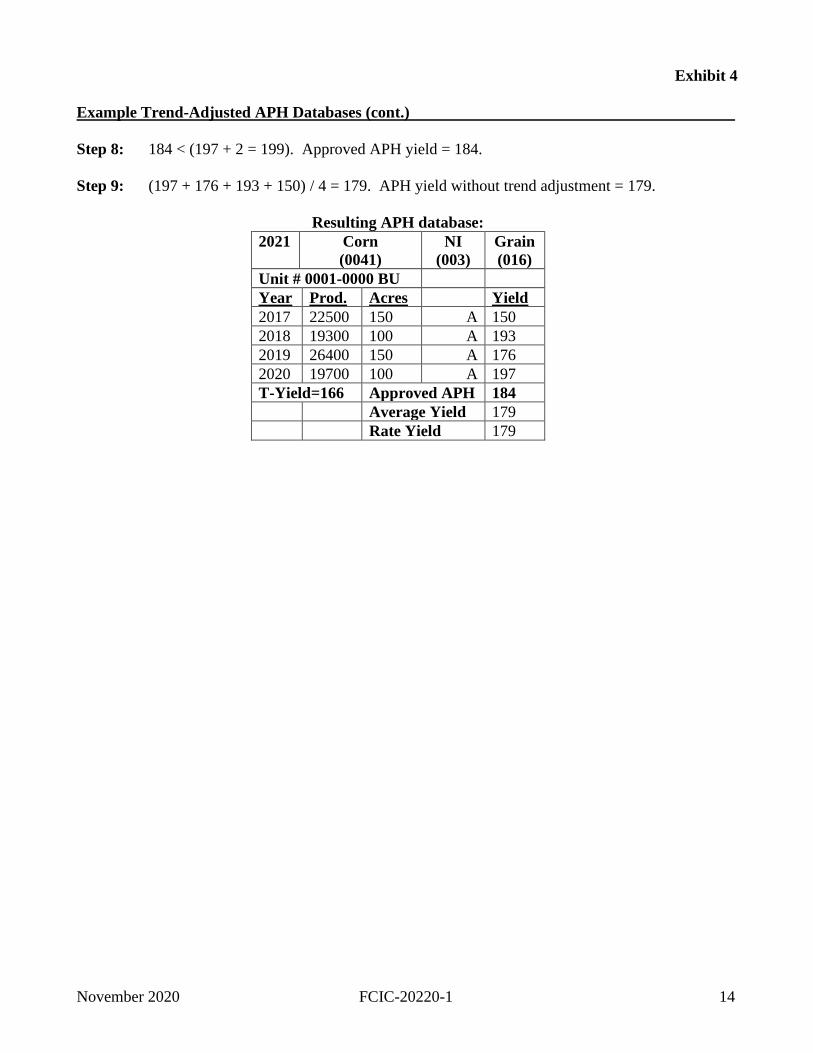
Example Trend-Adjusted APH Databases (cont.)
Step 8: 184 < (197 + 2 = 199). Approved APH yield = 184.
Step 9: (197 + 176 + 193 + 150) / 4 = 179. APH yield without trend adjustment = 179.
Resulting APH database:
2021 Corn
(0041)
NI
(003)
Grain
(016)
Unit # 0001-0000 BU
Year Prod. Acres Yield
2017 22500 150 A 150
2018 19300 100 A 193
2019 26400 150 A 176
2020 19700 100 A 197
T-Yield=166 Approved APH 184
Average Yield 179
Rate Yield 179

November 2020 FCIC-20220-1 15
Exhibit 5
Example APH Databases with Different Percentage of Trend-Adjusted Factor
The insured has elected Trend-Adjusted APH for corn in the county. The insured has five optional
units (OU). The county T-Yield is 130 bushels (60 percent of the T-Yield = 78) and the insured has
elected yield substitution (YA). The trend adjustment from the actuarial documents for the
crop/county is two bushels a year. The five APH databases below are prior to any trend adjustment.
Original APH Databases
2021 Corn
(0041)
NI
(003)
Grain
(016)
2021 Corn
(0041)
NI
(003)
Grain
(016)
Unit # 0001-0001 OU Unit # 0001-0002 OU
Year Production Acres Yield Year Production Acres Yield
2011 19950 150 A 133 2012 T 130
2012 14500 100 A 145 2013 Z
2013 25050 150 A 167 2014 Z
2014 12200 100 A 122 2015 11600 80 A 145
2015 23550 150 A 157 2016 Z
2016 16500 100 A 165 2017 Z
2017 25650 150 A 171 2018 12160 80 A 152
2018 19300 100 A 193 2019 Z
2019 26400 150 A 176 2020 11840 80 A 148
2020 19700 100 A 197 T-Yield = 130 Approved APH 144
T-Yield = 130 Approved APH 163 Average Yield 144
Average Yield 163 Rate Yield 144
Rate Yield 163
2021 Corn
(0041)
NI
(003)
Grain
(016)
2021 Corn
(0041)
NI
(003)
Grain
(016)
Unit # 0001-0003 OU Unit # 0001-0004 OU
Year Production Acres Yield Year Production Acres Yield
2002 0 200 A 0 2017 T 130
2005 27600 200 A 138 2018 T 130
2007 29400 200 A 147 2019 T 130
2014 Z 2020 5840 40 A 146
2015 Z T-Yield = 130 Approved APH 134
2016 Z Average Yield 134
2017 40200 200 A 201 Rate Yield 134
2018 Z
2019 Z
2020 33400 200 A 167
T-Yield = 130 Approved APH 146
Average Yield 131
Rate Yield 131

November 2020 FCIC-20220-1 16
Exhibit 5
Example APH Databases with Different Percentage of Trend-Adjusted Factor (Continued)
Original APH Databases (cont.)
2021 Corn
(0041)
NI
(003)
Grain
(016)
Unit # 0001-0005 OU
Year Production Acres Yield
2015 L 154
2016 L 154
2017 L 154
2018 L 154
2019 Z
2020 Z
T-Yield = 154 Approved APH 154
Average Yield 154
Rate Yield 154
A. Example of APH database with Full Trend Adjustment
Step 1: The APH database for 0001-0001 has at least an actual yield in one of the four
most recent crop years, qualifying for trend adjustment.
Step 2: The APH database has 10 actual yields in the most recent 12 crop years;
therefore, the applicable trend adjustment percentage is 100 percent.
Step 3: 1.00 * 2 = 2
Step 4: (a) 2020: 2021 – 2020 = 1
(b) 2019: 2021 – 2019 = 2
(c) 2018: 2021 – 2018 = 3
(d) 2017: 2021 – 2017 = 4
(e) 2016: 2021 – 2016 = 5
(f) 2015: 2021 – 2015 = 6
(g) 2014: 2021 – 2014= 7
(h) 2013: 2021 – 2013 = 8
(i) 2012: 2021 – 2012 = 9
(j) 2011: 2021 – 2011 = 10
Step 5: (a) 2020: 1 * 2 = 2
(b) 2019: 2 * 2 = 4
(c) 2018: 3 * 2 = 6
(d) 2017: 4 * 2 = 8
(e) 2016: 5 * 2 = 10
(f) 2015: 6 * 2 = 12
(g) 2014: 7 * 2 = 14
(h) 2013: 8 * 2 = 16

November 2020 FCIC-20220-1 17
Exhibit 5
Example APH Databases with Different Percentage of Trend-Adjusted Factor (Continued)
A. Example of APH database with Full Trend Adjustment (Continued)
Step 5: (Continued)
(i) 2012: 9 * 2 = 18
(j) 2011: 10 * 2 = 20
Step 6: (a) 2020: 197 + 2 = 199
(b) 2019: 176 + 4 = 180
(c) 2018: 193 + 6 = 199
(d) 2017: 171 + 8 = 179
(e) 2016: 165 + 10 = 175
(f) 2015: 157 + 12 = 169
(g) 2014: 122 + 14 = 136
(h) 2013: 167 + 16 = 183
(i) 2012: 145 + 18 = 163
(j) 2011: 133 + 20 = 153
Step 7: (199 + 180 + 199 + 179 + 175 + 169 + 136 + 183 + 163 + 153) / 10 = 174
Step 8: 174 < (197 + 2 = 199). Approved APH yield = 174.
Step 9: (197 + 176 + 193 + 171 + 165 + 157 + 122 + 167 + 145 + 133) / 10 = 163
APH yield without trend adjustment = 163.
Resulting APH Database
2021 Corn
(0041)
NI
(003)
Grain
(016)
Unit # 0001-0001 OU
Year Production Acres Yield
2011 19950 150 A 133
2012 14500 100 A 145
2013 25050 150 A 167
2014 12200 100 A 122
2015 23550 150 A 157
2016 16500 100 A 165
2017 25650 150 A 171
2018 19300 100 A 193
2019 26400 150 A 176
2020 19700 100 A 197
T-Yield = 130 Approved APH 174
Average Yield 163
Rate Yield 163

November 2020 FCIC-20220-1 18
Exhibit 5
Example APH Databases with Different Percentage of Trend-Adjusted Factor (Continued)
B. Example of APH database with 75 percent of Trend Adjustment
Step 1: The APH database for 0001-0002 has at least an actual yield in one of the four
most recent crop years, qualifying for trend adjustment.
Step 2: The APH database has three actual yields in the most recent 12 crop years;
therefore, the applicable trend adjustment percentage is 75 percent.
Step 3: 0.75 * 2 = 1.5
Step 4: (a) 2020: 2021 – 2020 = 1
(b) 2018: 2021 – 2018 = 3
(c) 2015: 2021 – 2015 = 6
(d) 2012: not eligible for trend
Step 5: (a) 2020: 1 * 1.5 = 1.5
(b) 2018: 3 * 1.5 = 4.5
(c) 2015: 6 * 1.5 = 9
(d) 2012: not eligible for trend
Step 6: (a) 2017: 148 + 1.5 = 149.5
(b) 2015: 152 + 4.5 = 156.5
(c) 2012: 145 + 9 = 154
(d) 2009: 130 + 0 = 130
Step 7: (150 + 157 + 154 + 130) / 4 = 148
Step 8: 148 < (152 + 2 = 154). Approved APH yield = 148.
Step 9: (148 + 152 + 145 + 130) / 4 = 144. APH yield without trend adjustment = 144.

November 2020 FCIC-20220-1 19
Exhibit 5
Example APH Databases with Different Percentage of Trend-Adjusted Factor (Continued)
B. Example of APH database with 75 percent of Trend Adjustment (Continued)
Resulting APH Database
2021 Corn
(0041)
NI
(003)
Grain
(016)
Unit # 0001-0002 OU
Year Production Acres Yield
2012 T 130
2013 Z
2014 Z
2015 11600 80 A 145
2016 Z
2017 Z
2018 12160 80 A 152
2019 Z
2020 11840 80 A 148
T-Yield = 130 Approved APH 148
Average APH 144
Rate Yield 144
C. Example of APH database with 50 percent of Trend Adjustment
Step 1: The APH database for 0001-0003 has at least an actual yield in one of the four
most recent crop years, qualifying for trend adjustment.
Step 2: The APH database has two actual yields in the most recent 12 crop years;
therefore, the applicable trend adjustment percentage is 50 percent.
Step 3: 0.50 * 2 = 1
Step 4: (a) 2020: 2021 – 2020 = 1
(b) 2017: 2021 – 2017 = 4
(c) 2007: 2021 – 2007 = 14
(d) 2005: 2021 – 2005 = 16
(e) 2002: 2021 – 2002= 19
Step 5: (a) 2020: 1 * 1 = 1
(b) 2017: 4 * 1 = 4
(c) 2007: 14 * 1 = 14
(d) 2005 16 * 1 = 16
(e) 2002: 19 * 1 = 19
Step 6: (a) 2020: 167 + 1 = 168

November 2020 FCIC-20220-1 20
Exhibit 5
Example APH Databases with Different Percentage of Trend-Adjusted Factor (Continued)
C. Example of APH database with 50 percent of Trend Adjustment (Continued)
Step 6: (Continued)
(b) 2017: 201 + 4 = 205
(c) 2007: 147 + 14 = 161
(d) 2005: 138 + 16 = 154
(e) 2002: 78 + 19 = 97 (78 is used due to YA election)
Step 7: (168 + 205 + 161 + 154 + 97) / 5 = 157
Step 8: 157 < (201 + 2 = 203). Approved APH yield = 157.
Step 9: (167 + 201 + 147 + 138 + 78) / 5 = 146. APH yield without trend adjustment =
146.
Resulting APH Database
2021 Corn
(0041)
NI
(003)
Grain
(016)
Unit # 0001-0003 OU
Year Production Acres Yield
2002 200 A 0
2005 27600 200 A 138
2007 29400 200 A 147
2014 Z
2015 Z
2016 Z
2017 40200 200 A 201
2018 Z
2019 Z
2020 33400 200 A 167
T-Yield = 130 Approved APH 157
Average Yield 131
Rate Yield 131
D. Example of APH database with 25 percent of Trend Adjustment
Step 1: The APH database for 0001-0004 has at least an actual yield in one of the four
most recent crop years, qualifying for trend adjustment.
Step 2: The APH database has one actual yield in the most recent 12 crop years;
therefore, the applicable trend adjustment percentage is 25 percent.
Step 3: 0.25 * 2 = 0.5

November 2020 FCIC-20220-1 21
Exhibit 5
Example APH Databases with Different Percentage of Trend-Adjusted Factor (Continued.)
D. Example of APH database with 25 percent of Trend Adjustment (Continued)
Step 4: (a) 2020: 2021 – 2020 = 1
(b) 2019: not eligible for trend
(c) 2018: not eligible for trend
(d) 2017: not eligible for trend
Step 5: (a) 2020: 1 * 0.5 = 0.5
(b) 2019: not eligible for trend
(c) 2018: not eligible for trend
(d) 2017: not eligible for trend
Step 6: (a) 2020: 146 + 0.5 = 146.5
(b) 2019: 130 + 0 = 130
(c) 2018: 130 + 0 = 130
(d) 2017: 130 + 0 = 130
Step 7: (147 + 130 + 130 + 130) / 4 = 134
Step 8: 134 < (146 + 2 = 148). Approved APH yield = 134.
Step 9: (146 + 130 + 130 + 130) / 4 = 134. APH yield without trend adjustment = 134.
Resulting APH Database
2021 Corn
(0041)
NI
(003)
Grain
(016)
Unit # 0001-0004 OU
Year Production Acres Yield
2017 T 130
2018 T 130
2019 T 130
2020 5840 40 A 146
T-Yield = 130 Approved APH 134
Average Yield 134
Rate Yield 134

November 2020 FCIC-20220-1 22
Exhibit 5
Example APH Databases with Different Percentage of Trend-Adjusted Factor (Continued)
E. Example of APH database with no Trend Adjustment
Step 1: The APH database for 0001-0005 does not have at least an actual yield in one of
the four most recent crop years; therefore, does not qualify for trend adjustment.
Resulting APH Database
2021 Corn
(0041)
NI
(003)
Grain
(016)
Unit # 0001-0005 OU
Year Production Acres Yield
2015 L 154
2016 L 154
2017 L 154
2018 L 154
2019 Z
2020 Z
T-Yield = 154 Approved APH 154
Average Yield 154
Rate Yield 154

November 2020 FCIC-20220-1 23
Exhibit 6
Example of APH Database With YE, YA and TA where TA limits the Approved APH Yield
The insured has elected Trend-Adjusted APH (TA) for soybeans in the county. The insured has OUs.
The county T-Yield is 29 bushels (60 percent of the T-Yield = 17) and the insured has elected yield
substitution (YA) and yield exclusion (YE). The trend adjustment from the actuarial documents for the
crop/county is 0.50 bushels a year. Crop year 2017 is eligible for yield exclusion for soybeans in the
county and the insured did not choose to opt-out of the exclusion. The APH database below is prior to
any trend adjustment or YE.
Original APH Database
2021 Soybeans
(0081)
Nfac (NI)
(053)
Commodity
(091)
Unit # 0001-0002 OU
Year Production Acres Yield
2015 0 0 T 29
2016 0 0 T 29
2017 600 100 A 6
2018 1400 100 A 14
T-Yield = 29 Approved APH 23
Average Yield 20
Rate Yield 20
Step 1: The APH database for 0001-0002 has one actual yield in one of the four most recent
crop years after yield exclusion (see Para. 4 D and 11), qualifying for trend
adjustment.
Step 2: The APH database has one actual yield in the most recent 12 crop years after yield
exclusion (see Para. 4D and 21B); therefore, the applicable trend adjustment
percentage is 25 percent.
Step 3: 0.50 * 0.25 = 0.125
Step 4: (a) 2018: 2021 – 2018 = 3
(b) 2017: not eligible for trend due to the actual yield is excluded for YE
(c) 2016: not eligible for trend
(d) 2015: not eligible for trend
Step 5: (a) 2018: 3 * 0.125 = 0.375
(b) 2017: not eligible for trend due to the actual yield is excluded for YE
(c) 2016: not eligible for trend
(d) 2015: not eligible for trend
Step 6: (a) 2018: 17 + 0.375 = 17.375 (17 is used due to YA election)
(b) 2017: 29 (29 is used due to YE causing less than 4 years of actuals in the APH
database and the APH database being completed with the T-Yield)
(c) 2016: 29 + 0 = 29
(d) 2015: 29 + 0 = 29

November 2020 FCIC-20220-1 24
Exhibit 6
Example of APH Database With …. where TA limits the Approved APH Yield (Continued)
Step 7: (17 + 29 + 29 + 29) / 4 = 26
Step 8: 26 > (14 + 2 = 16). Approved APH yield = 23.
Note: The TA limitation of the approved APH yield in Para. 21H limits the
approved APH yield to the highest actual yield in the APH database with
one year of trend adjustment; however, the approved APH yield will not be
less than the adjusted yield. Also, the approved APH yield was calculated
at 26 with TA, YA, and YE elected together, however, TA limited the
approved APH yield to the adjusted yield of 23.
Step 9: (17 + 17 + 29 + 29) / 4 = 23. APH yield without trend adjustment (adjusted yield) =
23.
Resulting APH Database
2021 Soybeans
(0081)
Nfac (NI)
(053)
Commodity
(091)
Unit # 0001-0002 OU
Year Production Acres Yield
2015 0 0 T 29
2016 0 0 T 29
2017 600 100 A 6
2018 1400 100 A 14
T-Yield = 29 Approved APH 23
Average Yield 20
Rate Yield 20

November 2020 FCIC-20220-1 25
Exhibit 7
Example of Approved APH Yield Calculation with YA, YE, TA and YC Elected
Cotton King County, TX 2021 T-Yield 278
Prior year’s approved APH yield: 501
T-Yields: 2018-2020=307
2012-2017=256
2011=213
Eligible yield exclusion years: 2019, 2018, 2016, 2014, 2011 (identified with *)
Trend adjustment: 4.4
Year Production Acres Yield
desc
Yield YA YE
Opt-out
TA
2011 187,846 566.4 A 332 * 376
2012 228,861 318.0 A 720 760
2013 48,341 324.5 A 149 154 189
2014 43,441 324.5 A 134 154 *
2015 177,521 318.5 A 557 583
2016 0 332.8 A 0 154 *
2017 0 332.8 A 0 154 172
2018 1,655 332.8 A 5 184 *
2019 0 0 Z 0 *
2020 92,447 328.4 A 282 286
Rate Yield = 242 Average Yield = 242
Adjusted Yield = 299 Prior Year’s Approved
APH Yield = 201
Approved APH Yield = 451
* - means year is eligible to be excluded if YE is elected
(1) Approved APH yield with YA: (332+720+154+154+557+154+154+184+282)/9=299
(2) Approved APH yield with YA and YE: (332+720+154+557+154+282)/6=367
(3) Approved APH yield YA, YE and TA: (376+760+189+583+172+286)/6=394
(4) Approved APH yield with YA, YE, TA and YC: 501*0.9=451
Note: The approved APH yield is equal to the cupped yield because insured elected YC, did
not opt-out of the cup applying to this APH database, and the cupped yield is higher
than approved APH calculated using YA, YE, and TA.
In this example, the YC option code must be identified on the P15 yield record transmitted to
RMA and the yield limitation flag (YLF) must be set to 09 (because YA was elected). If the
insured did not elect YA; the yield limitation flag must be set to 16 with the YC option code
identified on the P15 yield record.

November 2020 FCIC-20220-1 26
Exhibit 8
Example Trend-Adjusted APH Database with QL
Insured has produced wheat in a single basic unit (BU) APH database since 2017. The county T-Yield
is 66 bushels. For 2021, the insured has elected QL, and in the 2017 crop year they filed a NOL for the
quality loss that they experienced in that crop year. The insured has also elected Trend-Adjusted APH.
The trend adjustment for wheat in the insured’s county is 1. The insured provides an acceptable
production report in 2021 and APH database is updated.
Original APH database:
2021 Wheat
(0011)
NI
(003)
Unit # 0001-0000 BU
Year Prod. Acres Yield
2017 7,500 150 A 50
2018 9,300 100 A 93
2019 11,400 150 A 76
2020 9,700 100 A 97
T-Yield=66 Approved APH 79
Average Yield 79
Rate Yield 79
To calculate the approved APH yield using trend adjustment:
Step 1: The APH database has at least an actual yield in one of the four most recent crop years
qualifying for trend adjustment.
Step 2: The APH database has four actual yields in the most recent 12 crop years; therefore, the
applicable trend adjustment percentage is 100 percent.
Step 3: 1.00 * 2 = 2
Step 4: (a) 2020: 2021 - 2020 = 1
(b) 2019: 2021 - 2019 = 2
(c) 2018: 2021 - 2018 = 3
(d) 2017: 2021 - 2017 = 4
Step 5: (a) 2020: 1 * 1 = 1
(b) 2019: 2 * 1 = 2
(c) 2018: 3 * 1 = 3
(d) 2017: 4 * 1 = 4
Step 6: (a) 2020: 97 + 1 = 98
(b) 2019: 76 + 2 = 78
(c) 2018: 93 + 3 = 96
(d) 2017: 81 + 4 = 85 (81 is used due to QL election)
Step 7: (98 + 78 + 96 + 85) / 4 = 89

November 2020 FCIC-20220-1 27
Exhibit 8
Example Trend-Adjusted APH Database with QL (Continued)
Step 8: 89 < (97 + 1 = 98). Approved APH yield = 89.
Step 9: (97 + 76 + 93 + 50) / 4 = 79. APH yield without trend adjustment = 79.
Resulting APH Database
2021 Wheat
(0011)
NI
(003)
TA, QL
Unit # 0001-0000 BU
Year
Prod.
Pre-
Quality
Prod.
Acres
Yield
Pre-
Quality
Yield
2017 7,500 12,150 150 A 50 81
2018 9,300 100 A 93
2019 11,400 150 A 76
2020 9,700 100 A 97
T-Yield=66 Approved APH 89
Average Yield 79
Rate Yield 79