trends and changes affecting upstate new york · trends and changes affecting upstate new york...
TRANSCRIPT

Trends and Changes Affecting Upstate New York
David L. Brown & Robin Blakely-Armitage
State of Upstate Conference
June 8, 2011

Challenges & Opportunities
• Change, not stability, is the normal situation
– Some changes enhance opportunities
– Other changes pose challenges for people, communities, and regions

Demographic Changes are Fundamental
• Changes in: – Population size,
– Geographic distribution of population
– Socioeconomic composition of population
• Affect, and are affected by, most aspects of – Society
– Economy
– Natural environment
• But demography is not destiny

Some Major Changes in Upstate’s Demography
• Changes in Population Size between 1990-2010
• NYS grew by 7.7% – Most growth concentrated in downstate areas
• +1.197mil. (10.8%)
– Upstate • + 200,000 (2.9%)
• All upstate growth occurred in metro areas – Especially in their outlying counties
• Nonmetropolitan areas lost 100,000 persons – Mostly in counties with small to medium sized cities
– More rural counties held their own


Migration is a major component of
NYS population change • NYS receives and sends migrants both to/from other
parts of the US and internationally – International migration has been a source of population
growth for NYS • Slowed dramatically during the recession
– International migration gains are concentrated in downstate
– Upstate also has positive migration from abroad, but much more moderate
– Internal migration has been a source of NYS population loss • Net Domestic outmigration is much higher in downstate areas
• Upstate also lost more domestic migrants than it gained – but at much lower rates of loss than downstate

Migration is specific of certain ages
• Upstate has been losing young adults since the 1960s
Source: U.S. Decennial Censuses Age

The Aging of the baby boom in Upstate NYS
• NYS Median Age increased by 1.8 years since 2000
– More rapid aging in Upstate-- by 2.3 years
• Pct. 65+ reached 15% in 2010 in Upstate
– Estimated to reach 20% by 2030

NYS is ethnically & racially diverse
• NYS is much more diverse than upstate
– 15.2% African American vs. 7.8%
– 16.8% Hispanic vs. 4.9%
– 21.3% foreign born vs. 5.8%
• Upstate metropolitan areas are more diverse than nonmetropolitan areas
– BUT: the most highly rural areas are more diverse than small and medium sized cities

Changing Landscape of Diversity
• Hispanics are now the largest race/ethnic group in NYS
– In Upstate, African Americans still outnumber Hispanics
• But, Hispanic rate of growth > African American
• The vast majority of Upstate counties experienced Hispanic population growth
NYS County Percentage Change in Hispanic Population, 1990-2009
Source: Center for Disease Control, Race and Ethnicity dataset

Demography is Not Destiny
• Demographic changes can propel communities upward or downward – Can pose challenges
– Can enhance opportunities
• Impacts of population changes are not automatic – Mediated by
• Local social structure
• National and international environments in which they are embedded
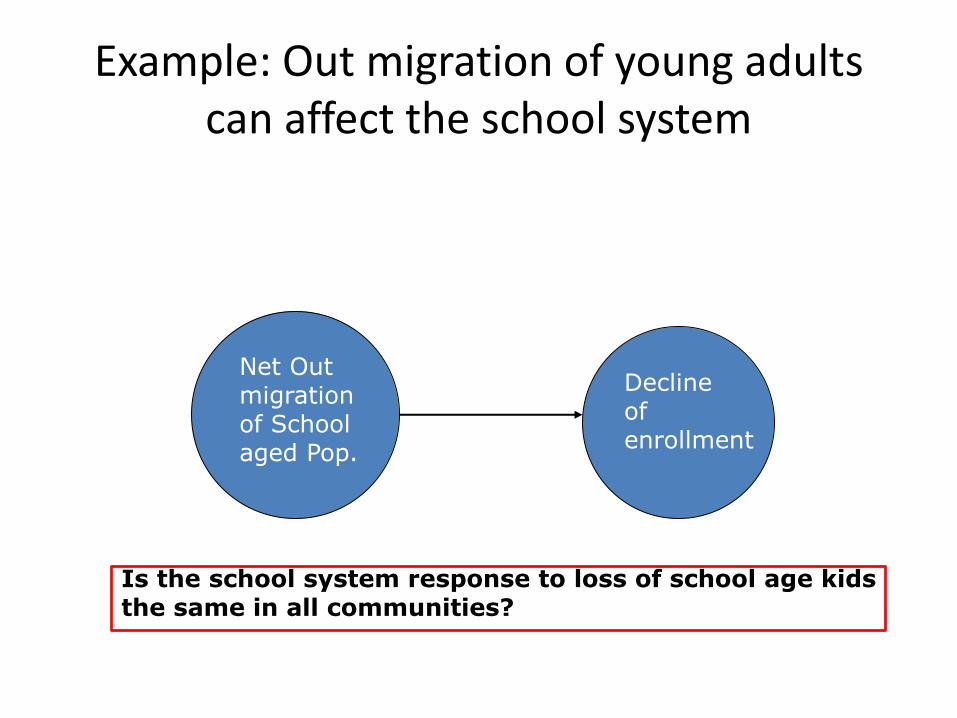
Example: Out migration of young adults can affect the school system
Net Out migration of School aged Pop.
Decline of enrollment
Is the school system response to loss of school age kids the same in all communities?

The impacts of Population change are mediated by social structure
Net Out migration of school age pop.
Net Out migration of school
age pop.
School Closure
School Remains open
Community A
Community B
• Consolidate • Share admin. services • Out-source special classes
•Economic resources •Leadership •Citizen mobilization • Technical know how
•Economic resources •Leadership •Citizen mobilization • Technical know how
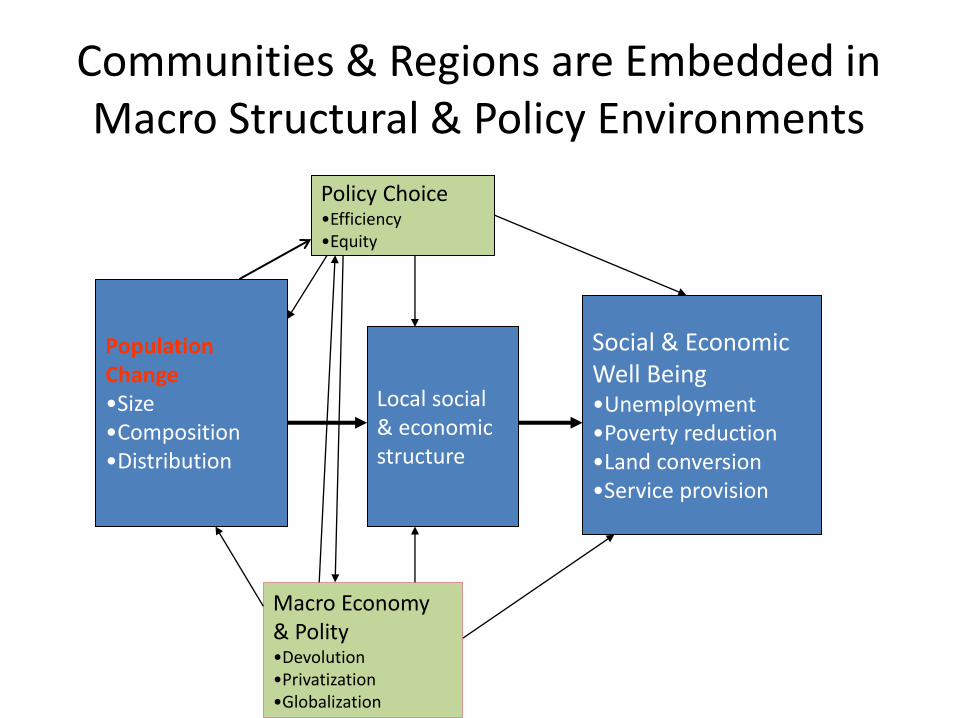
Communities & Regions are Embedded in Macro Structural & Policy Environments
Population Change •Size •Composition •Distribution
Social & Economic Well Being •Unemployment •Poverty reduction •Land conversion •Service provision
Local social & economic structure
Macro Economy & Polity •Devolution •Privatization •Globalization
Policy Choice •Efficiency •Equity

Opinions and Perspectives of Upstate New Yorkers

• In our chartbook we present both secondary data and survey data
– The survey data comes from our SOUS Survey – 600
Upstate NY households, randomly selected, 60 question phone interview
• Why both secondary data and survey data?
• Both have utility, value, and influence

What is the value of a survey of public opinion?
What is the impact of opinion on public policy?
In other words, should it matter what people think?

Why opinions are important to public policy
An article in Political Research Quarterly (March 2003 vol. 56 no. 1 29-40 ) showed:
– the impact of public opinion on public policy is substantial;
– Relevance/currency enhances the impact of public opinion on policy;
– the impact of opinion on policy remains strong even when the activities of political organizations and elites are taken into account;

What about secondary, or “hard” data? Can it influence opinion?
• Made-up Minds, by Chris Mooney (THE WEEK magazine, May 20, 2011, Volume 11, Issue 515 - originally appeared in Mother Jones).
• Some beliefs are so rooted in emotions that facts (data?) are often irrelevant.
• “Motivated Reasoning” helps explain why groups are still polarized over matters where the evidence is so unequivocal.
• Which is why using “evidence” and argument may backfire when attempting to persuade – people may actually hold only their views more strongly. Some examples are climate change, abortion, gun control, etc.
• “It would seem that expecting people to be convinced by the facts flies in the face of, you know, the facts.” (based on the research, that is)

So if “hard” data doesn’t always sway opinion, and opinions influence public policy, it is doubly
important to understand public opinion.
But let’s not discount or ignore the “hard” data.

We should use both opinions (survey data) and “hard data” (secondary sources) to understand the complexity of issues in
Upstate New York.
Some examples………

Economic Issues

Employment/unemployment
Unemployment shows significant variation by region. Among the Upstate regions, the North Country posts the highest unemployment as of June 2010, while the Capital Region shows the lowest. All regions report slight declines in unemployment between 2009 and 2010.
Unemployment Rates by NYS Region, June 2008, 2009, and 2010

What is the most important issue in the state and your community?
0%
5%
10%
15%
20%
25%
30%
35%
state
community
The “Economy” ranks highest on people’s minds, whether employment, taxes, economic “issues”, etc. At the community level, people are more concerned about employment, and less about taxes, budgets & local government.

How do you rank these 4 goals of local economic development?
0
10
20
30
40
50
60
70
80
90
100
creating local jobs increasing tax base reducing poverty improving thequality of life
Least Important
3rd
2nd
Most Important
Over 60% of respondents identify creating local jobs as most important goal of local economic development. While the other three goals are ranked equally in terms of “most important”, 40% of respondents said that reducing poverty was the least important goal.

Taxes
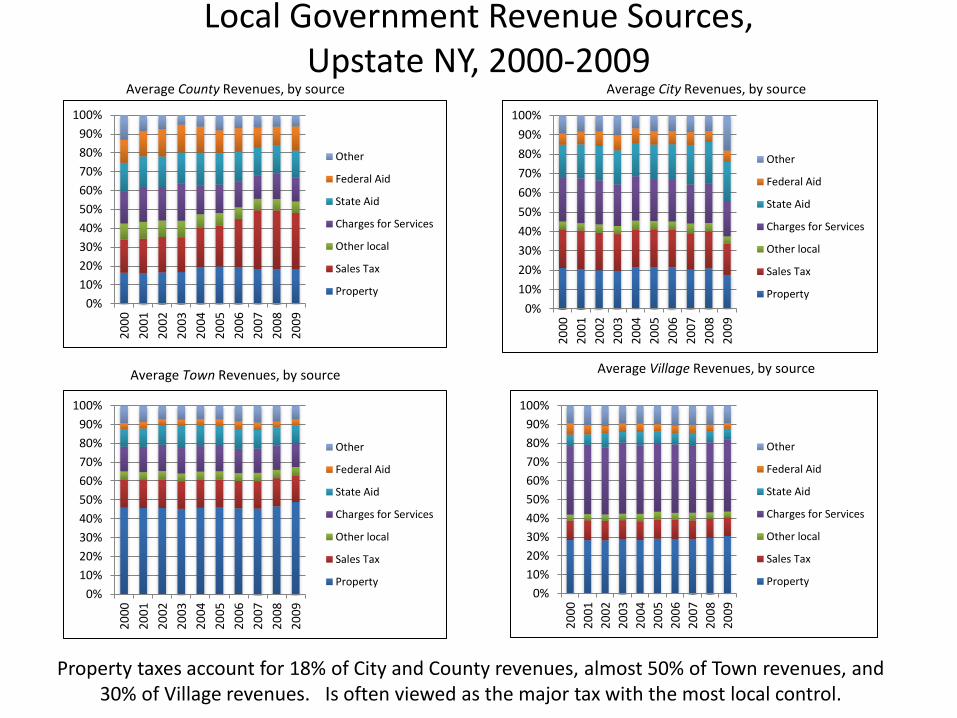
Local Government Revenue Sources, Upstate NY, 2000-2009
0%
10%
20%
30%
40%
50%
60%
70%
80%
90%
100%2
00
0
20
01
20
02
20
03
20
04
20
05
20
06
20
07
20
08
20
09
Other
Federal Aid
State Aid
Charges for Services
Other local
Sales Tax
Property
Average County Revenues, by source
0%
10%
20%
30%
40%
50%
60%
70%
80%
90%
100%
20
00
20
01
20
02
20
03
20
04
20
05
20
06
20
07
20
08
20
09
Other
Federal Aid
State Aid
Charges for Services
Other local
Sales Tax
Property
Average City Revenues, by source
0%
10%
20%
30%
40%
50%
60%
70%
80%
90%
100%
20
00
20
01
20
02
20
03
20
04
20
05
20
06
20
07
20
08
20
09
Other
Federal Aid
State Aid
Charges for Services
Other local
Sales Tax
Property
Average Town Revenues, by source
0%
10%
20%
30%
40%
50%
60%
70%
80%
90%
100%
20
00
20
01
20
02
20
03
20
04
20
05
20
06
20
07
20
08
20
09
Other
Federal Aid
State Aid
Charges for Services
Other local
Sales Tax
Property
Average Village Revenues, by source
Property taxes account for 18% of City and County revenues, almost 50% of Town revenues, and 30% of Village revenues. Is often viewed as the major tax with the most local control.

Specific tax identified as one of the most important issues facing NYS (24%)
0
10
20
30
40
50
60
70
80
90
100
Metropolitan Micropolitan Non Core
Other
Income tax
All taxes
School tax
Gas tax
Property tax
Property taxes are by far the most frequently cited tax (as an important issue), particularly among those living in non-core counties (50%).

0.0
5.0
10.0
15.0
20.0
25.0
30.0
35.0
40.0
Opposestrongly
Opposesomewhat
Neutral Supportsomewhat
SupportStrongly
Levels of support for proposed property tax cap of 2%
Support for Property tax caps
73% of respondents support property tax caps

0.0
5.0
10.0
15.0
20.0
25.0
30.0
35.0
40.0
Opposestrongly
Opposesomewhat
Neutral Supportsomewhat
SupportStrongly
Support or oppose propertytax cap of 2%?
Support or oppose propertytax cap if local services arereduced?
When faced with the prospect of generally reduced local services, support for tax caps declines.
Levels of support for proposed property tax cap, alone and if local government would need to reduce current level of services
Support for Property tax caps

Schools & Taxes

School Enrollment Declining
-16%
-14%
-12%
-10%
-8%
-6%
-4%
-2%
0%
2%
1997 1998 1999 2000 2001 2002 2003 2004 2005 2006 2007
NYS
Upstate
Metropolitan
Micropolitan
Non Core
Percent Change in Enrollment in Public Elementary and Secondary Schools, NYS by County Type: 1997-2007
Between 1997 and 2007 enrollment in Upstate public schools declined by 8% (a decline of more than 92,000 students), compared to a loss of 3.5% for the state as a whole (a decline of more than 98,000 students). Non-core counties lost over 11,000 public school students during this period, a loss of 12.6%. Metropolitan counties lost 55,000 students or a decline of 6.2%. As a percentage, declines were even more significant among districts in micropolitan counties, with enrollment declining by 14.6%, a loss of 26,300 students.

Expenditures per pupil increasing
Upstate New York public school districts are spending an ever increasing amount on their students (New York State has consistently been in the top three of all states in per-pupil spending and led the nation in 2010).
In 2000, the vast majority of upstate districts spent between $10,000 and $15,000 per pupil. By 2008, most districts were spending significantly more per pupil at a pace far exceeding inflation. Several district in the Adirondacks were spending more than $30,000 per student, and in two cases were spending about $55,000 per pupil. There is also a
cluster of districts in the Sullivan and Ulster County areas that are spending substantially more than the state average per pupil.
Expenditures per pupil 2000 Expenditures per pupil 2008

Support for property tax limits with specific impacts on schools
0.0
5.0
10.0
15.0
20.0
25.0
30.0
35.0
40.0
Opposestrongly
Opposesomewhat
Neutral Supportsomewhat
SupportStrongly
Support or oppose property taxcap of 2%?
Support or oppose property taxcap if local services are reduced?
We saw the “conditional attitudes” on levels of support for the property tax cap.

Support for property tax limits with specific impacts on schools
0.0
5.0
10.0
15.0
20.0
25.0
30.0
35.0
40.0
Opposestrongly
Opposesomewhat
Neutral Supportsomewhat
SupportStrongly
Support or oppose property taxcap of 2%?
Support or oppose property taxcap if local services are reduced?
support of oppose property taxcap if local school budget is cut
Support for tax cap declines further when faced with
cuts to school budgets.

Support for property tax limits with specific impacts on schools
0.0
5.0
10.0
15.0
20.0
25.0
30.0
35.0
40.0
Opposestrongly
Opposesomewhat
Neutral Supportsomewhat
SupportStrongly
Support or oppose property taxcap of 2%?
Support or oppose property taxcap if local services are reduced?
support of oppose property taxcap if local school budget is cut
Support or oppose merging localschools to reduce property tax
But there is also
significant support to merging
neighboring districts if property taxes are
reduced.

Poverty

Percent of People of all ages in poverty ‐ 2000‐2008
0
5
10
15
20
25
2000 2001 2002 2003 2004 2005 2006 2007 2008
New York
Upstate
Metropolitan
Micropolitan
Non Core
Poverty has increased across the board in New York State. Upstate New York’s poverty rate increased from about 11 percent in the year 2000 to about 13 percent in 2008. The percent of children in poverty in Upstate has also increased since 2000, to almost 18% in 2008. Particularly high rates are noted among non-core and micropolitan county children (around 20%).
Trends in Poverty Rates
0
5
10
15
20
25
2000 2001 2002 2003 2004 2005 2006 2007 2008
New York
Upstate
Metropolitan
Micropolitan
Non Core
Percent of Children (<18 yrs) in poverty ‐ 2000‐2008

• Public policies for assisting lower income individuals and families are received with varying degrees of support.
• Public sentiment towards whether poor people are “deserving” or not of government assistance often weighs heavily into these levels of support or opposition.

Which is the bigger cause of poverty today?
60% of Upstate New Yorkers believe poverty is largely due to circumstances beyond people’s control, and 40% believe it is due to poor people not doing enough to help themselves.
circumstances beyond one'scontrol
poor people not doing enoughto help themselves

If poverty is due to poor people not doing enough to help themselves, please tell us what
you mean…..
0
10
20
30
40
50
60
70
80
90
100
Metropolitan Micropolitan Non Core
Other
Unwilling to take availablejobs
Lack of education
Abuse of govt. programs
People are lazy
Among those believing poverty is caused by poor people not doing enough, the main reasons cited were that poor people are lazy and the abuse of government programs.

If poverty is due to circumstances beyond poor people’s control, please tell us what you
mean…..
0
10
20
30
40
50
60
70
80
90
100
Metropolitan Micropolitan Non Core
Other
Not enoughgovernmenthelpJobs outsourced
Poor economicconditions
Lack of jobs
Lack of jobs, poor economic conditions, and the outsourcing
of jobs accounted for the majority of reasons identified why people felt poverty was
due to circumstances beyond poor people’s control.

• Issues are often more complex than either the secondary data or the survey data can convey on their own.
• Best used in combination.

We view you, the presenters and participants, as another source of
valuable data.
• Experiences, Perspectives, Practices, Values, Paradigms, Research, Local innovation, etc.
• Combining these different data and having engaged discussions in our workshops is a major goal of this conference.

Intended outcomes of these discussions are strengthened partnerships, examples of local
resiliency and innovation, and the identification of future research, policy, and practice.