trends and impacts of staple food prices in vulnerable
TRANSCRIPT
This bulletin examines trends in staple food and fuel prices, the cost of the basic food basket and consumer price indices for 69 countries in the second quarter of 2017 (April to June).1 The maps on pages 6–7 provide impact analysis disaggregated to sub-national level.
Figh
ting
Hun
ger
Wor
ldw
ide
Issue 36 I July 2017
1. Data were collected and collated by WFP country offices and are available at http://foodprices.vam.wfp.org. Additional data sources are FAO Food Price Index, FAO/GIEWS Food Price Data and Analysis Tool, and IMF Primary Commodity Prices as on 17 July 2017.
2. Nominal prices are adjusted by the US Consumer Price Index.3. A market is designated as a hotspot if prices for the country’s two most important caloric contributors reached ALPS crisis level during Q2-2017, and
they did not return to normal levels by the end of the quarter. Note that for some markets/countries, prices are monitored but the price series may not necessarily qualify for ALPS calculation see the Price Forecasts & Alerts website for details).
Global Highlights•The Q2 average of the FAO global food price index
is 9 percent higher than in Q2-2016. The FAO cereal price index rose by 7 percent over the previous quarter, particularly because of price increases for wheat and rice.
•The real price2 of wheat rose by 3 percent compared with the previous quarter. Despite increases in 2017 – especially recently – prices are still at low levels thanks to abundant world supplies.
•The real price of maize dropped 10 percent in Q2-2017 compared with the same period in 2016. Because of bumper harvests in the southern hemisphere, supplies are ample and markets are expected to remain calm.
•During Q2-2017, the real price of rice increased by 11 percent compared with Q1-2017. Although prices are 1 percent lower than in Q2-2016, strong international demand has pushed prices up in the past quarter.
•The real price of crude oil decreased an average 4 percent in Q2-2017 and is still at low levels; it is, however, 7 percent higher than in Q2-2016.
•The cost of the basic food basket increased severely (>10%) in Q2-2017 in three countries: Congo, Niger and Uganda. High increases (5–10%) were seen in Central African Republic, Chad, Guinea, Iran, Kenya, Kyrgyz Republic, Somalia, Thailand and Ukraine. In the other monitored countries, the change was moderate or low (<5%).
• Price spikes, as monitored by ALPS, were detected in 23 countries, particularly in Burundi, Congo, Ghana, Haiti, Malawi, Niger, Somalia, South Sudan, Sudan, Tanzania and Zambia (see the map below).3 These spikes indicate Crisis levels for the two most important staples in each country, which could be beans, cassava, maize, milk, millet, oil, rice, sorghum, sweet potatoes or wheat.
The Market Monitor Trends and impacts of staple food prices in vulnerable countries
Food Price Hotspots
CHANGES OF REAL PRICES 2Quarterly Changeq2-2017 vs. q1-2017q2-2017 vs. q2-2016q2-2017 vs. q1-2008q2-2017 vs. q2-2008
Maize-1%
-10%
-46%
Wheat3%
-9%-65%
Rice11%-1%
-62%
Note: Comparison toFirst quarter in 2017Same quarter in 2016Global wheat price peak in 2008Global maize and rice price peak in 2008
The Market Monitor Trends and impacts of staple food prices in vulnerable countries
2
Impact Codes (q/q) Low (< 0%) Moderate (0-5%) High (5-10%) Severe (> 10%)
Price trends and impacts by region (Change from last quarter)
Latin America and Caribbean
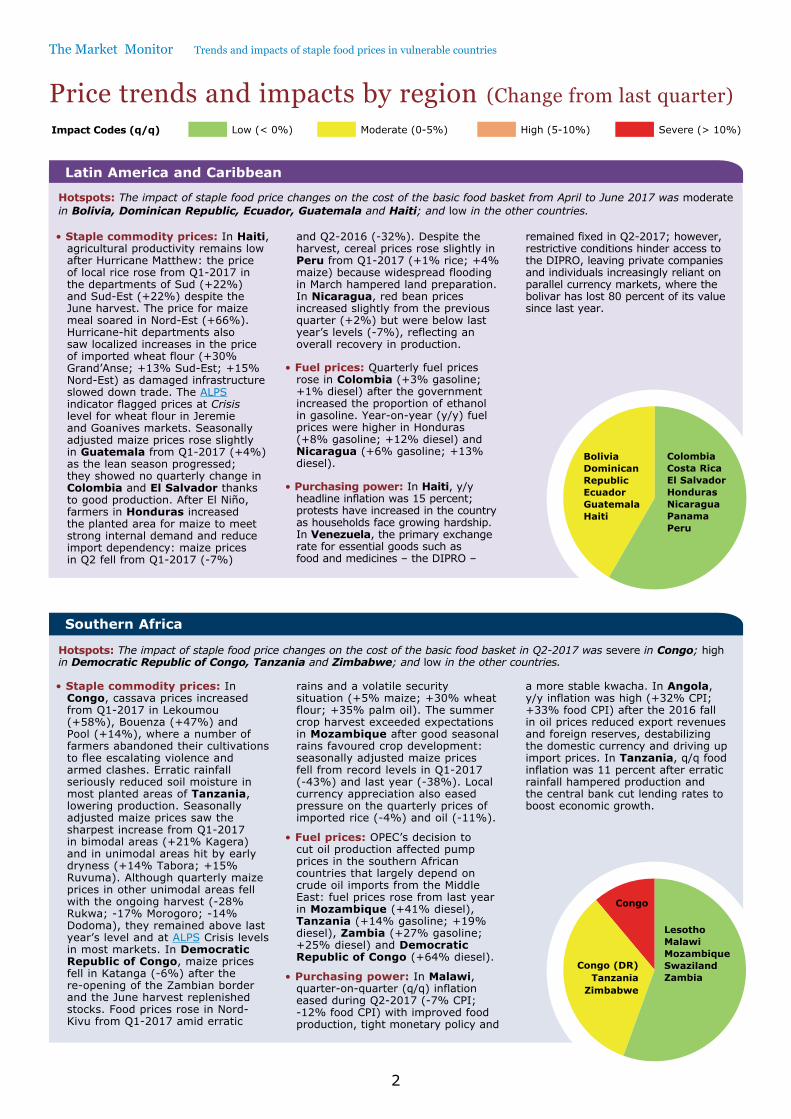
Hotspots: The impact of staple food price changes on the cost of the basic food basket from April to June 2017 was moderate in Bolivia, Dominican Republic, Ecuador, Guatemala and Haiti; and low in the other countries.
• Staple commodity prices: In Haiti, agricultural productivity remains low after Hurricane Matthew: the price of local rice rose from Q1-2017 in the departments of Sud (+22%) and Sud-Est (+22%) despite the June harvest. The price for maize meal soared in Nord-Est (+66%). Hurricane-hit departments also saw localized increases in the price of imported wheat flour (+30% Grand’Anse; +13% Sud-Est; +15% Nord-Est) as damaged infrastructure slowed down trade. The ALPS indicator flagged prices at Crisis level for wheat flour in Jeremie and Goanives markets. Seasonally adjusted maize prices rose slightly in Guatemala from Q1-2017 (+4%) as the lean season progressed; they showed no quarterly change in Colombia and El Salvador thanks to good production. After El Niño, farmers in Honduras increased the planted area for maize to meet strong internal demand and reduce import dependency: maize prices in Q2 fell from Q1-2017 (-7%)
and Q2-2016 (-32%). Despite the harvest, cereal prices rose slightly in Peru from Q1-2017 (+1% rice; +4% maize) because widespread flooding in March hampered land preparation. In Nicaragua, red bean prices increased slightly from the previous quarter (+2%) but were below last year’s levels (-7%), reflecting an overall recovery in production.
• Fuel prices: Quarterly fuel prices rose in Colombia (+3% gasoline; +1% diesel) after the government increased the proportion of ethanol in gasoline. Year-on-year (y/y) fuel prices were higher in Honduras (+8% gasoline; +12% diesel) and Nicaragua (+6% gasoline; +13% diesel).
• Purchasing power: In Haiti, y/y headline inflation was 15 percent; protests have increased in the country as households face growing hardship. In Venezuela, the primary exchange rate for essential goods such as food and medicines – the DIPRO –
remained fixed in Q2-2017; however, restrictive conditions hinder access to the DIPRO, leaving private companies and individuals increasingly reliant on parallel currency markets, where the bolivar has lost 80 percent of its value since last year.
ColombiaCosta RicaEl SalvadorHondurasNicaraguaPanamaPeru
BoliviaDominican RepublicEcuadorGuatemalaHaiti
Southern Africa
Hotspots: The impact of staple food price changes on the cost of the basic food basket in Q2-2017 was severe in Congo; high in Democratic Republic of Congo, Tanzania and Zimbabwe; and low in the other countries.
• Staple commodity prices: In Congo, cassava prices increased from Q1-2017 in Lekoumou (+58%), Bouenza (+47%) and Pool (+14%), where a number of farmers abandoned their cultivations to flee escalating violence and armed clashes. Erratic rainfall seriously reduced soil moisture in most planted areas of Tanzania, lowering production. Seasonally adjusted maize prices saw the sharpest increase from Q1-2017 in bimodal areas (+21% Kagera) and in unimodal areas hit by early dryness (+14% Tabora; +15% Ruvuma). Although quarterly maize prices in other unimodal areas fell with the ongoing harvest (-28% Rukwa; -17% Morogoro; -14% Dodoma), they remained above last year’s level and at ALPS Crisis levels in most markets. In Democratic Republic of Congo, maize prices fell in Katanga (-6%) after the re-opening of the Zambian border and the June harvest replenished stocks. Food prices rose in Nord-Kivu from Q1-2017 amid erratic
rains and a volatile security situation (+5% maize; +30% wheat flour; +35% palm oil). The summer crop harvest exceeded expectations in Mozambique after good seasonal rains favoured crop development: seasonally adjusted maize prices fell from record levels in Q1-2017 (-43%) and last year (-38%). Local currency appreciation also eased pressure on the quarterly prices of imported rice (-4%) and oil (-11%).
• Fuel prices: OPEC’s decision to cut oil production affected pump prices in the southern African countries that largely depend on crude oil imports from the Middle East: fuel prices rose from last year in Mozambique (+41% diesel), Tanzania (+14% gasoline; +19% diesel), Zambia (+27% gasoline; +25% diesel) and Democratic Republic of Congo (+64% diesel).
• Purchasing power: In Malawi, quarter-on-quarter (q/q) inflation eased during Q2-2017 (-7% CPI; -12% food CPI) with improved food production, tight monetary policy and
a more stable kwacha. In Angola, y/y inflation was high (+32% CPI; +33% food CPI) after the 2016 fall in oil prices reduced export revenues and foreign reserves, destabilizing the domestic currency and driving up import prices. In Tanzania, q/q food inflation was 11 percent after erratic rainfall hampered production and the central bank cut lending rates to boost economic growth.
Congo (DR)Tanzania
Zimbabwe
Congo
LesothoMalawiMozambiqueSwazilandZambia
Issue 36 I July 2017
3
Central and Eastern Africa
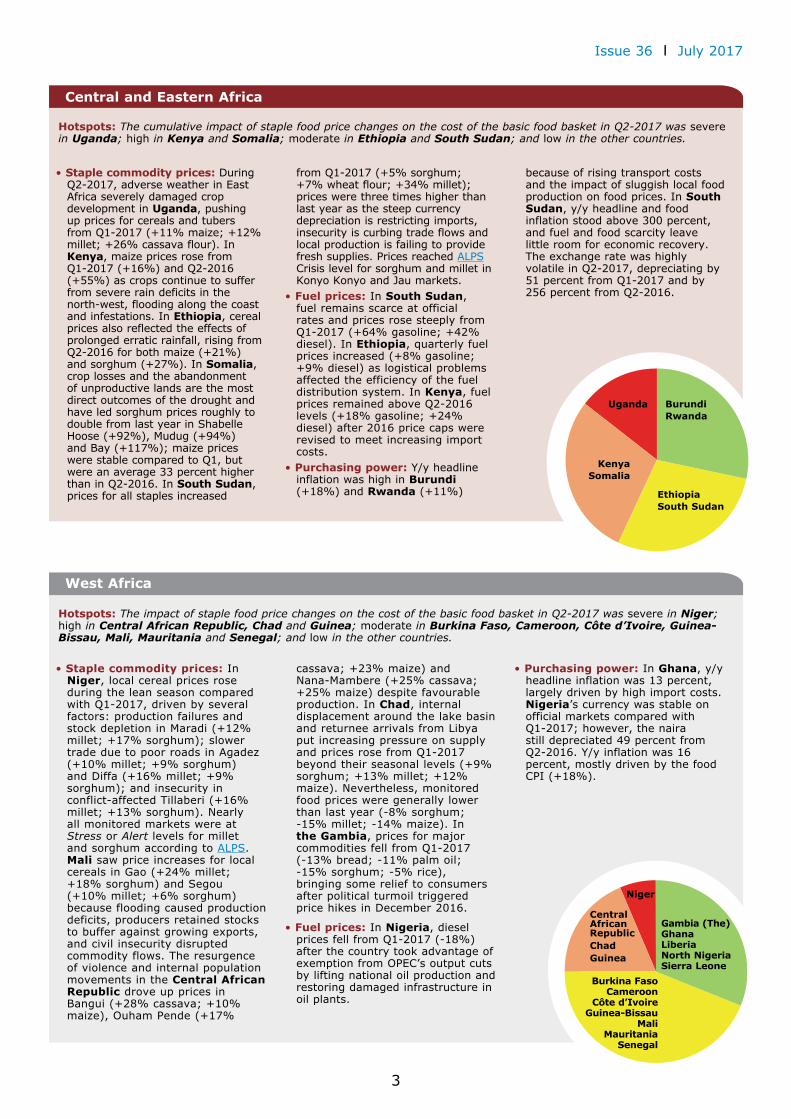
Hotspots: The cumulative impact of staple food price changes on the cost of the basic food basket in Q2-2017 was severe in Uganda; high in Kenya and Somalia; moderate in Ethiopia and South Sudan; and low in the other countries.
• Staple commodity prices: During Q2-2017, adverse weather in East Africa severely damaged crop development in Uganda, pushing up prices for cereals and tubers from Q1-2017 (+11% maize; +12% millet; +26% cassava flour). In Kenya, maize prices rose from Q1-2017 (+16%) and Q2-2016 (+55%) as crops continue to suffer from severe rain deficits in the north-west, flooding along the coast and infestations. In Ethiopia, cereal prices also reflected the effects of prolonged erratic rainfall, rising from Q2-2016 for both maize (+21%) and sorghum (+27%). In Somalia, crop losses and the abandonment of unproductive lands are the most direct outcomes of the drought and have led sorghum prices roughly to double from last year in Shabelle Hoose (+92%), Mudug (+94%) and Bay (+117%); maize prices were stable compared to Q1, but were an average 33 percent higher than in Q2-2016. In South Sudan, prices for all staples increased
from Q1-2017 (+5% sorghum; +7% wheat flour; +34% millet); prices were three times higher than last year as the steep currency depreciation is restricting imports, insecurity is curbing trade flows and local production is failing to provide fresh supplies. Prices reached ALPS Crisis level for sorghum and millet in Konyo Konyo and Jau markets.
• Fuel prices: In South Sudan, fuel remains scarce at official rates and prices rose steeply from Q1-2017 (+64% gasoline; +42% diesel). In Ethiopia, quarterly fuel prices increased (+8% gasoline; +9% diesel) as logistical problems affected the efficiency of the fuel distribution system. In Kenya, fuel prices remained above Q2-2016 levels (+18% gasoline; +24% diesel) after 2016 price caps were revised to meet increasing import costs.
• Purchasing power: Y/y headline inflation was high in Burundi (+18%) and Rwanda (+11%)
because of rising transport costs and the impact of sluggish local food production on food prices. In South Sudan, y/y headline and food inflation stood above 300 percent, and fuel and food scarcity leave little room for economic recovery. The exchange rate was highly volatile in Q2-2017, depreciating by 51 percent from Q1-2017 and by 256 percent from Q2-2016.
BurundiRwanda
EthiopiaSouth Sudan
KenyaSomalia
Uganda
West Africa
Hotspots: The impact of staple food price changes on the cost of the basic food basket in Q2-2017 was severe in Niger; high in Central African Republic, Chad and Guinea; moderate in Burkina Faso, Cameroon, Côte d’Ivoire, Guinea-Bissau, Mali, Mauritania and Senegal; and low in the other countries.
• Staple commodity prices: In Niger, local cereal prices rose during the lean season compared with Q1-2017, driven by several factors: production failures and stock depletion in Maradi (+12% millet; +17% sorghum); slower trade due to poor roads in Agadez (+10% millet; +9% sorghum) and Diffa (+16% millet; +9% sorghum); and insecurity in conflict-affected Tillaberi (+16% millet; +13% sorghum). Nearly all monitored markets were at Stress or Alert levels for millet and sorghum according to ALPS. Mali saw price increases for local cereals in Gao (+24% millet; +18% sorghum) and Segou (+10% millet; +6% sorghum) because flooding caused production deficits, producers retained stocks to buffer against growing exports, and civil insecurity disrupted commodity flows. The resurgence of violence and internal population movements in the Central African Republic drove up prices in Bangui (+28% cassava; +10% maize), Ouham Pende (+17%
cassava; +23% maize) and Nana-Mambere (+25% cassava; +25% maize) despite favourable production. In Chad, internal displacement around the lake basin and returnee arrivals from Libya put increasing pressure on supply and prices rose from Q1-2017 beyond their seasonal levels (+9% sorghum; +13% millet; +12% maize). Nevertheless, monitored food prices were generally lower than last year (-8% sorghum; -15% millet; -14% maize). In the Gambia, prices for major commodities fell from Q1-2017 (-13% bread; -11% palm oil; -15% sorghum; -5% rice), bringing some relief to consumers after political turmoil triggered price hikes in December 2016.
• Fuel prices: In Nigeria, diesel prices fell from Q1-2017 (-18%) after the country took advantage of exemption from OPEC’s output cuts by lifting national oil production and restoring damaged infrastructure in oil plants.
• Purchasing power: In Ghana, y/y headline inflation was 13 percent, largely driven by high import costs. Nigeria’s currency was stable on official markets compared with Q1-2017; however, the naira still depreciated 49 percent from Q2-2016. Y/y inflation was 16 percent, mostly driven by the food CPI (+18%).
Niger
Central African RepublicChadGuinea
Gambia (The)GhanaLiberiaNorth NigeriaSierra Leone
Burkina FasoCameroon
Côte d’IvoireGuinea-Bissau
MaliMauritania
Senegal
The Market Monitor Trends and impacts of staple food prices in vulnerable countries
4
Middle East, North Africa and Central Asia
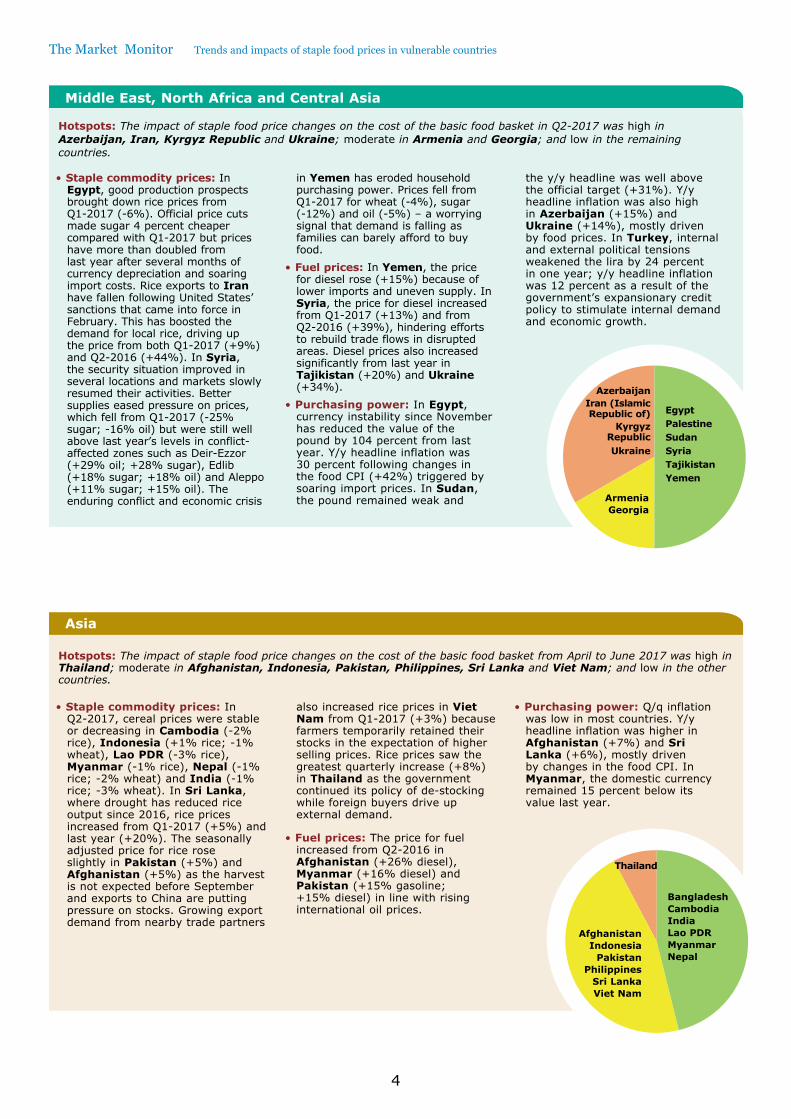
Hotspots: The impact of staple food price changes on the cost of the basic food basket in Q2-2017 was high in Azerbaijan, Iran, Kyrgyz Republic and Ukraine; moderate in Armenia and Georgia; and low in the remaining countries.
• Staple commodity prices: In Egypt, good production prospects brought down rice prices from Q1-2017 (-6%). Official price cuts made sugar 4 percent cheaper compared with Q1-2017 but prices have more than doubled from last year after several months of currency depreciation and soaring import costs. Rice exports to Iran have fallen following United States’ sanctions that came into force in February. This has boosted the demand for local rice, driving up the price from both Q1-2017 (+9%) and Q2-2016 (+44%). In Syria, the security situation improved in several locations and markets slowly resumed their activities. Better supplies eased pressure on prices, which fell from Q1-2017 (-25% sugar; -16% oil) but were still well above last year’s levels in conflict-affected zones such as Deir-Ezzor (+29% oil; +28% sugar), Edlib (+18% sugar; +18% oil) and Aleppo (+11% sugar; +15% oil). The enduring conflict and economic crisis
in Yemen has eroded household purchasing power. Prices fell from Q1-2017 for wheat (-4%), sugar (-12%) and oil (-5%) – a worrying signal that demand is falling as families can barely afford to buy food.
• Fuel prices: In Yemen, the price for diesel rose (+15%) because of lower imports and uneven supply. In Syria, the price for diesel increased from Q1-2017 (+13%) and from Q2-2016 (+39%), hindering efforts to rebuild trade flows in disrupted areas. Diesel prices also increased significantly from last year in Tajikistan (+20%) and Ukraine (+34%).
• Purchasing power: In Egypt, currency instability since November has reduced the value of the pound by 104 percent from last year. Y/y headline inflation was 30 percent following changes in the food CPI (+42%) triggered by soaring import prices. In Sudan, the pound remained weak and
the y/y headline was well above the official target (+31%). Y/y headline inflation was also high in Azerbaijan (+15%) and Ukraine (+14%), mostly driven by food prices. In Turkey, internal and external political tensions weakened the lira by 24 percent in one year; y/y headline inflation was 12 percent as a result of the government’s expansionary credit policy to stimulate internal demand and economic growth.
Asia
• Staple commodity prices: In Q2-2017, cereal prices were stable or decreasing in Cambodia (-2% rice), Indonesia (+1% rice; -1% wheat), Lao PDR (-3% rice), Myanmar (-1% rice), Nepal (-1% rice; -2% wheat) and India (-1% rice; -3% wheat). In Sri Lanka, where drought has reduced rice output since 2016, rice prices increased from Q1-2017 (+5%) and last year (+20%). The seasonally adjusted price for rice rose slightly in Pakistan (+5%) and Afghanistan (+5%) as the harvest is not expected before September and exports to China are putting pressure on stocks. Growing export demand from nearby trade partners
also increased rice prices in Viet Nam from Q1-2017 (+3%) because farmers temporarily retained their stocks in the expectation of higher selling prices. Rice prices saw the greatest quarterly increase (+8%) in Thailand as the government continued its policy of de-stocking while foreign buyers drive up external demand.
• Fuel prices: The price for fuel increased from Q2-2016 in Afghanistan (+26% diesel), Myanmar (+16% diesel) and Pakistan (+15% gasoline; +15% diesel) in line with rising international oil prices.
• Purchasing power: Q/q inflation was low in most countries. Y/y headline inflation was higher in Afghanistan (+7%) and Sri Lanka (+6%), mostly driven by changes in the food CPI. In Myanmar, the domestic currency remained 15 percent below its value last year.
Hotspots: The impact of staple food price changes on the cost of the basic food basket from April to June 2017 was high in Thailand; moderate in Afghanistan, Indonesia, Pakistan, Philippines, Sri Lanka and Viet Nam; and low in the other countries.
AzerbaijanIran (Islamic Republic of)
Kyrgyz RepublicUkraine
ArmeniaGeorgia
EgyptPalestineSudanSyriaTajikistanYemen
BangladeshCambodiaIndiaLao PDRMyanmarNepal
AfghanistanIndonesia
PakistanPhilippines
Sri LankaViet Nam
Thailand
Issue 36 I July 2017
5
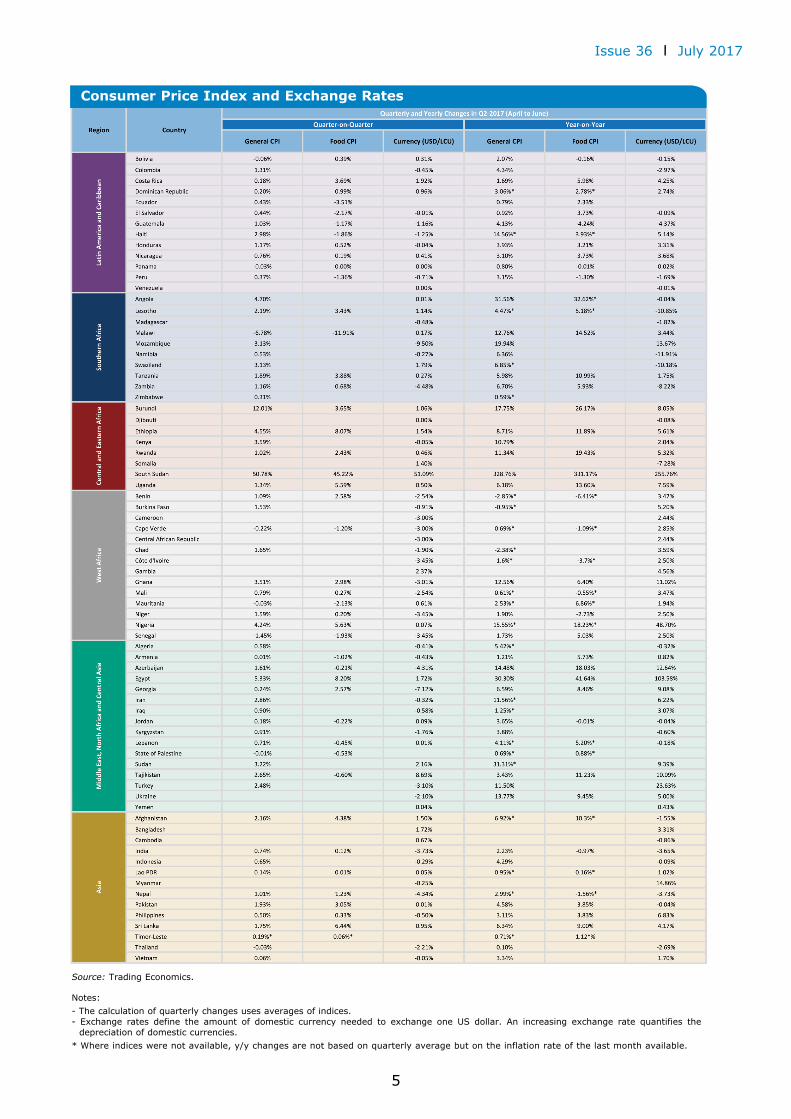
Consumer Price Index and Exchange Rates
Source: Trading Economics.
Notes: - The calculation of quarterly changes uses averages of indices. - Exchange rates define the amount of domestic currency needed to exchange one US dollar. An increasing exchange rate quantifies the
depreciation of domestic currencies.* Where indices were not available, y/y changes are not based on quarterly average but on the inflation rate of the last month available.
The Market M
onitor Trends and impacts of staple food prices in vulnerable countries
6
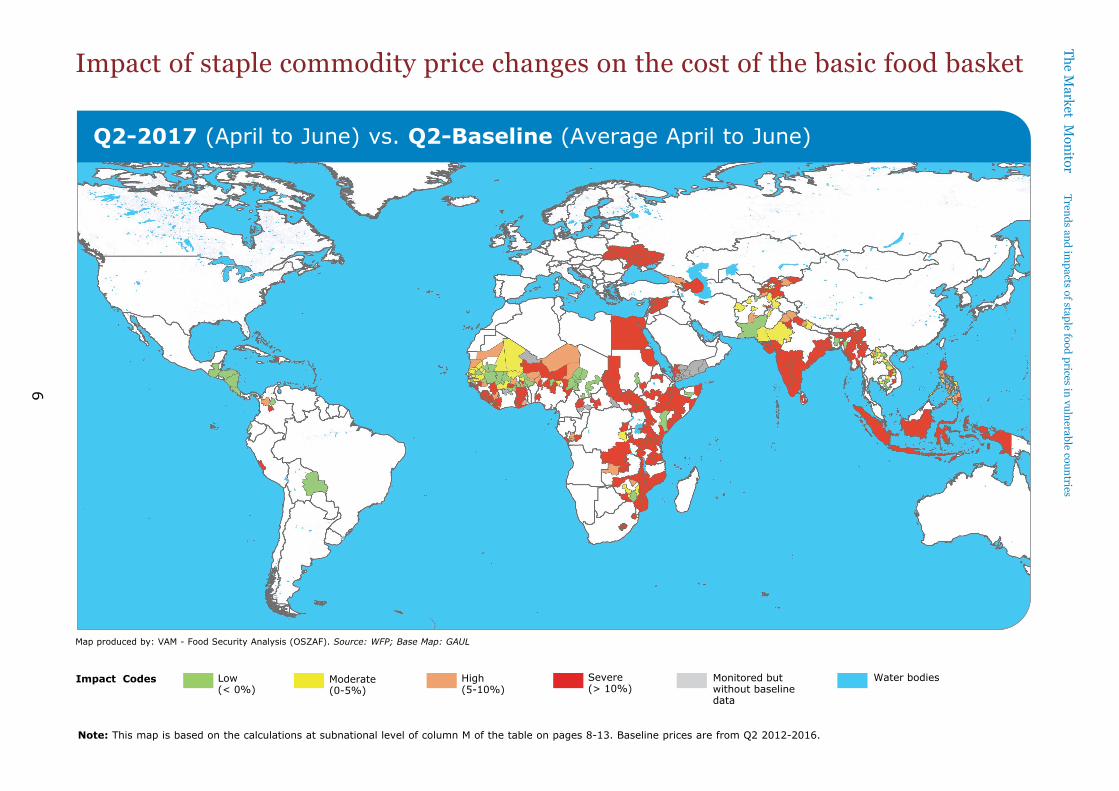
Q2-2017 (April to June) vs. Q2-Baseline (Average April to June)
Note: This map is based on the calculations at subnational level of column M of the table on pages 8-13. Baseline prices are from Q2 2012-2016.
Impact Codes Low (< 0%)
Moderate (0-5%)
Monitored but without baseline data
Water bodiesSevere (> 10%)
High (5-10%)
Impact of staple commodity price changes on the cost of the basic food basket
Map produced by: VAM - Food Security Analysis (OSZAF). Source: WFP; Base Map: GAUL
Issue 36 I July 2017
7
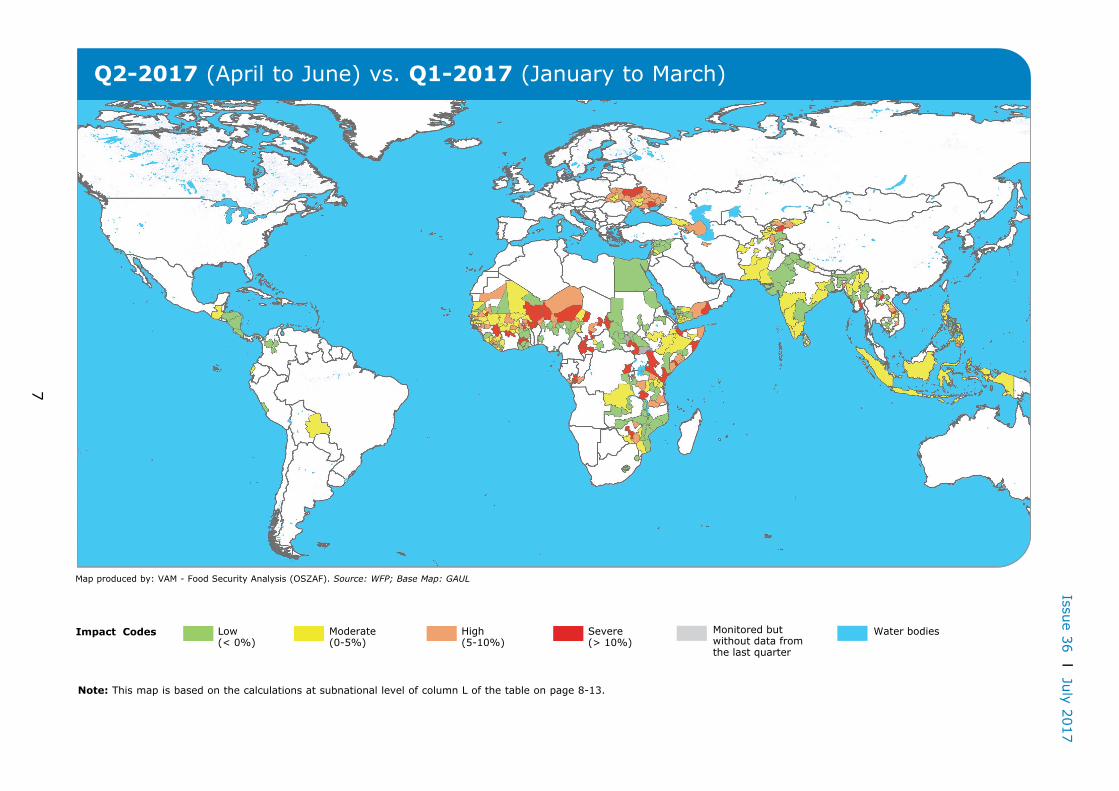
Monitored but without data from the last quarter
Water bodies
Q2-2017 (April to June) vs. Q1-2017 (January to March)
Note: This map is based on the calculations at subnational level of column L of the table on page 8-13.
Impact Codes Low (< 0%)
Moderate (0-5%)
Severe (> 10%)
High (5-10%)
Map produced by: VAM - Food Security Analysis (OSZAF). Source: WFP; Base Map: GAUL
The Market M
onitor Trends and impacts of staple food prices in vulnerable countries
8
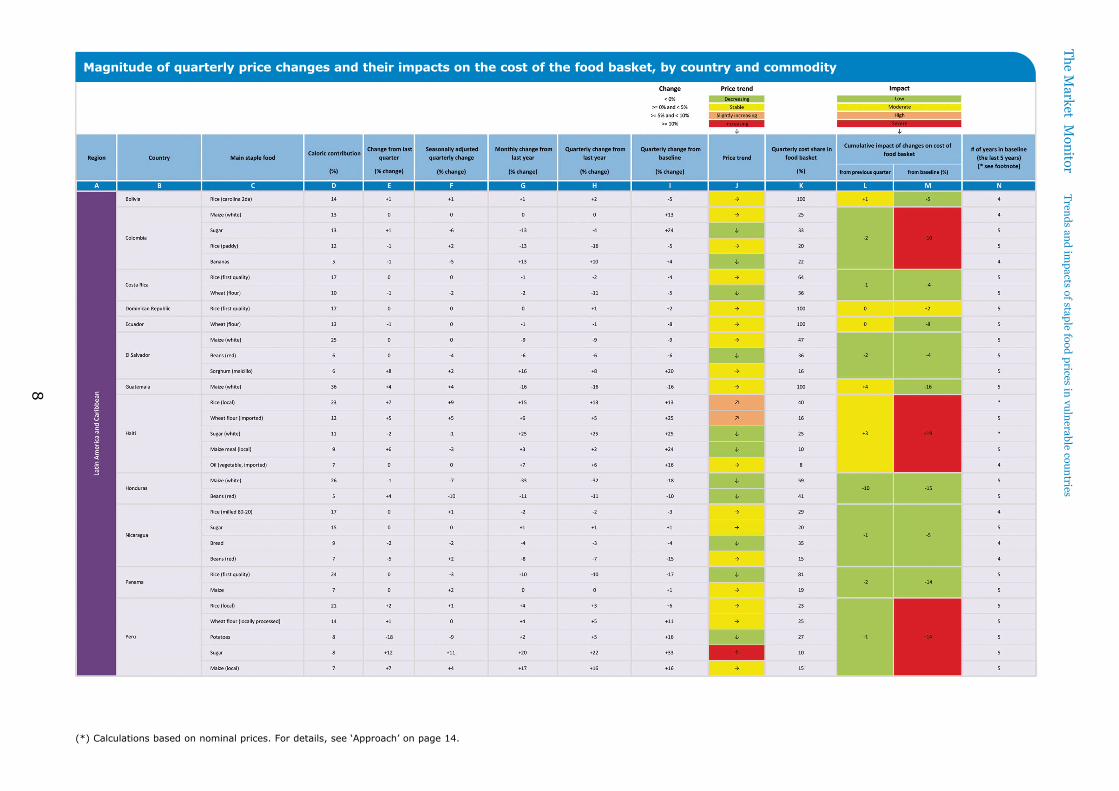
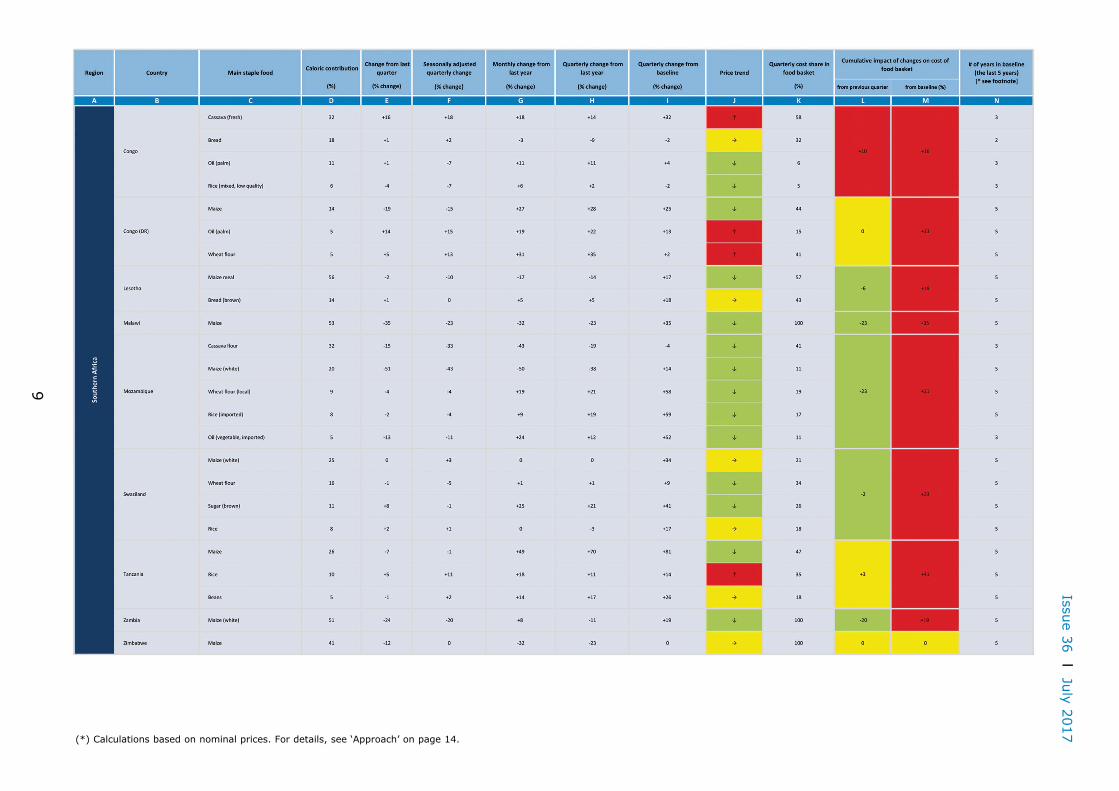
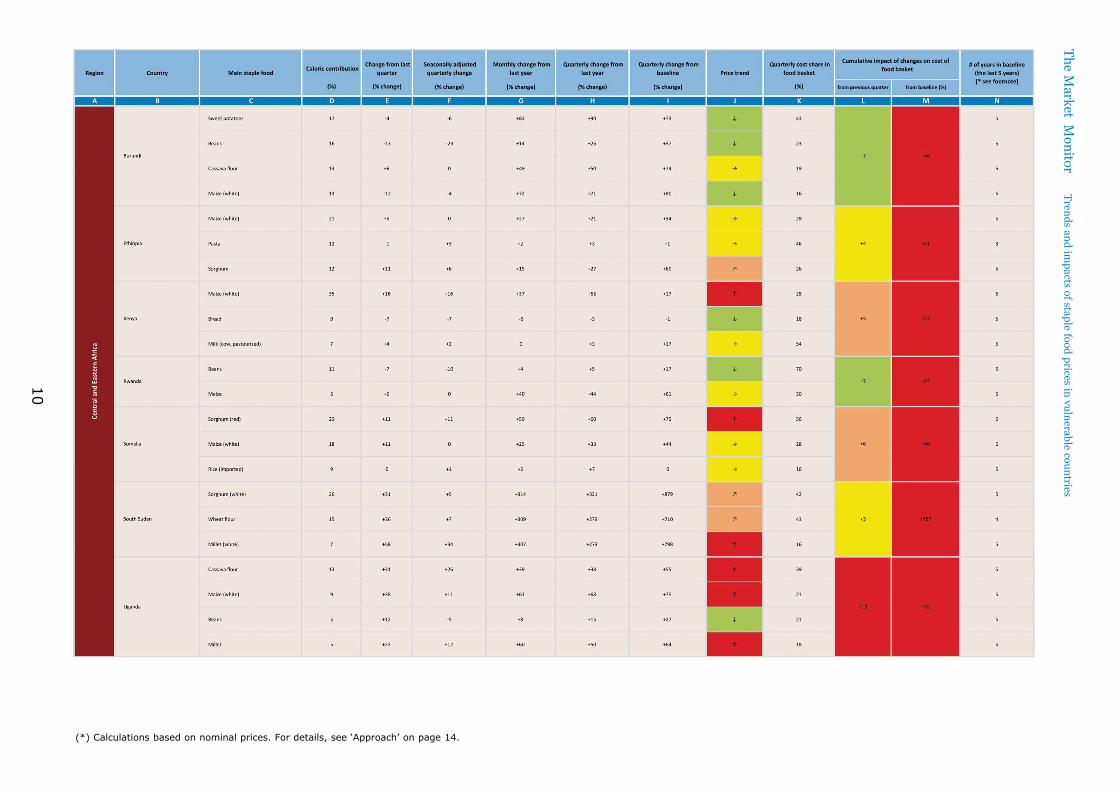
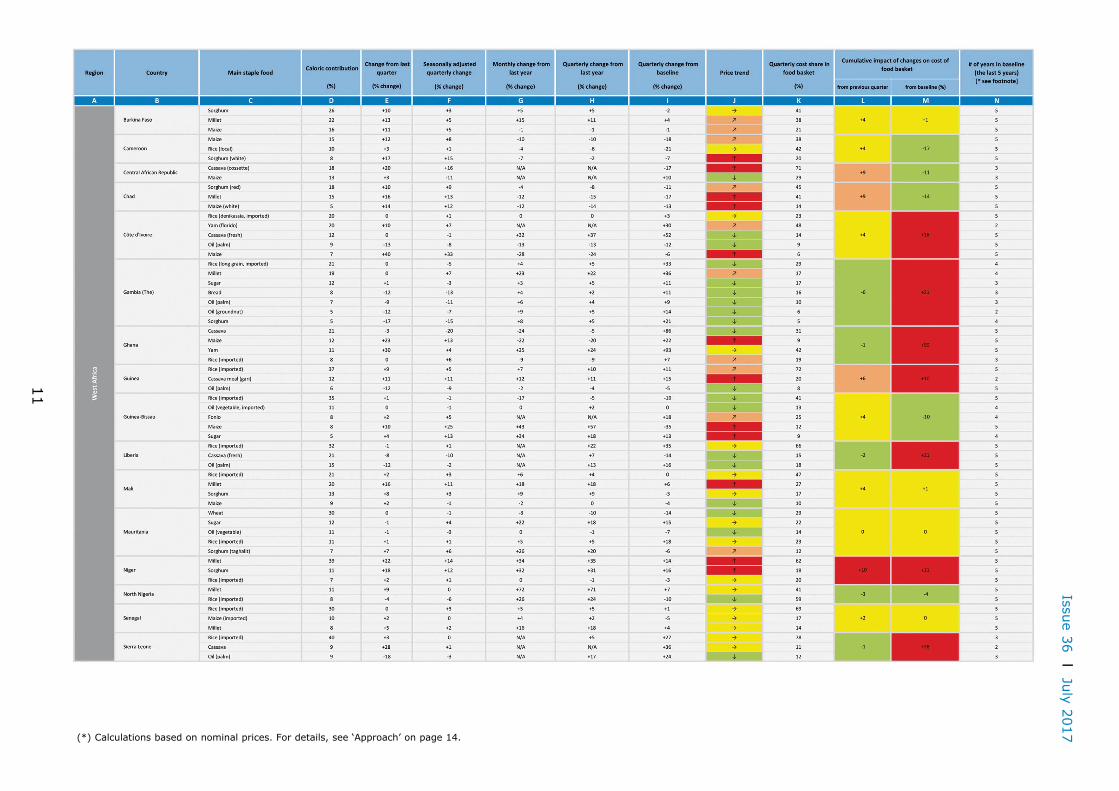
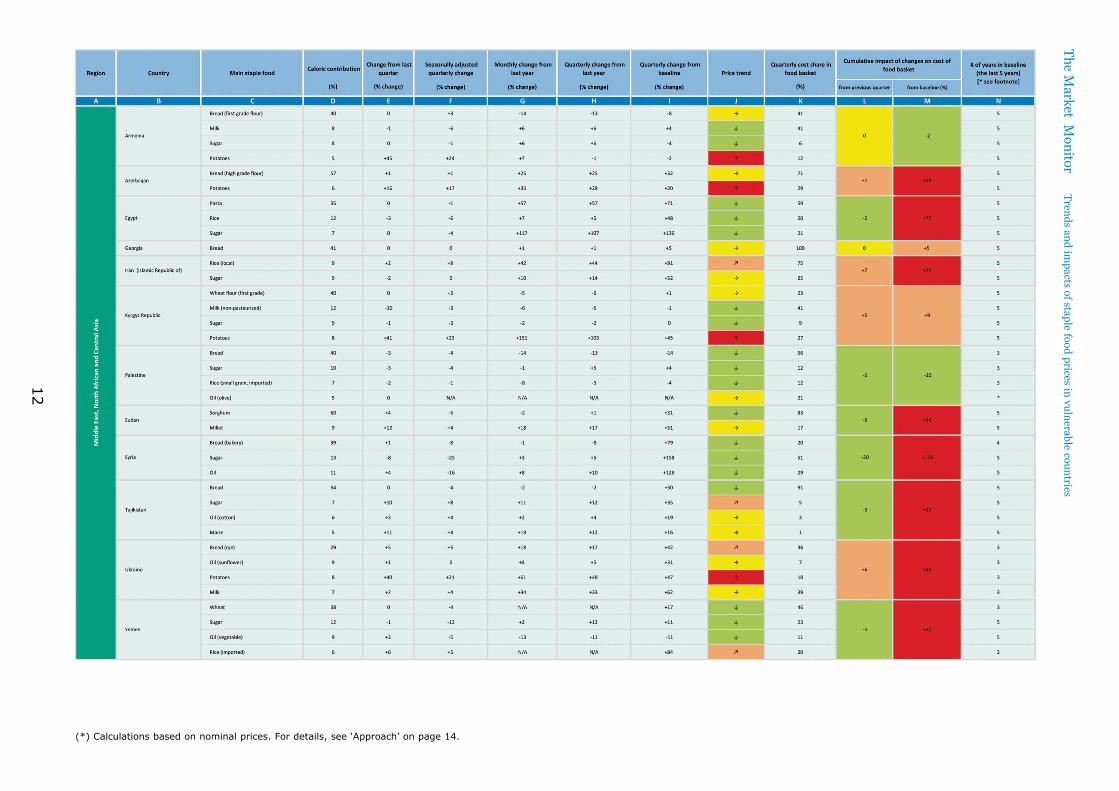
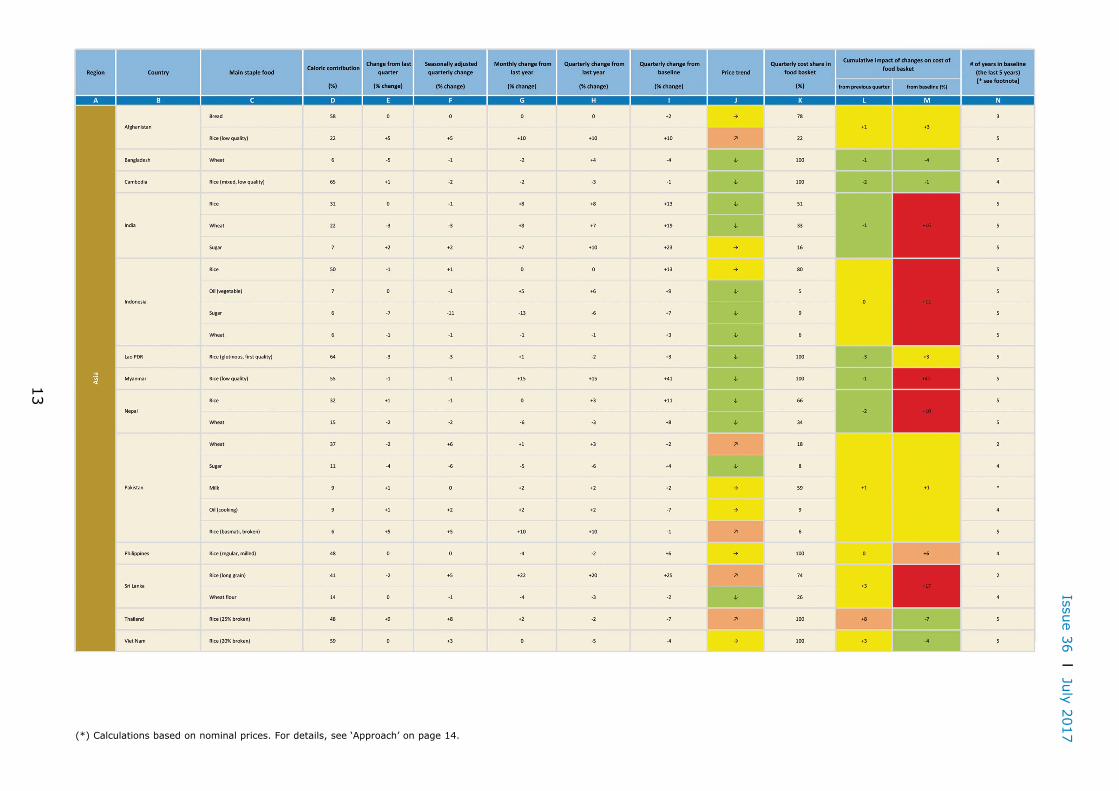
Magnitude of quarterly price changes and their impacts on the cost of the food basket, by country and commodity
(*) Calculations based on nominal prices. For details, see ‘Approach’ on page 14.
Issue 36 I July 2017
9
(*) Calculations based on nominal prices. For details, see ‘Approach’ on page 14.
The Market M
onitor Trends and impacts of staple food prices in vulnerable countries
10
(*) Calculations based on nominal prices. For details, see ‘Approach’ on page 14.
Issue 36 I July 2017
11
(*) Calculations based on nominal prices. For details, see ‘Approach’ on page 14.
The Market M
onitor Trends and impacts of staple food prices in vulnerable countries
12
(*) Calculations based on nominal prices. For details, see ‘Approach’ on page 14.
Issue 36 I July 2017
13
(*) Calculations based on nominal prices. For details, see ‘Approach’ on page 14.
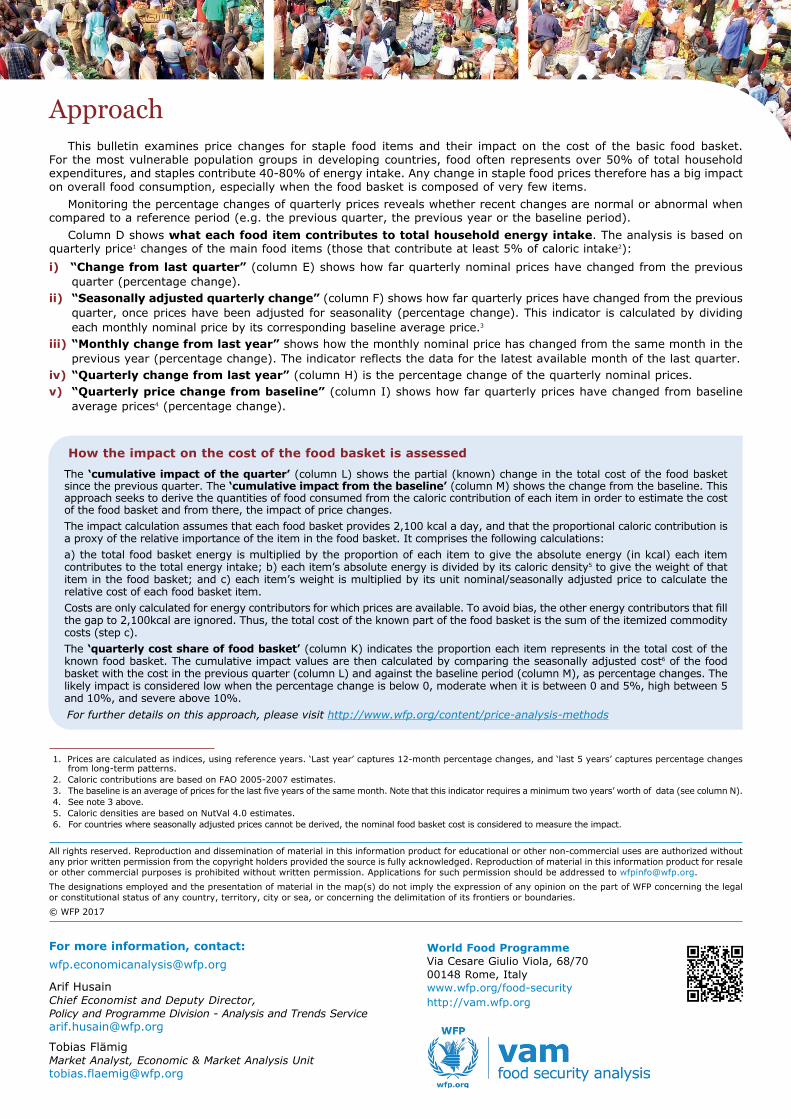
How the impact on the cost of the food basket is assessedThe ‘cumulative impact of the quarter’ (column L) shows the partial (known) change in the total cost of the food basket since the previous quarter. The ‘cumulative impact from the baseline’ (column M) shows the change from the baseline. This approach seeks to derive the quantities of food consumed from the caloric contribution of each item in order to estimate the cost of the food basket and from there, the impact of price changes. The impact calculation assumes that each food basket provides 2,100 kcal a day, and that the proportional caloric contribution is a proxy of the relative importance of the item in the food basket. It comprises the following calculations:a) the total food basket energy is multiplied by the proportion of each item to give the absolute energy (in kcal) each item contributes to the total energy intake; b) each item’s absolute energy is divided by its caloric density5 to give the weight of that item in the food basket; and c) each item’s weight is multiplied by its unit nominal/seasonally adjusted price to calculate the relative cost of each food basket item.Costs are only calculated for energy contributors for which prices are available. To avoid bias, the other energy contributors that fill the gap to 2,100kcal are ignored. Thus, the total cost of the known part of the food basket is the sum of the itemized commodity costs (step c).The ‘quarterly cost share of food basket’ (column K) indicates the proportion each item represents in the total cost of the known food basket. The cumulative impact values are then calculated by comparing the seasonally adjusted cost6 of the food basket with the cost in the previous quarter (column L) and against the baseline period (column M), as percentage changes. The likely impact is considered low when the percentage change is below 0, moderate when it is between 0 and 5%, high between 5 and 10%, and severe above 10%.For further details on this approach, please visit http://www.wfp.org/content/price-analysis-methods
For more information, contact: [email protected]
Arif Husain Chief Economist and Deputy Director, Policy and Programme Division - Analysis and Trends [email protected]
Tobias FlämigMarket Analyst, Economic & Market Analysis [email protected]
1. Prices are calculated as indices, using reference years. ‘Last year’ captures 12-month percentage changes, and ‘last 5 years’ captures percentage changes from long-term patterns.
2. Caloric contributions are based on FAO 2005-2007 estimates.3. The baseline is an average of prices for the last five years of the same month. Note that this indicator requires a minimum two years’ worth of data (see column N). 4. See note 3 above.5. Caloric densities are based on NutVal 4.0 estimates. 6. For countries where seasonally adjusted prices cannot be derived, the nominal food basket cost is considered to measure the impact.
All rights reserved. Reproduction and dissemination of material in this information product for educational or other non-commercial uses are authorized without any prior written permission from the copyright holders provided the source is fully acknowledged. Reproduction of material in this information product for resale or other commercial purposes is prohibited without written permission. Applications for such permission should be addressed to [email protected] designations employed and the presentation of material in the map(s) do not imply the expression of any opinion on the part of WFP concerning the legal or constitutional status of any country, territory, city or sea, or concerning the delimitation of its frontiers or boundaries.© WFP 2017
World Food Programme Via Cesare Giulio Viola, 68/7000148 Rome, Italywww.wfp.org/food-securityhttp://vam.wfp.org
ApproachThis bulletin examines price changes for staple food items and their impact on the cost of the basic food basket.
For the most vulnerable population groups in developing countries, food often represents over 50% of total household expenditures, and staples contribute 40-80% of energy intake. Any change in staple food prices therefore has a big impact on overall food consumption, especially when the food basket is composed of very few items.
Monitoring the percentage changes of quarterly prices reveals whether recent changes are normal or abnormal when compared to a reference period (e.g. the previous quarter, the previous year or the baseline period).
Column D shows what each food item contributes to total household energy intake. The analysis is based on quarterly price1 changes of the main food items (those that contribute at least 5% of caloric intake2): i) “Change from last quarter” (column E) shows how far quarterly nominal prices have changed from the previous
quarter (percentage change).ii) “Seasonally adjusted quarterly change” (column F) shows how far quarterly prices have changed from the previous
quarter, once prices have been adjusted for seasonality (percentage change). This indicator is calculated by dividing each monthly nominal price by its corresponding baseline average price.3
iii) “Monthly change from last year” shows how the monthly nominal price has changed from the same month in the previous year (percentage change). The indicator reflects the data for the latest available month of the last quarter.
iv) “Quarterly change from last year” (column H) is the percentage change of the quarterly nominal prices. v) “Quarterly price change from baseline” (column I) shows how far quarterly prices have changed from baseline
average prices4 (percentage change).