trends in retail prices of brand name prescription drugs ... · pdf filetrends in retail...
TRANSCRIPT

DECEMBER 2016
Rx Price Watch Report
Stephen W. SchondelmeyerPRIME Institute, University of Minnesota
Leigh PurvisAARP Public Policy Institute
Trends in Retail Prices of Brand Name Prescription Drugs Widely Used by Older Americans, 2006 to 2015

AARP’s Public Policy Institute informs and stimulates public debate on the issues we face as we age. Through research, analysis, and dialogue with the nation’s leading experts, PPI promotes development of sound, creative policies to address our common need for economic security, health care, and quality of life.
The views expressed herein are for information, debate, and discussion, and do not necessarily represent official policies of AARP.

TRENDS IN RETAIL PRICES OF BRAND NAME PRESCRIPTION DRUGS WIDELY USED BY OLDER AMERICANS, 2006–2015 I
Table of Contents
EXECUTIVE SUMMARY ������������������������������������������������������������������������������������������������������������������������������������������ 1
INTRODUCTION ����������������������������������������������������������������������������������������������������������������������������������������������������������� 3
FINDINGS ������������������������������������������������������������������������������������������������������������������������������������������������������������������������ 5I. Brand Name Price Trends for Most Widely Used Prescription Drugs ............................................5
The annual percent change in retail prices for brand name prescription drugs has consistently increased substantially faster than general inflation in recent years. .......... 5
The cost of brand name drug therapy reached more than $5,800 per drug per year in 2015. .............................................................................................................................................................. 7
II. 10-Year Cumulative Retail Price Changes for Most Widely Used Brand Name Prescription Drugs, 2006 to 2015 ..............................................................................................................8
Ninety percent of brand name drug product prices more than doubled in 10 years. ............. 8The 10-year cumulative change in annual brand name drug cost of therapy is
substantial.................................................................................................................................................. 9The annual cost of one brand name drug product grew more than $50,000 over
10 years. ....................................................................................................................................................... 9III. A Wide Range of Brand Name Drug Price Increases Occurred in 2015 ....................................... 10IV. Retail Price Changes for Most Widely Used Brand Name Prescription Drugs by
Manufacturer................................................................................................................................................14V. Retail Price Changes for Most Widely Used Brand Name Prescription Drugs by
Therapeutic Category .................................................................................................................................14
CONCLUDING OBSERVATIONS ���������������������������������������������������������������������������������������������������������������������������� 18
APPENDIX A� Detailed Methodology and Description of Retail Price Data ................................................. 20
APPENDIX B� AARP Market Basket Effect of Brand Name Drugs Facing Generic Competition ............28

II TRENDS IN RETAIL PRICES OF BRAND NAME PRESCRIPTION DRUGS WIDELY USED BY OLDER AMERICANS, 2006–2015
Figures
Figure 1 Average Annual Brand Name Drug Prices Continue to Grow Substantially Faster Than General Inflation in 2015 ...........................................................................................................................5
Figure 2 Rolling Average and Point-to-Point Changes in Retail Prices for Most Widely Used Brand Name Prescription Drugs Were Well Above Inflation From 2006 to 2015 ......................6
Figure 3 The Average Annual Cost of Brand Name Drugs Grew More Than Three-Fold Between 2006 and 2015 ...............................................................................................................................................7
Figure 4 Retail Price for Six Brand Name Drugs Increased by 500 Percent Or More From 2006 to 2015 ..................................................................................................................................................8
Figure 5 10-Year Cumulative Change in Annual Retail Cost of Therapy Is Almost $60,000 for Exjade 500 Mg Tablets .......................................................................................................................10
Figure 6 Retail Prices Increased by More Than 10 Percent in 2015 for Almost Two-Thirds of the Most Widely Used Brand Name Drugs .................................................................................... 11
Figure 7 Seven Widely Used Brand Name Drugs Had 1-Year Retail Price Increases of More Than 50 Percent in 2015 ...........................................................................................................................12
Figure 8 Retail Prices for Widely Used Brand Name Drug Products Increased by More Than 5 Percent for All But Two Drug Manufacturers in 2015 .................................................................. 15
Figure 9 All Therapeutic Categories for Brand Name Drugs Had Retail Price Increases That Exceeded the Rate of General Inflation in 2015 ................................................................................. 17
Tables
Table 1 Annual Change in Retail Price for Top 25 Drug Products in the Brand Name Market Basket, 2015................................................................................................................................... 13

TRENDS IN RETAIL PRICES OF BRAND NAME PRESCRIPTION DRUGS WIDELY USED BY OLDER AMERICANS, 2006–2015 1
Retail prices for widely used brand name prescription drugs increased substantially faster than general inflation in every year from 2006 to 2015. Between 2014 and 2015, retail prices for 268 brand name prescription drugs widely used by older Americans, including Medicare beneficiaries, increased by an average of 15.5 percent. In contrast, the general inflation rate was 0.1 percent over the same period. Brand name drug prices have routinely increased much faster than general inflation over the past 12 years—the entire period during which the AARP Public Policy Institute has been publishing this report series.
Increases in the retail price of brand name prescription drugs have a corresponding impact on the cost of therapy for the individual and for all other payers. In 2015, the average cost of therapy for a brand name prescription drug, based on the market basket in this study, was more than $5,800 per year. On average, older Americans take 4.5 prescription drugs every month. Consequently, an older adult who uses brand name prescription drugs is likely to have experienced an average annual retail cost of drug therapy of more than $26,000 in 2015. This amount exceeds the median annual income for individual Medicare beneficiaries.
If recent trends in brand name drug price increases continue unabated, the cost of drugs will prompt increasing numbers of older Americans to stop taking necessary medications. This will lead to poorer health outcomes and higher health care costs in the future.
OVERVIEW OF FINDINGS•• Between 2014 and 2015, retail prices for
268 widely used brand name prescription drugs increased by 15.5 percent, marking the fourth straight year of double-digit average annual price increases.
•• Brand name drug prices increased almost 130 times faster than general inflation in 2015 (15.5 percent versus 0.1 percent).
•• The average annual cost for one brand name medication used on a chronic basis was more than $5,800 in 2015, almost $1,000 higher than the average annual cost of therapy in 2014.
— For the average older American taking 4.5 prescription drugs per month, the annual cost of therapy would have been more than $26,000 for 2015—more than three times the cost seen 10 years earlier.
•• Between January 2006 and December 2015, retail prices for 113 chronic-use brand name drugs that have been on the market since the beginning of the study increased cumulatively over 10 years by an average of 188.7 percent.
— The cumulative general inflation rate in the US economy was 19.4 percent during the same 10-year period.
•• Retail prices increased in 2015 for 97 percent (261 of 268) of the widely used brand name prescription drug products in the study’s market basket. All of these retail price increases exceeded the rate of general economic inflation in 2015.
•• Retail prices for all 35 of the drug manufacturers with at least two brand name drug products in the study’s market basket increased faster than the rate of general inflation (0.1 percent) in 2015, suggesting that brand name drug price trends in this report are an industry-wide phenomenon.
— Twenty-four drug manufacturers, including the “All Others” category that included the 13 manufacturers with only one brand name drug product in the market basket, had average annual price increases for their brand name drugs of 10 percent or more during 2015.
•• All but one of the 49 therapeutic categories of brand name drug products had average annual retail price increases that exceeded 5.0 percent in 2015.
Executive Summary
2 TRENDS IN RETAIL PRICES OF BRAND NAME PRESCRIPTION DRUGS WIDELY USED BY OLDER AMERICANS, 2006–2015
BRAND NAME PRESCRIPTION DRUG PRICE INCREASES AFFECT INDIVIDUAL CONSUMERS AND BOTH PRIVATE AND PUBLIC INSURANCE PROGRAMSThis report shows that average annual increases in the retail prices of widely used brand name prescription drugs have consistently exceeded the general inflation rate. While the average annual increase was slightly lower in 2015, it was still more than two and a half times higher than the average annual rate of increase in 2006. Moreover, the gap between the average annual price increase and the rate of general inflation has been consistently widening.
Brand name drug price increases translate into higher out-of-pocket costs, especially for consumers who pay a percentage of drug costs (coinsurance) rather than a fixed dollar amount (copayment). Higher prices are typically passed along to consumers in the form of higher cost sharing, deductibles, and premiums.
Prescription drug price increases also affect taxpayer-funded programs like Medicare and Medicaid. For example, the Medicare Trustees recently noted that price increases for brand name
drugs are a major factor helping to drive Medicare Part D spending growth. Higher government spending driven by large price increases will affect all Americans in the form of higher taxes, cuts to public programs, or both.
Policy makers must take a serious look at recent pricing behavior in the pharmaceutical market. Current market forces have not moderated excessive brand name drug price increases, and the resulting increases in pharmaceutical expenditures are not sustainable. Policy makers interested in reducing the impact of brand name prescription drug prices should focus on options that balance the need for pharmaceutical innovation with the need for improved health and the financial security of consumers and taxpayer-funded programs like Medicare and Medicaid.
This report is the latest in the AARP Public Policy Institute’s Rx Price Watch series. Separate reports analyze price changes for widely used generic and specialty drug products. The series also analyzes the price changes for an overall market basket (i.e., brand name, generic, and specialty drug products combined) to reflect the overall market impact of drug price changes.

TRENDS IN RETAIL PRICES OF BRAND NAME PRESCRIPTION DRUGS WIDELY USED BY OLDER AMERICANS, 2006–2015 3
1 The AARP Public Policy Institute in its Rx Price Watch series provides reports with separate analyses of the price changes for three different segments of the pharmaceutical market: brand name, generic, and specialty drug products. These three market baskets are important because a different mix of drug manufacturers typically makes the drug products in each segment and the drug products are subject to unique market dynamics, pricing, and related behaviors. In addition, the Rx Price Watch series also reports the price change for an overall market basket (i.e., brand name, generic, and specialty drug products combined) to reflect the overall market impact of drug price changes. Some critics have argued that the brand name price index report alone overstates the effect of drug price changes on the overall prescription drug market. Those critics argue that an overall measure should include the effect of generic prescription drug price competition and the impact of generic substitution. This is precisely why the AARP Rx Price Watch series of reports also provides an overall market basket (including brand name, generic, and specialty drug products) to examine the price change impact for the overall prescription drug market. While this overall perspective is useful for those interested in understanding the industrial economics of the entire prescription drug market, consumers have proved to be considerably more interested in the price trend for the specific products that they are taking as an individual rather than all drug products on the market. In addition, separate analyses of the different market segments (i.e., brand name, generic, and specialty drug products) is important because they represent very unique and distinct segments in the prescription drug market and they provide an indication of policy changes that may be warranted in the various market segments. Previous reports from this series are on the AARP website at http://www.aarp.org/health/medicare-insurance/info-04-2009/rx_watchdog.html and http://www.aarp.org/rxpricewatch.
2 The retail prices used in this report are derived from Truven Health’s MarketScan® Commercial Database and MarketScan® Medicare Supplemental Database (Truven Health MarketScan® Research Databases). The prices reflect the total price for a specific prescription that a pharmacy benefit manager (PBM) bills to a specific health plan for consumers enrolled in employer-sponsored or government-sponsored (i.e., Medicare or Medicaid) health plans and not simply the out-of-pocket cost (such as the copay) that a consumer would pay at the pharmacy. These amounts may or may not reflect what the PBM paid the pharmacy or the usual and customary price that a pharmacy would charge a cash-pay consumer for the same prescription.
3 Medicare Part D enrollees take an average of 54 prescriptions per year or 4.5 prescription drugs per month. Medicare Payment Advisory Commission (MedPAC), June 2016 Report to the Congress: Medicare and the Health Care Delivery System, MedPAC, June 2016.
4 The median annual income for Medicare beneficiaries was $24,150 in 2014. G. Jacobson, C. Swoope, T. Neuman , and K. Smith, Income and Assets of Medicare Beneficiaries, 2014-2030, Kaiser Family Foundation, September 2015.
5 Medicare Board of Trustees, 2016 Annual Report of the Boards of Trustees of the Federal Hospital Insurance and Federal Supplementary Medical Insurance Trust Funds, June 22, 2016. Available at: https://www.cms.gov/Research-Statistics-Data-and-Systems/Statistics-Trends-and-Reports/ReportsTrustFunds/downloads/tr2016.pdf.
AARP’s Public Policy Institute finds that average retail price increases for brand name prescription drugs widely used by older Americans, including Medicare beneficiaries, far outstripped the price increases for other consumer goods and services between 2006 and 2015. Brand name drug prices have routinely increased much faster than general inflation over the past 12 years—the entire period since the beginning of our report series on prescription drug prices in 2004.1 Between 2014 and 2015, the average annual increase in retail prices2 for 268 brand name prescription drugs widely used by older Americans was 15.5 percent—the fourth straight year of double-digit average annual price increases. In contrast, the rate of general inflation in the US economy was 0.1 percent in 2015.
Increases in the retail price of brand name prescription drugs have a corresponding impact on the cost of drug therapy for individual consumers
and for all types of payers. In 2015, the annual retail cost of drug therapy for a brand name prescription drug, based on the market basket in this study, averaged more than $5,800 per year. Older Americans receive an average of 54 prescriptions every year—or 4.5 prescriptions per month.3 Consequently, older adults who use brand name prescription drugs are likely to have experienced an average annual retail cost of drug therapy totaling more than $26,000 in 2015. This annual retail cost of brand name prescription drugs exceeds the median annual income for a Medicare beneficiary ($24,150).4
Prescription drug price increases affect all types of payers including individuals, employers, private insurers, and taxpayer-funded programs like Medicare and Medicaid. For example, the Medicare Trustees recently noted that price increases for brand name drugs are a major factor driving Medicare Part D spending growth.5 These
Introduction

4 TRENDS IN RETAIL PRICES OF BRAND NAME PRESCRIPTION DRUGS WIDELY USED BY OLDER AMERICANS, 2006–2015
6 D.I. Auerbach and A.L. Kellermann, “A Decade of Health Care Cost Growth Has Wiped Out Real Income Gains for an Average U.S. Family,” Health Affairs, Vol. 30(9) (2011): 1630–636. Consumer Reports, “Is There a Cure for High Drug Prices?” July 29, 2016.
spending increases driven by high and growing drug prices will affect all Americans in some way. Those with private health insurance will pay more in cost sharing and higher premiums for their health care coverage.6 In addition, increased government spending on prescription drugs will ultimately lead to higher taxes and/or cuts to public programs.
This report presents annual and 10-year cumulative price changes through the end of 2015. The first set of findings shows annual rates
of change in retail prices for widely used brand name drugs from 2006 through 2015, using both rolling average and point-to-point methods (see Appendix A). The point-to-point method examines the distribution of price changes and differences in average percent changes in retail prices for individual drug products, specific manufacturers, and specific therapeutic categories. The second set of findings summarizes the cumulative impact of retail price changes for brand name drugs that have taken place across the entire 10-year period from 2006 through 2015.

TRENDS IN RETAIL PRICES OF BRAND NAME PRESCRIPTION DRUGS WIDELY USED BY OLDER AMERICANS, 2006–2015 5
I. BRAND NAME PRICE TRENDS FOR MOST WIDELY USED PRESCRIPTION DRUGSThe annual percent change in retail prices for brand name prescription drugs has consistently increased substantially faster than general inflation in recent years.
•• Retail prices for the 268 brand name drug products7 most widely used by older
Americans rose 15.5 percent in 2015 compared with 2014 prices (Figure 1).8
•• Average annual retail prices for brand name prescriptions increased at an all-time high rate in 2014 (16.1 percent) and the 2015 brand name drug prices increased nearly as much at a rate of 15.5 percent. Notably, these historically high price increases have taken place despite
Note: Calculations of the average annual brand name drug price change include the 268 drug products most widely used by older Americans (see Appendix A).
Prepared by the AARP Public Policy Institute and the PRIME Institute, University of Minnesota, based on data from Truven Health MarketScan® Research Databases and MediSpan Price Rx Pro®.
Brand Name Drug Prices (268 top drug products)
General Inflation (CPI-U)
Ave
rage
Ann
ual %
Cha
nge
5.9%6.6%
8.7% 8.2% 7.8%
9.7%
12.0%
15.4%16.1%
15.5%
3.3% 2.9%3.8%
3.2%2.1%
1.5% 1.6%
0.1%
1.6%
2006 2007 2008 2009 2010 2011 2012 2013 2014 2015
-0.3%
FIGURE 1AVERAGE ANNUAL BRAND NAME DRUG PRICES CONTINUE TO GROW SUBSTANTIALLY FASTER THAN GENERAL INFLATION IN 2015
Findings
7 The market basket for this analysis had 268 brand name prescription drug products. Some critics of the Rx Price Watch reports have suggested that brand name drug products in our market basket that subsequently face generic competition should be excluded from this analysis because they may be skewing the results upward. An analysis of the brand name drugs (183 drugs) that faced no generic competition in the study period (2006 to 2015) versus the complete market basket (268 drugs) did show that the drugs with no generic competition in 2015 had a slightly lower rate of price increases (14.8 percent versus 15.5 percent); however, for 2013 and 2014 the drugs with no generic competition had slightly higher rates of price increase than the complete brand name market basket (16.0 percent versus 15.4 percent in 2013; and 16.3 percent to 16.1 percent in 2014). Overall, the rate of price increases for brand name drugs with generic competition and for those without generic competition was similar across the three years from 2013 to 2015 (see Appendix B for additional information and analysis).
8 When measured as a 12-month rolling average and weighted by actual 2014 retail prescription sales to older Americans ages 50 and above, including Medicare beneficiaries.

6 TRENDS IN RETAIL PRICES OF BRAND NAME PRESCRIPTION DRUGS WIDELY USED BY OLDER AMERICANS, 2006–2015
9 P. Loftus, “Senate Committee Is Investigating Pricing of Hepatitis C Drug,” Wall Street Journal, July 11, 2014; A. Pollack, “Senators Condemn Big Price Increases for Drugs,” New York Times, December 9, 2015.
10 The rate of general inflation was 0.12 percent in 2015. The general inflation rate used in this report is based on the average annual rate of change in the Consumer Price Index-All Urban Consumers for All Items (seasonally adjusted) (CPI-U), Bureau of Labor Statistics series CUSR0000SA0.
intense public and congressional criticism of drug pricing practices.9
•• The average annual retail price increase in 2015 for these brand name prescription drug products was more than 130 times higher than the rate of general inflation (15.5 percent vs. 0.1 percent).10
•• The average annual retail price increase for brand name prescription drug products in 2015 (15.5 percent) was more than two and a half times higher than the average annual brand name drug price increase in 2006 (5.9 percent).
The annual retail price change for brand name drug products reported in Figure 1 averages annual point-to-point price changes for each month in the preceding 12-month period (referred
to as a rolling average change), smoothing over the entire year the annual change in brand name drug price that occurs for a single month (referred to as an annual point-to-point change).
Figure 2 shows the percent change in brand name drug prices for each month compared with the same month in the previous year. This trend is presented alongside the 12-month rolling average to allow more detailed examination of the rate and timing of retail brand name drug price changes over the entire study period. This analysis reveals three broad trends that have been present since the implementation of Medicare Part D in 2006:
•• The retail price of brand name drug products has steadily and substantially increased over time since 2006.
Note: Calculations of the average annual brand name drug price change include the 268 drug products most widely used by older Americans (see Appendix A).
Prepared by the AARP Public Policy Institute and the PRIME Institute, University of Minnesota, based on data from Truven Health MarketScan® Research Databases.
-2.0%
0.0%
2.0%
4.0%
6.0%
8.0%
10.0%
12.0%
14.0%
16.0%
18.0%
20.0%Affordable Care Act passed
Medicare Part D becomes available
Brand name drug manufacturers begin providing coverage gap discounts
Annual Percent Price Change (wt. avg. for point-to-point from same month in previous year)Annual Percent Price Change (wt. avg. for 12-month rolling average)General Inflation (CPI-U)
Ann
ual %
Cha
nge
Dec
-05
Apr
-06
Aug
-06
Dec
-06
Apr
-07
Aug
-07
Dec
-07
Apr
-08
Aug
-08
Dec
-08
Apr
-09
Aug
-09
Dec
-09
Apr
-10
Aug
-10
Dec
-10
Apr
-11
Aug
-11
Dec
-11
Apr
-12
Aug
-12
Dec
-12
Apr
-13
Aug
-13
Dec
-13
Apr
-14
Aug
-14
Dec
-14
Apr
-15
Aug
-15
Dec
-15
FIGURE 2ROLLING AVERAGE AND POINT-TO-POINT CHANGES IN RETAIL PRICES FOR MOST WIDELY USED BRAND NAME PRESCRIPTION DRUGS WERE WELL ABOVE INFLATION FROM 2006 TO 2015

TRENDS IN RETAIL PRICES OF BRAND NAME PRESCRIPTION DRUGS WIDELY USED BY OLDER AMERICANS, 2006–2015 7
11 The rate of general inflation was 0.12 percent in 2015.
12 Medicare Part D enrollees receive an average of 4.5 prescription drugs per month (or 54 prescriptions per year). MedPAC, June 2016 Report to the Congress.
•• Brand name drug price increases at the retail level have been substantially higher than the rate of general inflation.
•• The gap between the rate of brand name drug price change and the rate of change in general inflation has substantially widened over the period from 2006 to 2015. This gap has ranged from a less than two-fold difference in 2006 to a more than 120-fold difference in 2015.11
The cost of brand name drug therapy reached more than $5,800 per drug per year in 2015.
Figure 3 presents the retail price for widely used brand name drugs indicated for treating chronic conditions when the price is expressed as an average annual cost of therapy per drug.
•• The average cost of chronic therapy was more than $5,800 per drug per year for brand name prescriptions at the retail level in 2015.
— This average annual cost ($5,807) of brand name prescriptions grew more than three times the average annual cost ($1,788) in 2006, the year Medicare implemented the Part D program.
Older Americans receive an average of 54 prescriptions per year—or 4.5 prescription drugs per month.12 If they used brand name drugs to treat their chronic conditions, they would have experienced an average annual retail cost for drug therapy of $26,132 for their medications in 2015.
Note: Calculations of the average annual brand name drug price change include the 214 drug products most widely used by older Americans for chronic conditions (see Appendix A).
Prepared by the AARP Public Policy Institute and the PRIME Institute, University of Minnesota, based on data from Truven Health MarketScan® Research Databases.
$1,788 $1,930$2,242 $2,385
$2,698$2,995
$3,427
$4,209
$4,896
$5,807
2006 2007 2008 2009 2010 2011 2012 2013 2014 2015
Ann
ual R
etai
l Cos
t of
The
rapy
per
Dru
g
FIGURE 3THE AVERAGE ANNUAL COST OF BRAND NAME DRUGS GREW MORE THAN THREE-FOLD BETWEEN 2006 AND 2015

8 TRENDS IN RETAIL PRICES OF BRAND NAME PRESCRIPTION DRUGS WIDELY USED BY OLDER AMERICANS, 2006–2015
13 The market basket for this analysis had 268 brand name prescription drug products. Some critics of the Rx Price Watch reports have suggested that brand name drug products in our market basket that subsequently face generic competition should be excluded from this analysis because they may be skewing the results upward. However, when only the 183 brand name drug products with no generic competition are considered, the average annual price change was higher for two of the last three years (2013 and 2014) than the price change for the total market basket (see Appendix B for additional information and analysis).
14 The average 10-year cumulative growth rate in retail prices for the 143 brand name drug products (both chronic and acute use) that were on the market for the entire 10 years was 200.3 percent, somewhat higher than the cumulative price increase of 188.7 percent seen after removal of drug products used for acute conditions. This difference is due to several chronic-use drug products that experienced remarkably high retail price increases between December 2005 and December 2015.
II. 10-YEAR CUMULATIVE RETAIL PRICE CHANGES FOR MOST WIDELY USED BRAND NAME PRESCRIPTION DRUGS, 2006 TO 2015This AARP report tracked brand name drug prices at the retail level for the 10-year period from December 31, 2005, to December 31, 2015. Fifty-three percent (143 of 268)13 of the widely used drugs in the original brand name market basket were on the market for the entire 10-year period (i.e., the end of 2005 through the end of 2015). About 80 percent (113 of 143) of those drug products treat chronic conditions and were used to analyze 10-year price trends among widely used brand name drug products.
Cumulatively, the average retail price for these 113 widely used brand name drug products
increased 188.7 percent over 10 years, compared with a 19.4 percent increase for general inflation in the same period. This means that brand name drug prices went up more than 10 times the rate of general inflation during this 10-year period.14
Ninety percent of brand name drug product prices more than doubled in 10 years.
Figure 4 presents the 10-year cumulative effect of brand name drug price changes from the end of 2005 to the end of 2015 for six specific brand name drug products that had the highest percent changes in retail price. These six drug products are among the 129 (out of 143) brand name drug products that have doubled in price while being on the market for the entire 10-year study period.
Prepared by the AARP Public Policy Institute and the PRIME Institute, University of Minnesota, based on data from Truven Health MarketScan® Research Databases.
2,873%
2,395%
2,080%
1,185%
783%538%
2006 2007 2008 2009 2010 2011 2012 2013 2014 2015
Ativan 1 mg tablets Carac 0.5% creamAtivan 2 mg tablets Wellbutrin XL 300 mg tabletsZovirax 5% cream Humulin U-500
10-Y
ear
Cum
ulat
ive
% C
hang
e
FIGURE 4RETAIL PRICE FOR SIX BRAND NAME DRUGS INCREASED BY 500 PERCENT OR MORE FROM 2006 TO 2015
TRENDS IN RETAIL PRICES OF BRAND NAME PRESCRIPTION DRUGS WIDELY USED BY OLDER AMERICANS, 2006–2015 9
15 A. Pollack and S. Tavernise, “Valeant’s Drug Price Strategy Enriches It, but Infuriates Patients and Lawmakers,” New York Times, October 4, 2015.
16 A.W. Mulcahy, Z. Predmore, and S. Mattke, The Cost Savings Potential of Biosimilar Drugs in the United States, RAND Corporation, November 2014.
17 The drug products in our study market basket were classified based on whether the primary indication for use was for a chronic condition or an acute (or intermittent) condition. Seventy-nine percent (113) of the 143 market basket drug products that have been on the market for the 10-year period since the end of 2005 were determined to treat chronic conditions.
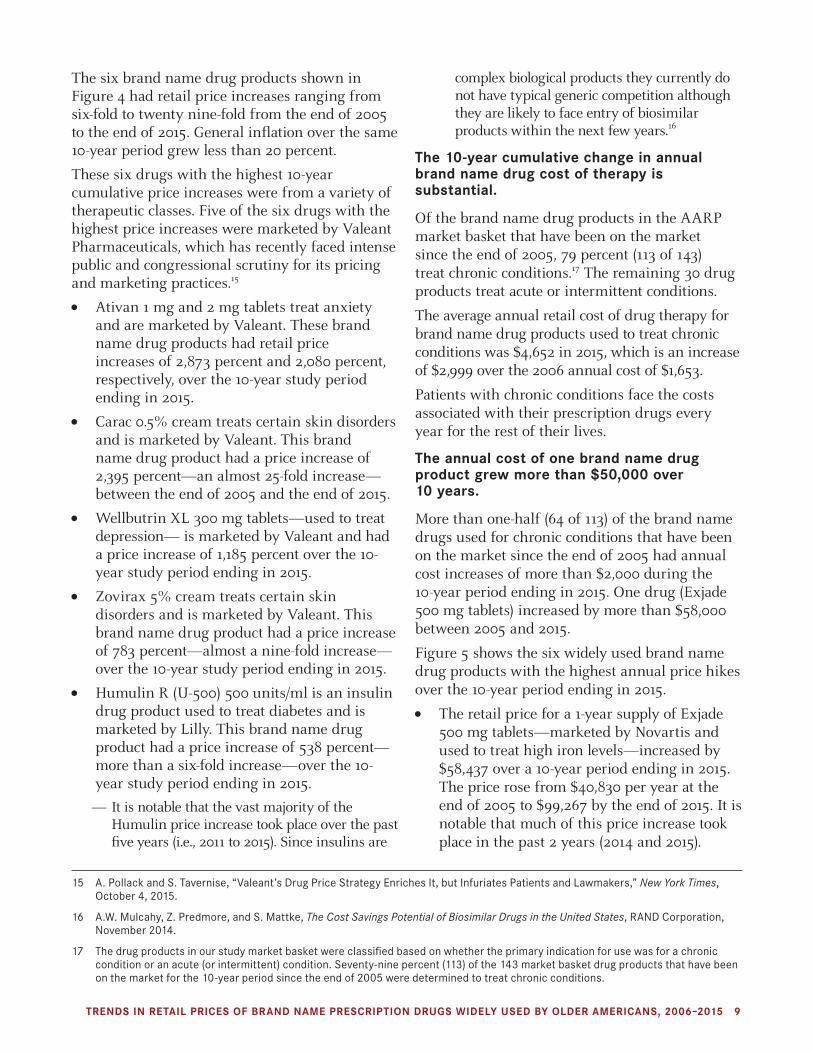
The six brand name drug products shown in Figure 4 had retail price increases ranging from six-fold to twenty nine-fold from the end of 2005 to the end of 2015. General inflation over the same 10-year period grew less than 20 percent.
These six drugs with the highest 10-year cumulative price increases were from a variety of therapeutic classes. Five of the six drugs with the highest price increases were marketed by Valeant Pharmaceuticals, which has recently faced intense public and congressional scrutiny for its pricing and marketing practices.15
•• Ativan 1 mg and 2 mg tablets treat anxiety and are marketed by Valeant. These brand name drug products had retail price increases of 2,873 percent and 2,080 percent, respectively, over the 10-year study period ending in 2015.
•• Carac 0.5% cream treats certain skin disorders and is marketed by Valeant. This brand name drug product had a price increase of 2,395 percent—an almost 25-fold increase—between the end of 2005 and the end of 2015.
•• Wellbutrin XL 300 mg tablets—used to treat depression— is marketed by Valeant and had a price increase of 1,185 percent over the 10-year study period ending in 2015.
•• Zovirax 5% cream treats certain skin disorders and is marketed by Valeant. This brand name drug product had a price increase of 783 percent—almost a nine-fold increase—over the 10-year study period ending in 2015.
•• Humulin R (U-500) 500 units/ml is an insulin drug product used to treat diabetes and is marketed by Lilly. This brand name drug product had a price increase of 538 percent—more than a six-fold increase—over the 10-year study period ending in 2015.
— It is notable that the vast majority of the Humulin price increase took place over the past five years (i.e., 2011 to 2015). Since insulins are
complex biological products they currently do not have typical generic competition although they are likely to face entry of biosimilar products within the next few years.16
The 10-year cumulative change in annual brand name drug cost of therapy is substantial.
Of the brand name drug products in the AARP market basket that have been on the market since the end of 2005, 79 percent (113 of 143) treat chronic conditions.17 The remaining 30 drug products treat acute or intermittent conditions.
The average annual retail cost of drug therapy for brand name drug products used to treat chronic conditions was $4,652 in 2015, which is an increase of $2,999 over the 2006 annual cost of $1,653.
Patients with chronic conditions face the costs associated with their prescription drugs every year for the rest of their lives.
The annual cost of one brand name drug product grew more than $50,000 over 10 years.
More than one-half (64 of 113) of the brand name drugs used for chronic conditions that have been on the market since the end of 2005 had annual cost increases of more than $2,000 during the 10-year period ending in 2015. One drug (Exjade 500 mg tablets) increased by more than $58,000 between 2005 and 2015.
Figure 5 shows the six widely used brand name drug products with the highest annual price hikes over the 10-year period ending in 2015.
•• The retail price for a 1-year supply of Exjade 500 mg tablets—marketed by Novartis and used to treat high iron levels—increased by $58,437 over a 10-year period ending in 2015. The price rose from $40,830 per year at the end of 2005 to $99,267 by the end of 2015. It is notable that much of this price increase took place in the past 2 years (2014 and 2015).

10 TRENDS IN RETAIL PRICES OF BRAND NAME PRESCRIPTION DRUGS WIDELY USED BY OLDER AMERICANS, 2006–2015
18 The rate of general inflation was 0.12 percent in 2015.
•• The retail price of a 1-year supply of Valcyte 450 mg tablets—an anti-viral drug marketed by Genentech—increased by $18,080 in the 10-year period ending in 2015. The retail price for a 1-year supply of this drug rose from $12,665 in 2006 to $30,745 in 2015.
•• The retail price of Wellbutrin XL 300 mg tablets—used to treat depression—is marketed by Valeant and increased $18,020 over the 10-year study period. The price rose from $1,521 per year in 2006 to $19,540 per year in 2015.
•• The retail price of a one-year supply of Sensipar 90 mg tablets—a treatment for patients with chronic kidney disease marketed by Amgen—increased by $13,554 in the 10-year period ending in 2015. The retail price for a one-year supply of this drug increased from $10,029 in 2006 to $23,582 in 2015.
•• The retail price of Humulin R (U-500) 500 units/ml—an insulin drug product marketed by Lilly—jumped from $2,487 at the end of 2005 to $15,860 by the end of 2015—an
increase of $13,373. The vast majority of this increase took place since 2011, the year after the Affordable Care Act became law.
— Humulin and the other insulin drug products will likely face entry of biosimilar products within the next few years.
•• The retail price of a 1-year supply of Renagel 800 mg tablets—marketed by Genzyme and used to treat low phosphorus levels in patients receiving kidney dialysis—increased by $11,055 in the 10-year period ending in 2015. The retail price for a 1-year supply of this drug rose from $3,113 in 2006 to $14,168 in 2015—more than a four-fold increase.
III. A WIDE RANGE OF BRAND NAME DRUG PRICE INCREASES OCCURRED IN 2015Retail prices for 97 percent (261 of 268) of the most widely used brand name prescription drug products had price increases in 2015 (Figure 6). All of these price increases were greater than the rate of general inflation (0.1 percent)18 in 2015.
Prepared by the AARP Public Policy Institute and the PRIME Institute, University of Minnesota, based on data from Truven Health MarketScan® Research Databases.
$58,437
$18,080$18,020$13,554$13,373$11,055
2006 2007 2008 2009 2010 2011 2012 2013 2014 2015
Exjade 500 mg tablets Valcyte 450 mg tabletsWellbutrin XL 300 mg tablets Sensipar 90 mg tabletsHumulin U-500 Renagel 800 mg tablets
10-Y
ear
Cum
ulat
ive
Cha
nge
in A
nnua
l Cos
t of
The
rapy
FIGURE 510-YEAR CUMULATIVE CHANGE IN ANNUAL RETAIL COST OF THERAPY IS ALMOST $60,000 FOR EXJADE 500 MG TABLETS

TRENDS IN RETAIL PRICES OF BRAND NAME PRESCRIPTION DRUGS WIDELY USED BY OLDER AMERICANS, 2006–2015 11
Among the 93 percent (248 of 268) of brand name drug products with annual retail price increases of more than 5.0 percent—or more than 40 times the rate of inflation—in 2015:
•• Seventy-four increased by 5.0 percent to 9.9 percent;
•• Forty-five increased by 10.0 percent to 14.9 percent;
•• Eighty-three increased by 15.0 percent to 19.9 percent; and
•• Forty-six increased by 20 percent to as much as 1,096 percent.
Three widely used brand name prescription drug products—Lantus Solostar Pen 100 units/ml (used to treat diabetes), Exforge HCT 10-320-25 tablets (used to treat high blood pressure), and MoviPrep 100 Gm (used to prepare for colonoscopies)—had retail price decreases of 1.8 percent or less between 2014 and 2015.
Seven of the 268 widely used brand name drug products had retail price increases of more than 50 percent in 2015 (Figure 7). One brand name drug product (Zegerid 40-1,100 mg capsules used for acid reflux) had a price increase of 1,096 percent in 2015 when compared with 2014.
Note: Calculations were made using brand name drug price change from December 31, 2014 to December 31, 2015, and the analysis included the 268 brand name drug products most widely used by older Americans (see Appendix A).
Prepared by the AARP Public Policy Institute and the PRIME Institute, University of Minnesota, based on data from Truven Health MarketScan® Research Databases.
-0.1% to -1.8%decrease3 Drugs
No change
0.1% to 4.9% increase13 Drugs
5.0% to 9.9%increase74 Drugs
10.0% to 14.9%increase45 Drugs
15.0% to 19.9%increase83 Drugs
20.0% to 24.9%increase23 Drugs 25.0% to 1,095.7%
increase23 Drugs
Percent Change in Retail Price(TOTAL = 268 Drugs)
12-Month Rate of General Inflation = 0.1%
FIGURE 6RETAIL PRICES INCREASED BY MORE THAN 10 PERCENT IN 2015 FOR ALMOST TWO-THIRDS OF THE MOST WIDELY USED BRAND NAME DRUGS

12 TRENDS IN RETAIL PRICES OF BRAND NAME PRESCRIPTION DRUGS WIDELY USED BY OLDER AMERICANS, 2006–2015
The general inflation rate is based on CPI-U (See Consumer Price Index-All Urban Consumers for All Items [seasonally adjusted] [CPI-U], Bureau of Labor Statistics series CUSR0000SA0).
Prepared by the AARP Public Policy Institute and the PRIME Institute, University of Minnesota, based on data from Truven Health MarketScan® Research Databases.
51.3%
59.7%
70.5%
74.1%
128.3%
782.0%
1095.7%
Azopt Ophth 1%
Ativan 2 mg tablets
Nitrostat 0.4 mg tablets
Wellbutrin XL 300 mg tablets
Ativan 1 mg tablets
Glumetza ER 1,000 mg tablets
Zegerid 40-1,100 mg capsules
Annual % Change
Brand Name Retail Price General Inflation (0.1%)
FIGURE 7SEVEN WIDELY USED BRAND NAME DRUGS HAD 1-YEAR RETAIL PRICE INCREASES OF MORE THAN 50 PERCENT IN 2015
Twenty-two of the 25 top-selling brand name drug products in the market basket had retail price increases in 2015 when compared with 2014 (Table 1). All of these top-selling brand name drug products had a price increase that exceeded the rate of general inflation in 2015 (0.1 percent).
Nearly one-half (12 of 25) of the top 25 drug products had price increases of 10.0 percent or more in 2015; six of these price increases exceeded 15.0 percent.
One top-selling brand name drug product (Lantus SoloStar Pen 100 units/ml used for diabetes) had a price decrease in 2015. Two top-selling brand name drug products [Lantus 100 units/ml (used to treat diabetes) and Evista 60 mg tablets (multiple uses, including osteoporosis)] had no change in price in 2015.

TRENDS IN RETAIL PRICES OF BRAND NAME PRESCRIPTION DRUGS WIDELY USED BY OLDER AMERICANS, 2006–2015 13
Rank by Sales
among 2014
Market Basket*
Product Name, Strength, and Dosage Form
Pkg Size Manufacturer Therapeutic Class
2015 Retail Price per Day
Annual Percent Change in Retail
Price 1 Nexium 40 mg DR capsules 30 AstraZeneca Proton-Pump Inhibitors $8.66 6.0%2 Lantus SoloStar Pen 100 units/ml 3 Sanofi-Aventis US Anti-Diabetics (Insulin) $12.65 -1.8%3 Spiriva HandiHaler 18 mcg capsules 30 Boehringer Ingelheim Respiratory Other Agents $10.68 5.7%
4 Crestor 10 mg tablets 90 AstraZeneca Anti-Hyperlipidemics (Statin) $7.28 14.4%
5 Januvia 100 mg tablets 30 Merck Sharp & Dohme Anti-Diabetics (Oral) $12.17 19.3%
6 Zetia 10 mg tablets 30 Merck/Schering-Plough
Anti-Hyperlipidemics (Other) $7.96 19.6%
7 Advair Diskus 250-50 mcg/dose 60 Glaxo Smith Kline Respiratory Combinations $10.39 8.0%8 Celebrex 200 mg capsules 100 Pfizer US COX-2 Inhibitors $8.59 17.9%9 Lantus 100 units/ml 10 Sanofi-Aventis US Anti-Diabetics (Insulin) $13.42 0.0%
10 Crestor 20 mg tablets 90 AstraZeneca Anti-Hyperlipidemics (Statin) $7.28 14.2%
11 Victoza Pen 18 mcg/3 ml 3 Novo Nordisk Anti-Diabetics (Other Injection) $21.65 8.9%
12 Xarelto 20 mg tablets 30 Janssen Anti-Coagulants $11.18 5.3%
13 Symbicort aerosol 160-4.5 mcg/act 10.2 AstraZeneca Respiratory Combinations $9.27 7.2%
14 Levemir FlexPen 100 units/ml 3 Novo Nordisk Anti-Diabetics (Insulin) $13.66 5.6%15 Namenda 10 mg tablets 60 Actavis Antidementia Agents $11.46 8.4%16 Restasis 0.5% 1 Allergan Ophthalmic Agents $13.04 16.6%17 Novolog FlexPen 100 units/ml 3 Novo Nordisk Anti-Diabetics (Insulin) $15.44 13.6%
18 Crestor 5 mg tablets 90 AstraZeneca Anti-Hyperlipidemics (Statin) $7.26 14.5%
19 Lovaza 1 Gm capsules 120 Glaxo Smith Kline Anti-Hyperlipidemics (Other) $9.69 9.4%
20 ProAir HFA180 (90 base) mcg/act 8.5 Teva Respiratory Other Agents $2.12 6.0%
21 Humalog KwikPen100 units/ml 3 Lilly Anti-Diabetics (Insulin) $15.67 15.3%
22 Crestor 40 mg tablets 30 AstraZeneca Anti-Hyperlipidemics (Statin) $7.25 14.1%
23 Diovan 160 mg tablets 90 Novartis Angiotensin II Receptor Blockers $5.62 17.9%
24 Pradaxa 150 mg capsules 60 Boehringer Ingelheim Anti-Coagulants $11.15 13.2%
25 Evista 60 mg tablets 30 Lilly Other (Estrogen Agonist-Antagonists) $6.76 0.0%
GENERAL RATE OF INFLATION (AS MEASURED BY GROWTH IN CPI-U) 0.1%
*Ranking based on 2014 spending data provided by the Truven Health MarketScan® Research Databases and a large Medicare Part D plan provider. See Appendix A.
Prepared by the AARP Public Policy Institute and the PRIME Institute, University of Minnesota, based on data from Truven Health MarketScan® Research Databases.
Table 1Annual Change in Retail Price for Top 25 Drug Products in the Brand Name Market Basket, 2015

14 TRENDS IN RETAIL PRICES OF BRAND NAME PRESCRIPTION DRUGS WIDELY USED BY OLDER AMERICANS, 2006–2015
19 The rate of general inflation was 0.12 percent in 2015.
20 The rate of general inflation was 0.12 percent in 2015.
IV. RETAIL PRICE CHANGES FOR MOST WIDELY USED BRAND NAME PRESCRIPTION DRUGS BY MANUFACTURER
Thirty-five drug manufacturers had at least two drug products in the study’s market basket of 268 widely used brand name drugs. Another 13 drug manufacturers with only one brand name drug product in the market basket were grouped into the “All Others” category.
The average annual increase in retail price across all drug manufacturer categories exceeded the general inflation rate in 2015 (Figure 8), suggesting that overall brand name drug price trends in this report are an industry-wide phenomenon.
•• All but two of the drug manufacturers—including the “All Others” category—had a weighted average annual brand name drug price increase at the retail level of more than 5 percent in 2015—more than 40 times the rate of general inflation (0.1 percent) 19 in 2015.
•• Thirty-six drug manufacturers—23 drug manufacturers with 2 or more drug products in the market basket and the 13 drug manufacturers in the “All Others” category—had weighted average brand name drug price
increases of more than 10 percent in 2015, or more than 80 times the rate of general inflation (0.1 percent) in 2015.
— These 36 drug manufacturers represent 78 percent (208 of 268) of the brand name drug products in the market basket in 2015.
•• Fourteen drug manufacturers had weighted average brand name drug price increases of at least 15.0 percent in 2015, or 125 times the rate of general inflation (0.1 percent) in 2015.
•• Three of the drug manufacturers—Horizon Pharma, Lundbeck, and Valeant—had weighted average annual brand name drug price increases at the retail level of more than 40 percent in 2015.
— Horizon Pharma had a weighted average annual increase of 43.8 percent in 2015, which is more than 350 times the rate of general inflation.
— Lundbeck had a weighted average annual increase of 48.2 percent in 2015, which is more than 400 times the rate of general inflation.
— Valeant had a weighted average annual increase of 152.1 percent in 2015, which is more than 1,300 times the rate of general inflation.

TRENDS IN RETAIL PRICES OF BRAND NAME PRESCRIPTION DRUGS WIDELY USED BY OLDER AMERICANS, 2006–2015 15
Note: Calculations of the average annual brand name drug price change include the 268 drug products most widely used by older Americans (see Appendix A). Manufacturers with only one drug product in the market basket of 268 most widely used brand name prescription drugs were included in the “All Others” category. The number in parentheses after a manufacturer’s name indicates the number of drug products in the market basket for that manufacturer. The general inflation rate is based on CPI-U All Items for 2015.
Prepared by the AARP Public Policy Institute and the PRIME Institute, University of Minnesota, based on data from Truven Health MarketScan® Research Databases.
0.8%3.5%
6.8%7.5%7.9%8.3%8.3%8.8%8.9%8.9%9.3%9.9%10.6%11.5%12.0%12.6%13.4%13.6%14.0%14.8%14.9%14.9%15.3%15.4%16.3%17.2%17.5%17.6%17.8%19.5%19.5%21.3%
29.1%43.8%
48.2%152.1%
Average Annual % Change
Brand Name Retail Price General Inflation (0.1%)
Valeant (12)Lundbeck (2)
Horizon Pharma (2)Genzyme (2)
Alcon Vision (8)Merck/Schering-Plough Pharm (4)
Pfizer U.S. (24)Merck Sharp & Dohme (13)
Allergan (4)Sankyo (11)
Novartis (16)Astellas (4)
Sunovion Pharmaceuticals (4)Amgen (3)
Aptalis Pharma (2)All Others (13)
Actavis (17)AbbVie (13)
Lilly (10)Gilead Sciences (2)
Bristol-Myers Squibb (9)Purdue Pharma L.P. (6)
Novo Nordisk (8)AstraZeneca (19)
Glaxo Smith Kline (13)Takeda Pharmaceuticals (5)
Cephalon (2)Boehringer Ingelheim (8)
Genentech (5)UCB Pharma (2)Shire US Inc. (2)
Janssen (10)Endo Pharmaceuticals (2)
Teva (3)PCCA (4)
Sanofi-Aventis U.S. (4)
FIGURE 8RETAIL PRICES FOR WIDELY USED BRAND NAME DRUG PRODUCTS INCREASED BY MORE THAN 5 PERCENT FOR ALL BUT TWO DRUG MANUFACTURERS IN 2015

16 TRENDS IN RETAIL PRICES OF BRAND NAME PRESCRIPTION DRUGS WIDELY USED BY OLDER AMERICANS, 2006–2015
V. RETAIL PRICE CHANGES FOR MOST WIDELY USED BRAND NAME PRESCRIPTION DRUGS BY THERAPEUTIC CATEGORYIn 2015, brand name drug prices at the retail level increased by 5.0 percent or more—more than 40 times the rate of general inflation (0.1 percent)20—for 48 of the 49 therapeutic categories examined in this study. All of the therapeutic categories had average annual price increases that substantially exceeded the general inflation rate (0.1 percent) in 2015 (Figure 9).
•• Twenty-eight therapeutic categories had average annual price increases that were 15 percent—125 times the rate of general inflation—or more in 2015.
— The therapeutic category with the highest brand name drug price increase—anti-anxiety agents—had an average annual retail price increase of 76.5 percent in 2015.
•• Almost one-quarter (12 of 49) of the therapeutic categories for brand name drugs had weighted average annual brand name price increases of more than 20 percent in 2015—more than 160 times the rate of general inflation.
These findings suggest that consumers who are unwilling or unable to switch from one brand name drug to another in the same therapeutic category may face substantial increases in their drug costs.

TRENDS IN RETAIL PRICES OF BRAND NAME PRESCRIPTION DRUGS WIDELY USED BY OLDER AMERICANS, 2006–2015 17
Note: Calculations of the average annual brand name drug price change include the 268 drug products most widely used by older Americans (see Appendix A). Therapeutic categories with only one drug product in the market basket of 268 most widely used brand name prescription drugs were grouped together in the “Other Therapeutic Agents” category. The number in parentheses after a therapeutic category indicates the number of drug products in the market basket for that therapeutic category. The general inflation rate is based on the CPI-U for 2015.
Prepared by the AARP Public Policy Institute and the PRIME Institute, University of Minnesota, based on data from Truven Health MarketScan® Research Databases.
Average Annual % Change
Brand Name Retail Price General Inflation (0.1%)
5.9%6.2%6.8%7.2%7.3%7.5%8.0%8.8%8.9%9.1%9.1%9.5%9.5%10.8%11.1%11.7%12.9%13.9%14.1%14.3%15.0%15.3%15.5%16.2%16.6%16.6%17.1%17.1%17.2%17.3%18.0%18.0%18.6%19.3%19.4%19.5%20.2%20.7%20.8%21.9%
27.1%28.9%29.1%
32.3%
35.9%43.8%
1.6%
32.6%
76.5%Anti-Anxiety Agents (5)Nonsteroidal Anti-Inflammatory Agents (2)
Central Nervous System Agents (3)Anti-Diabetics (Oral) (15)
Anti-Depressants (7)Phosphate-Removing Agents (2)
Vaginal Estrogens (3)Proton-Pump Inhibitors (5)
Androgens (3)Nasal Inhalers (2)
Platelet-Aggregation Inhibitors (3)Erectile Dysfunction Agents (4)
Anticonvulsants (15)Anti-Infective Agents (3)
Anti-Hyperlipidemics (Combination) (3)Ophthalmic Agents (13)
COX-2 Inhibitors (2)Estrogens (5)
Angiotensin II Receptor Blockers (7)Anti-Hyperlipidemics (Other) (4)
Genitourinary Agents (4)Anti-Anginal Agents (3)
Migraine Agents (2)Urinary Anti-Spasmodics (6)
Anti-Hypertensive Combinations (11)Beta Blockers (3)
Calcimimetic Agents (3)Inflammatory Bowel Agents (8)
Anti-Hyperlipidemics (Statin) (6)Bone Resorption Inhibitors (3)
Sedatives & Hypnotics (2)Antipsychotics, Atypical (12)
Opiate Analgesics (7)Other Therapeutic Agents (11)
Antidementia Agents (6)Anti-Diabetics (Other Injection) (3)
Anti-Gout Agents (3)Dermatologic Agents (6)
Thyroid Agents (9)Wakefulness-Promoting Agents (2)
Anti-Viral Agents (2)Anti-Coagulants (8)
Respiratory Steroids (5)Respiratory Combinations (10)
Gastrointestinal Agents (3)Compounding Ingredients (5)
Anti-Diabetics (Insulin) (14)Respiratory (Other) (3)
Bowel Prep Kits (2)
FIGURE 9ALL THERAPEUTIC CATEGORIES FOR BRAND NAME DRUGS HAD RETAIL PRICE INCREASES THAT EXCEEDED THE RATE OF GENERAL INFLATION IN 2015

18 TRENDS IN RETAIL PRICES OF BRAND NAME PRESCRIPTION DRUGS WIDELY USED BY OLDER AMERICANS, 2006–2015
21 D.I. Auerbach and A.L. Kellermann, “A Decade of Health Care Cost Growth Has Wiped Out Real Income Gains for an Average U.S. Family,” Health Affairs, Vol. 30(9) (2011): 1630–636. Consumer Reports, “Is There a Cure for High Drug Prices?” July 29, 2016.
22 Medicare Board of Trustees, 2016 Annual Report of the Boards of Trustees of the Federal Hospital Insurance and Federal Supplementary Medical Insurance Trust Funds, June 22, 2016. Available at: https://www.cms.gov/Research-Statistics-Data-and-Systems/Statistics-Trends-and-Reports/ReportsTrustFunds/downloads/tr2016.pdf.
23 H. Naci, S.B. Soumerai, D. Ross-Degnan, F. Zhang, B.A. Briesacher, J.H. Gurwitz, and J.M. Madden , “Medication Affordability Gains Following Medicare Part D Are Eroding among Elderly with Multiple Chronic Conditions,” Health Affairs, Vol. 33(8) (2014): 1435–443. S.B. Dusetzina and N.L. Keating, “Mind the Gap: Why Closing the Doughnut Hole Is Insufficient for Increasing Medicare Beneficiary Access to Oral Chemotherapy,” Journal of Clinical Oncology, Vol 34 (4) (2016): 375-380.
24 Z.A. Marcum, M.A. Sevick, and S.M. Handler, “Medication Nonadherence: A Diagnosable and Treatable Medical Condition,” Journal of the American Medical Association, Vol. 309(20) (2013): 2105-2106; A.O. Iuga and M.J. McGuire, “Adherence and health care costs, “Risk Management and Healthcare Policy, Vol 7 (2014): 35–44.
25 A.M. Sisko, S.P. Keehan, G.A. Cuckler, A.J. Madison, S.D. Smith, C.J. Wolfe, D.A. Stone, J.M. Lizonitz, and J.A. Poisal , “National Health Expenditure Projections, 2013-23: Faster Growth Expected with Expanded Coverage and Improving Economy,” Health Affairs, Vol. 33(10) (2014): 1–0.
Retail prices increased substantially in 2015 for brand name prescription drugs used by older Americans. Average annual increases in the retail prices of widely used brand name prescription drugs have consistently and greatly exceeded the rate of general inflation (15.5 percent compared with 0.1 percent). The gap between brand name drug price increases and the rate of general inflation has been growing wider over the past few years.
Brand name drug prices have increased at double-digit rates for four years in a row (i.e., 2012 to 2015) reaching an all-time high level of 16.1 percent in 2014 and remaining nearly as high in 2015 at 15.5 percent. For nearly a decade, brand name drug prices have exceeded the general inflation rate of other consumer goods by a factor of two-fold to more than 100-fold. These rates of brand name price increases are not sustainable.
The average annual cost of drug therapy for each brand name prescription used by older Americans was $5,807 in 2015. For the average elderly person who uses 4.5 prescription drugs, that leads to an annual drug therapy cost of approximately $26,132. The annual drug therapy cost for older Americans now exceeds the median annual income of Medicare beneficiaries ($24,150). Drug therapy is not affordable when its cost exceeds the patient’s entire income.
Brand name drug prices at the retail level have a direct impact on the costs borne by individual
consumers and by all other payer types. Brand name drug price increases often result in higher out-of-pocket costs for beneficiaries at the pharmacy, especially for those who pay a percentage of drug costs rather than a fixed copayment. Higher brand name drug prices are also passed along to consumers in the form of higher premiums, deductibles, and other forms of cost sharing.21
Prescription drug price increases also affect taxpayer-funded programs like Medicare and Medicaid. For example, the Medicare Trustees recently noted that price increases for brand name drugs are a major factor driving Medicare Part D spending growth.22 Higher government spending driven by large drug price increases will affect all Americans in the form of higher taxes, cuts to public programs, or both.
If recent trends in brand name drug prices and related price increases continue unabated, the cost of drugs will prompt increasing numbers of older Americans to stop taking necessary medications due to affordability concerns.23 Continued excessive brand name drug price increases will also lead to increased cost sharing and premiums, which could ultimately make health care coverage unaffordable and lead to poorer health outcomes and to higher health care costs in the future.24
Given that health care reform expanded the number of people using prescription drugs,25 it
Concluding Observations

TRENDS IN RETAIL PRICES OF BRAND NAME PRESCRIPTION DRUGS WIDELY USED BY OLDER AMERICANS, 2006–2015 19
would have been reasonable to expect smaller brand name drug price increases. Instead, brand name drug prices have accelerated substantially. Clearly, the economics of the pharmaceutical market are not working as expected.
Policymakers must take a serious look at recent pricing behavior in the pharmaceutical market. Current market forces have not moderated excessive brand name drug price increases
and the resulting increases in pharmaceutical expenditures are not sustainable. Policymakers interested in reducing the impact of brand name prescription drug prices should focus on options that balance the need for pharmaceutical innovation with the need for improved health and the financial security of consumers and taxpayer-funded programs like Medicare and Medicaid.

20 TRENDS IN RETAIL PRICES OF BRAND NAME PRESCRIPTION DRUGS WIDELY USED BY OLDER AMERICANS, 2006–2015
26 Medi-Span is a private organization that collects price and other clinical and drug-related data directly from drug manufacturers and wholesalers. Price-Chek PC (now Price Rx®) is a product of Medi-Span (Indianapolis, IN), a division of Wolters Kluwer Health, Inc., and uses data from the Master Drug Database (MDDB®). This commercial drug database has been published for more than 35 years. See http://www.medispan.com.
27 The retail prices used in this report series reflect the total price for a specific prescription that a PBM bills to a specific health plan for consumers enrolled in employer-sponsored or government-sponsored (i.e., Medicare or Medicaid) health plans and not simply the out-of-pocket cost (such as the copay) that a consumer would pay at the pharmacy. These amounts may or may not reflect what the PBM paid the pharmacy or the usual and customary price that a pharmacy would charge a cash-pay consumer for the same prescription.
28 The Truven Health MarketScan® Research Databases, a family of databases, contain individual-level health care claims, lab test results, and hospital discharge information from large employers, managed care organizations, hospitals, Medicare, and Medicaid programs. Truven Health constructs the MarketScan® Research Databases by collecting data from employers, health plans, and state Medicaid agencies and placing them into databases. E. Danielson, “White Paper: Health Research Data for the Real World: The MarketScan® Databases,” White Paper, Truven Health Analytics, January 2014.
This appendix describes in detail how brand, generic, and specialty drugs are defined in this study; how the study identified the market basket (i.e., sample) of drugs; how it measured prices; and how it calculated weighted average price changes. In addition, the appendix describes methods and assumptions used to determine prices and price changes by drug manufacturer and by therapeutic category.
OVERVIEWAARP’s Public Policy Institute has been publishing a series of reports that track price changes for the prescription drug products most widely used by older Americans with annual and quarterly results reaching as far back as 2000. Since 2008, these reports have focused on price changes for three market baskets—brand, generic, and specialty drugs. In addition, a combined market basket (i.e., brand, generic, and specialty) has been added to the series, which is useful to view the price change trend across all types of prescription drugs in the US market. While this overall perspective is useful for those interested in understanding the industrial economics of the entire prescription drug market, consumers have proved to be considerably more interested in the price trend for the specific products that they
are taking as an individual rather than all drug products on the market.
The AARP Public Policy Institute and the University of Minnesota’s PRIME Institute originally collaborated to report an index of manufacturers’ drug price changes based on the Wholesale Acquisition Cost (WAC) from the Medi-Span Price-Chek PC database.26 In 2009, AARP and the PRIME Institute created an additional drug price index based on actual retail prices27 from Truven Health’s MarketScan® Commercial Database and MarketScan® Medicare Supplemental Database (Truven Health MarketScan® Research Databases).28 Thus, the report series uses the same market basket of brand name prescription drugs widely used by older Americans to examine both manufacturer-level prices and retail-level prices in the market. The addition of retail-level prices allows the AARP Public Policy Institute to assess what prices payers (i.e., insurers, consumers or government programs) are paying and whether rebates and other types of discounts have been passed along to payers and their covered members.
Recently, the AARP Public Policy Institute and the University of Minnesota’s PRIME Institute collaborated to develop a new market basket of widely used prescription drugs based on 2014
Appendix A. Detailed Methodology and Description of Retail Price Data

TRENDS IN RETAIL PRICES OF BRAND NAME PRESCRIPTION DRUGS WIDELY USED BY OLDER AMERICANS, 2006–2015 21
29 The average market exclusivity period for a brand name drug is almost 13 years. H. Grabowski, G. Long, and R. Mortimer, “Brief report: Recent trends in brand-name and generic drug competition,” Journal of Medical Economics, Vol. 17(3) (2014): 207-214.
data provided by the Truven Health MarketScan® Research Databases and a large Medicare Part D plan provider. UnitedHealthcare provides Medicare Part D coverage and is the organization that insures the AARP Medicare Rx plans. This Medicare Part D plan provider supplied data for all prescriptions provided to its Medicare Part D enrollees in 2014. This Rx Price Watch report used the 2014 market basket. As in the past, the series will include separate data sets, analyses, and reports for brand name, generic, and specialty drugs, as well as the overall combined market basket.
Defining Brand, Generic, and Specialty Pharmaceuticals
A brand name drug is defined as a product marketed by the original holder of a new drug application (NDA) or biological license application (BLA) (or related licensees) for a given drug entity. A generic drug is defined as any drug product marketed by an entity other than the NDA or BLA holder or related licensees.
The market conditions and pricing behavior for brand name and generic drugs are quite different. For example, brand name drugs have a monopoly based on patents and other forms of exclusivity for a number of years after market entry,29 and they do not experience typical price competition from therapeutically equivalent drug products that can be routinely and directly substituted at the pharmacy level. On the other hand, generic drug products face price competition from the time the generic first enters the market when there are two or more therapeutically equivalent drug products (as evaluated by the Food and Drug Administration [FDA] and reported in the Orange Book), including the brand name product. However, certain generic drugs—that is, those for which the manufacturer files a paragraph IV certification of patent non-infringement—may receive 180 days of exclusivity as the sole generic after this first generic drug product is approved. In cases where there is only one generic drug product on the market, the level of economic competition may be somewhat limited until other
economically-independent generic marketers enter the market.
Specialty pharmaceuticals are drugs that treat complex, chronic conditions and that often require special administration, handling, and care management. Specialty drugs are expected to be the fastest growing group of new drug products in the next decade. This important group of drugs and biologicals is not precisely defined, but it includes products based on one or more of the following: (1) how they are made, (2) how they are approved by the FDA, (3) conditions they treat, (4) how they are used or administered, (5) their cost, and (6) other special features. The operational definition of specialty drugs for this study is further described in a later section of the methodology.
Creating the Market Basket of Drugs
The AARP Public Policy Institute has been reporting prescription drug product price changes since 2004. The original reports were based on a market basket of retail and mail-order prescriptions provided to about two million people ages 50 and older who used the AARP Pharmacy Service in 2003. Following the implementation of the Medicare Part D program, we chose to develop a new market basket of drugs using 2006 data provided by UnitedHealthcare (formerly called PacifiCare), which is also the organization that insures the AARP Medicare Part D plans. All AARP price trend reports published between 2007 and 2012 used this market basket.
Subsequently, we updated the AARP market baskets again using 2011 data provided by Truven Health MarketScan® Research Databases and the same Medicare Part D plan provider that was used for the 2006 market basket. We weighted the data from the Medicare Part D plan provider by Part D enrollment and the Truven Health MarketScan® data by the 50-plus population less Part D enrollment, based on data from the Centers for Medicare and Medicaid Services and the U.S. Census. We then merged the weighted data to develop and rank a weighted master list by prescription volume and sales at the National

22 TRENDS IN RETAIL PRICES OF BRAND NAME PRESCRIPTION DRUGS WIDELY USED BY OLDER AMERICANS, 2006–2015
30 Price Rx® is a product of Medi-Span (Indianapolis, IN), a division of Wolters Kluwer Health, Inc., and is based on data from the Master Drug Database (MDDB®).
Drug Code (NDCs) level for the new AARP market baskets.
This process was recently repeated using 2014 data provided by the same data sources. The 2014 market basket is the basis of this report and the 2015 Rx Price Watch reports on generic, specialty, and the combined market basket.
Our selection of the market basket of drugs to track in the price index was a multi-step process. First, prescriptions covered and adjudicated by the commercial entities included in the merged data set were grouped by NDC number. The NDC is a number that refers to a specific drug product presentation with a unique combination of active chemical ingredient, strength, dosage form, package type and size, and manufacturer (for example, Nexium [esomeprazole magnesium] 40 mg, capsule, bottle of 30, AstraZeneca). As a result, some drug entities (i.e., molecules) could appear more than once among the widely used drug products e.g., when there are different strengths, such as Lipitor 10 mg, Lipitor 20 mg, and Lipitor 40 mg). For each NDC, we calculated total sales revenue from adjudicated prescription claims, including the patient cost-sharing amount, as well as the total prescriptions dispensed, the total units supplied, and the total days of therapy provided during 2014.
The next step involved merging the use and expenditure data from the Truven Health MarketScan® Research Databases and the Medicare Part D plan provider by NDC code and then linking the data with descriptive information from Medi-Span’s Price Rx® drug database,30 using the NDC number as the key linking variable. The descriptive data from Price Rx included drug product information such as brand name, generic name, manufacturer, patent status, package size, route of administration, usual dose, therapeutic category, usual duration, and each price history.
All NDCs were classified by the patent status of the drug product presentation—that is, patented brand name (i.e., brand single source [SS]), off-patent brand name (i.e., brand multiple source [BMS] or innovator multiple source [IMS]), and
off-patent generic (i.e., generic multiple source [GMS] or non-innovator multiple source [NMS]). We then grouped all NDC numbers by the Generic Product Indicator (GPI) code into GPI-patent status groups using the GPI code from Price Rx®. The GPI combines drug products into a common group when they have the same active ingredients, dosage form, and strength—a single GPI includes the NDCs for any package type and size and from all manufacturers. When patent status is combined with the GPI categories, each GPI will typically be either a single source GPI (GPI-brand-single source) or a multiple source GPI with both a GPI-brand multiple source group and a GPI-generic multiple source group.
The next step involved summing the total expenditures, number of prescriptions dispensed, and days of therapy provided across all NDCs within each GPI-patent status group. The NDCs within each GPI-patent status group were then rank ordered based on total annual expenditure for each NDC. The designated “representative NDC” was the NDC that had the highest level of expenditure within each GPI-patent status group. If the NDC with the greatest expenditure level was inactive, the NDC with the next highest level of expenditure became the representative NDC.
This analysis excluded less than 0.5 percent of the expenditures and the prescriptions because they were for non-drug items. These non-drug items included devices, medical and diabetic supplies, syringes, compounding service fees, and other professional services. After exclusion of non-drug items, the 2014 data set contained 36,866 NDCs grouped into 6,085 GPI-patent status categories.
We then coded all GPIs to distinguish the specialty prescription drugs from other regular, or traditional, prescription drugs. The definition of specialty prescription drugs used here is a prescription drug that is: (1) administered by injection, such as intravenous, intramuscular, sub-cutaneous, or other injection site (not including insulin); (2) a drug product approved by the FDA through a BLA (biological License Application); (3) a drug product that has a total average prescription cost greater than $1,000 per prescription; or (4) any drug product that has a total average cost

TRENDS IN RETAIL PRICES OF BRAND NAME PRESCRIPTION DRUGS WIDELY USED BY OLDER AMERICANS, 2006–2015 23
31 E. Danielson, “White Paper: Health Research Data for the Real World: The MarketScan® Databases,” Truven Health Analytics, January 2014.
32 Ibid.
33 Ibid.
greater than $33 per day of therapy. The drug products meeting this definition were considered “specialty drugs” and all other prescription drugs were considered “regular,” “traditional,” or “non-specialty” drugs. Throughout this report, references to the market basket of drugs refer to the regular (non-specialty) drugs unless otherwise indicated. Only specialty drugs provided through a Medicare Part D program or under a prescription drug benefit program are included. The specialty drugs provided under Medicare Part B, or under a commercial health plan and administered in a clinic or physician’s office and billed as a medical claim, are not included in this data set or this analysis.
All NDCs were classified by the patent status of the drug product presentation—that is, patented brand name (or SS), off-patent brand name (or IMS), or off-patent generic (NMS). We classified both the regular and the specialty drug data sets by patent status.
We sorted the list of all GPI-patent status groups in the merged data set for 2014 by three criteria: (1) total prescription expenditures, (2) number of prescriptions dispensed, and (3) days of therapy provided. The top 500 GPI-patent status categories were identified for each of these three criteria. Since some GPI-patent status groups appeared in more than one of these top 500 lists, the combined list of all GPI-patent status groups totaled to 627 GPI-patent status groups. There were 268 brand name GPI-patent status groups (i.e., both brand single source and brand multiple source) and about 400 generic GPI-patent status groups. Also, there were about 100 GPI-patent status groups in this combined top 500 list that were classified as specialty drugs.
The three market baskets (brand name, generic, and specialty drugs) combined accounted for 83.0 percent of all prescription drug expenditures and 82.8 percent of all prescriptions dispensed.
Monitoring Retail Drug Prices
The original Rx Watchdog reports were based on market baskets of drugs constructed using data from a Medicare Part D plan provider for 2006 and manufacturer drug price changes measured using WAC data from the Medi-Span Price-Chek PC database. The AARP Public Policy Institute and the University of Minnesota’s PRIME Institute collaborated to develop a new retail drug price index known as the Rx Price Watch reports based on retail-level prescription prices from the Truven Health MarketScan® Research Databases. This retail price index allows the AARP Public Policy Institute to assess retail prices actually paid by consumers or insurers and to determine whether the rebates and discounts sometimes given to payers are being passed along to consumers.
Retail Data Description
The Truven Health MarketScan® Research Databases are comprised of 12 fully integrated claims databases, and contain the largest collection of privately and publicly insured, de-identified patient data in the United States.31 The warehouse features an opportunity sample from multiple sources (employers, states, health plans), more than 20 billion patient records, and 196 million covered lives since 1995.32 The data used in the Rx Price Watch analyses are drawn from the Truven Health MarketScan® Commercial Claims and Encounters Database (Commercial Database) and the Truven Health MarketScan® Supplemental and Coordination of Benefits Database (Medicare Supplemental Database).
The Truven Health MarketScan® Commercial Database consists of employer- and health plan-sourced data containing medical and drug data for several million individuals annually. It encompasses employees, their spouses, and dependents covered by employer-sponsored private health insurance. Health care for these individuals is available under a variety of fee-for-service (FFS), fully capitated, and partially capitated health plans. These include preferred provider organizations

24 TRENDS IN RETAIL PRICES OF BRAND NAME PRESCRIPTION DRUGS WIDELY USED BY OLDER AMERICANS, 2006–2015
34 Ibid.
(PPOs) and exclusive provider organizations (EPOs), point of service (POS) plans, indemnity plans, health maintenance organizations (HMOs), and consumer-directed health plans.33
The Truven Health MarketScan® Medicare Supplemental Database is composed of data from retirees with Medicare supplemental insurance sponsored by employers or unions. In 2010, 14 percent of the 46.5 million Medicare beneficiaries received their drug benefits through a retiree coverage plan.34 The Truven Health MarketScan® Medicare Supplemental Database includes the Medicare-covered portion of payment, the employer-paid portion, and any patient out-of-pocket expenses. The database provides detailed cost and use data for health care services performed in both inpatient and outpatient settings.
The retail price data drawn from the Truven Health MarketScan® Commercial Database and Truven Health MarketScan® Medicare Supplemental Database had to meet several conditions in order to be included in the analysis:
1. Claimant must be age 50 or older;2. Claim must have a value of greater than zero in
the following fields;a. Total payment amount
b. Metric quantity
c. Ingredient cost
d. Days’ supply
e. Average wholesale price
3. Payment amount cannot be less than 100 percent of the ingredient cost
4. Claim must come from a non-capitated health plan.
Truven Health Analytics then combined the two databases and provided the AARP Public Policy Institute with datasets that included the monthly median (as well as the 25th and 75th percentile) retail price from January 2005 through December 2015 for all of the drug products in the Rx Price Watch market baskets. We then compiled the monthly median retail prices in spreadsheets
designed to track price changes among all of the drug products in the AARP market baskets.
Calculating Annual Price Changes for Each Drug
This Rx Price Watch reports calculate average retail price changes for drug products in the following ways:
•• The annual point-to-point percent change in retail price is the percent change in price for a given month compared with the same month in the previous year (e.g., January 2015 vs. January 2014, February 2015 vs. February 2014).
•• The 12-month rolling average percent change in retail price is the average of the point-to-point changes over the preceding 12 months. For example, the average annual retail price changes for 2015 refer to the average of the annual point-to-point price changes for each of the 12 months from January 2015 through December 2015 compared with the same months in 2014.
We calculated average annual price changes for each drug product for each year that the drug was on the market from 2006 to 2015. The first step was to calculate the annual point-to-point percent change for each month by comparing the price in a specific month with the same month in the previous year (e.g., January 2015 vs. January 2014, February 2015 vs. February 2014). The next step was to calculate the average of these annual point-to-point changes for the 12 months in each calendar year. For example, average annual price changes for 2015 refer to the average of the annual point-to-point price for each of the 12 months in 2015. This 12-month rolling average tends to be a more conservative estimate of price changes than the point-to-point method (i.e., a simple percentage change for a single month from the same month in the previous year), and it accounts for seasonal variations in drug manufacturers’ pricing policies.
Table A-1 shows how 12-month rolling average price changes are calculated. Suppose, for example, that drug A had the following pattern of price changes in 2015 when compared with the same month in 2014:

TRENDS IN RETAIL PRICES OF BRAND NAME PRESCRIPTION DRUGS WIDELY USED BY OLDER AMERICANS, 2006–2015 25
35 If the drug was introduced to the market in July of the previous year, then the price change for the given year is averaged using only the six months that the product was on the market in the previous year (i.e., July through December).
In this example, the retail price of drug A was 2 percent higher than the price for the same months in the previous year, for the period from January through April 2015. A price hike in May increased the percentage difference to 3 percent for each of the subsequent months in 2015. The 12-month average of these price differences is
(2.0+2.0+2.0+2.0+3.0+3.0+3.0+3.0+3.0+3.0+3.0+3.0)/12, or 2.67 percent.35
Calculating Aggregate Average Price Changes across Multiple Drugs
To aggregate price changes for multiple drugs, we calculated a weighted average of price changes by weighting each drug’s annual price change (calculated from the Truven Health MarketScan® Commercial Database and the Truven Health MarketScan® Medicare Supplemental Database, as shown in the hypothetical example in Table A-1) by its share of total 2014 prescription sales within its given market basket (i.e., brand name, generic, specialty, or combined). As an example, Table A-2
shows that the sample from which drug A was drawn has 10 drugs (we chose this small sample size to simplify this illustrative example). The second column of Table A-2 gives the average annual price change for each of these drugs, denoted as drugs A through J. A straight (or unweighted) average, which adds up individual values and divides by the number of drugs, would result in an average annual price change of 4.76 percent for the drugs in this hypothetical sample. Assuming the hypothetical changes in the dollar cost of therapy for these drugs, shown in the third column, the straight average change in the annual cost of therapy would be $236.13.
A straight average, however, does not account for the actual impact of price changes because it does not account for each product’s “weight” (or share) within the sample (i.e., it gives equal weight to price changes of both commonly used drugs and drugs that are used less frequently). As a result, it does not accurately capture the average impact of price changes in the marketplace. In TableA-2,
Jan 14– Jan 15
Feb 14– Feb 15
Mar 14– Mar 1
Apr 14– Apr 15
May 14–May 15
Jun 14– Jun 15
Jul 14– Jul 15
Aug 14– Aug 15
Sep 14– Sep 15
Oct 14– Oct 15
Nov 14– Nov 15
Dec 14– Dec 15 Average
2.0 2.0 2.0 2.0 3.0 3.0 3.0 3.0 3.0 3.0 3.0 3.0 2.67
Table A-1Average Annual Percent Change in Price for Hypothetical Prescription Drug A, 2015
Drug Name
Unweighted Average Annual Price Change
(%)
Unweighted Average Change
in Cost of Therapy ($/year)
Share of Total
Sales
Weighted Average Annual
Price Change (%)
Weighted Average Change
in Cost of Therapy ($/year)
A 2.67% $623.48 15% 0.40% $93.52
B 10.00% $108.68 14% 1.40% $15.22
C 2.67% $433.68 7% 0.19% $30.36
D 8.00% $ 54.08 10% 0.80% $ 5.41
E 1.50% $162.76 5% 0.08% $ 8.14
F 4.33% $ 54.08 14% 0.61% $ 7.57
G 6.40% $216.84 2% 0.13% $ 4.34
H 3.25% $433.68 18% 0.59% $78.06
I 7.80% $ 27.04 13% 1.01% $ 3.52
J 1.00% $247.00 2% 0.02% $ 4.94
TOTAL 4.76% $236.13 100% 5.22% $251.07
Table A-2Average Changes in Price and Cost of Therapy for 10 Hypothetical Prescription Drugs, 2015

26 TRENDS IN RETAIL PRICES OF BRAND NAME PRESCRIPTION DRUGS WIDELY USED BY OLDER AMERICANS, 2006–2015
drugs with low price increases in percentage terms (drugs E and J) account for a small share (7 percent) of total 2014 sales for the specific group of drugs analyzed. By contrast, drugs with the highest percentage changes (drugs B, D, and I) account for a much larger share (37 percent) of sales. To reflect the relative importance of each drug’s price change in the market basket of products, we weighted each annual price change by the drug’s share of total 2014 sales. In this simple example, the weighted average price increase in 2015 is the sum of:
(Unweighted average price change for drug A × drug A’s share of total sales) +
(Unweighted average price change for drug B × drug B’s share of total sales) +
(Unweighted average price change for drug C × drug C’s share of total sales) +
… + (Unweighted average price change for drug J × drug J’s share of total sales)
or,
(2.67 × 0.15) + (10.0 × 0.14) + (2.67 × 0.07) + … + (1.0 × 0.02).
The results of this calculation are in the fifth column of Table A-2, which shows that the weighted annual average price change for the drugs is 5.22 percent, or approximately one-half a percentage point higher than the unweighted average of 4.76 percent. The weighted dollar change in the annual cost of therapy would be $251.07, compared with the unweighted average dollar change of $236.13.
Calculating Average Price Changes across Multiple Drugs for Years before 2014
The process for aggregating price changes for multiple drugs pre-2014 is similar to that for 2014. Average price changes for 2006 through 2013 were derived by first calculating the rolling average annual price change for each drug (as shown in Table A-1), then weighting each drug’s price change by its share of total sales in the sample. The weights used for all years in this study are from 2014 sales from the Medicare Part D plans of a Medicare Part D plan provider, including the AARP plans, as well as from the Truven Health MarketScan® Commercial Database, and the Truven Health MarketScan® Medicare
Supplemental Database. The 2014 weights keep the market basket constant over time so that the change in prices would be a function of price changes alone and not a function of changes in market basket utilization or mix.
However, some drugs that were in the 2014 sample were not on the market in all earlier years. We dropped these drug products from the analysis in the month before they entered the market and for all previous months, and recalculated the weights of the products present in the market prior to 2014 to reflect their relative share of the total sales as adjusted to reflect only drugs on the market during that period.
For example, suppose that drugs I and J in Table A-2 were not on the market in 2011. Furthermore, assume that total drug spending in 2014 was $100,000. To capture the loss of drugs I and J from the analysis for 2011, the weights are redistributed across the drugs that remain in the analysis (drugs A through H); the new weights are still based on their 2014 sales but as a share of total sales for the smaller number of drugs in the analysis for the year. In this example, the total 2014 sales of drugs on the market in 2011 would be $85,000 without drugs I and J. Drug A’s $15,000 in sales, which represented 15 percent of sales for all 10 drugs, rises to 18 percent of sales when I and J are excluded. This weight, along with the analogous weights for drugs B through H, was used to derive the weighted average price change for 2011 (see Table A-3).
Weighting the previous years’ price changes by 2014 sales potentially creates a bias relative to using each specific year’s sales as the basis for assigning weights for that year. Using 2014 sales gives more weight to drugs that, relative to other drugs, had high rates of sales growth in 2014 or earlier years compared with the year analyzed. In general, however, newer drugs initially have higher rates of sales growth, but relatively lower rates of price growth, than do older drugs. This pattern occurs both because newer drugs may have been introduced at higher prices and because price increases for brand name drugs tend to accelerate in rate and amount closer to the end of a product’s effective patent life.

TRENDS IN RETAIL PRICES OF BRAND NAME PRESCRIPTION DRUGS WIDELY USED BY OLDER AMERICANS, 2006–2015 27
Calculating Annual Cost of Therapy for a Drug Product
To assess the impact of price changes on dollars spent, we calculated an annual cost of therapy for each drug product. This annual cost of therapy analysis excludes drug products in the market basket that are used primarily for treatment of acute conditions or are typically taken for a limited period of time. The amount of a drug that an average adult would take on a daily basis was determined using the “usual daily dose” reported in the Medi-Span Price Rx® database. When this information was not available from Medi-Span, we used dosing information in the FDA-approved labeling for the drug product. The weighted average annual cost of therapy was also calculated using the 2014 sales volumes to weight the annual cost of each drug product to produce the aggregate annual cost of therapy across all drug products in the study’s market basket.
Defining Manufacturer
We defined a drug manufacturer as the firm marketing the drug product under its corporate name in 2014. If a listed manufacturer is a
division of another firm, we defined its drugs as marketed by the parent firm. This includes cases where the firm marketing a drug product may have changed over time due to mergers and acquisitions, divestitures of specific drug products, or for other reasons. The analysis of drug manufacturers reported separately on manufacturers with at least two drug products (at the NDC level) among the most widely used drugs.
Defining Therapeutic Category
Drug products can be classified by the therapeutic purpose for which they are used. If a drug has multiple uses, the most common indication typically becomes the classifier. To group drug products in this study into similar therapeutic categories, we used Medi-Span’s therapeutic coding scheme, known as the GPI code.
The therapeutic categories used in this study use an intermediate GPI-level code that specifies the groupings of similar chemical entities such as “Proton Pump Inhibitors.” A brand name therapeutic category may include drug products that are brand single source or brand multiple source.
Drug Name
2014 Weights 2011 WeightsShare of
2014 Sales (%)
Value of 2014 Sales
($)
2014 Sales of Drugs on Market in 2011
($)
2014 Share of Drugs on Market in 2011
(%)A 15% $15,000 $15,000 18%
B 14% $14,000 $14,000 16%
C 7% $ 7,000 $ 7,000 8%
D 10% $10,000 $10,000 12%
E 5% $ 5,000 $ 5,000 6%
F 14% $14,000 $14,000 16%
G 2% $ 2,000 $ 2,000 2%
H 18% $18,000 $18,000 21%
I 13% $13,000 − −
J 2% $ 2,000 − −
TOTAL 100% $100,000 $85,000 100%
Table A-3Recalculating Weights When Prescription Drugs Drop out of the Sample

28 TRENDS IN RETAIL PRICES OF BRAND NAME PRESCRIPTION DRUGS WIDELY USED BY OLDER AMERICANS, 2006–2015
This AARP report tracked prices at the retail level for widely used brand name drug products for the 10-year period from December 31, 2005, to December 31, 2015. The market basket for this analysis included 268 brand name prescription drug products. One-fifth (53 of 268) of the widely used drug products in the brand name market basket faced generic competition in 2014, 2015, or 2016.
Figure B-1 shows the annual percent increase in brand name drug prices using the complete brand name market basket (268 drugs). Figure B-1 also shows the annual percent increase using only those drugs in the brand name market basket that did not face generic competition at any point during the 10-year study period (183 drugs).
Comparing the annual price change trends for all brand name drugs in the market basket (268 drugs) with annual price change trends for only those brand name drugs with no generic competition (183 drugs), we found the following:
•• The average annual price change for the complete brand name market basket (268 drugs) was 15.5 percent for 2015, while the average annual price change for the brand name market basket with only those drugs not facing generic competition (183 drugs) was 14.8 percent.
•• Brand name drugs without generic competition had a slightly lower rate of price
increases in 2015 than the total brand name market basket. In 2013 and 2014, the brand name drugs without generic competition had a slightly higher rate of price increases than the total brand name market basket (16.0 percent to 15.4 percent; and 16.3 percent to 16.1 percent, respectively).
•• Excluding brand name drug products that faced generic competition in the study period (2006 to 2015) from the overall brand name drug market basket reported in this study would have resulted in a higher percent increase in brand name drug prices in two of the past three years (i.e., 2013 and 2014, but not 2015).
•• Excluding brand name drug products that faced generic competition in the study period (2006 to 2015) from the overall brand name drug market basket resulted in a higher average annual price change rate in 2006, 2008, 2013, and 2014, and a lower average annual price change rate for 2010, 2011, 2012, and 2015. There was no difference in 2007 and 2009 (see Figure B1).
This report also calculated the annual cost of therapy for widely used brand name drugs used to treat chronic conditions. Among the drugs in the market basket used in this analysis, 214 drugs (80 percent) are used to treat chronic conditions.
Appendix B. AARP Market Basket Effect of Brand Name Drugs Facing Generic Competition

TRENDS IN RETAIL PRICES OF BRAND NAME PRESCRIPTION DRUGS WIDELY USED BY OLDER AMERICANS, 2006–2015 29
Figure B-2 reports the annual cost of therapy for brand name drugs used to treat chronic conditions for the years 2006 to 2015.
When we compared the average annual cost of therapy for the complete market basket of widely used chronic-use, brand name drugs (214 drugs) to widely used chronic-use, brand name drugs that did not face generic competition at any point during the 10-year study period (142 drugs) we found the following:
•• The average annual cost of therapy for the complete brand name market basket of chronic-use drugs (214 drugs) was $5,807 for 2015, while the average annual cost of therapy for the brand name market basket of chronic-use drugs not facing generic competition (142 drugs) was $5,724. In 2014, the average annual cost of therapy was $4,895 for all chronic-use drugs versus $5,051 for those chronic-use drugs that did not face any competition.
•• Excluding widely used brand name drug products that faced generic competition in the study period (2006 to 2015) from the complete brand name drug market basket as reported in this study would have resulted in a slightly
lower average annual cost of therapy in 2015 ($5,807 versus $5,724) and a slightly higher average annual cost of therapy in 2014 ($4,895 versus $5,051).
•• The use of the complete chronic-use brand name drug market basket (214 drugs) resulted in a similar estimate of the average annual cost of therapy for widely used brand name drugs in 2014 and 2015.
•• Excluding widely used brand name drug products that faced generic competition in the study period (2006 to 2015) from the complete brand name drug market basket would have resulted in higher average annual cost of therapy in 2006, 2007, 2008, and 2014 and a lower average annual cost of therapy in 2010, 2011, 2012, 2013, and 2015. There would be no difference in 2009 (see Figure B2).
In conclusion, the rate of price increases for chronic-use drugs with generic competition was slightly higher than for drugs without competition in 2015, however, the opposite pattern was observed for 2014. Across the two years (2014 and 2015), brand name chronic-use drugs had a similar rate of increase in drug prices.
Prepared by the AARP Public Policy Institute and the PRIME Institute, University of Minnesota, based on data from Truven Health MarketScan® Research Databases.
All Brand Name Drugs in the Market Basket (268) Only Brand Name Drugs with No Generic Competition (183)
Ave
rage
Ann
ual %
Cha
nge
0.0%
2.0%
4.0%
6.0%
8.0%
10.0%
12.0%
14.0%
16.0%
18.0%
5.9%6.6%
8.7% 8.2% 7.8%
9.7%
12.0%
15.4%16.1%
15.5%
6.2% 6.6%
9.0%8.2%
7.4%
9.2%
11.8%
16.0% 16.3%
14.8%
2006 2007 2008 2009 2010 2011 2012 2013 2014 2015
FIGURE B-1RETAIL PRICE TRENDS ARE SIMILAR IN AARP BRAND NAME MARKET BASKET AND FOR BRAND NAME DRUGS WITH NO GENERIC EQUIVALENTS

30 TRENDS IN RETAIL PRICES OF BRAND NAME PRESCRIPTION DRUGS WIDELY USED BY OLDER AMERICANS, 2006–2015
Prepared by the AARP Public Policy Institute and the PRIME Institute, University of Minnesota, based on data from Truven Health MarketScan® Research Databases.
All Brand Name Drugs for Chronic Conditions (214)Only Brand Name Drugs for Chronic Conditions with No Generic Competition (142)
Ave
rage
Ann
ual C
ost
of T
hera
py
$7,000
$6,000
$5,000
$4,000
$3,000
$2,000
$1,000
$0 2006 2007 2008 2009 2010 2011 2012 2013 2014 2015
$1,788 $1,930$2,242
$2,385$2,698
$2,995
$3,427
$4,209
$4,896
$5,807
$1,856 $1,990$2,180 $2,317
$2,681$2,976
$3,405
$4,314
$5,051
$5,724
FIGURE B-2RETAIL PRICE TRENDS ARE SIMILAR IN AARP MARKET BASKETS WITH AND WITHOUT BRAND NAME DRUGS WITH GENERIC EQUIVALENTS

Rx Price Watch Report 2016-04, December 2016
© AARP PUBLIC POLICY INSTITUTE601 E Street, NWWashington DC 20049
Follow us on Twitter @AARPpolicyon facebook.com/AARPpolicywww.aarp.org/ppi
For more reports from the Public Policy Institute, visit http://www.aarp.org/ppi/.