trends in snowfall versus rainfall in the western...
TRANSCRIPT
Trends in Snowfall versus Rainfall in the Western United States
NOAH KNOWLES
U.S. Geological Survey, Menlo Park, California
MICHAEL D. DETTINGER AND DANIEL R. CAYAN
U.S. Geological Survey, Menlo Park, and Scripps Institution of Oceanography, University of California, San Diego,La Jolla, California
(Manuscript received 29 April 2005, in final form 21 November 2005)
ABSTRACT
The water resources of the western United States depend heavily on snowpack to store part of thewintertime precipitation into the drier summer months. A well-documented shift toward earlier runoff inrecent decades has been attributed to 1) more precipitation falling as rain instead of snow and 2) earliersnowmelt. The present study addresses the former, documenting a regional trend toward smaller ratios ofwinter-total snowfall water equivalent (SFE) to winter-total precipitation (P) during the period 1949–2004.
The trends toward reduced SFE are a response to warming across the region, with the most significantreductions occurring where winter wet-day minimum temperatures, averaged over the study period, werewarmer than �5°C. Most SFE reductions were associated with winter wet-day temperature increasesbetween 0° and �3°C over the study period. Warmings larger than this occurred mainly at sites where themean temperatures were cool enough that the precipitation form was less susceptible to warming trends.
The trends toward reduced SFE/P ratios were most pronounced in March regionwide and in January nearthe West Coast, corresponding to widespread warming in these months. While mean temperatures in Marchwere sufficiently high to allow the warming trend to produce SFE/P declines across the study region, meanJanuary temperatures were cooler, with the result that January SFE/P impacts were restricted to the lowerelevations near the West Coast.
Extending the analysis back to 1920 shows that although the trends presented here may be partiallyattributable to interdecadal climate variability associated with the Pacific decadal oscillation, they alsoappear to result from still longer-term climate shifts.
1. Introduction
One of the most common, and common sense, pro-jections of the impact of global warming on the westernUnited States is that warming will reduce the volumesand persistence of snowpacks across the region (e.g.,Gleick 1987; Lettenmeier and Gan 1990; Dettinger etal. 2004; Knowles and Cayan 2004; Stewart et al. 2004).Warming in the western states is expected to reduce thefraction of precipitation that falls as snow rather thanrain and hasten the onset of snowmelt once snowpackshave formed.
In this context, recent observations in many rivers ofthe mountainous western United States and Canadaindicate a tendency for streamflow from snow-domi-
nated basins to arrive progressively earlier in recentdecades in response to large-scale warming (Roos 1991;Dettinger and Cayan 1995; Cayan et al. 2001). Wide-spread trends toward less winter’s end (April) snow-pack water content have also been reported (Mote2003; Mote et al. 2005). Trends in the dates of onset ofrapid snowmelt runoff in spring (Cayan et al. 2001;Stewart et al. 2005) indicate that an important part ofthe changes in runoff timing has been the earlier onsetof springtime snowmelt across the region, but the pos-sible contribution of shifts toward more rainfall and lesssnowfall has received less attention to date. In thenortheastern states, trends toward decreases in the frac-tion of precipitation as snowfall have already beendocumented (Huntington et al. 2004). To better under-stand the nature of the observed changes in snowpackand streamflow timing in the West, historical changes inthe relative contributions of rainfall and snowfall areassessed here.
Corresponding author address: Noah Knowles, U.S. GeologicalSurvey, MS 496, 345 Middlefield Rd., Menlo Park, CA 94025.E-mail: [email protected]
15 SEPTEMBER 2006 K N O W L E S E T A L . 4545
JCLI3850
Western warming trends historically have been (andpresumably will continue to be) marked by strong sea-sonal and geographic patterns (e.g., Diaz and Quayle1980; Dettinger et al. 1995; Cayan et al. 2001). Becauseof the general wintertime maximum of snowfall andprecipitation in the region, contributions of snow towestern precipitation are likely to be most affected bywintertime (November–March) temperatures, whereaschanges in onset of snowmelt (once snow is on theground) are more likely to be sensitive to springtimetemperatures. Thus, snow deposition and snowmelt areexpected to be differently sensitive to warming trendsin different seasons, and the warming trends associatedwith snowfall and snowmelt changes may be distin-guishable by differences in their geographic patternsand rates of change. Much work has been accomplishedin mapping trends in snowmelt response; this studydocuments a parallel set of trends that has changed therelative contributions of snowfall to western precipita-tion.
In section 2, the data used and the methods appliedare discussed, and the robustness of the approach isaddressed. In section 3a, trends in winter precipitationform are presented, and in section 3b, the influence oftemperature on these trends is examined. In section 3c,the monthly patterns underlying the seasonal trends arepresented. In section 3d, the role of climate variabilityin generating trends in precipitation form is investi-gated. Finally, the main results are summarized in sec-tion 4, and their implications discussed.
2. Data and methods
The measure of snowfall that will be used in thisstudy is the snowfall liquid water equivalent (SFE), de-
fined as the precipitation totals on days for which newlyfallen snow was recorded. These data and the tempera-ture data used in this study were derived from the his-torical Summary of the Day (SOD) observations fromcooperative weather stations in the 11 westernmoststates of the conterminous United States (Fig. 1), ob-tained from the National Climatic Data Center. Theobservations used here comprise daily snowfall depth(S, actual depth as opposed to liquid equivalent), pre-cipitation (P, regardless of form), and maximum(TMAX) and minimum (TMIN) surface air tempera-ture, from October 1948 to September 2004. Because Sis not a reliable proxy for snowfall liquid equivalentsince snow density can vary significantly, and because Pobservations have no associated data flags indicatingthe precipitation form (i.e., solid, liquid, or mixed), inthis study, a nonzero value of snowfall depth (S) is usedto assign a solid form to any measured precipitation(P), thereby estimating snowfall water equivalent(SFE).
Precipitation and snowfall totals were recorded at1653 stations during some or all of this period; tempera-tures were recorded at 1517 stations. Emulating the ap-proach developed by Huntington et al. (2004) for a similaranalysis in the northeastern United States, the recordsof precipitation and snowfall at the western stationswere culled according to the following sequential steps.
1) Any cool season during which precipitation or snow-fall data were missing for 10 or more days betweenNovember and March was considered incompleteand was excluded from the analysis.
2) Any station that was missing �50% of its Novem-ber–March daily observations in any given 10-yr pe-riod was excluded.
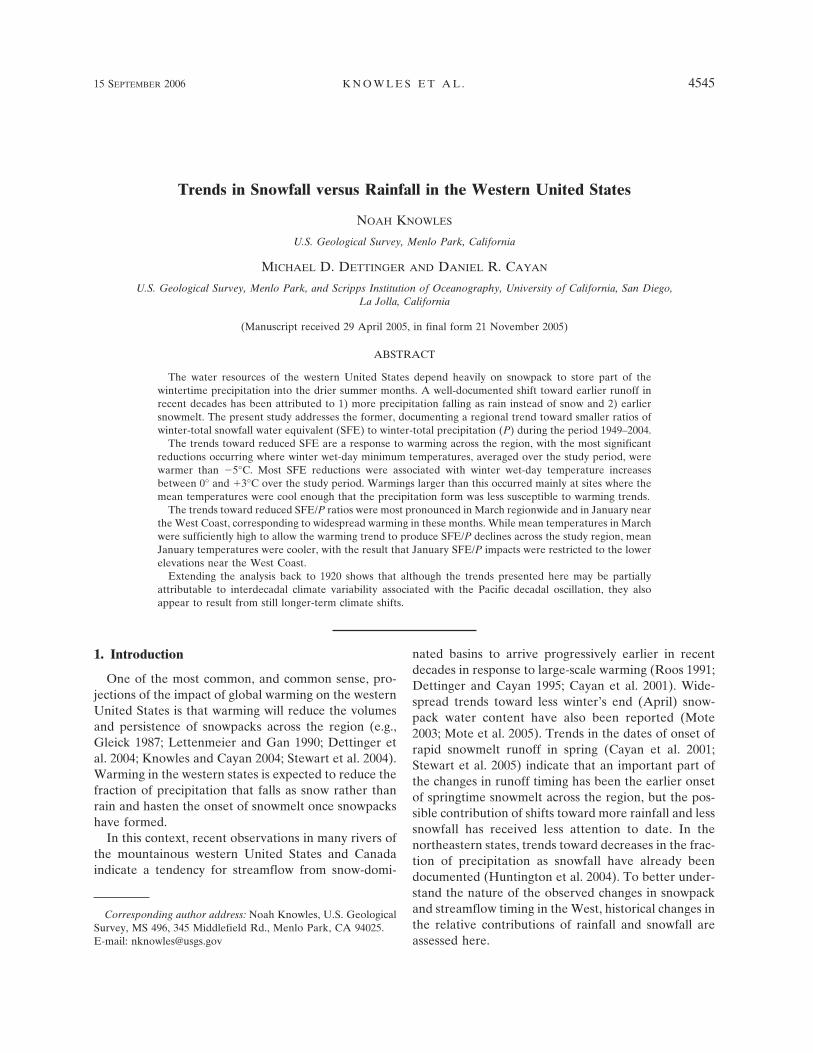
FIG. 1. (a) Trends in fraction of winter (Nov–Mar) precipitation falling on snowy days (SFE/P), 1949–2004: redindicates decreasing snowfall fractions; symbol radius is proportional to study period changes, measured in stan-dard deviations of the detrended time series as indicated; circles indicate high trend significance ( p � 0.05), andsquares indicate lower trend significance. (b) The WY2004 winter SFE/P vs WY1949 winter SFE/P, with significantSFE/P trends highlighted with squares. Dashed line is the least squares fit to all data points.
4546 J O U R N A L O F C L I M A T E VOLUME 19
Fig 1 live 4/C
3) Any station at which the mean winter snowfall total(described here by the November–March sums ofdaily snowfall water equivalents, SFE, described be-low) was less than 25 mm was excluded.
This study focused on a winter season, defined hereas November–March, because, on average over all thestations, 80% of snowfall occurred during that interval.The analyses below were repeated using the period Oc-tober–May, which accounted for 98% of snowfall ag-gregated over all stations and greater than 90% ofsnowfall at every individual station. No substantialchanges in the results were obtained by using thislonger season, except that fewer stations survived thecompleteness tests and the relative contributions ofsnow to overall precipitation were numerically smallerdue to the inclusion of the warmer months.
Steps 1 and 2 were also applied to TMAX and TMIN.These criteria ensure that the data analyzed here aresufficiently serially complete that seasonal averages ortotals, trends, and other long-term patterns in tempera-ture and snowfall can be reliably calculated withoutundue interference from sampling errors and seasonaleffects. This culling retained 261 stations with precipi-tation and snowfall, 634 stations that contained tem-perature, and 207 stations that contained temperature,precipitation, and snowfall. The analyses presentedhere used the largest appropriate dataset in each case(i.e., joint analysis of temperature and precipitationused 207 stations, while analysis of temperature aloneused all 634 stations).
To further ensure the robustness of the results, theremaining data were examined for trends in the numberof days with missing data, in the average date of themissing values each winter, and in the standard devia-tion of the dates of missing values each winter. Signifi-cant trends were found in the number of missing days atmany stations, and the analysis presented below wasrepeated with those stations excluded. The analysis wasalso repeated using more stringent criteria in steps 1and 2 above—thresholds of 3 days in step 1 and 25% instep 2. In both cases, the conclusions of this analysiswere unchanged, albeit with fewer data points. Finally,repeating the analysis without the Great Plains stations(described in section 3b) did not change the findings ofthis paper.
The depth of newly fallen snow (S) is recorded eachday by cooperative observers using a variety of meth-ods, including simple measuring sticks; snow boards,which are wiped clean after each measurement; and tallsnow stakes where large snow accumulations occur.Liquid (equivalent) precipitation depth (P) is typicallymeasured with precipitation gauges. The daily accumu-
lated precipitation is either melted and the liquid depthmeasured, or, in the case of recording gauges, the pre-cipitation is weighed (National Weather Service 1989).
A potential problem with the use of precipitationgauge measurements for comparing snowfall to totalprecipitation is that the catch efficiency is typicallylower for snow than for rain. The influence on the re-sults presented below of this phenomenon of under-catch was estimated by assuming all solid precipitationwas associated with a gauge efficiency of 50%, and allliquid precipitation with an efficiency of 90%, then re-peating the analyses of this study. This difference incatch efficiencies represents an upper extreme amongprevious studies’ findings for the gauge types and con-ditions found in the western United States (Yang et al.1998; Groisman and Legates 1994). The results suggestthat undercatch had relatively little effect on the trendsreported here, and, if anything, resulted in an underes-timation of trends in the SFE/P ratio and SFE. A morerigorous treatment of these effects was not possible dueto the paucity of catch efficiency data for the individualstations studied.
Although they have been selected to have recordedsnowfall (criterion 3 above), the SOD station subset isgenerally representative of lower and middle eleva-tions. For example, the median elevation from thesnow/precipitation SOD subset is 1380 m, while the me-dian elevation of snow pillows in the same region is2380 m. However, as will be brought out in the results,the elevational distribution of the SOD stations is wellsituated to record changes in precipitation form fromrelatively modest climate fluctuations or changes. Thisis because elevations below 2000 m are nearer to freez-ing and thus more sensitive to temperature changesthan are the higher, colder elevations that are generallycharacteristic of snow courses and snow pillows.
In a relatively small number of cases, P was not mea-sured directly, but was estimated on snowy days byapplying some fixed multiplier (corresponding to an as-sumed snow density) to the depth of snow (S), typically0.1 (e.g., U.S. Department of Agriculture Weather Bu-reau 1935). To test for this practice and to determinewhether such cases adversely affect the results pre-sented here, the precipitation and snowfall depth (S)data were examined for overabundances of integer val-ues of the ratio S/P. The most frequently reported in-teger ratio was 10, which was reported (within a round-off tolerance of 0.05) on an average of 0.4% of snowydays, followed by 20 on 0.1% of the snowy days. Thestation with the largest percentage of snowy days forwhich S/P � 10 was a site in Montana with 6%. Re-moving those stations (36 stations out of 261) whose
15 SEPTEMBER 2006 K N O W L E S E T A L . 4547
percentage of November–March snowy days with S/P� 10 was greater than 2% from the analysis resulted inno substantial changes to this paper’s conclusions.
In this study, the liquid water equivalent of newlyfallen snow on each day (SFE, not to be confused withSWE, a common acronym for the liquid equivalent ofthe season-to-date’s accumulated snowpack) is definedas equal to P on days when S � 0, and equal to zerowhen S � 0. While this definition can overstate theamount of precipitation as snowfall (since precipitationon some days is a mixture of snow and rain), it avoidsoverreliance on the reported snowfall amounts, whichare notoriously unreliable and observer dependent.Additionally, overestimation of the SFE/P ratio onmixed-form days will underestimate the contributionsof those days (or trends in the number of those days) totrends in seasonally totaled SFE/P, so that our choiceresults in, if anything, the underestimation of the mag-nitude of trends in snowfall (as a fraction of total pre-cipitation). Our definition also does not distinguish be-tween rainfall and snowfall that melts completely onthe same day it falls (before it can be measured).
The sums of SFE and P over all days with data ineach winter (after the culling process described above)form time series of winter and monthly totals of SFEand P, from which winter and monthly ratios SFE/P,the fraction of precipitation falling as snow, were cal-culated. A Kendall’s tau nonparametric trend analysis(Kendall 1938) was performed on each time series. Ad-ditionally, a least squares regression line was fitted toeach time series to estimate the magnitudes of changesover the 56-yr study period, and each trend was furtherquantified in terms of standard deviations of the de-trended yearly time series. In the rare cases when alinear fit produced (physically impossible) negative val-ues, only the positive segment of the fit was used todetermine the magnitudes of the SFE, P, or SFE/Pchanges. Similar procedures were applied to winter-averaged temperatures.
The analyses below were initially performed with adataset restricted to sites in the U.S. Historical Clima-tology Network daily collection (HCN/D; Easterling etal. 1999), as in Huntington et al. (2004). That datasetwas selected from among the SOD sites according tovarious quality assurance criteria, in order (where pos-sible) to minimize such data quality concerns as incon-sistencies of daily maximum and minimum temperaturemeasurement times instrument changes, and heat is-land effects. However, in order to achieve the desiredspatial coverage in the HCN/D dataset (compared tothe original HCN monthly dataset), these criteria werenot strictly applied, nor were any corrections for non-climatic effects applied as they were in the larger
monthly HCN dataset (Easterling et al. 1996). Whensteps 1–3 were applied to the HCN/D subset for thewestern United States, the number of stations that sur-vived was barely sufficient to discern spatial patterns inthe data. To include a fuller network of stations, thepresent analysis applied the completeness criteria, asdescribed above, to the full SOD dataset rather than tothe HCN/D subset. This strict culling of a larger initialdataset yielded enough stations to discern spatial pat-terns. Similar patterns were evident in trend analyses ofthe HCN/D dataset (not shown here), but with muchmore sparsely populated maps. This replication of re-sults when a higher quality but sparser dataset was ana-lyzed gives us confidence that the trends and patternsreported here are climatic in their origins, even thoughnonclimatic effects such as heat island bias (Karl et al.1988), measurement time changes, and instrumentationchanges have not been corrected for in the (more popu-lous) dataset used in this paper.
Most of the analyses presented are from the primaryprecipitation, snowfall depth, and temperature datasetstaken from 1949 to 2004. However, to obtain a betterunderstanding of the temporal variability of the snow-fall fraction and its linkage to temperature, some analy-ses in Section 3d use two smaller subsets of stationsbeginning in 1930 and 1920.
3. Results
a. Seasonal SFE/P trends
The fraction of winter precipitation falling on snowydays (SFE/P) trended toward smaller values during wa-ter years (WY) 1949–2004 at 192 (74%) of the 261 SODsites analyzed (Fig. 1a) and increased at the other 69sites. Many of these trends did not rise to the level ofstatistical significance (p � 0.05, under the standardStudent’s t test that applies to Kendall’s tau analyses);however, of the sites with trends that did rise to thislevel, the snowfall fraction decreased at 94 sites (87%)and increased at only 14. Trends toward decreasingsnowfall fractions were strongest (in terms of standarddeviations of the detrended yearly ratios) at the lower-elevation sites in the Sierra Nevada and the PacificNorthwest.
The 2004 and 1949 intercepts of linear fits to the timeseries of winter SFE/P values for each station wereplotted against each other (Fig. 1b) to show the mag-nitude of changes during the 56-yr study period. Astraight-line fit to all stations, in Fig. 1b, reveals thatstations across the full range of initial SFE/P valueshave experienced remarkably uniform (slope � 1) re-ductions in the fraction of precipitation falling as snow.The linear fit corresponds to an SFE/P decline of 9%
4548 J O U R N A L O F C L I M A T E VOLUME 19
during the study period. In this paper, most trends willbe discussed in terms of the difference of the linearlyfitted values at the end and beginning of the study period;where trend strength is the focus (as opposed to trendmagnitude), standard deviations are used (Figs. 1 and 3).
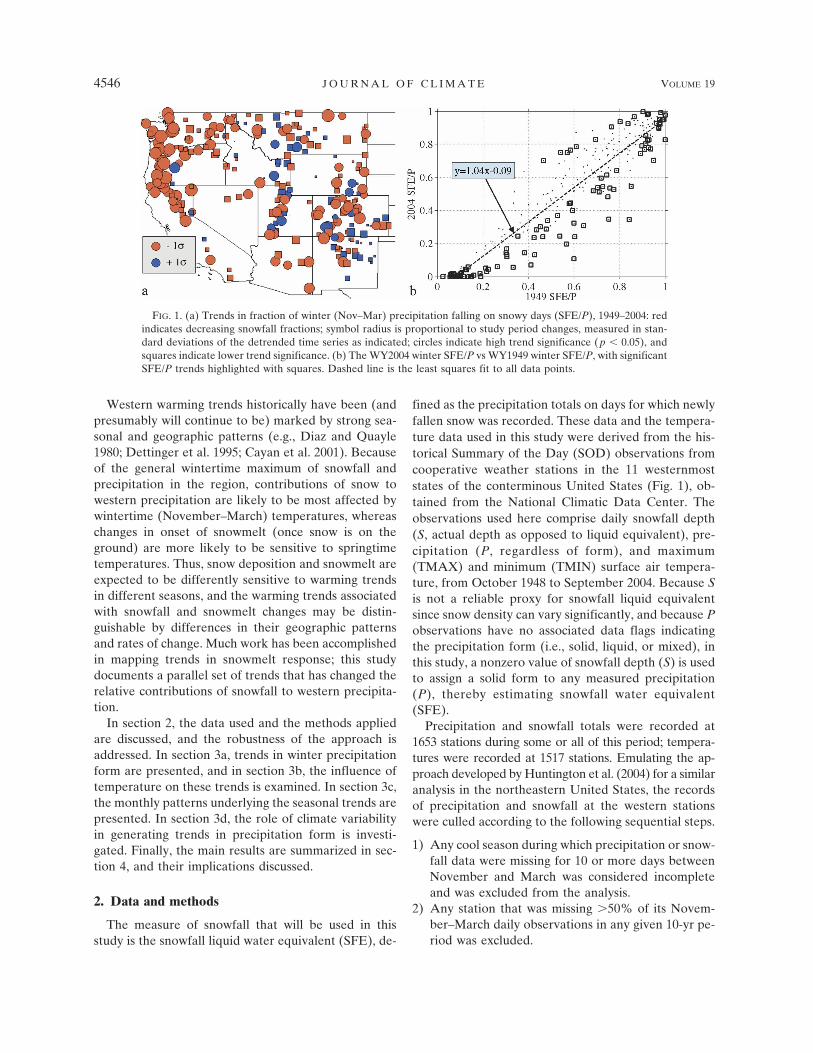
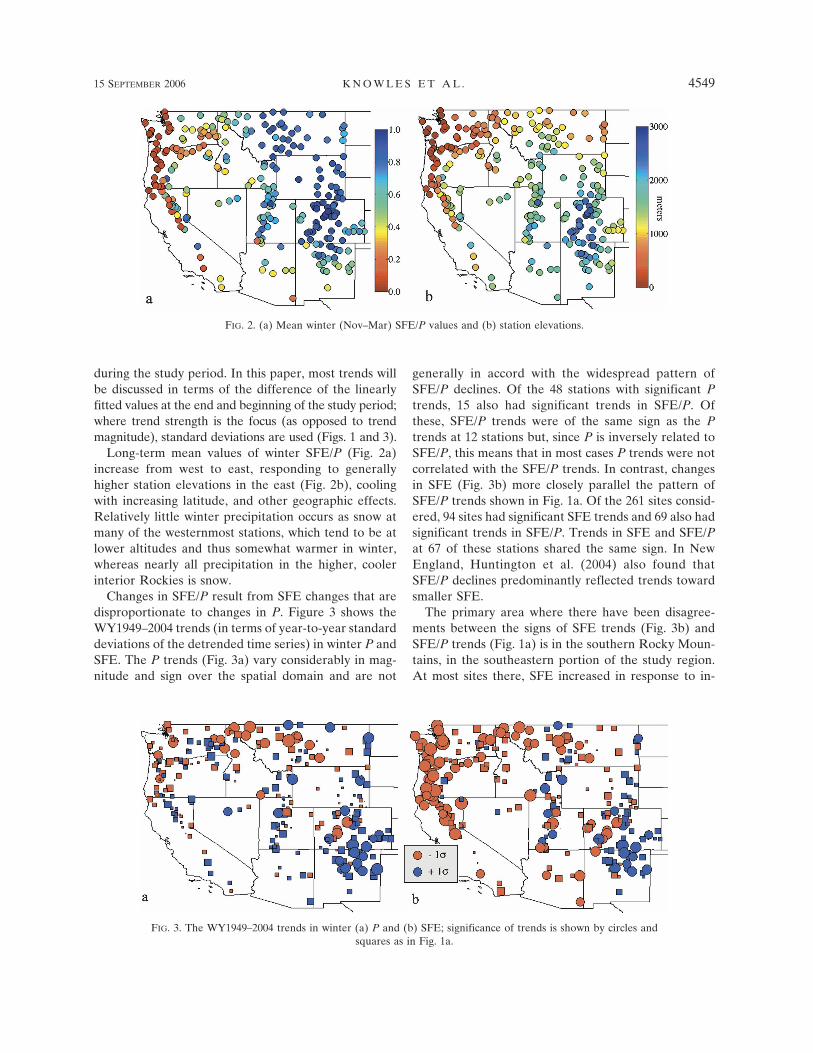
Long-term mean values of winter SFE/P (Fig. 2a)increase from west to east, responding to generallyhigher station elevations in the east (Fig. 2b), coolingwith increasing latitude, and other geographic effects.Relatively little winter precipitation occurs as snow atmany of the westernmost stations, which tend to be atlower altitudes and thus somewhat warmer in winter,whereas nearly all precipitation in the higher, coolerinterior Rockies is snow.
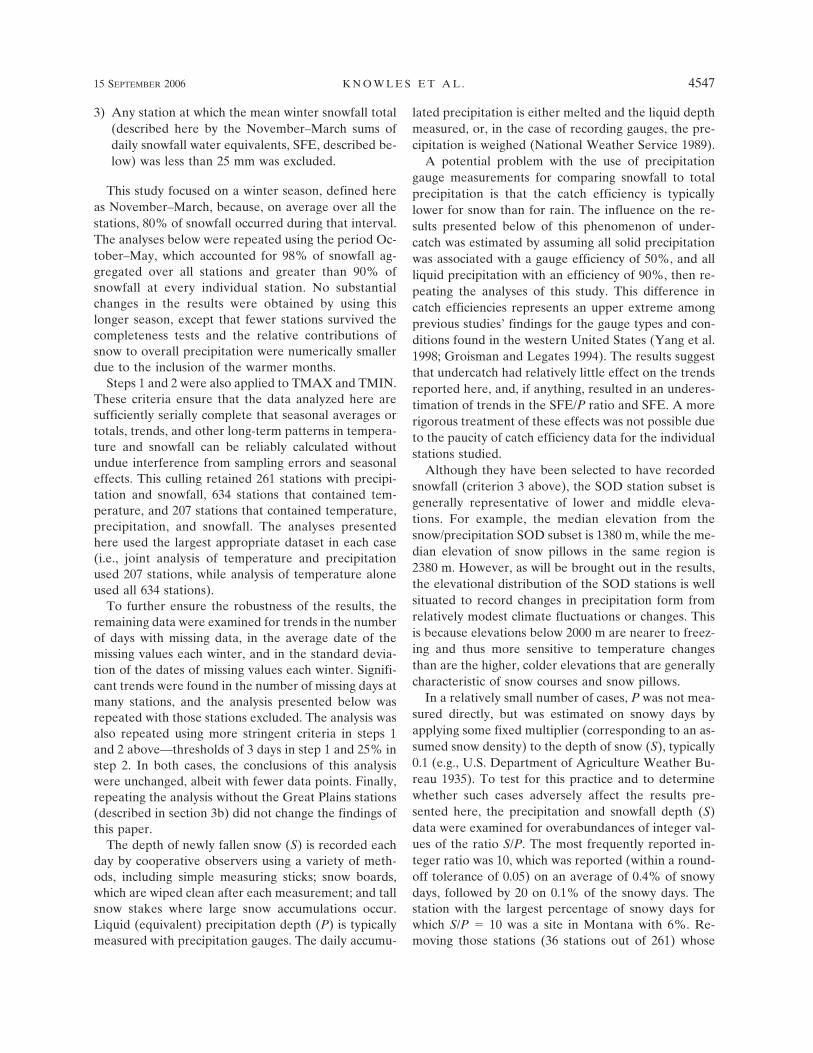
Changes in SFE/P result from SFE changes that aredisproportionate to changes in P. Figure 3 shows theWY1949–2004 trends (in terms of year-to-year standarddeviations of the detrended time series) in winter P andSFE. The P trends (Fig. 3a) vary considerably in mag-nitude and sign over the spatial domain and are not
generally in accord with the widespread pattern ofSFE/P declines. Of the 48 stations with significant Ptrends, 15 also had significant trends in SFE/P. Ofthese, SFE/P trends were of the same sign as the Ptrends at 12 stations but, since P is inversely related toSFE/P, this means that in most cases P trends were notcorrelated with the SFE/P trends. In contrast, changesin SFE (Fig. 3b) more closely parallel the pattern ofSFE/P trends shown in Fig. 1a. Of the 261 sites consid-ered, 94 sites had significant SFE trends and 69 also hadsignificant trends in SFE/P. Trends in SFE and SFE/Pat 67 of these stations shared the same sign. In NewEngland, Huntington et al. (2004) also found thatSFE/P declines predominantly reflected trends towardsmaller SFE.
The primary area where there have been disagree-ments between the signs of SFE trends (Fig. 3b) andSFE/P trends (Fig. 1a) is in the southern Rocky Moun-tains, in the southeastern portion of the study region.At most sites there, SFE increased in response to in-
FIG. 3. The WY1949–2004 trends in winter (a) P and (b) SFE; significance of trends is shown by circles andsquares as in Fig. 1a.
FIG. 2. (a) Mean winter (Nov–Mar) SFE/P values and (b) station elevations.
15 SEPTEMBER 2006 K N O W L E S E T A L . 4549
Fig 2 live 4/C Fig 3 live 4/C
creasing P. At many of these sites, increases in SFEhave not kept pace with P, and thus SFE/P ratios de-creased. Relative within-season differences in whenand how much precipitation and temperature changed(not shown) have played a secondary role in determin-ing the SFE/P trends in this region. Precipitation in thesouthern Rockies has shifted into colder months, coun-teracting the warming trends and contributing to themixed SFE/P trends there.
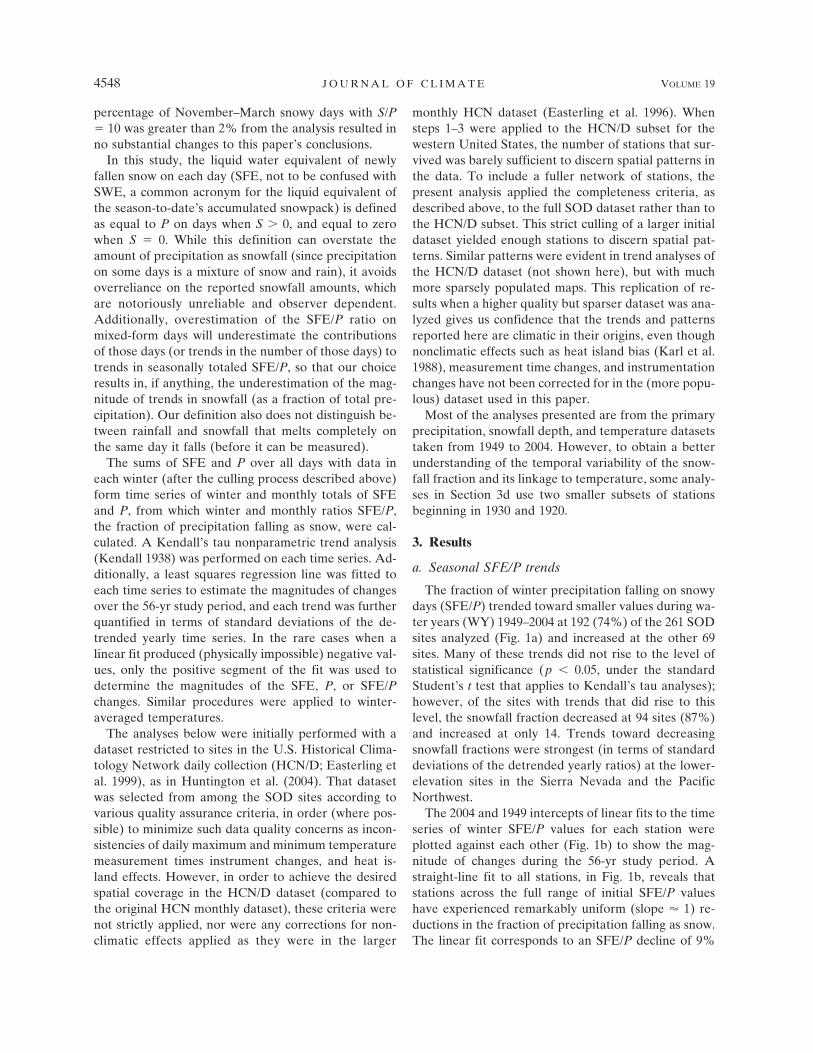
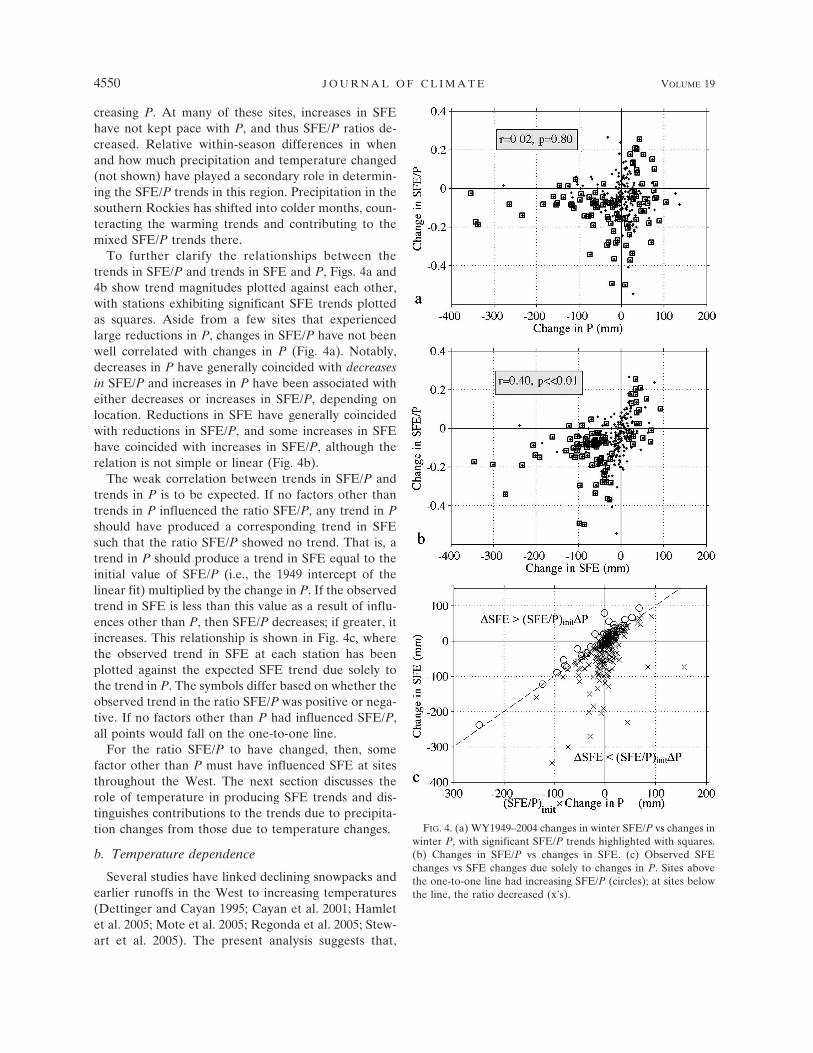
To further clarify the relationships between thetrends in SFE/P and trends in SFE and P, Figs. 4a and4b show trend magnitudes plotted against each other,with stations exhibiting significant SFE trends plottedas squares. Aside from a few sites that experiencedlarge reductions in P, changes in SFE/P have not beenwell correlated with changes in P (Fig. 4a). Notably,decreases in P have generally coincided with decreasesin SFE/P and increases in P have been associated witheither decreases or increases in SFE/P, depending onlocation. Reductions in SFE have generally coincidedwith reductions in SFE/P, and some increases in SFEhave coincided with increases in SFE/P, although therelation is not simple or linear (Fig. 4b).
The weak correlation between trends in SFE/P andtrends in P is to be expected. If no factors other thantrends in P influenced the ratio SFE/P, any trend in Pshould have produced a corresponding trend in SFEsuch that the ratio SFE/P showed no trend. That is, atrend in P should produce a trend in SFE equal to theinitial value of SFE/P (i.e., the 1949 intercept of thelinear fit) multiplied by the change in P. If the observedtrend in SFE is less than this value as a result of influ-ences other than P, then SFE/P decreases; if greater, itincreases. This relationship is shown in Fig. 4c, wherethe observed trend in SFE at each station has beenplotted against the expected SFE trend due solely tothe trend in P. The symbols differ based on whether theobserved trend in the ratio SFE/P was positive or nega-tive. If no factors other than P had influenced SFE/P,all points would fall on the one-to-one line.
For the ratio SFE/P to have changed, then, somefactor other than P must have influenced SFE at sitesthroughout the West. The next section discusses therole of temperature in producing SFE trends and dis-tinguishes contributions to the trends due to precipita-tion changes from those due to temperature changes.
b. Temperature dependence
Several studies have linked declining snowpacks andearlier runoffs in the West to increasing temperatures(Dettinger and Cayan 1995; Cayan et al. 2001; Hamletet al. 2005; Mote et al. 2005; Regonda et al. 2005; Stew-art et al. 2005). The present analysis suggests that,
FIG. 4. (a) WY1949–2004 changes in winter SFE/P vs changes inwinter P, with significant SFE/P trends highlighted with squares.(b) Changes in SFE/P vs changes in SFE. (c) Observed SFEchanges vs SFE changes due solely to changes in P. Sites abovethe one-to-one line had increasing SFE/P (circles); at sites belowthe line, the ratio decreased (x’s).
4550 J O U R N A L O F C L I M A T E VOLUME 19
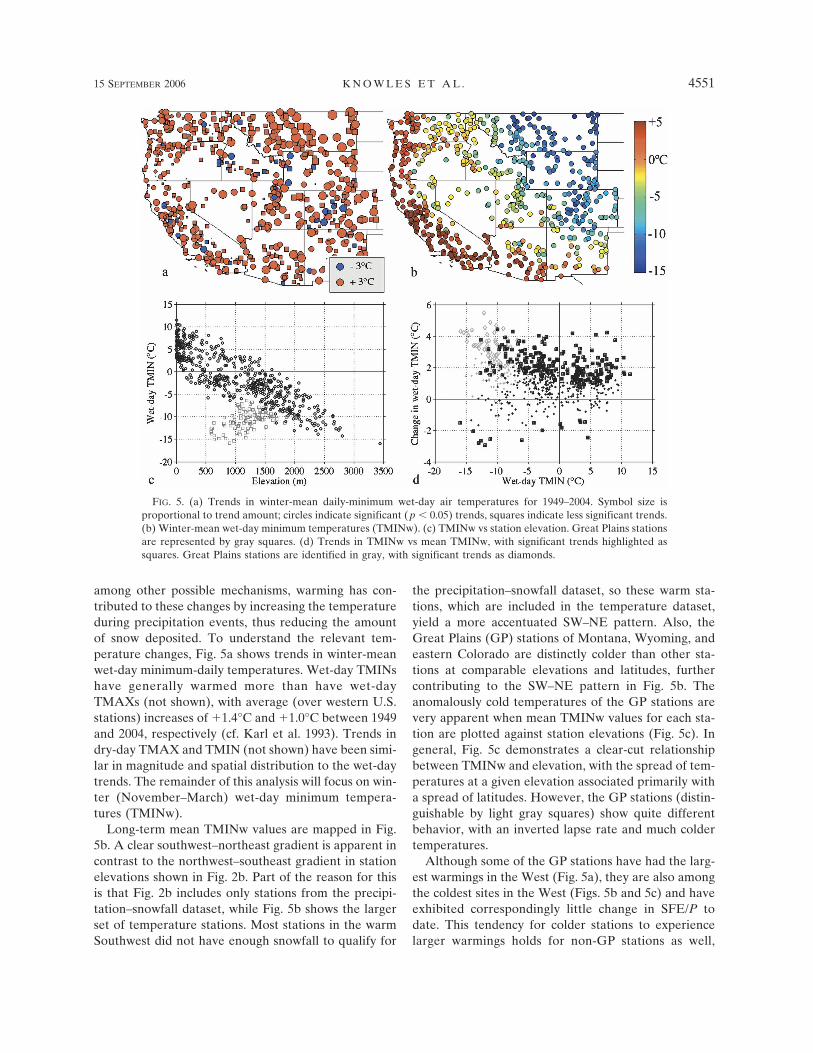
among other possible mechanisms, warming has con-tributed to these changes by increasing the temperatureduring precipitation events, thus reducing the amountof snow deposited. To understand the relevant tem-perature changes, Fig. 5a shows trends in winter-meanwet-day minimum-daily temperatures. Wet-day TMINshave generally warmed more than have wet-dayTMAXs (not shown), with average (over western U.S.stations) increases of �1.4°C and �1.0°C between 1949and 2004, respectively (cf. Karl et al. 1993). Trends indry-day TMAX and TMIN (not shown) have been simi-lar in magnitude and spatial distribution to the wet-daytrends. The remainder of this analysis will focus on win-ter (November–March) wet-day minimum tempera-tures (TMINw).
Long-term mean TMINw values are mapped in Fig.5b. A clear southwest–northeast gradient is apparent incontrast to the northwest–southeast gradient in stationelevations shown in Fig. 2b. Part of the reason for thisis that Fig. 2b includes only stations from the precipi-tation–snowfall dataset, while Fig. 5b shows the largerset of temperature stations. Most stations in the warmSouthwest did not have enough snowfall to qualify for
the precipitation–snowfall dataset, so these warm sta-tions, which are included in the temperature dataset,yield a more accentuated SW–NE pattern. Also, theGreat Plains (GP) stations of Montana, Wyoming, andeastern Colorado are distinctly colder than other sta-tions at comparable elevations and latitudes, furthercontributing to the SW–NE pattern in Fig. 5b. Theanomalously cold temperatures of the GP stations arevery apparent when mean TMINw values for each sta-tion are plotted against station elevations (Fig. 5c). Ingeneral, Fig. 5c demonstrates a clear-cut relationshipbetween TMINw and elevation, with the spread of tem-peratures at a given elevation associated primarily witha spread of latitudes. However, the GP stations (distin-guishable by light gray squares) show quite differentbehavior, with an inverted lapse rate and much coldertemperatures.
Although some of the GP stations have had the larg-est warmings in the West (Fig. 5a), they are also amongthe coldest sites in the West (Figs. 5b and 5c) and haveexhibited correspondingly little change in SFE/P todate. This tendency for colder stations to experiencelarger warmings holds for non-GP stations as well,
FIG. 5. (a) Trends in winter-mean daily-minimum wet-day air temperatures for 1949–2004. Symbol size isproportional to trend amount; circles indicate significant ( p � 0.05) trends, squares indicate less significant trends.(b) Winter-mean wet-day minimum temperatures (TMINw). (c) TMINw vs station elevation. Great Plains stationsare represented by gray squares. (d) Trends in TMINw vs mean TMINw, with significant trends highlighted assquares. Great Plains stations are identified in gray, with significant trends as diamonds.
15 SEPTEMBER 2006 K N O W L E S E T A L . 4551
Fig 5 live 4/C
though less dramatically. Figure 5d shows trends inTMINw plotted against mean TMINw, with significanttrends highlighted, and significant GP trends identifiedas gray diamonds. Though the GP stations stand out assome of the coldest and most warmed in the West,many of the coldest non-GP stations have also warmedmore than other, warmer non-GP sites. A total of 79%of the non-GP stations that had significant TMINwtrends and that warmed more than �3°C had meanTMINw values less than 0°C; 70% of these had meanTMINw less than �5°C. In comparison, for non-GPstations with significant TMINw trends that warmedless than �3°C, these values were 47% and 40%, re-spectively.
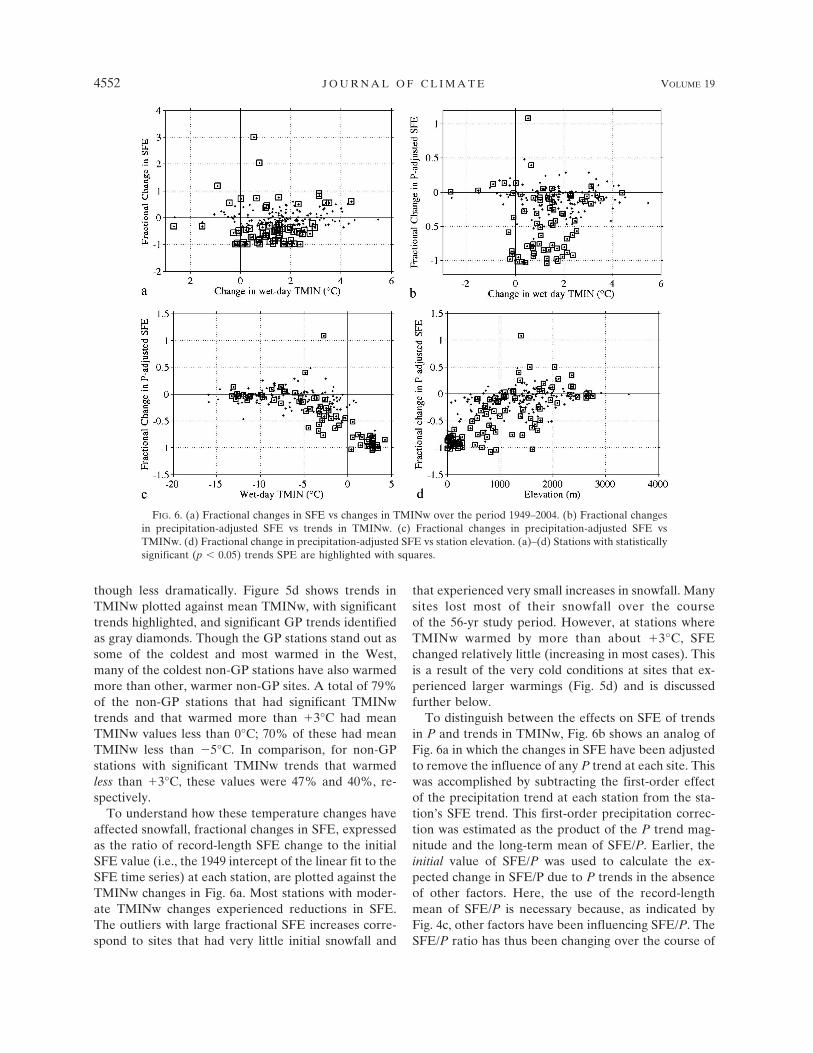
To understand how these temperature changes haveaffected snowfall, fractional changes in SFE, expressedas the ratio of record-length SFE change to the initialSFE value (i.e., the 1949 intercept of the linear fit to theSFE time series) at each station, are plotted against theTMINw changes in Fig. 6a. Most stations with moder-ate TMINw changes experienced reductions in SFE.The outliers with large fractional SFE increases corre-spond to sites that had very little initial snowfall and
that experienced very small increases in snowfall. Manysites lost most of their snowfall over the courseof the 56-yr study period. However, at stations whereTMINw warmed by more than about �3°C, SFEchanged relatively little (increasing in most cases). Thisis a result of the very cold conditions at sites that ex-perienced larger warmings (Fig. 5d) and is discussedfurther below.
To distinguish between the effects on SFE of trendsin P and trends in TMINw, Fig. 6b shows an analog ofFig. 6a in which the changes in SFE have been adjustedto remove the influence of any P trend at each site. Thiswas accomplished by subtracting the first-order effectof the precipitation trend at each station from the sta-tion’s SFE trend. This first-order precipitation correc-tion was estimated as the product of the P trend mag-nitude and the long-term mean of SFE/P. Earlier, theinitial value of SFE/P was used to calculate the ex-pected change in SFE/P due to P trends in the absenceof other factors. Here, the use of the record-lengthmean of SFE/P is necessary because, as indicated byFig. 4c, other factors have been influencing SFE/P. TheSFE/P ratio has thus been changing over the course of
FIG. 6. (a) Fractional changes in SFE vs changes in TMINw over the period 1949–2004. (b) Fractional changesin precipitation-adjusted SFE vs trends in TMINw. (c) Fractional changes in precipitation-adjusted SFE vsTMINw. (d) Fractional change in precipitation-adjusted SFE vs station elevation. (a)–(d) Stations with statisticallysignificant (p � 0.05) trends SPE are highlighted with squares.
4552 J O U R N A L O F C L I M A T E VOLUME 19
the record, and the record-length mean must be used tocalculate a first-order approximation to the changes inSFE/P due to P trends. The assumption that changes inSFE due to changes in P can be removed in this manneris a simplification, but as will be shown, a useful one.
Once adjusted for P trends, it is even clearer (than inFig. 6a) that the most significant reductions in SFE haveoccurred at sites that experienced moderate (�3°C)TMINw warming (Fig. 6b). The reason that smallertemperature changes resulted in the largest SFE de-clines is clear when viewed another way: Fig. 6c showsthe P-adjusted SFE changes plotted against long-termmean November–March TMINw values at each site.The largest SFE reductions occurred at the warmestlocations (TMINw � �5°C), where temperatures werecloser to freezing and warming by even a small amountwas enough to have a substantial impact. Because meanTMINw values are strongly related to elevation (Fig.5c), P-adjusted SFE trends (Fig. 6d) are as well. MostP-adjusted SFE reductions occurred at sites with eleva-tions below 2000 m, corresponding to the warmest tem-peratures in Fig. 6c. The few stations that exhibitedappreciable fractional increases were largely locatedabove about 1200 m and experienced relatively littlesnowfall; hence, small positive trends produced largefractional increases. At sites with significant winter SFEtrends, the average P-adjusted winter SFE reductionwas 51 mm over the 56-yr study period. Averaged overall sites, the reduction was 26 mm.
As noted above, the relationship between TMINwchanges and the long-term mean wet-day winter tem-peratures (Fig. 5d) explains another feature evident inFigs. 6a and 6b, the very small SFE changes at sites thathave warmed by more than �3°C. The stations thatwarmed this much tended to be among the coldest sta-tions, with long-term November–March mean TMINwvalues less than �5°C. In these cold settings, even thelargest warmings in the West—more than �4°C—wereapparently not sufficient to yield significant SFE reduc-tions.
Since mean TMINw and, to a lesser degree, trends inTMINw exhibit regional patterns, Figs. 6b and 6c alsowere plotted separately for individual regions, splittingthe study domain into east–west, north–south, andnorthwest–southeast halves to test for effects of conti-nentality, latitude, and elevation (Fig. 2a), respectively.In all three cases, the patterns corresponding to thehalves showed considerable overlap and the relation-ships were consistent with those in Figs. 6b and 6c,indicating that P-adjusted SFE trends were not aliasedartifacts of continentality, altitude, or elevation depen-dencies, but rather were driven by temperature trends.
The geographic pattern of P-adjusted SFE trends re-
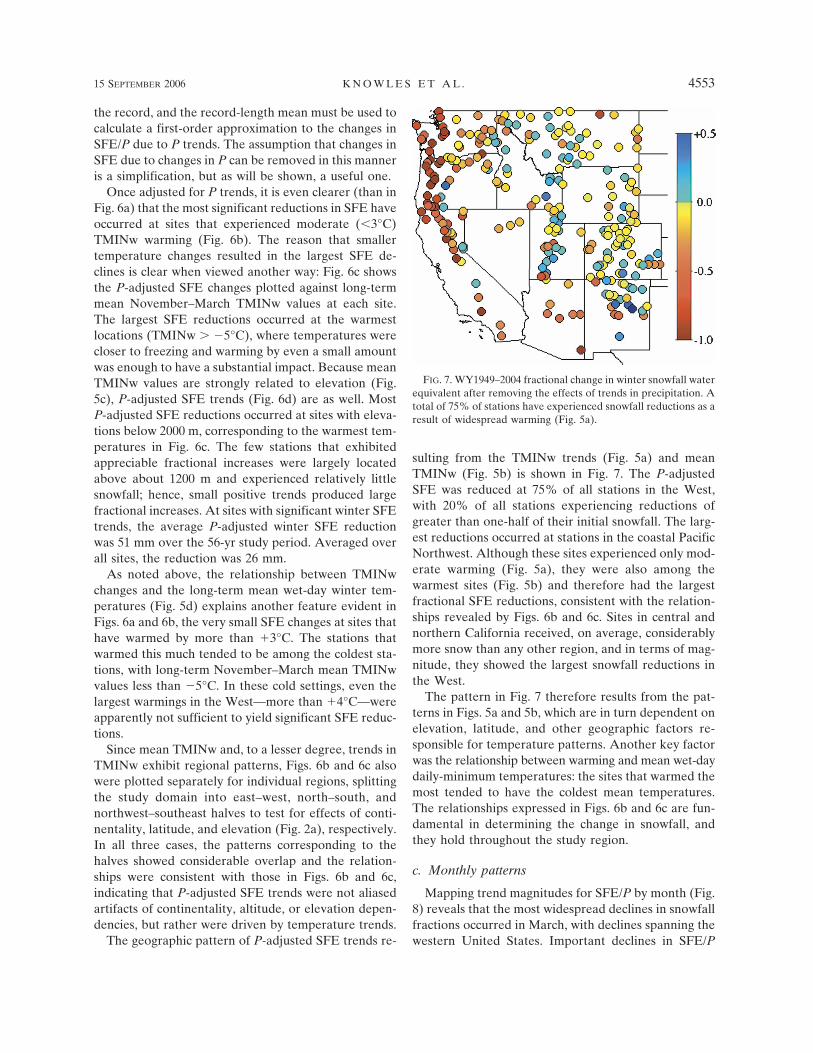
sulting from the TMINw trends (Fig. 5a) and meanTMINw (Fig. 5b) is shown in Fig. 7. The P-adjustedSFE was reduced at 75% of all stations in the West,with 20% of all stations experiencing reductions ofgreater than one-half of their initial snowfall. The larg-est reductions occurred at stations in the coastal PacificNorthwest. Although these sites experienced only mod-erate warming (Fig. 5a), they were also among thewarmest sites (Fig. 5b) and therefore had the largestfractional SFE reductions, consistent with the relation-ships revealed by Figs. 6b and 6c. Sites in central andnorthern California received, on average, considerablymore snow than any other region, and in terms of mag-nitude, they showed the largest snowfall reductions inthe West.
The pattern in Fig. 7 therefore results from the pat-terns in Figs. 5a and 5b, which are in turn dependent onelevation, latitude, and other geographic factors re-sponsible for temperature patterns. Another key factorwas the relationship between warming and mean wet-daydaily-minimum temperatures: the sites that warmed themost tended to have the coldest mean temperatures.The relationships expressed in Figs. 6b and 6c are fun-damental in determining the change in snowfall, andthey hold throughout the study region.
c. Monthly patterns
Mapping trend magnitudes for SFE/P by month (Fig.8) reveals that the most widespread declines in snowfallfractions occurred in March, with declines spanning thewestern United States. Important declines in SFE/P
FIG. 7. WY1949–2004 fractional change in winter snowfall waterequivalent after removing the effects of trends in precipitation. Atotal of 75% of stations have experienced snowfall reductions as aresult of widespread warming (Fig. 5a).
15 SEPTEMBER 2006 K N O W L E S E T A L . 4553
Fig 7 live 4/C
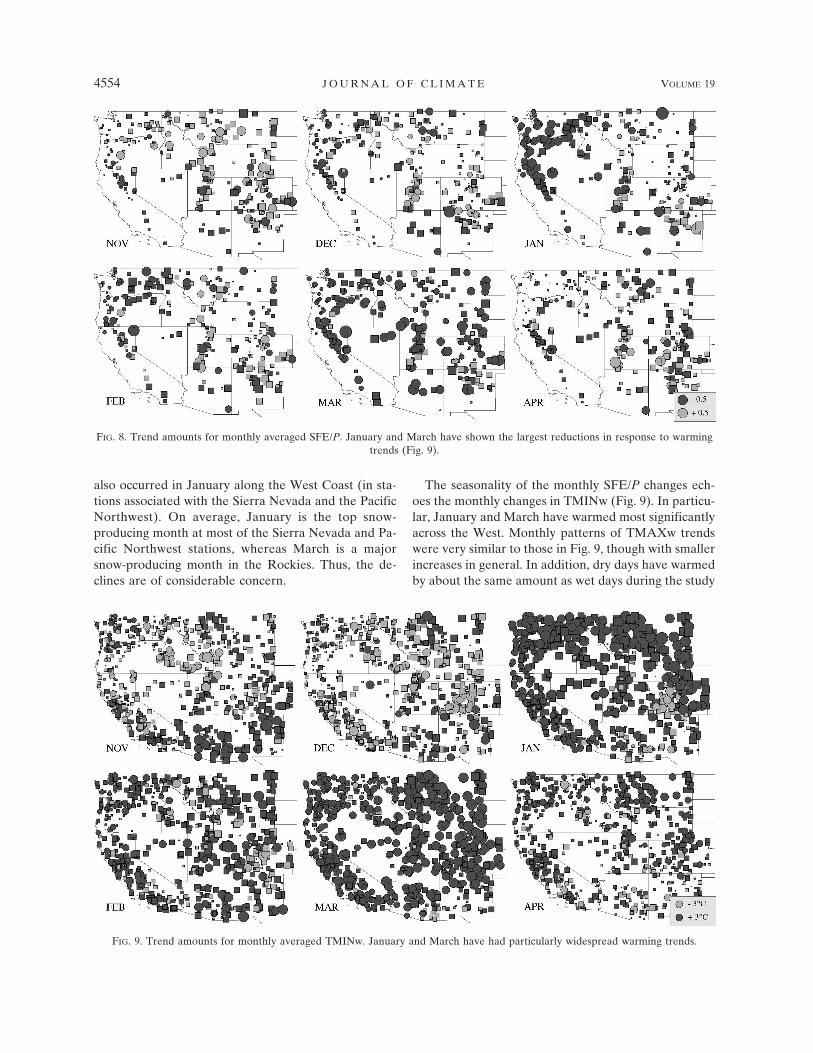
also occurred in January along the West Coast (in sta-tions associated with the Sierra Nevada and the PacificNorthwest). On average, January is the top snow-producing month at most of the Sierra Nevada and Pa-cific Northwest stations, whereas March is a majorsnow-producing month in the Rockies. Thus, the de-clines are of considerable concern.
The seasonality of the monthly SFE/P changes ech-oes the monthly changes in TMINw (Fig. 9). In particu-lar, January and March have warmed most significantlyacross the West. Monthly patterns of TMAXw trendswere very similar to those in Fig. 9, though with smallerincreases in general. In addition, dry days have warmedby about the same amount as wet days during the study
FIG. 9. Trend amounts for monthly averaged TMINw. January and March have had particularly widespread warming trends.
FIG. 8. Trend amounts for monthly averaged SFE/P. January and March have shown the largest reductions in response to warmingtrends (Fig. 9).
4554 J O U R N A L O F C L I M A T E VOLUME 19
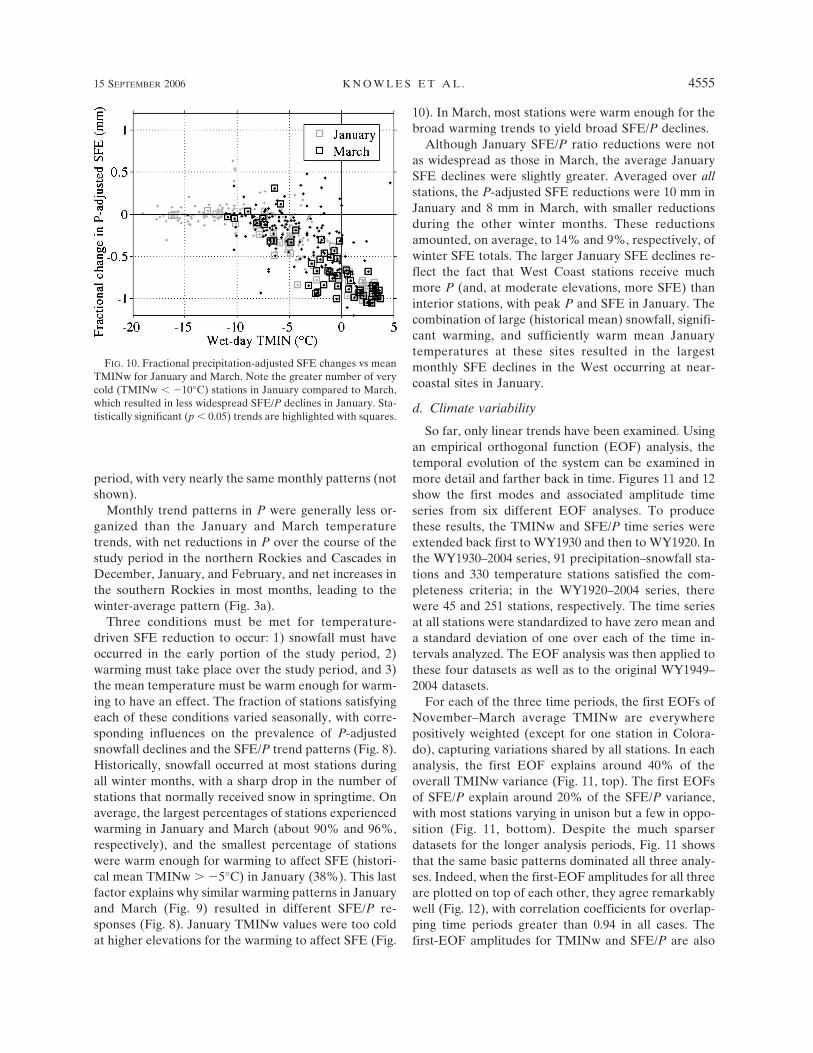
period, with very nearly the same monthly patterns (notshown).
Monthly trend patterns in P were generally less or-ganized than the January and March temperaturetrends, with net reductions in P over the course of thestudy period in the northern Rockies and Cascades inDecember, January, and February, and net increases inthe southern Rockies in most months, leading to thewinter-average pattern (Fig. 3a).
Three conditions must be met for temperature-driven SFE reduction to occur: 1) snowfall must haveoccurred in the early portion of the study period, 2)warming must take place over the study period, and 3)the mean temperature must be warm enough for warm-ing to have an effect. The fraction of stations satisfyingeach of these conditions varied seasonally, with corre-sponding influences on the prevalence of P-adjustedsnowfall declines and the SFE/P trend patterns (Fig. 8).Historically, snowfall occurred at most stations duringall winter months, with a sharp drop in the number ofstations that normally received snow in springtime. Onaverage, the largest percentages of stations experiencedwarming in January and March (about 90% and 96%,respectively), and the smallest percentage of stationswere warm enough for warming to affect SFE (histori-cal mean TMINw � �5°C) in January (38%). This lastfactor explains why similar warming patterns in Januaryand March (Fig. 9) resulted in different SFE/P re-sponses (Fig. 8). January TMINw values were too coldat higher elevations for the warming to affect SFE (Fig.
10). In March, most stations were warm enough for thebroad warming trends to yield broad SFE/P declines.
Although January SFE/P ratio reductions were notas widespread as those in March, the average JanuarySFE declines were slightly greater. Averaged over allstations, the P-adjusted SFE reductions were 10 mm inJanuary and 8 mm in March, with smaller reductionsduring the other winter months. These reductionsamounted, on average, to 14% and 9%, respectively, ofwinter SFE totals. The larger January SFE declines re-flect the fact that West Coast stations receive muchmore P (and, at moderate elevations, more SFE) thaninterior stations, with peak P and SFE in January. Thecombination of large (historical mean) snowfall, signifi-cant warming, and sufficiently warm mean Januarytemperatures at these sites resulted in the largestmonthly SFE declines in the West occurring at near-coastal sites in January.
d. Climate variability
So far, only linear trends have been examined. Usingan empirical orthogonal function (EOF) analysis, thetemporal evolution of the system can be examined inmore detail and farther back in time. Figures 11 and 12show the first modes and associated amplitude timeseries from six different EOF analyses. To producethese results, the TMINw and SFE/P time series wereextended back first to WY1930 and then to WY1920. Inthe WY1930–2004 series, 91 precipitation–snowfall sta-tions and 330 temperature stations satisfied the com-pleteness criteria; in the WY1920–2004 series, therewere 45 and 251 stations, respectively. The time seriesat all stations were standardized to have zero mean anda standard deviation of one over each of the time in-tervals analyzed. The EOF analysis was then applied tothese four datasets as well as to the original WY1949–2004 datasets.
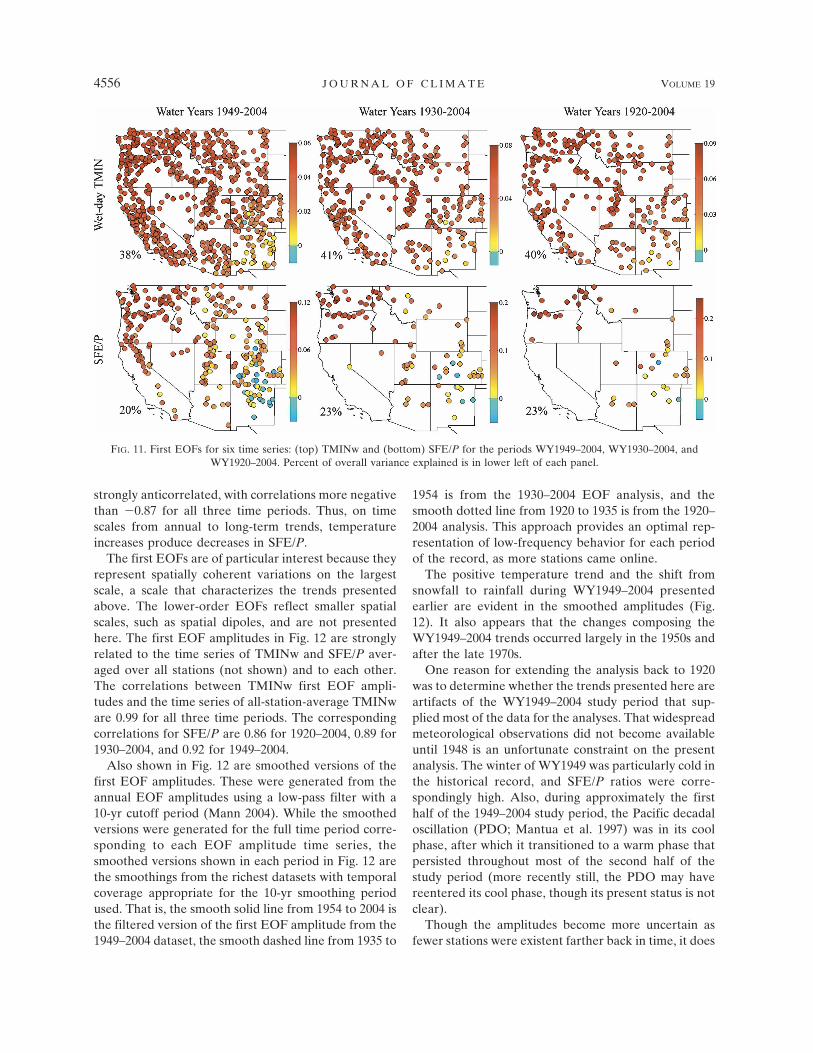
For each of the three time periods, the first EOFs ofNovember–March average TMINw are everywherepositively weighted (except for one station in Colora-do), capturing variations shared by all stations. In eachanalysis, the first EOF explains around 40% of theoverall TMINw variance (Fig. 11, top). The first EOFsof SFE/P explain around 20% of the SFE/P variance,with most stations varying in unison but a few in oppo-sition (Fig. 11, bottom). Despite the much sparserdatasets for the longer analysis periods, Fig. 11 showsthat the same basic patterns dominated all three analy-ses. Indeed, when the first-EOF amplitudes for all threeare plotted on top of each other, they agree remarkablywell (Fig. 12), with correlation coefficients for overlap-ping time periods greater than 0.94 in all cases. Thefirst-EOF amplitudes for TMINw and SFE/P are also
FIG. 10. Fractional precipitation-adjusted SFE changes vs meanTMINw for January and March. Note the greater number of verycold (TMINw � �10°C) stations in January compared to March,which resulted in less widespread SFE/P declines in January. Sta-tistically significant (p � 0.05) trends are highlighted with squares.
15 SEPTEMBER 2006 K N O W L E S E T A L . 4555
strongly anticorrelated, with correlations more negativethan �0.87 for all three time periods. Thus, on timescales from annual to long-term trends, temperatureincreases produce decreases in SFE/P.
The first EOFs are of particular interest because theyrepresent spatially coherent variations on the largestscale, a scale that characterizes the trends presentedabove. The lower-order EOFs reflect smaller spatialscales, such as spatial dipoles, and are not presentedhere. The first EOF amplitudes in Fig. 12 are stronglyrelated to the time series of TMINw and SFE/P aver-aged over all stations (not shown) and to each other.The correlations between TMINw first EOF ampli-tudes and the time series of all-station-average TMINware 0.99 for all three time periods. The correspondingcorrelations for SFE/P are 0.86 for 1920–2004, 0.89 for1930–2004, and 0.92 for 1949–2004.
Also shown in Fig. 12 are smoothed versions of thefirst EOF amplitudes. These were generated from theannual EOF amplitudes using a low-pass filter with a10-yr cutoff period (Mann 2004). While the smoothedversions were generated for the full time period corre-sponding to each EOF amplitude time series, thesmoothed versions shown in each period in Fig. 12 arethe smoothings from the richest datasets with temporalcoverage appropriate for the 10-yr smoothing periodused. That is, the smooth solid line from 1954 to 2004 isthe filtered version of the first EOF amplitude from the1949–2004 dataset, the smooth dashed line from 1935 to
1954 is from the 1930–2004 EOF analysis, and thesmooth dotted line from 1920 to 1935 is from the 1920–2004 analysis. This approach provides an optimal rep-resentation of low-frequency behavior for each periodof the record, as more stations came online.
The positive temperature trend and the shift fromsnowfall to rainfall during WY1949–2004 presentedearlier are evident in the smoothed amplitudes (Fig.12). It also appears that the changes composing theWY1949–2004 trends occurred largely in the 1950s andafter the late 1970s.
One reason for extending the analysis back to 1920was to determine whether the trends presented here areartifacts of the WY1949–2004 study period that sup-plied most of the data for the analyses. That widespreadmeteorological observations did not become availableuntil 1948 is an unfortunate constraint on the presentanalysis. The winter of WY1949 was particularly cold inthe historical record, and SFE/P ratios were corre-spondingly high. Also, during approximately the firsthalf of the 1949–2004 study period, the Pacific decadaloscillation (PDO; Mantua et al. 1997) was in its coolphase, after which it transitioned to a warm phase thatpersisted throughout most of the second half of thestudy period (more recently still, the PDO may havereentered its cool phase, though its present status is notclear).
Though the amplitudes become more uncertain asfewer stations were existent farther back in time, it does
FIG. 11. First EOFs for six time series: (top) TMINw and (bottom) SFE/P for the periods WY1949–2004, WY1930–2004, andWY1920–2004. Percent of overall variance explained is in lower left of each panel.
4556 J O U R N A L O F C L I M A T E VOLUME 19
Fig 11 live 4/C
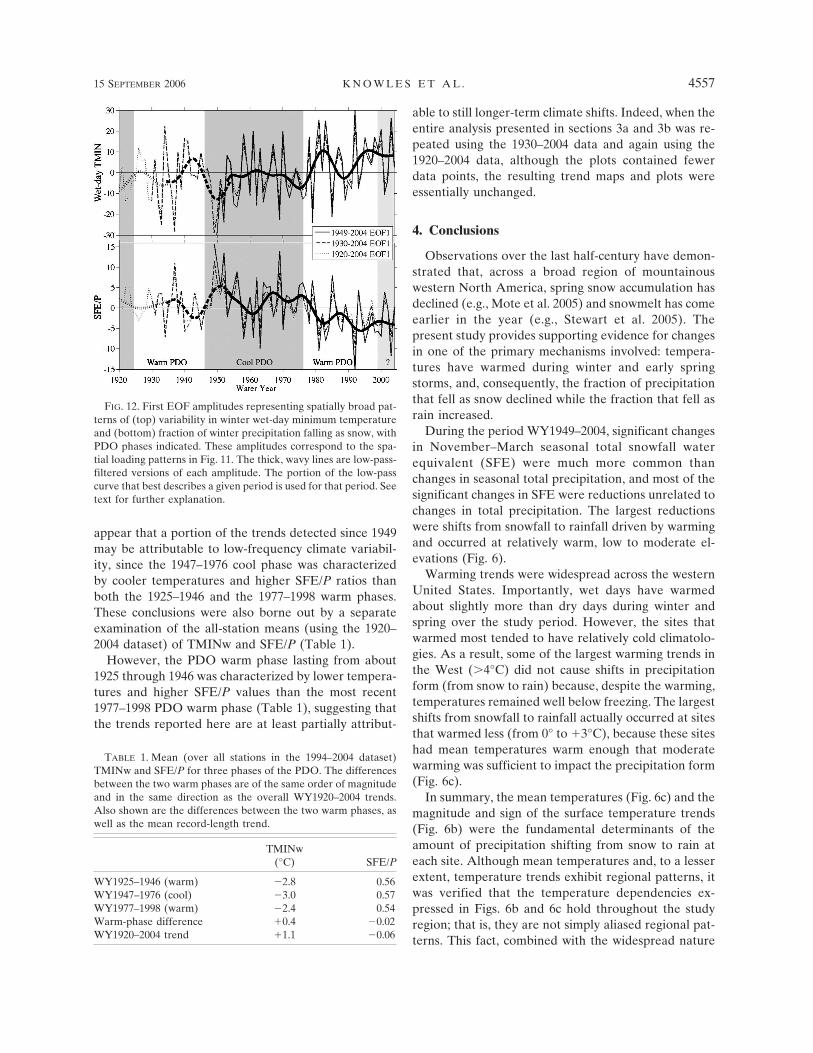
appear that a portion of the trends detected since 1949may be attributable to low-frequency climate variabil-ity, since the 1947–1976 cool phase was characterizedby cooler temperatures and higher SFE/P ratios thanboth the 1925–1946 and the 1977–1998 warm phases.These conclusions were also borne out by a separateexamination of the all-station means (using the 1920–2004 dataset) of TMINw and SFE/P (Table 1).
However, the PDO warm phase lasting from about1925 through 1946 was characterized by lower tempera-tures and higher SFE/P values than the most recent1977–1998 PDO warm phase (Table 1), suggesting thatthe trends reported here are at least partially attribut-
able to still longer-term climate shifts. Indeed, when theentire analysis presented in sections 3a and 3b was re-peated using the 1930–2004 data and again using the1920–2004 data, although the plots contained fewerdata points, the resulting trend maps and plots wereessentially unchanged.
4. Conclusions
Observations over the last half-century have demon-strated that, across a broad region of mountainouswestern North America, spring snow accumulation hasdeclined (e.g., Mote et al. 2005) and snowmelt has comeearlier in the year (e.g., Stewart et al. 2005). Thepresent study provides supporting evidence for changesin one of the primary mechanisms involved: tempera-tures have warmed during winter and early springstorms, and, consequently, the fraction of precipitationthat fell as snow declined while the fraction that fell asrain increased.
During the period WY1949–2004, significant changesin November–March seasonal total snowfall waterequivalent (SFE) were much more common thanchanges in seasonal total precipitation, and most of thesignificant changes in SFE were reductions unrelated tochanges in total precipitation. The largest reductionswere shifts from snowfall to rainfall driven by warmingand occurred at relatively warm, low to moderate el-evations (Fig. 6).
Warming trends were widespread across the westernUnited States. Importantly, wet days have warmedabout slightly more than dry days during winter andspring over the study period. However, the sites thatwarmed most tended to have relatively cold climatolo-gies. As a result, some of the largest warming trends inthe West (�4°C) did not cause shifts in precipitationform (from snow to rain) because, despite the warming,temperatures remained well below freezing. The largestshifts from snowfall to rainfall actually occurred at sitesthat warmed less (from 0° to �3°C), because these siteshad mean temperatures warm enough that moderatewarming was sufficient to impact the precipitation form(Fig. 6c).
In summary, the mean temperatures (Fig. 6c) and themagnitude and sign of the surface temperature trends(Fig. 6b) were the fundamental determinants of theamount of precipitation shifting from snow to rain ateach site. Although mean temperatures and, to a lesserextent, temperature trends exhibit regional patterns, itwas verified that the temperature dependencies ex-pressed in Figs. 6b and 6c hold throughout the studyregion; that is, they are not simply aliased regional pat-terns. This fact, combined with the widespread nature
FIG. 12. First EOF amplitudes representing spatially broad pat-terns of (top) variability in winter wet-day minimum temperatureand (bottom) fraction of winter precipitation falling as snow, withPDO phases indicated. These amplitudes correspond to the spa-tial loading patterns in Fig. 11. The thick, wavy lines are low-pass-filtered versions of each amplitude. The portion of the low-passcurve that best describes a given period is used for that period. Seetext for further explanation.
TABLE 1. Mean (over all stations in the 1994–2004 dataset)TMINw and SFE/P for three phases of the PDO. The differencesbetween the two warm phases are of the same order of magnitudeand in the same direction as the overall WY1920–2004 trends.Also shown are the differences between the two warm phases, aswell as the mean record-length trend.
TMINw(°C) SFE/P
WY1925–1946 (warm) �2.8 0.56WY1947–1976 (cool) �3.0 0.57WY1977–1998 (warm) �2.4 0.54Warm-phase difference �0.4 �0.02WY1920–2004 trend �1.1 �0.06
15 SEPTEMBER 2006 K N O W L E S E T A L . 4557
of the warming trends (Fig. 5a) and the strong eleva-tional dependence of mean temperatures (Fig. 5c), sug-gests that the east–west pattern of fractional precipita-tion-adjusted snowfall reduction of Fig. 7 is primarily areflection of station elevation (Fig. 2a) and is not in-dicative of some other regional control on snowfallreductions. Thus, the snowfall declines seen at the co-operative stations included in the present study areprobably also occurring at most other (as yet undocu-mented) sufficiently warm, low- to moderate-elevationsites in the West.
We found that while PDO fluctuations may have in-fluenced wet-day temperatures and snowfall fractionsat the interdecadal time scale, it also appears thatlonger-term changes have been occurring. This result isconsistent with recent findings of reduced spring snow-pack by Mote et al. (2005) and advanced snowmelt run-off by Stewart et al. (2004), who suggest that thesechanges can only be partially explained by fluctuationsin PDO, with another portion of the variability thatmay be a response to broader-scale anthropogenicwarming.
If warming trends across the western United Statescontinue, as projected in response to increasing green-house gas concentrations in the atmosphere (IPCC2001), the snowfall fraction of precipitation is likely tocontinue to decline. More warming may be expected toproduce rightward and downward drifts of the points inFig. 6c. When a station’s mean November–March wet-day minimum temperature rises above about �5°C inthat figure, the station’s snowfall amounts begin to re-spond to the warming trends that bring temperaturescloser to freezing, and continued warming shifts pre-cipitation from snow to rain. Figure 5d indicates thatthe coldest stations in Fig. 6c have been warming morequickly than the warmer stations. Month-by-monthtrend analyses showed that the effect of future warmingon snowfall amounts will depend critically on warmingin specific precipitation-rich months (e.g., January andMarch, to date), yielding the largest impacts when thegreatest warming coincides with the greatest (histori-cal) snowfall amounts and suitably warm mean tem-peratures. Warming during December–March wouldhave the largest impact on snow deposition, whilewarming in April through June will be more stronglyexpressed as accelerations of snowpack melting likethose projected by Stewart et al. (2004).
If warming continues and raises the mean winter wet-day minimum temperatures in more of the West aboveabout �5°C, snowfall declines (and rainfall increases),combined with earlier melting of the remaining accu-mulations of snowpack, will diminish the West’s naturalfreshwater storage capacity. The shift from snowfall to
rainfall also may be expected to increase risks of winterand spring flooding in many settings. The combinationof greater flood risk and reduced natural storage threat-ens to exacerbate the tension between flood controland storage priorities that many western reservoir man-agers face. Better understanding of how flood risks willchange, of the atmospheric conditions that control pre-cipitation form, and of possible trends in those condi-tions are needed to project and accommodate futurechanges in the West’s water supplies.
Acknowledgments. Thanks to Alexander Gershunovand Emelia Bainto for assistance in retrieving and pro-cessing SOD data, and to Kelly Redmond and KenKunkel for feedback and advice concerning COOP ob-servations. Support for NK came from the NationalResearch Council Research Associateship Program atthe USGS, the CALFED Ecosystem Restoration Pro-gram (project ERP-02-P38), and the California EnergyCommission’s Public Interest Energy Research Pro-gram (PIER) through the California Climate ChangeCenter (CCCC) at the Scripps Institution of Oceanog-raphy. Support for DRC was from the NOAA Office ofGlobal Programs through the California ApplicationsProgram, the Department of Energy, and the CECPIER CCCC. MDD’s support was from the USGS Hy-droclimatology Program and the CEC PIER CCCC.
REFERENCES
Cayan, D. R., S. A. Kammerdiener, M. D. Dettinger, J. M. Cap-rio, and D. H. Peterson, 2001: Changes in the onset of springin the western United States. Bull. Amer. Meteor. Soc., 82,399–415.
Dettinger, M. D., and D. R. Cayan, 1995: Large-scale atmosphericforcing of recent trends toward early snowmelt in California.J. Climate, 8, 606–623.
——, M. Ghil, and C. L. Keppenne, 1995: Interannual and inter-decadal variability of United States surface-air temperatures,1910–1987. Climatic Change, 31, 35–66.
——, D. R. Cayan, M. K. Meyer, and A. E. Jeton, 2004: Simulatedhydrologic responses to climate variations and change in theMerced, Carson, and American River basins, Sierra Nevada,California, 1900–2099. Climatic Change, 62, 283–317.
Diaz, H. F., and R. G. Quayle, 1980: The climate of the UnitedStates since 1895—Spatial and temporal changes. Mon. Wea.Rev., 108, 249–266.
Easterling, D. R., T. R. Karl, E. H. Mason, P. Y. Hughes, andD. P. Bowman, 1996: United States Historical ClimatologyNetwork (U.S. HCN) monthly temperature and precipitationdata. ORNL/CDIAC-87, NDP-019/R3, Carbon Dioxide In-formation Analysis Center, Oak Ridge National Laboratory,Oak Ridge, TN, 280 pp.
——, ——, J. H. Lawrimore, and S. A. Del Greco, 1999: UnitedStates Historical Climatology Network daily temperature,precipitation, and snow data for 1871–1997. ORNL/CDIAC-118, NDP-070, Carbon Dioxide Information Analysis Center,
4558 J O U R N A L O F C L I M A T E VOLUME 19

Oak Ridge National Laboratory, Oak Ridge, TN, 84 pp.[Available online at ftp://ftp.ncdc.noaa.gov/pub/data/ushcn/daily/README.txt.]
Gleick, P. H., 1987: The development and testing of a water bal-ance model for climate change impact assessment—Modelingthe Sacramento Basin. Water Resour. Res., 23, 1049–1061.
Groisman, P. Y., and D. R. Legates, 1994: The accuracy of UnitedStates precipitation data. Bull. Amer. Meteor. Soc., 75, 215–227.
Hamlet, A. F., P. W. Mote, M. P. Clark, and D. P. Lettenmaier,2005: Effects of temperature and precipitation variability onsnowpack trends in the western United States. J. Climate, 18,4545–4561.
Huntington, T. G., G. A. Hodgkins, B. D. Keim, and R. W. Dud-ley, 2004: Changes in the proportion of precipitation occur-ring as snow in New England (1949–2000). J. Climate, 17,2626–2636.
McCarthy, J. J., O. F. Canziani, N. A. Leary, D. J. Dokken, andK. S. White, Eds., 2001: Climate Change 2001: Impacts, Ad-aptation and Vulnerability. Cambridge University Press, 1000pp.
Karl, T. R., H. F. Diaz, and G. Kukla, 1988: Urbanization—Itsdetection and effect in the United States climate record. J.Climate, 1, 1099–1123.
——, and Coauthors, 1993: A new perspective on recent globalwarming: Assymetric trends of daily maximum and minimumtemperature. Bull. Amer. Meteor. Soc., 74, 1007–1023.
Kendall, M. G., 1938: A new measure of rank correlation. Bi-ometrika, 30, 81–93.
Knowles, N., and D. Cayan, 2004: Elevational dependence of pro-jected hydrologic changes in the San Francisco estuary andwatershed. Climatic Change, 62, 319–336.
Lettenmaier, D. P., and T. Y. Gan, 1990: Hydrologic sensitivitiesof the Sacramento–San Joaquin River Basin, California, toglobal warming. Water Resour. Res., 26, 69–86.
Mann, M. E., 2004: On smoothing potentially non-stationaryclimate time series. Geophys. Res. Lett., 31, L07214,doi:10.1029/2004GL019569.
Mantua, N. J., S. R. Hare, Y. Zhang, J. M. Wallace, and R. C.Francis, 1997: A Pacific interdecadal climate oscillation withimpacts on salmon production. Bull. Amer. Meteor. Soc., 78,1069–1079.
Mote, P. W., 2003: Trends in snow water equivalent in the PacificNorthwest and their climatic causes. Geophys. Res. Lett., 30,1601, doi:10.1029/2003GL017258.
——, A. F. Hamlet, M. P. Clark, and D. P. Lettenmaier, 2005:Declining mountain snowpack in western North America.Bull. Amer. Meteor. Soc., 86, 1–39.
National Weather Service, 1989: Cooperative Station Observa-tions. National Weather Service Observing Handbook, No. 2,Observing Systems Branch, Office of Systems Operations,94 pp. [Available online at http://weather.gov/om/coop/Publications/coophandbook2.pdf.]
Regonda, S., M. P. Clark, B. Rajagopalan, and J. Pitlick, 2005:Seasonal cycle shifts in hydroclimatology over the westernUnited States. J. Climate, 18, 372–384.
Roos, M., 1991: A trend of decreasing snowmelt runoff in north-ern California. Proc. 59th Western Snow Conf., Juneau, AK,29–36.
Stewart, I. T., D. R. Cayan, and M. D. Dettinger, 2004: Changes insnowmelt runoff timing in western North America under a‘business as usual’ climate change scenario. Climatic Change,62, 217–232.
——, ——, and ——, 2005: Changes toward earlier streamflowtiming across western North America. J. Climate, 18, 1136–1155.
U.S. Department of Agriculture Weather Bureau, 1935: Instruc-tions for cooperative observers. Circulars Band C, Instru-ment Division, eighth ed. W. B. 843, 33 pp.
Yang, D., B. E. Goodison, J. R. Metcalfe, V. S. Golubev, R. Bates,T. Pangburn, and C. L. Hanson, 1998: Accuracy of NWS 8”standard nonrecording precipitation gauge: Results and ap-plication of WMO intercomparison. J. Atmos. Oceanic Tech-nol., 15, 54–68.
15 SEPTEMBER 2006 K N O W L E S E T A L . 4559