trends of import penetration rate and the indiced of production and production capacity bu industry...
Post on 26-Jul-2015
263 views
TRANSCRIPT
5060708090
100110120130140150
2007 2008 2009 2010 2011 2012 2013
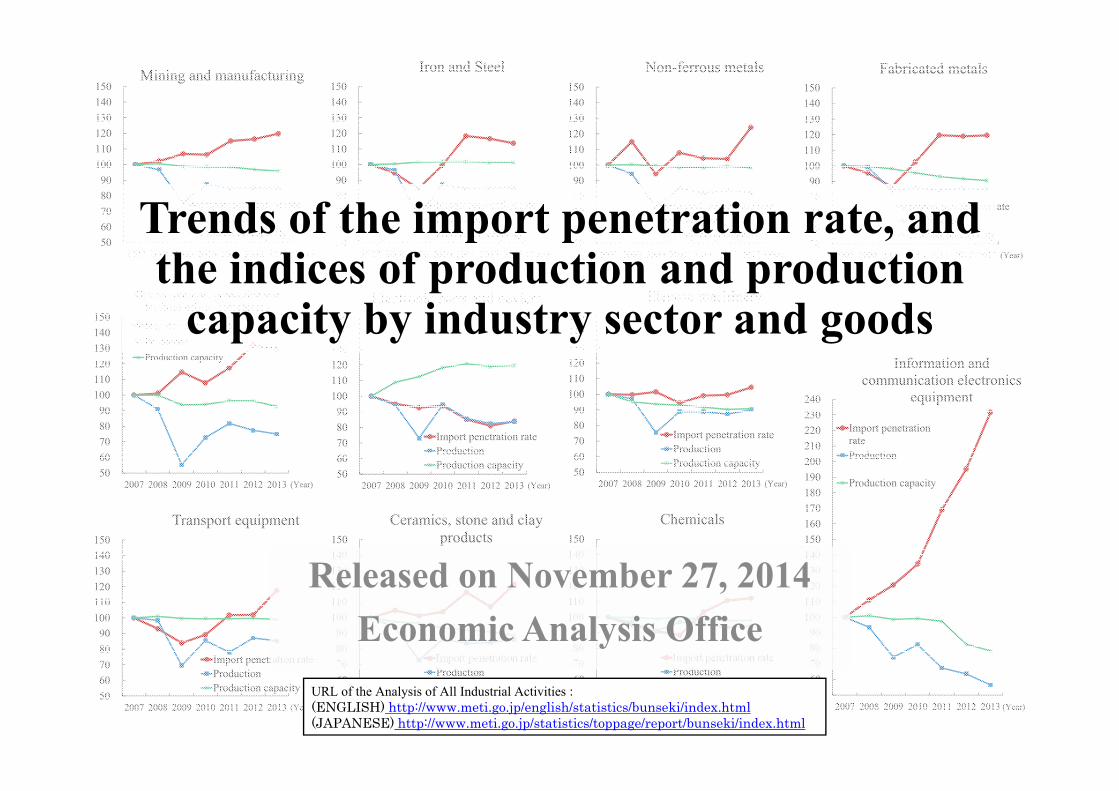
Mining and manufacturing
Import penetration rateProductionProduction capacity
(Year)5060708090
100110120130140150
2007 2008 2009 2010 2011 2012 2013
Iron and Steel
Import penetration rateProductionProduction capacity
(Year)5060708090
100110120130140150
2007 2008 2009 2010 2011 2012 2013
Non-ferrous metals
Import penetration rateProductionProduction capacity
(Year)5060708090
100110120130140150
2007 2008 2009 2010 2011 2012 2013
Fabricated metals
Import penetration rateProductionProduction capacity
(Year)
5060708090
100110120130140150
2007 2008 2009 2010 2011 2012 2013
General-purpose, production and business oriented machinery
Import penetration rateProductionProduction capacity
(Year)5060708090
100110120130140150
2007 2008 2009 2010 2011 2012 2013
Electronic parts and devices
Import penetration rateProductionProduction capacity
(Year)5060708090
100110120130140150
2007 2008 2009 2010 2011 2012 2013
Electric machinery
Import penetration rateProductionProduction capacity
(Year)
5060708090
100110120130140150160170180190200210220230240
2007 2008 2009 2010 2011 2012 2013
Information and communication electronics
equipment
Import penetrationrateProduction
Production capacity
(Year)5060708090
100110120130140150
2007 2008 2009 2010 2011 2012 2013
Transport equipment
Import penetration rateProductionProduction capacity
(Year)5060708090
100110120130140150
2007 2008 2009 2010 2011 2012 2013
Ceramics, stone and clay products
Import penetration rateProductionProduction capacity
(Year)5060708090
100110120130140150
2007 2008 2009 2010 2011 2012 2013
Chemicals
Import penetration rateProductionProduction capacity
(Year)
Trends of the import penetration rate, and the indices of production and production
capacity by industry sector and goods
Released on November 27, 2014Economic Analysis Office
URL of the Analysis of All Industrial Activities :(ENGLISH) http://www.meti.go.jp/english/statistics/bunseki/index.html(JAPANESE) http://www.meti.go.jp/statistics/toppage/report/bunseki/index.html

<Problem Awareness>
• Japan’s import penetration rate (the percentage of imports to the overall supply from mining and manufacturing, on a quantity base) is continuing an upward trend.
• Although the yen has substantially depreciated since 2012, there is no sign of turnover of the import penetration rate.
• Are these tendencies commonly observed in all industry sectors of manufacturing industry in Japan? Or do they differ depending on the industry sector or the type of goods?
1
* In this report, “the indices of industrial production” and “the indices of production capacity of manufacturing industry” are shortened to “production” and “production capacity” respectively.
<Analysis Contents>
• We will look at the trends of the import penetration rate from 2007, before the Lehman crisis, to 2013.
• We will check the trends of the import penetration rate, and the indices of production and production capacity, and sort them by industry sector and the type of goods.
• We will focus on the industry sectors which showed characteristic changes, and closely look at their trends.
2

Trends of the import penetration rate (1)• During 2007 to 2013, the import penetration rate shifted upward.• After 2011, imports have been increasing while domestic production and the overall supply
have been stagnating.
Changes in the Import Penetration Ratio, and Overall Supply, Domestic Production, and Imports
3
(Note) 1. Of the weighting of 10041.61 for the overall supply from mining and manufacturing, domestic production comprises 7938.44, and imports comprise 2103.17.
2. Import penetration rate = (Import index × Import weight) / (Overall supply index × Overall supply weight) × 1003. The 2007 figures are the estimated values.
Source: Created based on “METI: Indices of Industrial Domestic Shipments and Imports”.
19
20
21
22
23
24
2007 2008 2009 2010 2011 2012 2013
Import Penetration Rate
(%)
(Year)
80
85
90
95
100
105
110
115
120
2007 2008 2009 2010 2011 2012 2013
Overall supplyDomestic productionImports
(2010 = 100)
(Year)
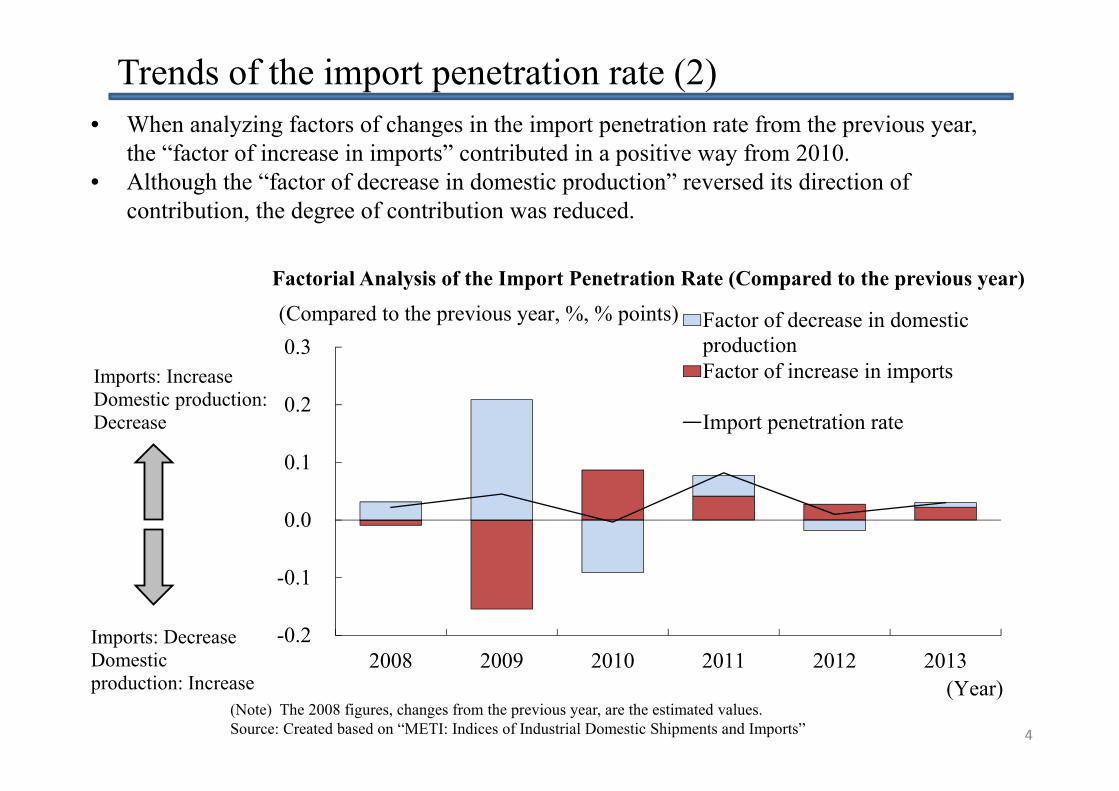
Trends of the import penetration rate (2)• When analyzing factors of changes in the import penetration rate from the previous year,
the “factor of increase in imports” contributed in a positive way from 2010.• Although the “factor of decrease in domestic production” reversed its direction of
contribution, the degree of contribution was reduced.
Factorial Analysis of the Import Penetration Rate (Compared to the previous year)
4(Note) The 2008 figures, changes from the previous year, are the estimated values.Source: Created based on “METI: Indices of Industrial Domestic Shipments and Imports”
2008 2009 2010 2011 2012 2013-0.2
-0.1
0.0
0.1
0.2
0.3Factor of decrease in domesticproductionFactor of increase in imports
Import penetration rate
(Compared to the previous year, %, % points)
(Year)
Imports: IncreaseDomestic production: Decrease
Imports: DecreaseDomesticproduction: Increase
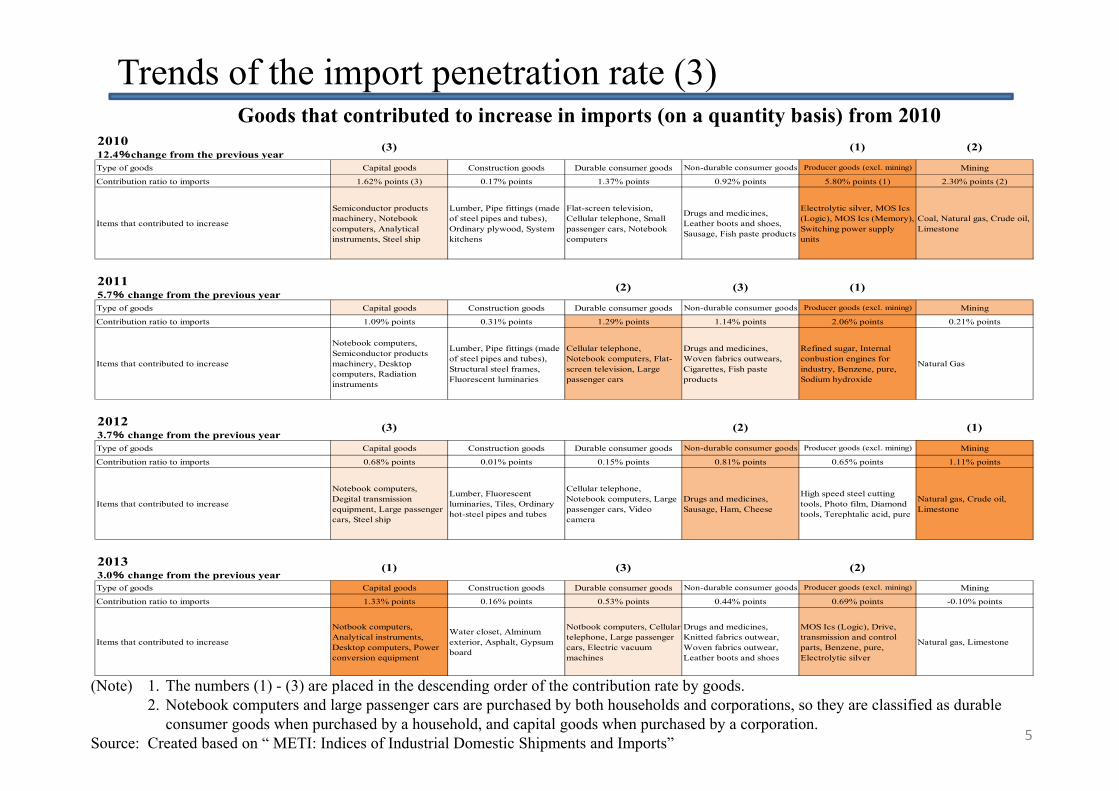
Trends of the import penetration rate (3)Goods that contributed to increase in imports (on a quantity basis) from 2010
5
(Note) 1. The numbers (1) - (3) are placed in the descending order of the contribution rate by goods.2. Notebook computers and large passenger cars are purchased by both households and corporations, so they are classified as durable
consumer goods when purchased by a household, and capital goods when purchased by a corporation.Source: Created based on “ METI: Indices of Industrial Domestic Shipments and Imports”
201012.4%change from the previous year
(3) (1) (2)
Type of goods Capital goods Construction goods Durable consumer goods Non-durable consumer goods Producer goods (excl. mining) Mining
Contribution ratio to imports 1.62% points (3) 0.17% points 1.37% points 0.92% points 5.80% points (1) 2.30% points (2)
Items that contributed to increase
Semiconductor productsmachinery, Notebookcomputers, Analyticalinstruments, Steel ship
Lumber, Pipe fittings (madeof steel pipes and tubes),Ordinary plywood, Systemkitchens
Flat-screen television,Cellular telephone, Smallpassenger cars, Notebookcomputers
Drugs and medicines,Leather boots and shoes,Sausage, Fish paste products
Electrolytic silver, MOS Ics(Logic), MOS Ics (Memory),Switching power supplyunits
Coal, Natural gas, Crude oil,Limestone
20115.7% change from the previous year
(2) (3) (1)
Type of goods Capital goods Construction goods Durable consumer goods Non-durable consumer goods Producer goods (excl. mining) Mining
Contribution ratio to imports 1.09% points 0.31% points 1.29% points 1.14% points 2.06% points 0.21% points
Items that contributed to increase
Notebook computers,Semiconductor productsmachinery, Desktopcomputers, Radiationinstruments
Lumber, Pipe fittings (madeof steel pipes and tubes),Structural steel frames,Fluorescent luminaries
Cellular telephone,Notebook computers, Flat-screen television, Largepassenger cars
Drugs and medicines,Woven fabrics outwears,Cigarettes, Fish pasteproducts
Refined sugar, Internalconbustion engines forindustry, Benzene, pure,Sodium hydroxide
Natural Gas
20123.7% change from the previous year
(3) (2) (1)
Type of goods Capital goods Construction goods Durable consumer goods Non-durable consumer goods Producer goods (excl. mining) Mining
Contribution ratio to imports 0.68% points 0.01% points 0.15% points 0.81% points 0.65% points 1.11% points
Items that contributed to increase
Notebook computers,Degital transmissionequipment, Large passengercars, Steel ship
Lumber, Fluorescentluminaries, Tiles, Ordinaryhot-steel pipes and tubes
Cellular telephone,Notebook computers, Largepassenger cars, Videocamera
Drugs and medicines,Sausage, Ham, Cheese
High speed steel cuttingtools, Photo film, Diamondtools, Terephtalic acid, pure
Natural gas, Crude oil,Limestone
20133.0% change from the previous year
(1) (3) (2)
Type of goods Capital goods Construction goods Durable consumer goods Non-durable consumer goods Producer goods (excl. mining) Mining
Contribution ratio to imports 1.33% points 0.16% points 0.53% points 0.44% points 0.69% points -0.10% points
Items that contributed to increase
Notbook computers,Analytical instruments,Desktop computers, Powerconversion equipment
Water closet, Alminumexterior, Asphalt, Gypsumboard
Notbook computers, Cellulartelephone, Large passengercars, Electric vacuummachines
Drugs and medicines,Knitted fabrics outwear,Woven fabrics outwear,Leather boots and shoes
MOS Ics (Logic), Drive,transmission and controlparts, Benzene, pure,Electrolytic silver
Natural gas, Limestone

Trends of the import penetration rate by industry sector and goods (1)• During 2007 to 2013, the import penetration rate for many industry sectors and goods increased.• The increased width of Information and communication electronics equipment industry was great,
recording 48.7% in 2013, which was close to the level of Textiles industry.• The level of the import penetration rate varies significantly depending on industry sector and the type of
goods.
(Note) 1. The lists are arranged in descending order of the import penetration rate in 2013.2. Gradation color shows the degree of the import penetration rate for each industry sector and goods, from the highest to the lowest.3. The 2007 figures are the estimated values.
Source: Created based on “METI: Indices of Industrial Domestic Shipments and Imports” 6
Changes in the Import Penetration Rate by Industry Sector and Goods (%)Industry 2007 2008 2009 2010 2011 2012 2013Textiles 46.6 48.4 52.1 51.1 53.2 53.5 54.4 High
Information and communication electronics equipment 21.1 23.4 25.4 28.3 35.6 41.1 48.7Non-ferrous metals 29.2 33.6 27.6 31.5 30.5 30.4 36.3
Mining and manufacturing (overall) 19.7 20.1 21.0 20.9 22.7 22.9 23.6Chemicals 19.3 18.4 17.6 17.1 19.9 21.3 21.6
Electronic parts and devices 23.8 22.6 22.0 22.3 20.2 19.3 20.0Electrical machinery 16.9 16.8 17.1 15.9 16.7 16.8 17.6
Petroleum and coal products 14.4 14.3 13.7 14.5 16.6 17.2 16.8General-purpose, production and business oriented machinery 11.5 11.6 13.2 12.4 13.5 15.2 14.9Ceramics, stone and clay products 8.5 8.9 8.6 8.8 9.8 9.0 10.3
Fabricated metals 7.5 7.2 6.5 7.7 9.0 8.9 9.0Pulp, paper and paper products 6.1 6.1 7.4 7.4 8.4 8.6 8.0
Plastic products 5.3 5.4 6.0 6.6 7.4 7.3 7.5Iron and Steel 5.5 5.2 4.6 5.4 6.5 6.4 6.2
Transport equipment 5.1 4.7 4.2 4.5 5.1 5.2 5.9 Low
(%)Goods 2007 2008 2009 2010 2011 2012 2013
Producer goods 26.7 27.6 28.2 27.4 29.0 29.2 29.5 HighNon-durable consumer goods 20.8 20.3 20.6 21.6 23.3 24.1 24.7
Industrial production (overall) 19.7 20.1 21.0 20.9 22.7 22.9 23.6Durable consumer goods 9.3 9.2 11.4 11.5 14.9 14.4 15.7
Capital goods 10.2 10.1 11.1 11.4 12.5 13.1 15.1Construction goods 8.0 7.7 7.5 8.3 9.5 9.3 9.5 Low

Trends of the import penetration rate by industry sector and goods (2)
Changes in the Import Penetration Rate by Industry Sector
7
(Note) The 2007 figures are the estimated values.Source: Created based on “METI: Indices of Industrial Domestic Shipments and Imports”
0
10
20
30
40
50
60
2007 2008 2009 2010 2011 2012 2013
Textiles
Information and communicationelectronics equipmentNon-ferrous metals
Mining and manufacturing (overall)
Chemicals
Electronic parts and devices
Electrical machinery
Petroleum and coal products
General-purpose, production andbusiness oriented machineryCeramics, stone and clay products
Fabricated metals
Pulp, paper and paper products
Plastic products
Iron and steel
Transport equipment
(%)
(Year)

Trends of the import penetration rate by industry sector and goods (3)
• When comparing two points of time, 2007 with 2013, the largest increase in the import penetration rate was observed in Information and communication electronics equipment industry in the category of industry sector and Durable consumer goods in the category of goods.
• Electronic parts and devices industry alone experienced a decrease in the import penetration rate.
(Note) 1. The lists are arranged in descending order of difference in points.2. The 2007 figures are the estimated values.
Source: Created based on “METI: Indices of Industrial Domestic Shipments and Imports”
Variation Width of the Import Penetration Rate in 2007 → 2013 (% points)
8
Industry2007→2013(Difference in points)
Goods2007→2013(Difference in points)
Information and communication electronics equipment 27.6 Durable consumer goods 6.4Texitles 7.8 Capital goods 4.9Non-ferrous metals 7.1 Industrial production (overall) 3.9Mining and manufacturing (overall) 3.9 Non-durable consumer goods 3.9General-purpose and business oriented machinery 3.4 Producer goods 2.8Petroleum and coal products 2.4 Construction goods 1.5Chemicals 2.3Plastic products 2.2Pulp, paper and paper products 1.9Ceramics, stone and clay products 1.8Fabricated metals 1.5Transport equipment 0.8Electrical machinery 0.7Iron and steel 0.7Electronic parts and devices -3.8

Trends of production by industry sector and goods (1)• When looking at the trends of production by industry sector and goods based on 2007 = 100, many
industry sectors and types of goods including Mining and manufacturing (overall) experienced a significant decrease in 2009 after the Lehman crisis, and turned positive in 2010, while production has been stagnated since 2011.
(Note) 1. The lists are arranged in descending order of the indices of production in 2013.2. Gradation color shows the degree of production of each industry sector and goods, from the highest to the lowest.3. The figures of general-purpose, production and business oriented machinery industry in 2007 is the estimated values.
Source: Created based on “METI: Indices of Industrial Production”
Changes in Production by Industry Sector and Goods
9
(2007=100)Industry 2007 2008 2009 2010 2011 2012 2013
Chemicals 100.0 96.8 91.2 96.9 95.5 93.4 94.4 HighElectrical machinery 100.0 97.1 75.4 88.9 88.8 87.3 90.0
Petroleum and coal products 100.0 98.1 92.4 92.7 87.5 87.2 87.9Pulp, paper and paper products 100.0 98.8 86.3 90.1 88.1 86.7 87.7
Plastic products 100.0 96.3 81.3 89.1 86.6 87.6 87.5Ceramics, stone and clay products 100.0 93.7 72.9 86.4 83.6 84.1 86.2
Transport equipment 100.0 98.5 69.5 85.5 78.0 87.1 85.4Iron and steel 100.0 96.5 66.8 87.0 84.7 84.9 85.2
Fabricated metals 100.0 99.3 84.4 85.9 84.5 85.7 85.0Mining and manufacturing (overall) 100.0 96.6 75.5 87.3 84.8 85.3 84.6
Electronic parts and devices 100.0 94.3 73.1 94.5 85.7 82.4 83.6Non-ferrous metals 100.0 94.4 73.3 85.3 82.0 83.8 82.2
General-purpose, production and business oriented machinery 100.0 91.0 55.3 72.7 81.8 77.4 75.0Textiles 100.0 90.5 71.0 75.6 77.8 75.9 74.4
Information and communication electronics equipment 100.0 93.6 74.3 82.4 67.4 63.6 56.5 Low
(2007=100)Goods 2007 2008 2009 2010 2011 2012 2013
Non-durable consumer goods 100.0 101.1 99.7 100.3 99.2 99.9 99.5 HighProducer goods 100.0 95.9 74.8 89.5 85.6 85.9 86.0
Construction goods 100.0 96.3 82.9 81.4 81.1 83.1 85.0Industrial production (overall) 100.0 96.6 75.5 87.3 84.8 85.3 84.6
Capital goods 100.0 93.4 62.8 76.3 80.3 78.5 76.7Durable consumer goods 100.0 96.8 70.3 83.8 74.0 78.4 74.9 Low

Trends of production by industry sector and goods (2)• When comparing two points of time, 2007 with 2013, production of all industry sectors and types of
goods decreased. Especially the largest decrease was observed in Information and communication electronics equipment industry in the category of industry sector, and Durable consumer goods and capital goods in the category of goods.
(Note) 1. The lists are arranged in descending order of difference in points.2. The figure of general-purpose, production and business oriented machinery industry in 2007 is the estimated values.
Source: Created based on “METI: Indices of Industrial Production”
Variation Width of Production in 2007 → 2013 (Points)
10
Industry2007→2013(Difference in points)
Goods2007→2013(Difference in points)
Chemicals -5.6 Non-durable consumer goods -0.5Electrical machinery -10.0 Producer goods -14.0Petroleum and coal products -12.1 Construction goods -15.0Pulp, paper and paper products -12.3 Industrial production (overall) -15.4Plastic products -12.5 Capital goods -23.3Ceramics, stone and clay products -13.8 Durable consumer goods -25.1Transport equipment -14.6Iron and steel -14.8Fabricated metals -15.0Mining and manufacturing (overall) -15.4Electronic parts and devices -16.4Non-ferrous metals -17.8General-purpose, production and business oriented machinery -25.0Textiles -25.6Information and communication electronics equipment -43.5

Trends of production capacity by industry sector (1)• Looking at the trends of production capacity by industry sector based on 2007 = 100, many
industry sectors including Manufacturing (overall) industry trended downward after peaking in 2007 or 2008.
Changes in Production Capacity by Industry Sector
11
(Note) 1. The list is arranged in descending order of production capacity in 2013.2. The figures of general-purpose, production and business oriented machinery industry in 2007 is the estimated values.3. Gradation color shows the degree of production capacity of each industry sector, from the highest to the lowest.
Source: Created based on “METI: Indices of Industrial Production”
(2007=100)Industry 2007 2008 2009 2010 2011 2012 2013
Electronic parts and devices 100.0 108.9 112.5 118.3 120.7 119.1 119.7 HighIron and steel 100.0 100.4 101.6 101.8 101.9 101.5 101.5
Transport equipment 100.0 101.0 99.7 99.4 99.5 99.7 99.1Non-ferrous metals 100.0 100.2 99.5 98.6 98.6 99.2 98.3
Chemicals 100.0 99.9 99.1 99.8 98.6 97.8 98.0Manufacturing (overall) 100.0 100.5 98.9 98.5 98.4 96.8 95.8
General-purpose, production and business oriented machinery 100.0 99.9 93.7 94.0 96.3 96.2 92.7Pulp, paper and paper products 100.0 99.6 97.1 95.1 94.5 91.5 91.4
Electrical machinery 100.0 95.2 93.7 93.0 91.7 90.3 90.8Fabricated metals 100.0 99.7 98.2 95.6 93.2 91.7 90.6
Petroleum and coal products 100.0 100.1 99.6 92.3 91.9 91.6 88.8Ceramics, stone and clay products 100.0 97.4 96.5 93.3 92.3 90.9 88.8
Information and communication electronics equipment 100.0 101.0 98.7 99.2 97.4 82.7 78.4Textiles 100.0 97.0 90.2 84.2 81.8 80.8 77.9 Low

Trends of production capacity by industry sector (2)• When comparing two points of time, 2007 with 2013, the production capacity of many industry sectors
decreased. Among them, the largest decrease was observed in Textiles industry and Information and communication electronics equipment industry.
• Meanwhile, the production capacity of Electronic parts and devices industry and Iron and steel industry increased.
(Note) 1. The list is arranged in descending order of difference in points.2. The figure of general-purpose, production and business oriented machinery industry in 2007 is the estimated value.
Source: Created based on “METI: Indices of Industrial Production”
Variation Width of Production Capacity in 2007 → 2013 (Points)
12
Industry2007→2013(Difference in points)
Electronic parts and devices 19.7Iron and steel 1.5Transport equipment -0.9Non-ferrous metals -1.7Chemicals -2.0Manufacturing (overall) -4.2General-purpose, production and business oriented machinery -7.3Pulp, paper and paper products -8.6Electrical machinery -9.2Fabricated metals -9.4Petroleum and coal products -11.2Ceramics, stone and clay products -11.2Information and communication electronics equipment -21.6Textiles -22.1
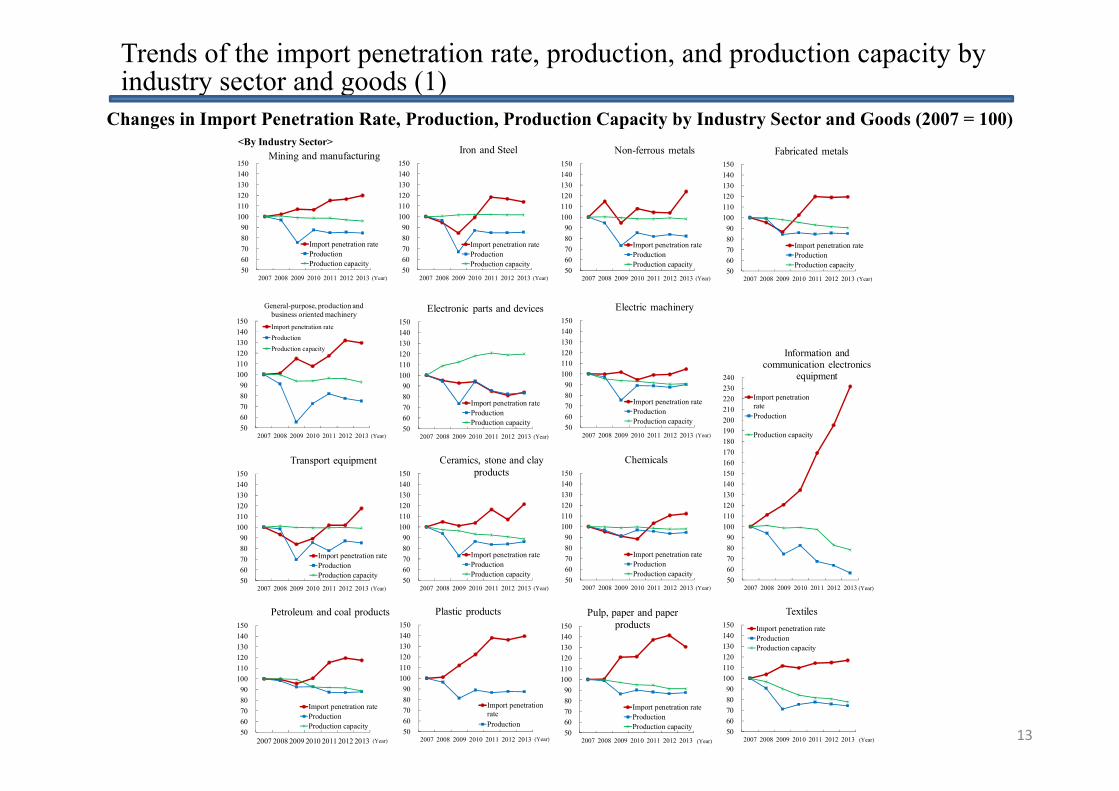
Trends of the import penetration rate, production, and production capacity by industry sector and goods (1)
13
Changes in Import Penetration Rate, Production, Production Capacity by Industry Sector and Goods (2007 = 100)<By Industry Sector>
5060708090
100110120130140150
2007 2008 2009 2010 2011 2012 2013
Mining and manufacturing
Import penetration rateProductionProduction capacity
(Year)5060708090
100110120130140150
2007 2008 2009 2010 2011 2012 2013
Iron and Steel
Import penetration rateProductionProduction capacity
(Year)5060708090
100110120130140150
2007 2008 2009 2010 2011 2012 2013
Non-ferrous metals
Import penetration rateProductionProduction capacity
(Year)5060708090
100110120130140150
2007 2008 2009 2010 2011 2012 2013
Fabricated metals
Import penetration rateProductionProduction capacity
(Year)
5060708090
100110120130140150
2007 2008 2009 2010 2011 2012 2013
General-purpose, production and business oriented machineryImport penetration rateProductionProduction capacity
(Year)5060708090
100110120130140150
2007 2008 2009 2010 2011 2012 2013
Electronic parts and devices
Import penetration rateProductionProduction capacity
(Year)5060708090
100110120130140150
2007 2008 2009 2010 2011 2012 2013
Electric machinery
Import penetration rateProductionProduction capacity
(Year)
5060708090
100110120130140150160170180190200210220230240
2007 2008 2009 2010 2011 2012 2013
Information and communication electronics
equipment
Import penetrationrateProduction
Production capacity
(Year)5060708090
100110120130140150
2007 2008 2009 2010 2011 2012 2013
Transport equipment
Import penetration rateProductionProduction capacity
(Year)5060708090
100110120130140150
2007 2008 2009 2010 2011 2012 2013
Ceramics, stone and clay products
Import penetration rateProductionProduction capacity
(Year)5060708090
100110120130140150
2007 2008 2009 2010 2011 2012 2013
Chemicals
Import penetration rateProductionProduction capacity
(Year)
5060708090
100110120130140150
2007 2008 2009 2010 2011 2012 2013
Petroleum and coal products
Import penetration rateProductionProduction capacity
(Year)5060708090
100110120130140150
2007 2008 2009 2010 2011 2012 2013
Plastic products
Import penetrationrateProduction
(Year)5060708090
100110120130140150
2007 2008 2009 2010 2011 2012 2013
Pulp, paper and paper products
Import penetration rateProductionProduction capacity
(Year)5060708090
100110120130140150
2007 2008 2009 2010 2011 2012 2013
Textiles Import penetration rateProductionProduction capacity
(Year)

Trends of the import penetration rate, production, and production capacity by industry sector and goods (2)
14
Changes in Import Penetration Rate, Production, Production Capacity by Industry Sector and Goods (2007 = 100, continued from the previous slide)
(Note) 1. The graphs for plastic products industry and each goods only show the import penetration rate and production because no figures are available on production capacity.2. The figures of production and production capacity of general-purpose, production and business oriented machinery industry in 2007 are the estimated values.
Source: Created based on “METI: Indices of Industrial Domestic Shipments and Imports” and “Indices of Industrial Production”
• While production capacity of many industry sectors including the overall mining and manufacturing has been shifting downward, production has remained stagnant, and the import penetration rate has been slowly but steadily increasing.
• For Information and communication electronics equipment industry, the production and production capacity has significantly decreased, while the import penetration rate has greatly increased.
• For Electronic parts and device industry, the production has been stagnating, while the production capacity has increased and the import penetration rate has been decreased.
• The production of Durable consumer goods and Capital goods remains stagnant, while the import penetration rate has been substantially increased.
<By Goods>
5060708090
100110120130140150
2007 2008 2009 2010 2011 2012 2013
Capital goods
Import penetrationrateProduction
(Year)5060708090
100110120130140150
2007 2008 2009 2010 2011 2012 2013
Construction goods
Import penetrationrateProduction
(Year)
5060708090
100110120130140150160170
2007 2008 2009 2010 2011 2012 2013
Durable consumer goods
Import penetration rateProduction
(Year)5060708090
100110120130140150
2007 2008 2009 2010 2011 2012 2013
Non-durable consumer goods
Import penetrationrateProduction
(Year)5060708090
100110120130140150
2007 2008 2009 2010 2011 2012 2013
Producer goods
Import penetrationrateProduction
(Year)
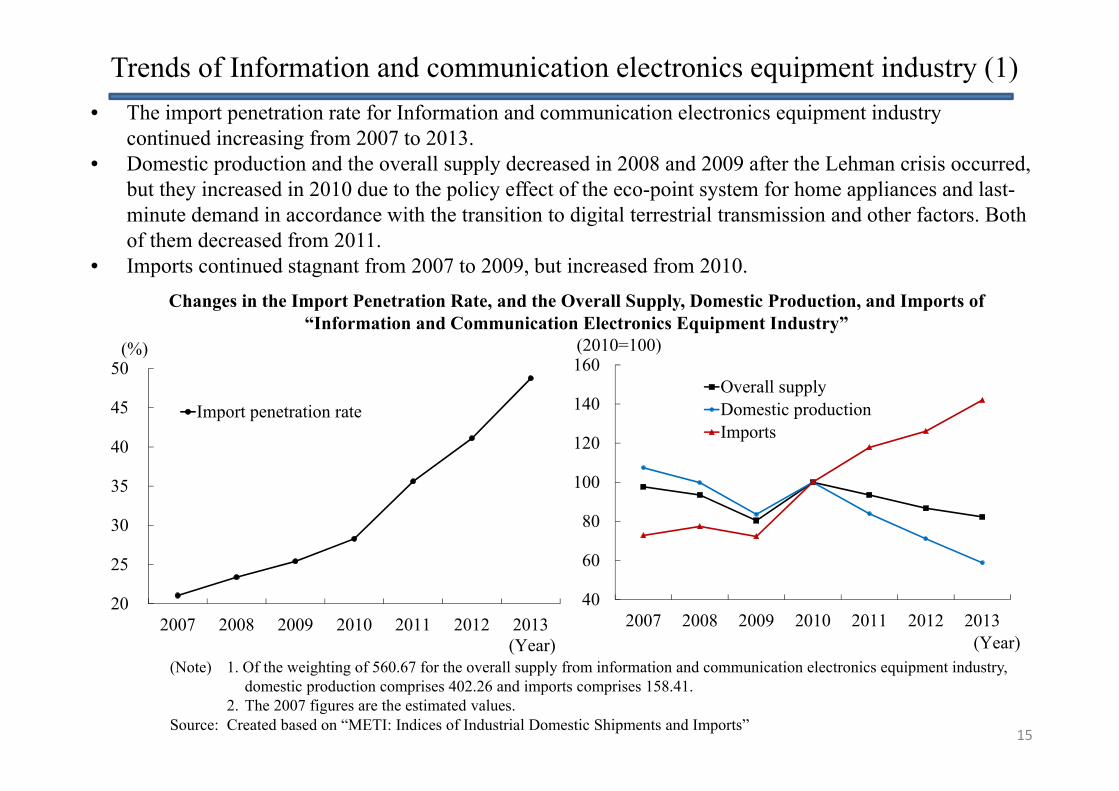
Trends of Information and communication electronics equipment industry (1)• The import penetration rate for Information and communication electronics equipment industry
continued increasing from 2007 to 2013.• Domestic production and the overall supply decreased in 2008 and 2009 after the Lehman crisis occurred,
but they increased in 2010 due to the policy effect of the eco-point system for home appliances and last-minute demand in accordance with the transition to digital terrestrial transmission and other factors. Both of them decreased from 2011.
• Imports continued stagnant from 2007 to 2009, but increased from 2010.
(Note) 1. Of the weighting of 560.67 for the overall supply from information and communication electronics equipment industry, domestic production comprises 402.26 and imports comprises 158.41.
2. The 2007 figures are the estimated values.Source: Created based on “METI: Indices of Industrial Domestic Shipments and Imports”
Changes in the Import Penetration Rate, and the Overall Supply, Domestic Production, and Imports of “Information and Communication Electronics Equipment Industry”
15
20
25
30
35
40
45
50
2007 2008 2009 2010 2011 2012 2013
Import penetration rate
(Year)
(%)
40
60
80
100
120
140
160
2007 2008 2009 2010 2011 2012 2013
Overall supplyDomestic productionImports
(Year)
(2010=100)
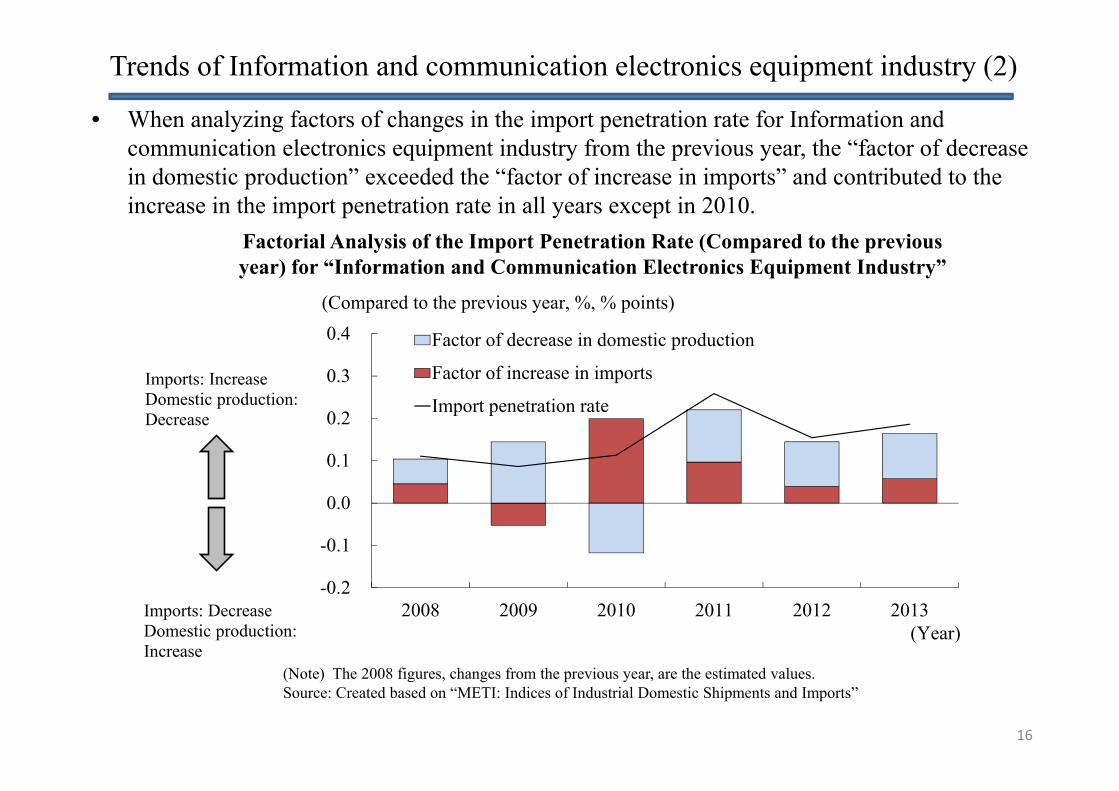
Trends of Information and communication electronics equipment industry (2)
• When analyzing factors of changes in the import penetration rate for Information and communication electronics equipment industry from the previous year, the “factor of decrease in domestic production” exceeded the “factor of increase in imports” and contributed to the increase in the import penetration rate in all years except in 2010.
(Note) The 2008 figures, changes from the previous year, are the estimated values.Source: Created based on “METI: Indices of Industrial Domestic Shipments and Imports”
Factorial Analysis of the Import Penetration Rate (Compared to the previous year) for “Information and Communication Electronics Equipment Industry”
16
2008 2009 2010 2011 2012 2013-0.2
-0.1
0.0
0.1
0.2
0.3
0.4 Factor of decrease in domestic production
Factor of increase in imports
Import penetration rate
(Compared to the previous year, %, % points)
(Year)
Imports: IncreaseDomestic production: Decrease
Imports: DecreaseDomestic production: Increase
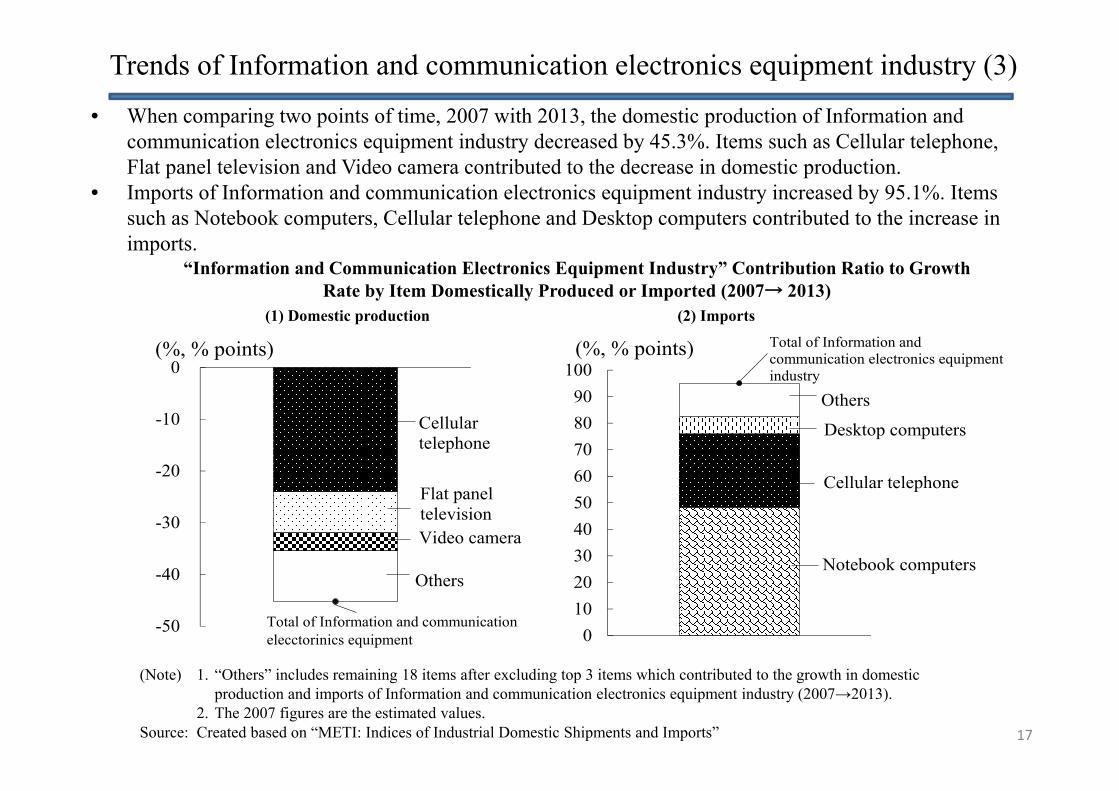
Trends of Information and communication electronics equipment industry (3)
• When comparing two points of time, 2007 with 2013, the domestic production of Information and communication electronics equipment industry decreased by 45.3%. Items such as Cellular telephone, Flat panel television and Video camera contributed to the decrease in domestic production.
• Imports of Information and communication electronics equipment industry increased by 95.1%. Items such as Notebook computers, Cellular telephone and Desktop computers contributed to the increase in imports.
(Note) 1. “Others” includes remaining 18 items after excluding top 3 items which contributed to the growth in domestic production and imports of Information and communication electronics equipment industry (2007→2013).
2. The 2007 figures are the estimated values.Source: Created based on “METI: Indices of Industrial Domestic Shipments and Imports”
“Information and Communication Electronics Equipment Industry” Contribution Ratio to Growth Rate by Item Domestically Produced or Imported (2007→ 2013)
17
(1) Domestic production (2) Imports
-50
-40
-30
-20
-10
0
Cellular telephone
Flat paneltelevisionVideo camera
Others
Total of Information and communication elecctorinics equipment 0
102030405060708090
100
Cellular telephone
Notebook computers
Desktop computers
Others
Total of Information and communication electronics equipment industry
(%, % points) (%, % points)

Trends of Information and communication electronics equipment industry (4)
• When checking the trends of the domestic production of main items which contributed to the decrease in domestic production and the increase in imports based on 2007=100, in 2013, Desktop computers increased to 102.9, but decreases were observed in items such as Notebook computers (decreased to 77.0), Cellular telephone (decreased to 18.9), Flat panel television (decreased to 6.1), and Video cameras (decreased to 4.6).
18(Note) The 2007 figures are the estimated values.Source: Created based on “METI: Indices of Industrial Production”
“Information and Communication Electronics Equipment Industry” Changes in Production Index by Item (2007 → 2013)
102.9
77.0
18.9
6.1 4.6 0
20
40
60
80
100
120
140
160
2007 2008 2009 2010 2011 2012 2013(Year)
(2007 = 100)
Flat paneltelevisions
Desktop computers
Notebook computers
Videocamera
Cellulartelephone

Trends of Electronic parts and devices industry (1)• The import penetration rate for Electronic parts and devices industry shifted downward
from 2007 to 2012, while it increased in 2013.• It was not necessarily that the domestic production had continued increasing, and the
imports had kept decreasing.
19
Changes in the Import Penetration Rate and the Overall Supply, Domestic Production, and Imports of “Electronic Parts and Devices Industry”
(Note) 1. Of weighting of 589.11 for the overall supply from electronic parts and devices industry, domestic production comprises 457.59 and imports comprises 132.52.
2. The 2007 figures are the estimated values.Source: Created based on “METI: Indices of Industrial Domestic Shipments and Imports”
18
19
20
21
22
23
24
2007 2008 2009 2010 2011 2012 2013
Import penetration rate
(Year)
(%)
70
80
90
100
110
120
2007 2008 2009 2010 2011 2012 2013
Overall supplyDomestic productionImports
(Year)
(2007 = 100)
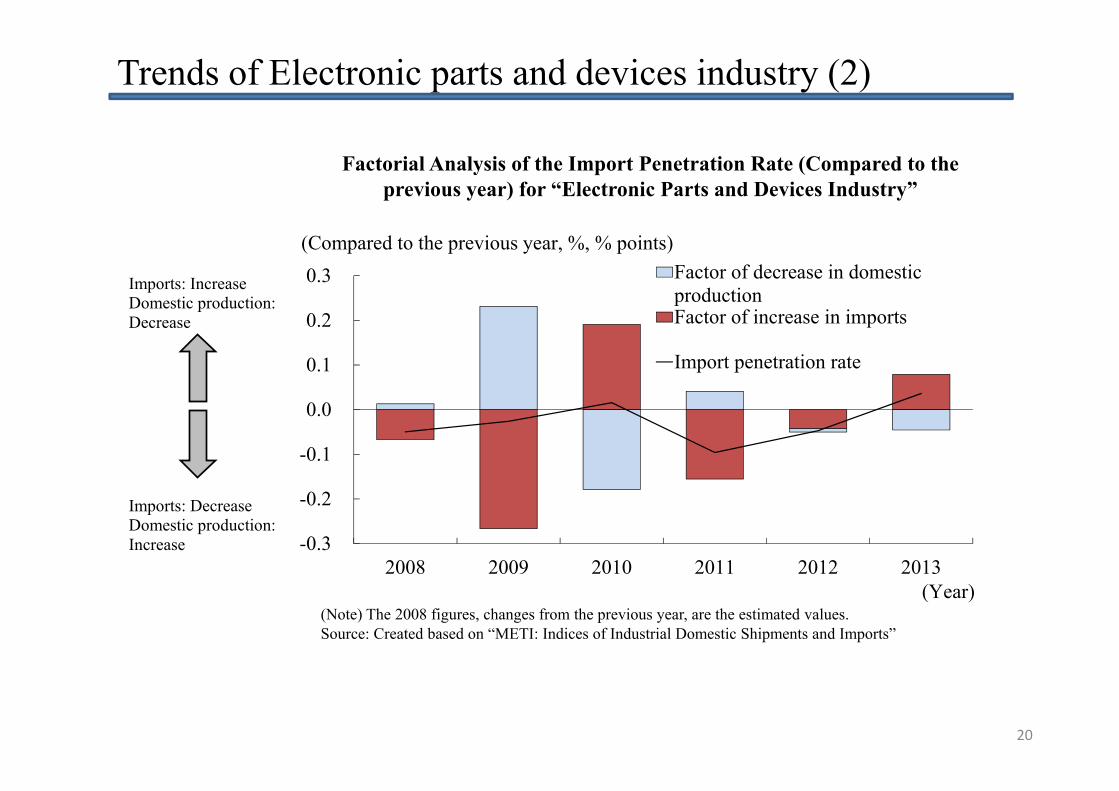
Trends of Electronic parts and devices industry (2)
(Note) The 2008 figures, changes from the previous year, are the estimated values.Source: Created based on “METI: Indices of Industrial Domestic Shipments and Imports”
Factorial Analysis of the Import Penetration Rate (Compared to the previous year) for “Electronic Parts and Devices Industry”
20
2008 2009 2010 2011 2012 2013-0.3
-0.2
-0.1
0.0
0.1
0.2
0.3 Factor of decrease in domesticproductionFactor of increase in imports
Import penetration rate
(Compared to the previous year, %, % points)
(Year)
Imports: IncreaseDomestic production: Decrease
Imports: DecreaseDomestic production: Increase

Trends of Electronic parts and devices industry (3)• When comparing two points of time, 2007 with 2013, the domestic production of Electronic parts and devices
industry increased by 0.3%. Items such as Metal oxide semiconductor ICs (Memory), Active matrix LCDs (middle and small) and Metal oxide semiconductor ICs (CCD) contributed to the increase in domestic production.
• Imports of Electronic parts and devices decreased by 19.8%. Items such as Magnetic tapes, Switching power supply units and Metal oxide semiconductor ICs (Memory) contributed to the decrease in imports.
(Note) 1. “Others” includes remaining 21 items after excluding top 3 items which contributed to the growth in domestic production and imports of electric parts and devices industry.
2. The 2007 figures are the estimated values.Source:Created based on “METI: Indices of Industrial Domestic Shipments and Imports”
“Electronic Parts and Devices Industry” Contribution ratio to Growth Rate by Item Domestically Produced or Imported (2007 → 2013)
21
(1) Domestic production (2) Imports
-20
-15
-10
-5
0
5
10
15
20(%, % points)
Others
MOS ICs (Memory)
Active matrix LCDs(Middle and small)
MOS ICs (CCD)
Total of electronic parts and devices industry
-20
-15
-10
-5
0(%, % points)
Others
Switching power supply units
Magnetic tapes
MOS ICs (Memory)
Total of electronic parts and devices industry

Trends in Electronic parts and devices industry (4)• When checking the trends of the domestic production of main items which contributed to the increase in
domestic production and the decrease in imports based on 2007=100, in 2013, significant increases were observed in items such as Metal oxide semiconductor ICs (Memory) (increased to 230.0), Active matrix LCDs (Middle and small) (increased to 167.6) and Metal oxide semiconductor ICs (CCD) (increased to 116.5). Meanwhile, Switching power supply units decreased to 79.9, and Magnetic tapes also decreased to 65.6.
(Note) The 2007 figures are the estimated values.Source: Created based on “METI: Indices of Industrial Production”
“Electronic Parts and Devices Industry” Changes in Production Index by Item (2007 → 2013)
22
230.0
167.6
116.5
79.9 65.6 60
80
100
120
140
160
180
200
220
240
2007 2008 2009 2010 2011 2012 2013(Year)
(2007=100)
Metal oxide semiconductor ICs (Memory)
Active matrix LCDs(Middle and small)
Metal oxide semiconductor ICs (CCD)
Switching power supply units
Magnetic tapes

23
<Summary (1)>• From 2007 to 2013, production capacity of many industry sectors
including Mining and manufacturing (overall) has shifted downward, while production has remained stagnate and the import penetration rate has slowly but steadily increased.
• In Information and communication electronics equipment industry, the production and production capacity substantially decreased, while the import penetration rate largely increased. The “factor of decrease in domestic production” exceeded the “factor of increase in imports” and contributed to the increase in the import penetration rate in all years except in 2010.
• The coexistence of “significant contraction of production base” and “rapid expansion of dependence on import”, which occurred in Information and communication electronics equipment industry during 2007 to 2013, is considered a main reason that the import penetration rate has not turned over in spite of continued weak yen.

24
<Summary (2)>• Electronic parts and devices industry is the only industry which
experienced reduction in the import penetration rate from 2007 to 2013. However, it was not necessarily that domestic production had continued increasing, and imports had kept deceasing during the period.
• When comparing two points of time, 2007 with 2013, the production in Electronic parts and devices industry (overall) decreased by 16.4 points, while the production of smartphone-related parts, such as Metal oxide semiconductor ICs (Memory), Active matrix LCDs (middle and small) and Metal oxide semiconductor ICs (CCD), greatly increased. The production capacity also increased.
<Summary (3)>• Japan’s import penetration rate shifted upward from 2007 to 2013.
When analyzing factors of changes in the import penetration rate from previous year, the “factor of increase in imports” contributed in a positive way from 2010. The “factor of decrease in domestic production” reversed its direction of contribution, but the degree of contribution reduced.
• Japan’s import penetration rate of the nearest third quarter of 2014 was 24.0%, further increased from 23.6% in 2013. We need to focus on the future trends of the import penetration rate.
25