triaxys directional wave buoy for nearshore wave ... technical report nos co-ops 38 triaxys...
TRANSCRIPT

NOAA Technical Report NOS CO-OPS 38
Triaxys Directional Wave Buoy for Nearshore WaveMeasurements - Test and Evaluation Plan
Silver Spring, MarylandJanuary 2003
noaa National Oceanic and Atmospheric Administration
U.S. DEPARTMENT OF COMMERCENational Ocean ServiceCenter for Operational Oceanographic Products and Services

Center for Operational Oceanographic Products and ServicesNational Ocean Service
National Oceanic and Atmospheric AdministrationU.S. Department of Commerce
The National Ocean Service (NOS) Center for Operational Oceanographic Products andServices (CO-OPS) collects and distributes observations and predictions of water levelsand currents to ensure safe, efficient and environmentally sound maritime commerce.The Center provides the set of water level and coastal current products required tosupport NOS' Strategic Plan mission requirements, and to assist in providing operationaloceanographic data/products required by NOAA's other Strategic Plan themes. TheCenter manages the National Water Level Observation Network (NWLON), and anational network of Physical Oceanographic Real-Time Systems (PORTS™) in majorU.S. harbors. The Center: establishes standards for the collection and processing ofwater level and current data; collects and documents user requirements which serve asthe foundation for all resulting program activities; designs new and/or improvedoceanographic observing systems; designs software to improve CO-OPS' data processingcapabilities; maintains and operates oceanographic observing systems; performsoperational data analysis/quality control; and produces/disseminates oceanographicproducts.

NOAA Technical Report NOS CO-OPS 38
Triaxys Directional Wave Buoy for Nearshore WaveMeasurements - Test and Evaluation Plan
H.H. Shih
January 2003
noaa National Oceanic and Atmospheric Administration
U.S. DEPARTMENT OF COMMERCE National Oceanic and Atmospheric AdministrationDon Evans, Secretary Vice Admiral Conrad C. Lautenbacher, Jr., U.S. Navy (Ret.)
Undersecretary of Commerce for Oceans and Atmosphere and NOAA Administrator
National Ocean ServiceJamison Hawkins, Acting Assistant Administrator for
NOAA Oceans and Coasts
Center for Operational Oceanographic Products and ServicesMichael Szabados, Director
NOTICE
Mention of a commercial company or product does not constitutean endorsement by NOAA. Use for publicity or advertisingpurposes of information from this publication concerning proprietaryproducts or the tests of such products is not authorized.

iii
Table of Content
Page ABSTRACT .......................................................................................................................... 1
1. INTRODUCTION ............................................................................................................... 11.1 Needs for Wave Information ................................................................................... 11.2 Existing Wave Measurement Systems .................................................................... 11.3 Available Instruments .............................................................................................. 21.4 NOS Application Environment ............................................................................... 41.5 Test and Evaluation Objectives ............................................................................... 5
2. THE TRIAXYS DIRECTIONAL WAVE BUOY .............................................................. 72.1 Principle of Operation ............................................................................................. 72.2 Major Components and Manufacturer’s Specifications .......................................... 7
3. TEST AND EVALUATION ............................................................................................... 153.1 Scope ....................................................................................................................... 153.2 Approaches ............................................................................................................. 15
3.2.1 General Guidelines ......................................................................................... 153.2.2 Type of Test .................................................................................................... 16
A. Acceptance Test ........................................................................................ 16B. Subsystem/Module/Component Test ........................................................ 17C. System Performance Test .......................................................................... 19D. Data Quality Assurance Test .................................................................... 19E. Operational Test ........................................................................................ 19
3.3 System Issues to Be Verified .................................................................................. 203.4 Responsibility ......................................................................................................... 203.5 Test Facilities .......................................................................................................... 203.6 Schedule .................................................................................................................. 21
4. DOCUMENTATION, REVIEW AND PLANNING ........................................................ 234.1 Test Report .............................................................................................................. 234.2 Review and Planning .............................................................................................. 23
ACKNOWLEDGMENTS ....................................................................................................... 25
REFERENCES ........................................................................................................................ 25
APPENDICES ......................................................................................................................... 27A. Triaxys Factory Check Sheets ................................................................................... 28B. Triaxys Sensor Validation Sheets .............................................................................. 31C. Triaxys Field Checkout/Deployment Sheet ............................................................... 34

iv

1
ABSTRACTA Triaxys directional wave buoy was acquired by CO-OPS with funds from the NOSPartnership, “Tools and Technical Guidance to Improve Restoration of Coastal Habitat”.It is to be deployed at Barren Island and other sites in the Chesapeake Bay in support ofmarsh restoration. In the future, it may be used to support other CO-OPS programs,such as PORTS® and other coastal programs. The buoy contains three solid stateaccelerometers, three angular rate sensors, and a fluxgate compass, and derives directional waveinformation from dynamic motion measurements and six degrees of freedom buoy motionequations. The technique is relatively new and requires validation by NOS for operational useby NOS. This document outlines a test and evaluation plan which provides a framework fordeveloping detailed test procedures that can be carried out in- house or via contractualarrangement. 1. INTRODUCTION1.1 Needs for Wave Information Surface waves provide principle energy inputs to many near shore processes such as long shorecurrents, changes in beach profiles, longshore transportation of sand. There has been growinginterest in coastal wave information from maritime commerce, environmental managers, andengineering and scientific communities. Previous user surveys have found that the surface waveobservations and forecasts are usually one of the top three variables requested or used by marineusers. The other two variables are surface winds and currents. The Oceans.US PhasedImplementation Plan for the US IOOS [1] also identifies waves as number 3 priority underphysical observations, following temperature and salinity.
Identified areas of application include wave nowcast/forecast model verification, marshrestoration and shore erosion, hazardous material spill response, coastal storm induced flooding,engineering design and construction, dredging, ship routing and scheduling, cargo loading andunloading, and recreational boating. Wave observation networks in ports and harbors have beenestablished in several countries including Japan, Netherlands, and Spain.
In the U.S., user groups include Federal agencies (NOAA, USCG, USACE, Navy, EPA, andUSGS), State and local governments (Port Authorities, Civil Defense, Public Work, Recreation,and Natural Resources), private industry and general public [2].
There is an identified gap in NOS in operational observing system capabilities for waves inports, harbors, and bays.
1.2 Existing Wave Measurement Systems Several wave measurement systems/networks are presently installed in the U.S. TheNOAA/National Data Buoy Center (NDBC) maintains and operates a network of large wavebuoys in order to gather wave information in deeper ocean basins as well as in the Great Lakes.Some of NDBC’s coastal C-MAN stations also are equipped with water level sensors whichproduce non-directional wave information [3]. The U.S. Army Corps of Engineers (USACE)

2
together with the Scripps Institution of Oceanography (SIO) maintain and operate pressuretransducer arrays and Waverider buoys for directional and non-directional wave measurementsin shallower coastal waters [4].
There are also other special research programs, such as the Navy’s North Gulf Littoral Initiativeand Louisiana State University’s Wave-Current-Surge Information System [5]. Wave monitoringnear shore such as in and around ports, harbors and bays, however, is not common.
1.3 Available InstrumentsAvailable instruments can be categorized into two groups: in situ and remote sensing. A briefdescription and comments about commonly used sensors or technologies are given below.
A. In Situ InstrumentsIn situ techniques are ideal for collecting large quantities of wave data at a specific point.However, deployment and maintenance for long term services are expensive. Commonly usedinstruments, their advantages and disadvantages are listed below.
a) Surface piercing type a1. Resistance gauges - The gauge consists of two vertical parallel conducting wires. Thetwo wires are insulated from one another at the lower ends. Water will short the wires andcreates a circuit. The resistance of this circuit is related to the depth of submergence of thewires and hence the water surface elevation.
Advantages: high frequency response; easy to install; widely used in laboratory.Disadvantages: non-directional wave data; changes in the water salinity will affect thecalibration of the gauge; fouling of wires also present a problem; requires continualmaintenance.
a2. Capacitance gauges - the gauge consists of a single Teflon coated wire. Theconducting wire and the water form the two plates of a capacitor, separated by theinsulating coating. The dielectric constant of the capacitor varies with the length ofsubmergence.
Advantages: high frequency response; insensitive to salinity changes; easy to install;widely used in laboratory.Disadvantage: non-directional wave data; marine fouling and damage of insulating coatingof the wire often affect the gauge performance; requires continual maintenance.
a3. Transmission line gauges (such as the Baylor wave staff) - The gauge consists of twoinductive wire ropes held vertically in parallel under tension. These wires form an electrictransmission line terminated by the water surface. The impedance of the transmission linevaries with the water surface elevation and can be easily measured. The gauges have anaccuracy and resolution of 1 and 0.1 percent full scale, respectively.
Advantages: rugged, easily to install and maintain; used widely by offshore oil industry. Disadvantages: non-directional wave data;
b) Bottom mounted instruments

3
b1. Pressure transducer array - compute surface elevation and direction from waterpressure and phase measurements.
Advantages: less susceptible to damage from dynamic water surface; Disadvantages: measures depth attenuated pressure; uses linear wave theory to derivecorrect pressure; needs water density and barometric pressure data in water surface heightconversion; need data telemetry to shore; has relatively poor high frequency response dueto water depth pressure attenuation.
b2. Acoustic Doppler Current profiler (ADCP) - derive surface wave information fromwave orbital velocity and pressure measurements.
Advantages: measure both current profiles and directional wave information; morecompact and rugged than bottom pressure array.Disadvantages: High frequency wave measurements may be limited due to water depthpressure attenuation. The instrument uses linear wave theory for pressure correction.
b3. PUV sensor – This includes the SonTek Acoustic Doppler Profiler and Velocity Meter(ADP and ADV) and InterOcean’s S4 electromagnetic current meter. Statistics of sea surfaceelevation are derived from pressure measurements at a point and wave direction is computedfrom phase differences between surface elevation and orbital velocities (U and V).
Advantages: measure both current profiles and directional wave information; morecompact and rugged than bottom pressure array.Disadvantages: Uses linear wave theory for pressure correction and has low directionalresolution.
c) Surface buoys c1. Slope-following buoys - Heave-pitch-roll buoy such as NDBC disc and torous buoys.
Advantages: rugged and used often in deep water.Disadvantages: hull and mooring system are expensive; accurate measurement requires thatthe buoy be designed to follow water surface and the accelerometer remains vertical
c2. Particle following buoys – These include Datawell’s Waverider and AXYS’ Triaxysbuoy. Typically spherical shape; uses a compliant mooring system; The Waverider sensingpackage consists of a gyroscopically stabilized platform, accelerometers (heave), surfaceslope (pitch and roll) and compass. The Triaxys sensing package consists ofaccelerometers, rate gyros, and compass.
Advantages: less expensive; portable; widely used.Disadvantages: susceptible to theft, vandalism and damage from shipping; could beoverturned by steep breaking waves (often occur in shallow waters less than 8 m); accuratemeasurement requires that the buoy be designed to follow water particles; accuracydegrades in very highest waves or short crest seas, and measuring nonlinear waveproperties.
B. Remote Sensing TechniquesRemote sensing techniques, ground-based, aircraft borne, or satellite borne, are capable ofmeasuring the surface wave field (locally or global). However, only limited instruments are

4
operational or quasi operational. Several others are in the developmental phase and requireadequate validation. Existing technologies are briefly listed below.
a) Ground-based, ship-based, or aircraft-borne:a1. Microwave radar - Mostly are used in scientific experiments (such as NOAA, U.S.Naval Research Lab). Several European products are in the market (such as Miros, SAAB,MAREX microwave radar, and GSK marine radar).
Advantage: above sea surface, provide wave pattern information, useful in research andsite specific studies. Disadvantage: performance has not been adequately validated.
a2. Laser and sonic - Several ranging instruments have been used for non-directional wavemeasurement (such as IR laser wave height sensor by Schwartz electro-Optics used byNDBC, THORN/EMI wave height sensor used in Europe, Western Marine Electronics’sonic sensor).
Advantage: non-contact with water surfaceDisadvantage: non-directional and performance has not been adequately validated.
b) Satellite-borne: b1. Radar altimeter (1986-1990 GEOSAT, 1992-present TOPEX, 1991 - present ERS1,1995-present ERS2) - not applicable to coastal area where wave field has significantlyspatial variability (due to large footprint, approximately 10 km in diameter), oceancoverage and repeat paths are relatively course; no wave period or direction can beobtained; requires validated signal transfer functions; typical accuracy is about + 0.5 m or10% in significant wave height, whichever is greater.
b2. Synthetic Aperture Radar (SAR, installed on SEASAT, ERS1, ERS2, RADRSAT) - Acoherent radar that looks at right angles to the flight path. Swath path is about 100 kmwide and offset from the satellite track by about 250 km. ERS1 and 2 are capable ofproviding 10 km x 5 km wave-mode images every 200 km along the satellite track. Advantage: potentially global directional wave spectra, providing wave patterninformation. Disadvantage: Mechanisms in deriving wave information from SAR images are complexand are still under study. Application to near coast area (ports, harbors and bays) is limited.
1.4 NOS Application Environment The requirement to provide wave information for safe and efficient navigation in major ports aswell as for marsh restoration and other environmental management programs in estuaries andmarine sanctuaries could lead to a new service area, either by NOS alone, or through cooperativeefforts with other partners.
Since winds in enclosed or semi-enclosed waters are limited in fetch, locally wind generatedwaves are typically of short periods. However, ocean waves and swells coming from openoceans may produce large surface oscillations, especially when the periods are close to the
5
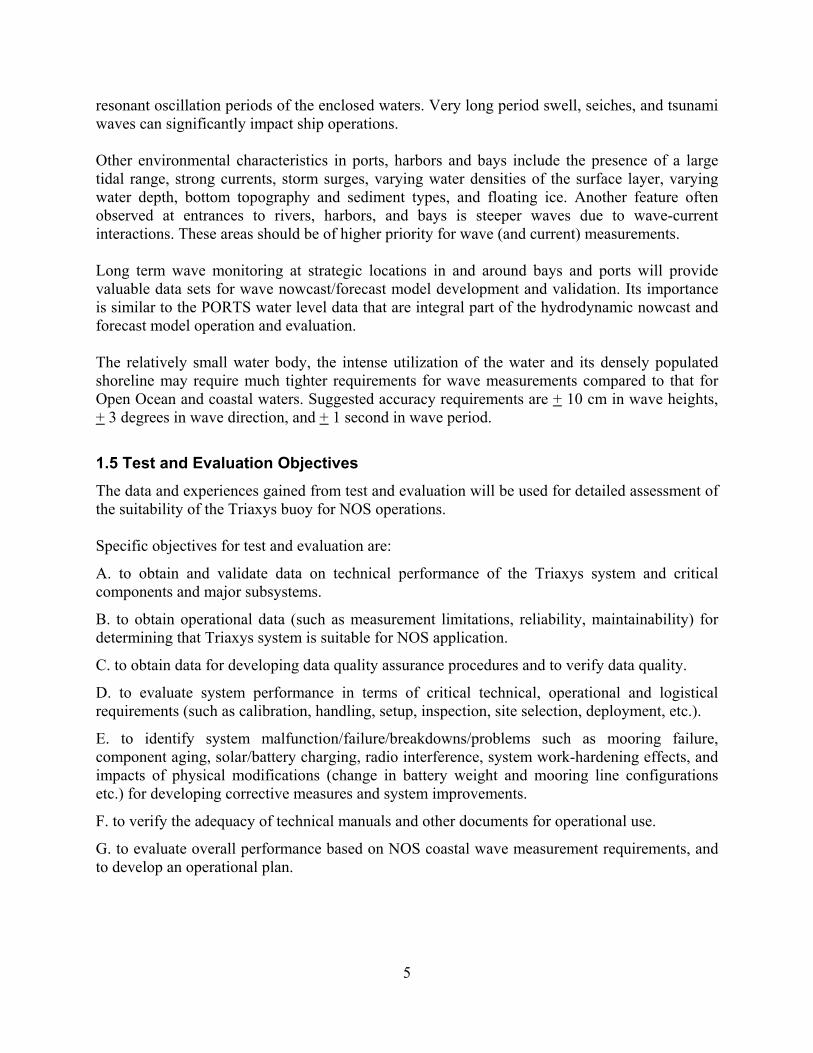
resonant oscillation periods of the enclosed waters. Very long period swell, seiches, and tsunamiwaves can significantly impact ship operations.
Other environmental characteristics in ports, harbors and bays include the presence of a largetidal range, strong currents, storm surges, varying water densities of the surface layer, varyingwater depth, bottom topography and sediment types, and floating ice. Another feature oftenobserved at entrances to rivers, harbors, and bays is steeper waves due to wave-currentinteractions. These areas should be of higher priority for wave (and current) measurements.
Long term wave monitoring at strategic locations in and around bays and ports will providevaluable data sets for wave nowcast/forecast model development and validation. Its importanceis similar to the PORTS water level data that are integral part of the hydrodynamic nowcast andforecast model operation and evaluation.
The relatively small water body, the intense utilization of the water and its densely populatedshoreline may require much tighter requirements for wave measurements compared to that forOpen Ocean and coastal waters. Suggested accuracy requirements are + 10 cm in wave heights,+ 3 degrees in wave direction, and + 1 second in wave period.
1.5 Test and Evaluation ObjectivesThe data and experiences gained from test and evaluation will be used for detailed assessment ofthe suitability of the Triaxys buoy for NOS operations. Specific objectives for test and evaluation are:
A. to obtain and validate data on technical performance of the Triaxys system and criticalcomponents and major subsystems.
B. to obtain operational data (such as measurement limitations, reliability, maintainability) fordetermining that Triaxys system is suitable for NOS application.
C. to obtain data for developing data quality assurance procedures and to verify data quality.
D. to evaluate system performance in terms of critical technical, operational and logisticalrequirements (such as calibration, handling, setup, inspection, site selection, deployment, etc.).
E. to identify system malfunction/failure/breakdowns/problems such as mooring failure,component aging, solar/battery charging, radio interference, system work-hardening effects, andimpacts of physical modifications (change in battery weight and mooring line configurationsetc.) for developing corrective measures and system improvements.
F. to verify the adequacy of technical manuals and other documents for operational use.
G. to evaluate overall performance based on NOS coastal wave measurement requirements, andto develop an operational plan.

6

7
2. THE TRIAXYS DIRECTIONAL WAVE BUOY2.1 Principle of OperationThe Triaxys Wave Buoy, like the widely used Datawell Directional Waverider Buoy, is a waterparticle-following buoy that measures the water particle motion in three orthogonal directions.However, the wave measuring techniques for the two instruments are different. The Triaxysbuoy uses three accelerometers to measure total accelerations along the mutually orthogonal X,Y, Z axes of the buoy; three angular rate sensors to measure rotation rates about the roll, pitchand yaw axes, and a gimbaled compass to measure sensor heading. An algorithm for a 6-degrees-of-freedom non-linear equation of motion of sensor and a Maximum Entropy Methodare used to derive wave height and directional frequency spectra. In comparison, the Waveriderbuoy uses heave-pitch-roll sensors, two horizontal hull-fixed accelerometers, and compass todetermine directional wave information.
The Triaxys buoy also differs from the traditional NDBC disc buoy, a surface slope followingbuoy, which uses a similar sensor package as Waverider.
The Triaxys buoy wave measuring technique is claimed to be more flexible and accurate.However, its accuracy and reliability have not been fully evaluated.
2.2 Major Components and Manufacturer’s Specifications The major system components consist of the sensor and telemetry module (TAS), the TriaxysDigital Receiver (TDR) and antenna, a power supply subsystem consisting of solar panelassembly and batteries (TAB), navigation light, antenna, and an infrared serial port, upper domecover and clamping ring, lower hull (including purge port, lifting bridle, and magnetic key),rubber fender, and mooring hardware. A User’s manual, WaveView software, and spares kit arealso included in the delivered package.
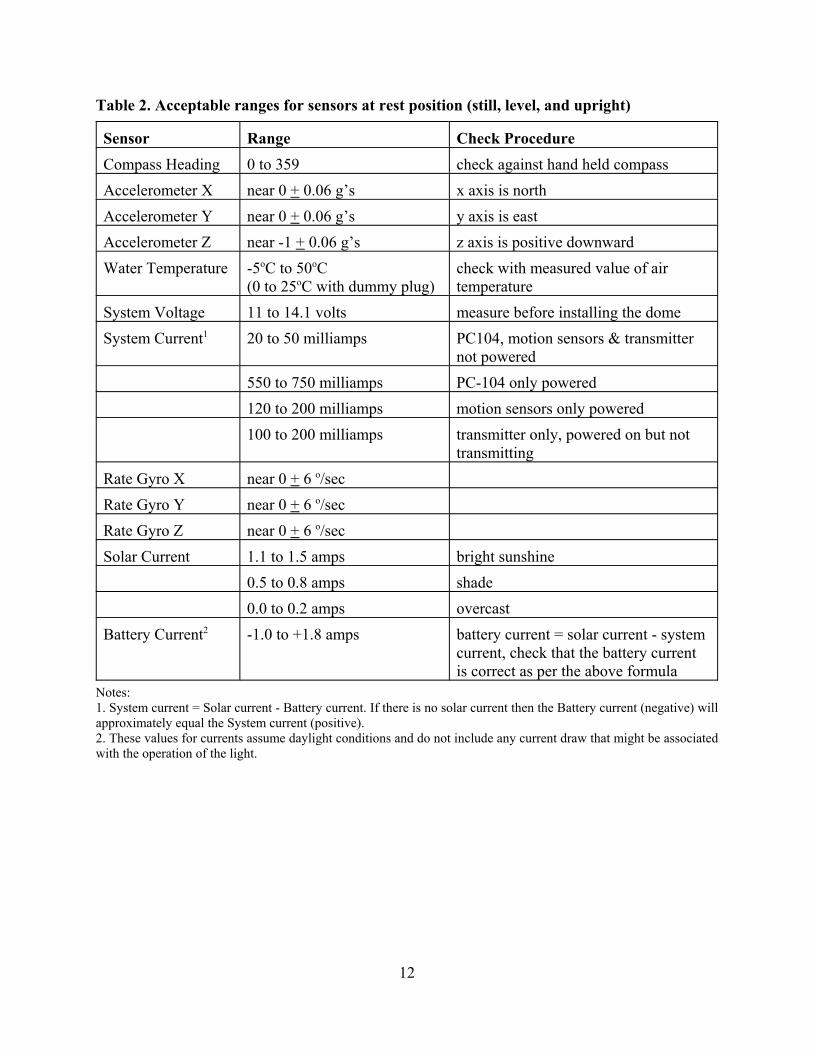
Sensors and data processing software include compass, accelerometers (along X, Y, and Z axes),angular rate gyros (about X, Y, and Z axes), and PC104 wave processor. Other measurementsinclude water temperature, system voltages and currents, solar currents, and battery currents.Data telemetry subsystems include VHF radio system and antenna, GPS and ARGOS. Aninternal PCMCIA RAM stores data up to 128 MB. The WaveView software allows the user tomonitor data collection in real-time. Figs. 1 and 2 show the major components of the Triaxys buoy and manufacturer suggestedstandard mooring configuration, respectively. Manufacturer’s specifications and acceptableranges for sensors at static, level, and upright position and static tilt positions are summarized inTables 1 and 2, respectively.

8
Figure 1. Major components of Triaxys directional wave buoy [5]

9
Figure 2. Triaxys standard mooring configuration in deep water [5]

10
Table 1. Triaxys Directional Wave Monitoring System Specifications [5]
ITEM SPECIFICATIONPhysical DescriptionDiameter nominal, around bumper - 1.10 m (43.5 inches) O.D.
Stainless steel hull - 0.91 m (36 inches)Weight 197 kg (including 4 batteries); 90 kg (excluding batteries) Purge port 3/4" - 16 UNF with Swagelock hex plugObstruction light Amber LED source; programmable flash sequence, three miles visibilityMaterialsHull Stainless steelDome Polycarbonate Cyrolon ZX (tested to ASMT D3763 and ISO 6603-2
impact specifications)Solar panelassembly
Fiberglass over foam
Clamping ring Stainless steelSensors/ProcessorWater temperature Thermilinear composite networkAccelerometers Flexure suspension servo (range: + 2g)Rate Piezoelectric vibrating gyroscope (max. angular velocity: + 80 deg. /s)Compass Microprocessor controlled fluxgate (accuracy: + 0.5 deg.)A/D and samplingfrequency
8 channel 14 bit at 4 Hz
Microprocessor PC104 and 80C552GPS 12 channelsResolution/Accuracy
Range Resolution AccuracyHeave + 20 m 0.01 m better than 2%Period 1.56 to 33.33 secondsDirection 0 to 360 degrees + 1 degreeWater temperature -5 to +50 deg. C + 0.1 degree C

ITEM SPECIFICATION
11
Power System
Operational systemvoltage
11.0 to 14.1 VDC
Batteries 4 @ GNB SunLyte 5000X 12 volt, 100 amp hrSolar panels 10 @ 6 watt Siemens SM6Smart charger Sunsaver-6On/off switch Turn buoy on when Magnetic Key is removedTelemetry30 to 50 MHz Synthesized VHF transmitter (standard)Effective radiatedoutput
0.5 watts
Data Format Binary transmissionTransmission rate 2400 BaudMaximum range(VHF line-of- sight)
16 km (10 miles) over water (less over land)
Optionaltransmission
ARGOS
Optional watch-circle beacon
ARGOS or INMARSAT D+
Input/output power and data through Belgian connector; frequency bands up to 123 Operating temperature
-30 to +60 degree C
Storage/transit temperature
-40 to +70 degree C
Data transmission
standard: multiple transmissions of each data set; directional wave characteristics and spectra; wave statistics; SST; battery voltage; solar current; error checking. optional: VHF (30-39 MHz, or 39-50 MHz, synthesized frequency selection), or ARGOS; real-time; programmable configuration communication: 19,200 baud, 8 bits, 1 stop, no parity
Power supply: +12 to 14 VDC consumption: 0.134 amp-hr per 20-min sample transmission: 3 watts @ 12 VDC; VHF range to 10 nautical miles battery: 4 gel cells solar panel: 10 @ 6 watts
Position GPS/ARGO (optional)
12
Table 2. Acceptable ranges for sensors at rest position (still, level, and upright)
Sensor Range Check ProcedureCompass Heading 0 to 359 check against hand held compassAccelerometer X near 0 + 0.06 g’s x axis is northAccelerometer Y near 0 + 0.06 g’s y axis is eastAccelerometer Z near -1 + 0.06 g’s z axis is positive downwardWater Temperature -5oC to 50oC
(0 to 25oC with dummy plug)check with measured value of airtemperature
System Voltage 11 to 14.1 volts measure before installing the domeSystem Current1 20 to 50 milliamps PC104, motion sensors & transmitter
not powered550 to 750 milliamps PC-104 only powered120 to 200 milliamps motion sensors only powered100 to 200 milliamps transmitter only, powered on but not
transmittingRate Gyro X near 0 + 6 o/secRate Gyro Y near 0 + 6 o/secRate Gyro Z near 0 + 6 o/secSolar Current 1.1 to 1.5 amps bright sunshine
0.5 to 0.8 amps shade0.0 to 0.2 amps overcast
Battery Current2 -1.0 to +1.8 amps battery current = solar current - systemcurrent, check that the battery currentis correct as per the above formula
Notes: 1. System current = Solar current - Battery current. If there is no solar current then the Battery current (negative) willapproximately equal the System current (positive).2. These values for currents assume daylight conditions and do not include any current draw that might be associatedwith the operation of the light.

13
Table 3. Acceptable ranges for accelerometers at static tilt position
Sensor Range in g (+ 0.03g) ProcedureAccelerometer X -sin 2 (for 2 = 20o, value = - North downAccelerometer Y 0 North downAccelerometer Z -cos 2 (for 2 = 20o , value = - North downAccelerometer X +sin 2 (for 2 = 20o, value = North upAccelerometer Y 0 North upAccelerometer Z -cos 2 (for 2 = 20o , value = - North upAccelerometer X 0 West upAccelerometer Y -sin 2 (for 2 = 20o, value = - West upAccelerometer Z -cos 2 (for 2 = 20o , value = - West upAccelerometer X 0 West downAccelerometer Y +sin 2 (for 2 = 20o, value = West downAccelerometer Z -cos 2 (for 2 = 20o , value = - West down

14

15
3. Test and Evaluation 3.1 ScopeSince the Triaxys system is being considered for deployment as an operational system, the focusof the tests will be:
A. to verify system performance and functionality of subsystems.
B. to demonstrate the suitability of the system to NOS applications.
C. to establish that the data quality satisfies NOS requirements.
3.2 Approaches3.2.1 General GuidelinesThe followings are general guidelines for tests and evaluations:
A. System to be tested and evaluated includes all hardware, software, internal and externalinterfaces and documents.
B. System will be inspected/checked after delivery from manufacturer, tested/checked prior todeployment, and calibrated/tested after 1-2 years of service.
C. Test requirements, plans, and procedures will be evaluated to ensure compatibility betweentests.
D. Determine whether the delivered system meets NOS requirements.
E. Existing well accepted instruments and methods will be used as references for evaluatingthe performance of the instrument and its components.
F. Components testing will be kept to a minimum whenever valid test data exist. Duplicationof testing will be kept to minimum (except those for deployment and acceptance).
G. Data to be evaluated consists of those obtained by manufacturers, other users, fromlaboratory, field tests, and service records.
H. It is assumed that the manufacturer has conducted all necessary design tests after burn-in,prior to delivery. These include functional tests in service configurations, environmental testsunder extreme conditions, reliability tests, maintainability tests, subsystem integration tests.These tests will not be repeated unless test records are not available or new designmodifications are made. Sample manufacturer’s factory test records (for the NOS Buoy S/NTAB00311) are shown in Appendix A.
I. Documents will be reviewed by operating personnel and users for accuracy and clarity.
J. Software will be reviewed and tested for accuracy and functionality.

16
3.2.2 Type of TestSeveral types of test will be conducted in order to meet the test and evaluation objectives. Theseare described below. A description of some of the associated test facilities are given in Section3.5 A. Acceptance Test An acceptance test will be performed after receiving of product. It will be done mostly in thelaboratory to verify that the delivered system meets contractual requirements. Recommendedtests include:
a) Sensor range value test under static level and tilt positions (Tables 2 and 3). Fig. 3 showsthe buoy convention for heading, and roll axes used in the range value tests.
b) Visual inspections (S/N of major components, cleanness and scratches, and cracksaround the dome flange area; lifting bridle, magnetic key, and other attachments).
c) Verification and documentation of contractor provided items (S/N and other pertinentdata of hardware, software, user’s manual, spares kit, IR device/harness, antenna cable and3 db antenna, etc.)
Figure 3. Buoy conventions for heading and roll axes

17
B. Subsystem/Module/Component TestThis is to verify that subsystems, modules, components, and interfaces function properly. Thesewill be conducted when anticipated operational conditions are close to the limits of the specifiedrange (such as operating temperature), a new design modification or change has been made, thesensors’ function needs to be validated, or special issues identified in the field tests are to beinvestigated. Recommended tests include:
a) Validation of sensor range values under static level and tilt positions.
b) Validation of angular rate gyros via pendulum test (Fig. 4).
Sample form is shown in Section 7.4 of Triaxys sensor validation sheets in Appendix B.
c) Calibration of wave height and period measurements using rotating arm facility (orRotating/or Swing Calibrator, Fig. 5).
It is recommended that tests (a) and (b) be conducted whenever there is concern about thefunctions of the system. Test (c) should be performed by the manufacturer prior to return fromrepair.
Figure 4. Pendulum test setup

18
Figure 5. Rotating arm test (swing calibrator) setup
d) Wave processor (PC104) test – This is to check the processor for accuracy. It isdesirable to check the processor outputs using simulated sensor inputs (compass,accelerometers and angular rates). The Triaxys Wave Processing Diagnostics Menu allowsuser to check the processor using simulated sinusoidal wave amplitudes and periods.
e) Radio base station subsystem test/check. The subsystem includes the Triaxys DigitalReceiver (TDR), antenna, and associated software. If the received signal is affected by RFinterference the antenna should be relocated and/or reconfigured. Typical acceptablebackground noise level is around 2 dB and signal strength is around 3 dB. The VHF radiooperating frequency is set at the factory (42.6 MHz for NOS buoy S/N TAB00311). Thisvalue is indicated on the receiver panel. For a minor frequency change, a channel change issufficient. When a major frequency shift occurs, a complete realignment of the radioshould be done at the factory.
The manufacturer should be contacted for problems related to other subsystems such as ARGOSand GPS.

19
C. System Performance TestInter comparison tests using accepted reference instruments provide the ultimate performancevalidation. System performance tests will be conducted in event driven pilot projects due tolimitations in budget and staff resources. As shown in Table 3, the planned system performancetests are:
a) Field tests at Duck, NC - A cooperative effort with NDBC and Army Corps ofEngineers’ Field Research Facility (FRF) will enable us to inter compare with FRF’sreference wave instruments in high energy coastal area. Ancillary data include wind,current (low) and temperature.
b) Field deployments in the Chesapeake Bay - This is to support marsh restoration, wavemodeling, hazardous material spill analysis, and to evaluate advanced underwater datatelemetry technology through the NOS Partnership program. Ancillary data include waterlevel and current measurements. NOS’ tide station and other bay monitoring network (suchas EPA and University of Maryland at Hines Point) in the vicinity provide otherenvironmental data such as wind, air and water temperature.
c) Other special wave measurement projects - There are a few other PORTS® sites andcoastal navigation waterways where wave information is of importance to mariners. Theseinclude, Los Angles/Long Beach harbor complex, Puget Sound, Chesapeake Bay entrance,Cape Cod Canal, etc. and are potential test sites when resources are available.
The varied environmental conditions at these sites offer excellent opportunity to fully evaluatethe Triaxys’ performance.
D. Data Quality Assurance TestThe time series data and results of statistical analyses obtained from tests will be studied toassess the data quality. To facilitate data processing and analysis and maintain high quality of data the following tasksshould be performed.
a) Develop automated methods and procedures for real-time data quality check, analysis(wave energy spectra, zero crossing, and statistics) and data storage.
b) Analyze failure and faults to identify causes and to develop correction procedures.
c) Perform Inter comparisons with reference instruments and/or wave model hindcasts.
d) Develop methods and formats for data products and dissemination.
E. Operational TestThis is to verify that the delivered system performs its required functions in a wide range of NOSoperational environments and situations when operated and maintained by NOS personnel. Toensure that system is well prepared for the test, a manufacturer recommended field checkoutprocedure (Appendix C) should be followed prior to each deployment. Detailed setup and checkout procedures are also described in Section 8 of the user’s manual [5].

20
3.3 System Issues to Be Verified The unique PORTS® requirements dictate that certain system performance and design issues beevaluated. These include:
A. Measurement accuracya) Current effect - measurements in strong currents where buoy is in a pulled downaltitude,b) Frequency response to long waves - a common concern for this type of buoy.
B. Reliability of mechanical components
a) Rubber fender attachment, hull leakage, fouling and corrosion, and elastic mooring cord.b) Mooring dynamic performance and design variations for different site and environment(such as requirement of sub-surface floatation in deeper water).
C. Reliability of sensing and electrical componentsa) Flash light and sensor assembly.b) Antenna and other data transmission system components.
D. Power supply
a) Performance of solar power system in wave environment.b) Efficiency of battery charging
E. Mooring design and analysisSince the mooring dynamics will affect the Triaxys buoy response characteristics, a capability ofconducting mooring analysis and modify design to adapt to different deployment site is needed.
F. GPS positioning systema) Multi-path problem due to low antenna elevation and wave environment.
3.4 ResponsibilityCO-OPS personnel will be responsible for preparing and approval test plans, conducting and /ormonitoring tests, reviewing test results, and conducting or supporting operational tests.
3.5 Test FacilitiesFacilities that are applicable to the various tests described in above sections include:
A. Environmental chamber test - to test system or component in simulate temperature andhumidity conditions. Available facilities include the NWS’ Sterling laboratory in Sterling,VA.
B. Static tests - to validate Triaxys sensor function under static conditions (see Appendix B).These tests can be easily done with buoy placed on the shipping cradle or similar structure.
C. Pendulum test - to validate sensor function under quasi-dynamic conditions (see Appendix B).Fig. 4 illustrates a simple setup for this test.

21
D. Rotating arm (or swing calibrator) test - to validate wave measurement accuracy undersimulated sinusoidal wave conditions. Fig. 5 illustrates a conceptual setup configuration.Various wave amplitudes (maximum value is limited by the available facility), periods (shortto long in order to check the sensitivity and stability of accelerometers and integrators), anddirections (via orientation of the sensor/telemetry box, limited) can be simulated. Suchequipment are available at NDBC, AXYS (amplitude: 2m, periods: 5-25s), and ScrippsInstitute of Oceanography (to be constructed, amplitude: 6m).
E. Wave basin test - Laboratory wave basins with appropriate water depth (say, 6m andabove) could be used for testes under controlled wave conditions. These include the U.S.naval David Taylor Model Basin (DTMB, 110m long x 73 m wide x 6.1 m deep) atCardercok, MD, deep water wave basin at Texas A&M University at College Station, andwave tank (76m long x 10 m wide x 5.4m deep, with 9 m pit) at CBI Industries, Inc.
3.6 ScheduleThe planed and anticipated events for field testing are shown in Table 4.
Table 4 Planed and anticipated field testing events Deployment/Test Site Reference Instruments Environment PartnershipDuck, NC 12/01-3/02 Waverider, pressure
transducer array,Baylor staff
Depth 8m, mean tide range: 1mAlongshore currents: <30 cm/s
NDVC,USACE
Chesapeake BayBarren Is. (10/9/02-1/9/03)Eastern Neck (1/22-4/22/03)Taylor Is. (4/1-8/31)Bay entrance (?)
ADCP and NDBCbuoy near the Bayentrance
Depth: 6 – 10mMean tide range: 1mMean tidal currents: <50 cm/s
NDBC, U.MD
Puget Sound, WA (?) ADCP Depth: DeepMean tide range: to 3m,Mean tidal currents: 1.5 m/s
TBD
LA/LB Harbor (?) ADCP Depth: 15mMean tide range: 1.2 mean tidalcurrents: < 50 cm/s
TBD
Cape Cod Canal, MA ADCP Depth: TBD

22

23
4. DOCUMENTATION, REVIEW, AND PLANNINGTo achieve the full value of test and evaluation program, the following activities should beperformed.
4.1 Test ReportAt the conclusion of the tests appropriate documents such as a test report and evaluation sheetsshould be completed. Contents should include test results, notes and comments which will behelpful in identifying problem areas and formulate future solutions.
4.2 Review and PlanningTest results will be reviewed by a panel consisting of users (NOS/CO-OPS) and invited advisors(such as NDBC, Triaxys, USACE/FRF, U. of Penn, U.S. Navy, and other users). Corrective andpreventative actions will be developed by the CO-OPS review panel and recommended to themanufacturer and field personnel for implementation.

24

25
ACKNOWLEDGMENTSSeveral of my colleagues contributed to this work: Kristen Tronvig arranged funds for thepurchase of NOS’ first Triaxys buoy; Mark Bushnell acquired the system, Maureen Kenny,Kristen Tronvig, Kate Bosley, Mark Bushnell, and Tom Mero reviewed the manuscript; andBrenda Via and Gina Stoney provided publication support. The writer is also grateful to Dr. C. C. Teng of NDBC and William Birkemeier of the Field Research Facility of the CoastalEngineering Research Center (CERC), U.S. Army Corps of Engineers for useful discussions.
REFERENCES1. Oceans.US Phased Implementation Plan for the US IOOS, Dec. 2002.2. Baer, L. 1981. Operational needs for wave data, p, 14-27, in Measuring Ocean Waves, Proc., Symposium and Workshop on Wave-Measurement Technology, April 22-24, 1981, Washington, D.C., National Academy Press, 249 pp.3. NDBC network (web site: www.ndbc.noaa.gov)4. USACE/SOI network (web site: cdip.ucsd.edu)5. Louisiana State University, Coastal Studies Institute: Wave-Current –Surge Information System (WAVCIS) (web site: wavcis.csi.isu.edu)6. Triaxys™ Directional Wavy Buoy: User’s Manual, V. 08, November 20001, Axys
Environmental Systems, Canada, 102 pp.7. Barstow, S.F., Krogstad, H.E., Torsethsugen, K., and Audunson, T., 1985. “Procedures and
problems associated with the calibration of wave sensors,” Advances in UnderwaterTechnology and Offshore Engineering, Vol. 4 London, Graham and Trotman, 267pp. (Buoy/mooring ling effects).
8. Skey, S. G. P. and Miles M.D., “Advances in buoy technology for wind/wave data collection and analysis.”9. Teng, C.C., 2001. “A field test of buoy dynamics and measurements,” Proc., Waves2001

26

27
APPENDICES
A. Triaxys Factory Check SheetsB. Triaxys Sensor Validation SheetsC. Triaxys Field Checkout/deployment Sheets

28
A. Triaxys factory check sheets

29

30

31
B. Triaxys sensor validation sheets

32

33

34
C. Triaxys field checkout/deployment sheets