tribo-corrosion maps for engineering materials:some new perspectives m.m. stack department of...
TRANSCRIPT

Tribo-corrosion maps for engineering
materials:some new perspectives
M.M. StackDepartment of Mechanical
EngineeringUniversity of Strathclyde
Glasgow G1 1XJ, UK

Looking for directions…

Need a map…..

Download these free Ireland maps and then be sure to check out our Irish Coats of Arms Gallery and our Free Tourist Information
AgricultureTemperature in JanuarySunshineDensityProvinces
Tell a Friend
Bookmark this Page
Link to us
Ireland Maps

http://www.ireland-information.com/irelandmaps.htm

http://worldatlas.com/webimage/countrys/europe/ie.htm
Map of Ireland
Information which a map may provide Landscape.. Most convenient route between
two locations… Metrics…

Aims of presenation Can maps be used to guide materials
engineers in materials processes involving tribological and aqueous corrosion processes….
If so, how can we construct such maps….
How may they be modified based on the nature of tribological contact and corrosive enviroment..
Tribo-corrosion Wear due to the combination of
tribological and corrosion parameters…

Tribological-velocity, load, temperature, particle size, impact angle, yield strength….
Corrosion-pH, electrochemical potential, Cl-…

Wear map of steels for dry sliding
Lim and Ashby, 1987
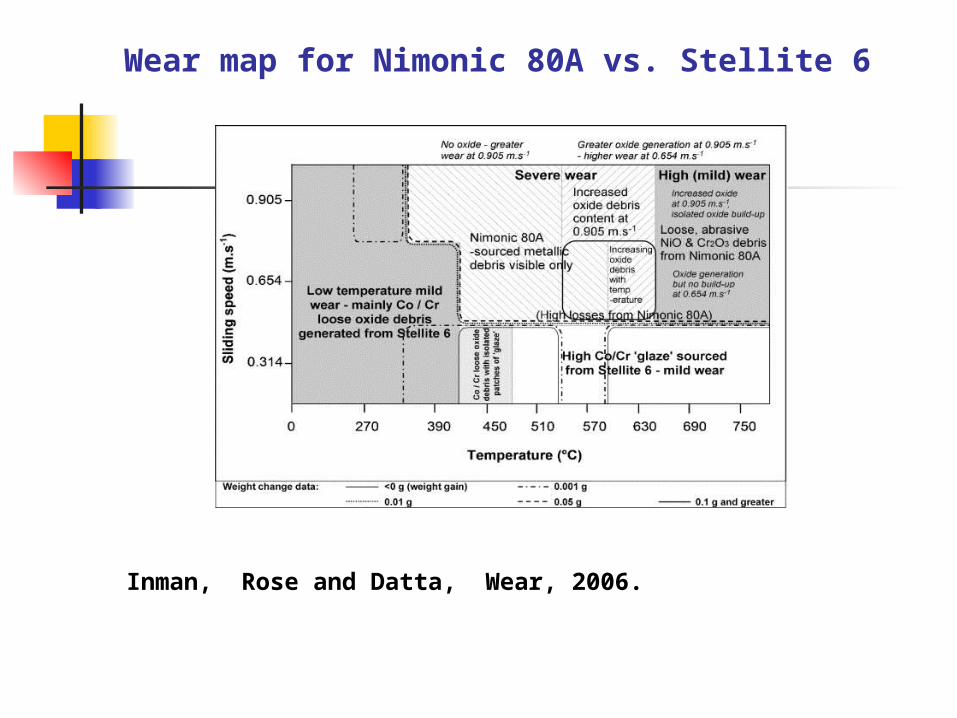
Inman, Rose and Datta, Wear, 2006.
Wear map for Nimonic 80A vs. Stellite 6
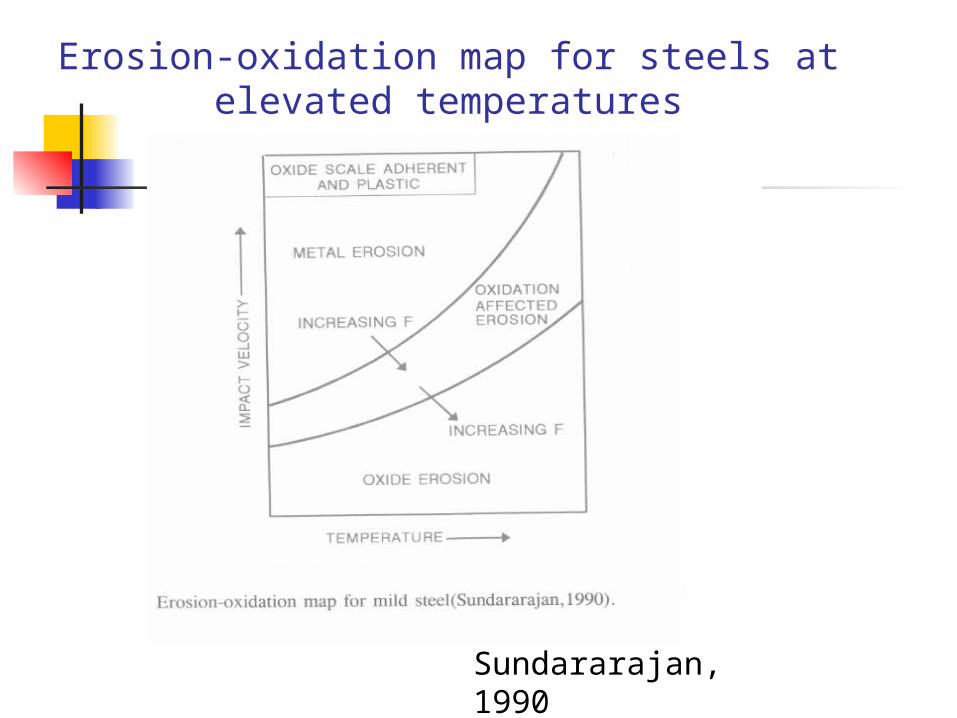
Erosion-oxidation map for steels at elevated temperatures
Sundararajan, 1990

Corrosion map for Fe in H2O assuming passivation by formation of Fe2O3
-1.6
-1.2
-0.8
-0.4
0.0
0.4
0.8
1.2
1.6
-2 0 2 4 6 8 10 12 14 16
pH
E, v
olts
(SH
E)
Immunity
CorrosionH2
Passivation
Corrosion
O2
Pourbaix, 1966

Development of tribo-corrosion map in aqueous conditions
Erosion-oxidation map
Sliding wear map
Aqueous - corrosion map
Tribo-corrosion map
in aqueous conditions
Regime map of Fe for PH 7 based on Sundararajan's Model, no rebound is considered
0.1
1
10
100
-1 -0.8 -0.6 -0.4 -0.2 0 0.2
APPLIED POTENTIAL, V (SCE)
PART
ICLE
VEL
OCI
TY, m
s-1
PURE
ERO
SION
EROSION DOMINATED
EROSION DISSOLUTION
DISSOLUTION DOMINATED
DISSOLUTION EROSION
EROSION DOMINATED
EROSION PASSIVATION
PASSIVATION EROSION
PASSIVATION DOMINATED
Format Why use a wear or a corrosion
map? Some useful applications Development of tribo-corrosion
maps-from erosion to micro-abrasion—corrosion
Erosion-corrosion in aqueous conditions
Jana and Stack, 2004

Example of surface failed by erosion-corrosion
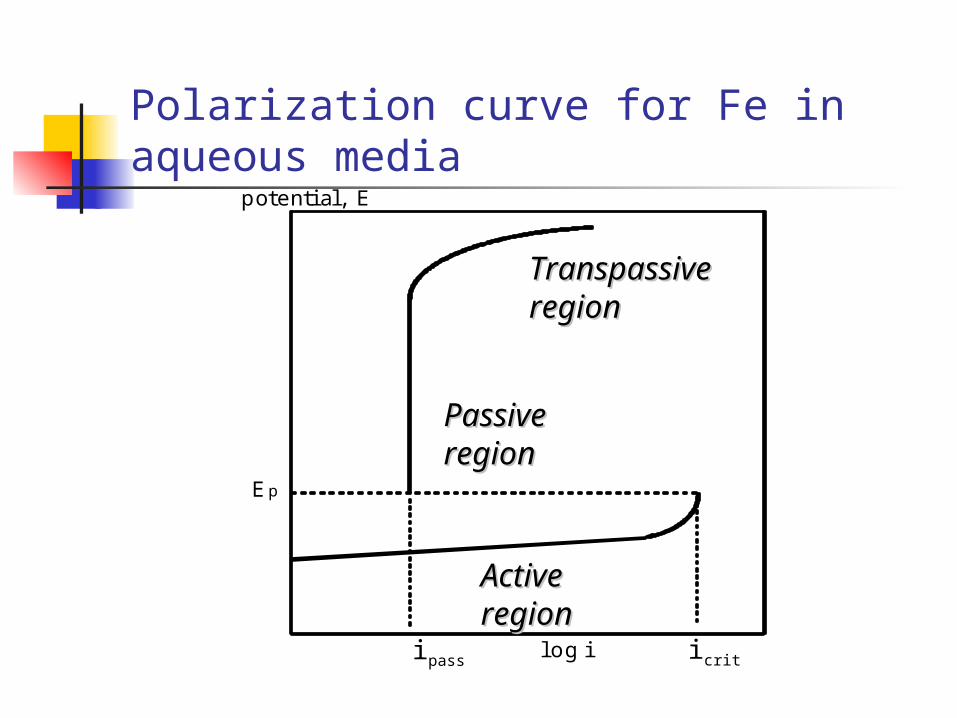
Polarization curve for Fe in aqueous media
ipass icritlo g i
ActiveActiveregionregion
Passive Passive regionregion
Transpassive Transpassive regionregion
E p
p o te n tia l , E

Possible interactions… Erosion can enhance corrosion i.e.
removal of a passive film Corrosion can inhibit erosion through
formation of an adherent ductile film Corrosion can enhance erosion
through dissolution of phases within the material-i.e. as in the case of MMCs

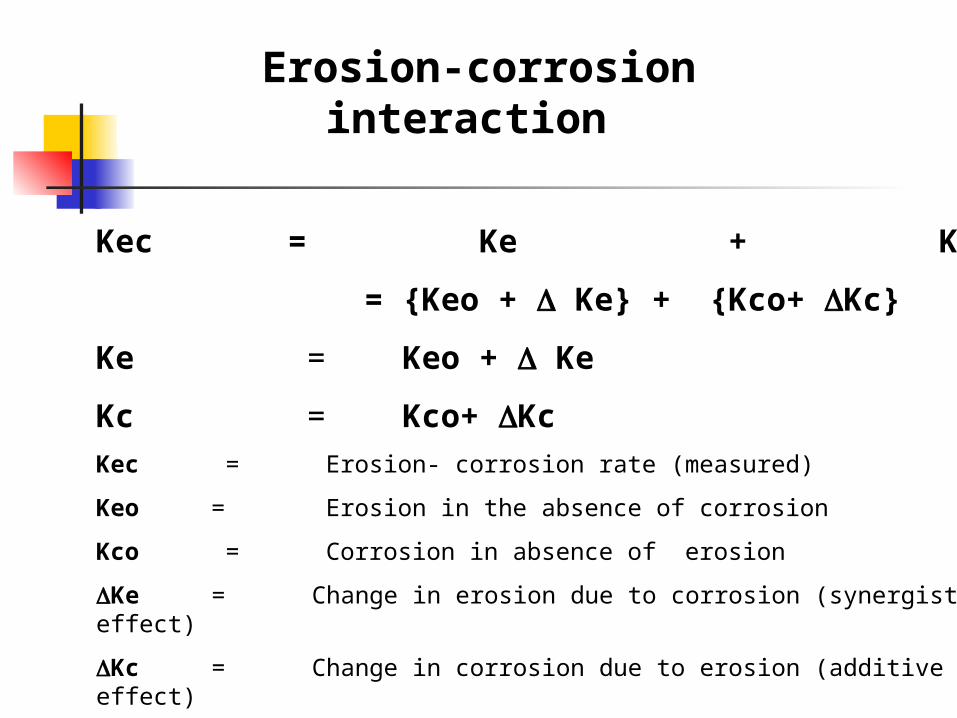
Kec = Ke + Kc
= {Keo + Ke} + {Kco+ Kc}
Ke = Keo + Ke
Kc = Kco+ Kc
Kec = Erosion- corrosion rate (measured)
Keo = Erosion in the absence of corrosion
Kco = Corrosion in absence of erosion
Ke = Change in erosion due to corrosion (synergistic effect)
Kc = Change in corrosion due to erosion (additive effect)
Kc = Total corrosion rate (estimated using Faraday’s law)
Erosion-corrosion interaction

Erosion-corrosion rate
EC C EK K K
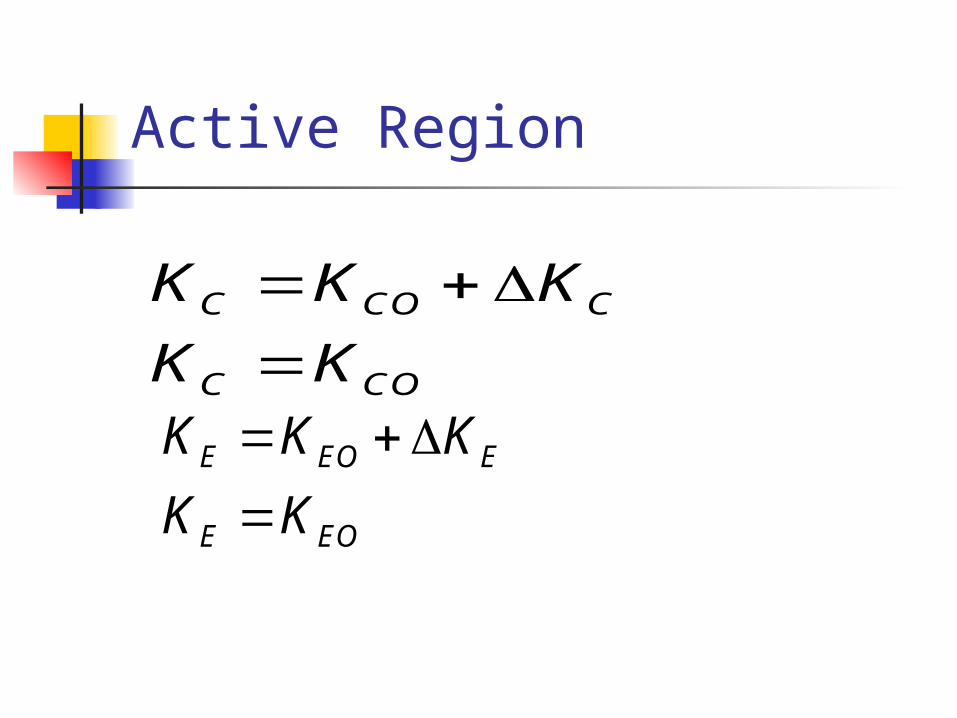
Active Region
C CO C
C CO
K K K
K K
E EO E
E EO
K K K
K K
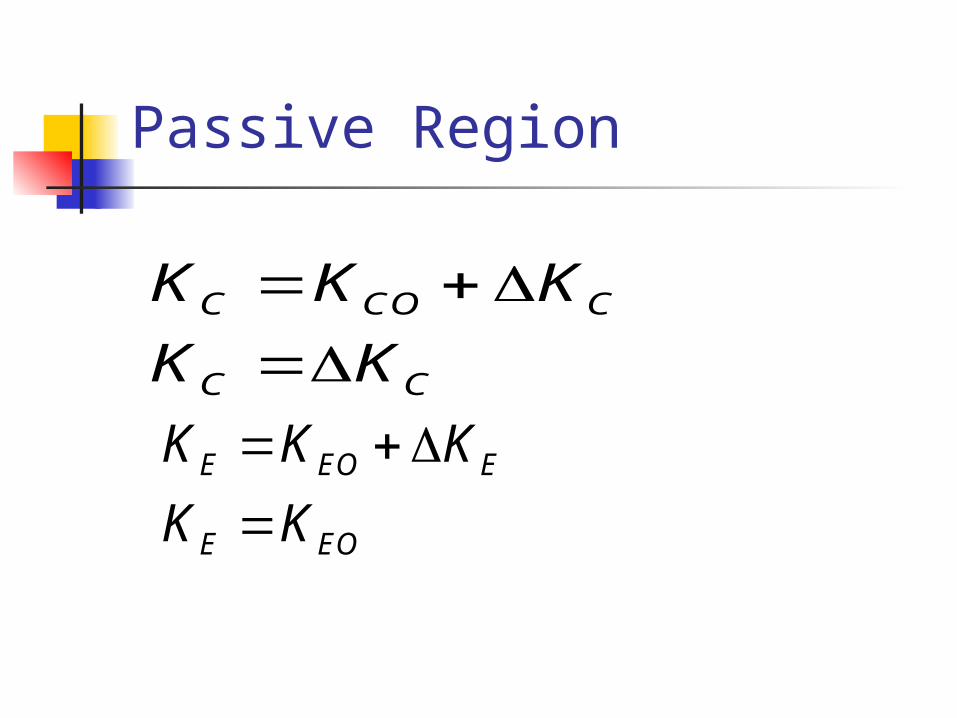
Passive Region
C CO C
C C
K K K
K K
E EO E
E EO
K K K
K K

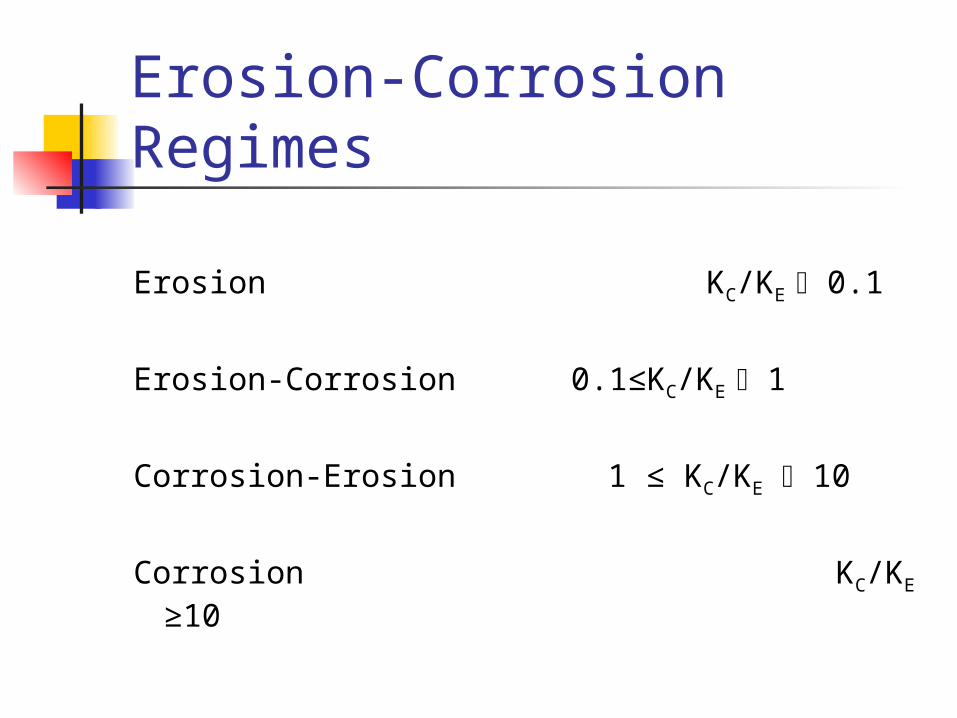
Erosion-Corrosion Regimes
Erosion KC/KE 0.1
Erosion-Corrosion 0.1≤KC/KE 1
Corrosion-Erosion 1 ≤ KC/KE 10
Corrosion KC/KE ≥10
Mechanism of wastage …(landscape)...

Erosion-corrosion map for Fe
Regime map of Fe for PH 7 based on Sundararajan's Model, no rebound is considered
0.1
1
10
100
-1 -0.8 -0.6 -0.4 -0.2 0 0.2
APPLIED POTENTIAL, V (SCE)
PA
RT
ICL
E V
EL
OC
ITY
, m s-1
PU
RE
ER
OS
ION
EROSION DOMINATED
EROSION DISSOLUTION
DISSOLUTION DOMINATED
DISSOLUTION EROSION
EROSION DOMINATED
EROSION PASSIVATION
PASSIVATION EROSION
PASSIVATION DOMINATED

Fe at pH 7
Regime map of Fe for PH 7 based on Sundararajan's Model, no rebound is considered
0.1
1
10
100
-1 -0.8 -0.6 -0.4 -0.2 0 0.2
APPLIED POTENTIAL, V (SCE)
PAR
TIC
LE
VE
LO
CIT
Y, m
s-1
PUR
E ER
OSI
ON
EROSION DOMINATED
EROSION DISSOLUTION
DISSOLUTION DOMINATED
DISSOLUTION EROSION
EROSION DOMINATED
EROSION PASSIVATION
PASSIVATION EROSION
PASSIVATION DOMINATED
Pourbaix diagram for Fe (SHE)
Erosion-corrosion map for Fe (SCE)

Ni at pH 7
Pourbaix Diagram for Ni (SHE)
Erosion-corrosion map for Ni (SCE)
Regime map of Ni for PH 7 based on sundararajan's model, no rebound is considered
0.1
1
10
100
-1 -0.8 -0.6 -0.4 -0.2 0 0.2
APPLIED POTENTIAL, V (SCE)
PA
RT
ICL
E V
EL
OC
ITY
, m s-1
PUR
E E
RO
SIO
N
EROSION DOMINATED
EROSION DISSOLUTION
DISSOLUTION DOMINATED
DISSOLUTION EROSION
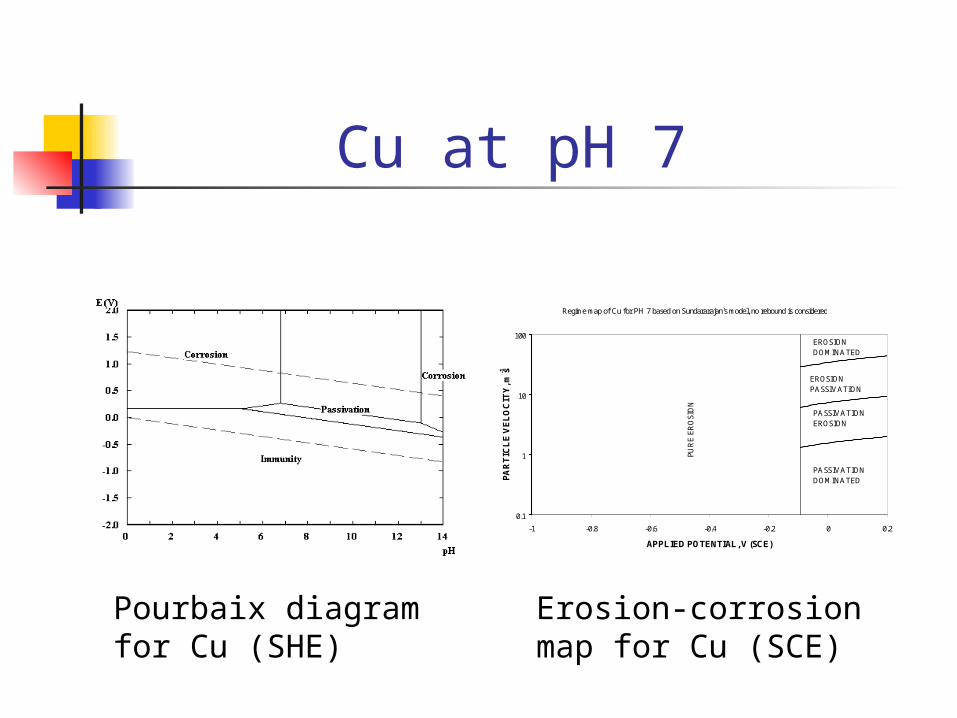
Cu at pH 7
Regime map of Cu for PH 7 based on Sundararajan's model, no rebound is considered
0.1
1
10
100
-1 -0.8 -0.6 -0.4 -0.2 0 0.2
APPLIED POTENTIAL, V (SCE)
PA
RT
ICL
E V
EL
OC
ITY
, m s-1
PUR
E E
RO
SIO
N
EROSION DOMINATED
EROSION PASSIVATION
PASSIVATION EROSION
PASSIVATION DOMINATED
Pourbaix diagram for Cu (SHE)
Erosion-corrosion map for Cu (SCE)

Al at pH 7
Regime map of Al for pH 7 based on Sundararajan's model, no rebound is considered
0.10
1.00
10.00
100.00
-1 -0.8 -0.6 -0.4 -0.2 0 0.2
APPLIED POTENTIAL, V (SCE)
PA
RT
ICL
E V
EL
OC
ITY
, m s
-1
PASSIVATION DOMINATED
PASSIVATION EROSION
EROSION PASSIVATIONEROSION DOMINATED
Pourbaix diagram for Al (SHE)
Erosion-corrosion map for Al (SCE)

Comparison between erosion-corrosion regime maps at pH 5
FeNi
Cu Al
0.1
1
10
100
-1 -0.8 -0.6 -0.4 -0.2 0 0.2
APPLIED PO TENTIAL, V (SCE)
PA
RT
IC
LE
VE
LO
CIT
Y,
m s
-1
EROSION DOMINATED
EROSION DOMINATED
EROSION P ASSIVATION
P ASSIVATION EROSION
EROSION DOMINATED
PU
RE
ER
OS
IO
N
EROSION- DISSOLUTION
DISSOLUTION- EROSION
DISSOLUTION DOMINATED
0.1
1
10
100
-1 -0.8 -0.6 -0.4 -0.2 0 0.2
APPLIED POTENTIAL, V (SCE)
PA
RT
ICL
E V
EL
OC
ITY
, m s
-1
PU
RE
ER
OS
ION
EROSION DOMINATED
EROSION DISSOLUTION
DISSOLUTION DOMINATED
DISSOLUTION EROSION
0.1
1
10
100
-1 -0.8 -0.6 -0.4 -0.2 0 0.2
APPLIED POTENTIAL, V (SCE)
PA
RT
ICL
E V
EL
OC
ITY
, m s
-1
PU
RE
ER
OS
ION
EROSION DOMIONATED
EROSION PASSIVATION
PASSIVATION EROSION
PASSIVATION DOMINATED
0.1
1
10
100
-1 -0.8 -0.6 -0.4 -0.2 0 0.2
APPLIED POTENTIAL, V (SCE)
PA
RT
ICL
E V
EL
OC
ITY
, m s
-1
PASSIVATION DOMINATED
PASSIVATION EROSION
EROSION PASSIVATIONEROSION DOMINATED

Wastage rate …(metrics)...

Comparison between erosion-corrosion wastage
maps at pH 5
Fe
Cu
0
0.5
1
1.5
2
2.5
-1 -0.9 -0.8 -0.7 -0.6 -0.5 -0.4 -0.3 -0.2 -0.1 0 0.1 0.2
APPLIED POTENTIAL, V (SCE)
PAR
TIC
LE
VE
LO
CIT
Y, m
s-1
HIGH
MEDIUM
LOW
LOW
MEDIUM
0
0.5
1
1.5
2
2.5
-1 -0.9 -0.8 -0.7 -0.6 -0.5 -0.4 -0.3 -0.2 -0.1 0 0.1 0.2
APPLIED POTENTIAL, V (SCE)
PAR
TIC
LE V
ELO
CIT
Y, m
s-1
HIGHMEDIUM
LOW
0
0.5
1
1.5
2
2.5
-1 -0.9 -0.8 -0.7 -0.6 -0.5 -0.4 -0.3 -0.2 -0.1 0 0.1 0.2
APPLIED POTENTIAL, V (SCE)
PAR
TIC
LE
VE
LO
CIT
Y, m
s-1
HIGH
LOW MEDIUM
Ni
Al
0
0.5
1
1.5
2
2.5
-1 -0.9 -0.8 -0.7 -0.6 -0.5 -0.4 -0.3 -0.2 -0.1 0 0.1 0.2
APPLIED POTENTIAL, V (SCE)
PAR
TIC
LE V
ELO
CIT
Y, m
s-1
HIGH
MEDIUMLOW

Materials selection …(decision on most convenient route...
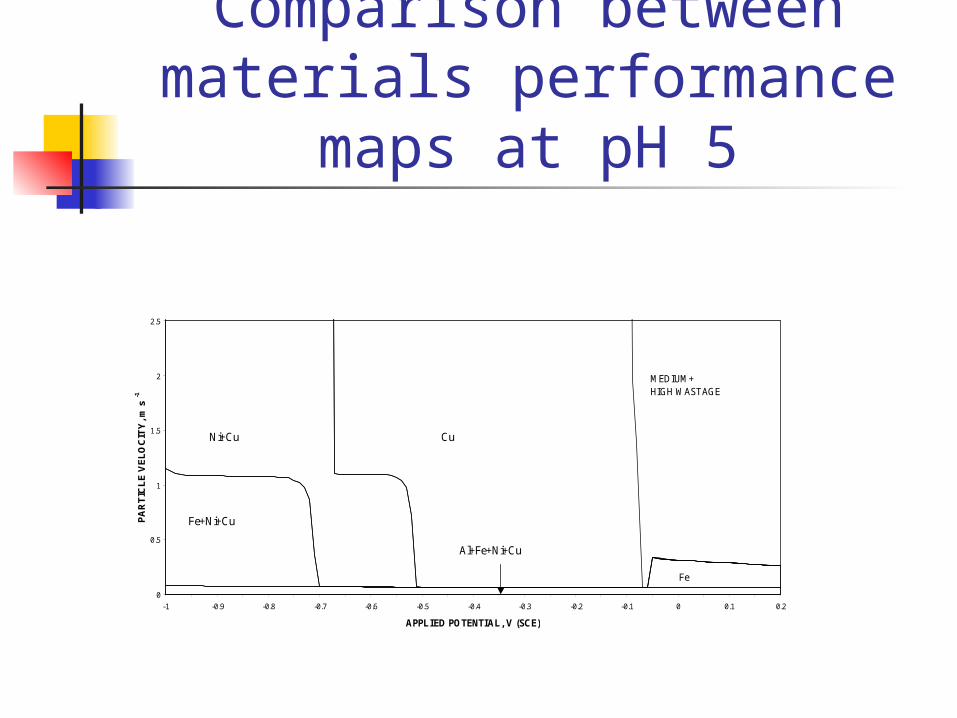
Comparison between materials performance
maps at pH 5
0
0.5
1
1.5
2
2.5
-1 -0.9 -0.8 -0.7 -0.6 -0.5 -0.4 -0.3 -0.2 -0.1 0 0.1 0.2
APPLIED POTENTIAL, V (SCE)
PA
RT
ICL
E V
EL
OC
ITY
, m s
-1
Fe+Ni+Cu
Ni+Cu Cu
Al+Fe+Ni+Cu
Fe
MEDIUM+HIGH WASTAGE

Comparison between materials performance
maps at pH 9
0
0.5
1
1.5
2
2.5
-1 -0.9 -0.8 -0.7 -0.6 -0.5 -0.4 -0.3 -0.2 -0.1 0 0.1 0.2
APPLIED POTENTIAL, V (SCE)
PA
RT
ICL
E V
EL
OC
ITY
, m s
-1
Fe+Ni+Cu
Ni+Cu Cu
Al+Fe+Ni+Cu
MEDIUM+HIGH WASTAGE
Erosion-corrosion of MMC Based materials
Abd-El-Badia and Stack, 2006-2007
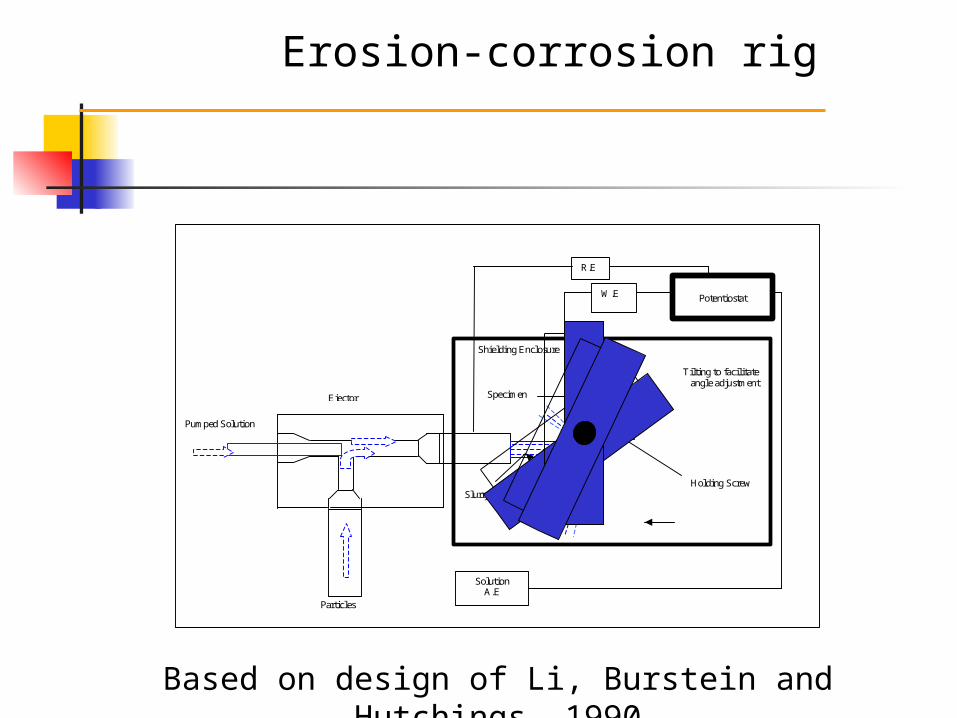
Particles
Pumped Solution
Solution A.E
R.E
Shielding Enclosure Tilting to facilitate
angle adjustment Specimen
Holding Screw
Slurry
Specimen holder
Ejector
Potentiostat W.E
Erosion-corrosion rig
Based on design of Li, Burstein and Hutchings, 1990
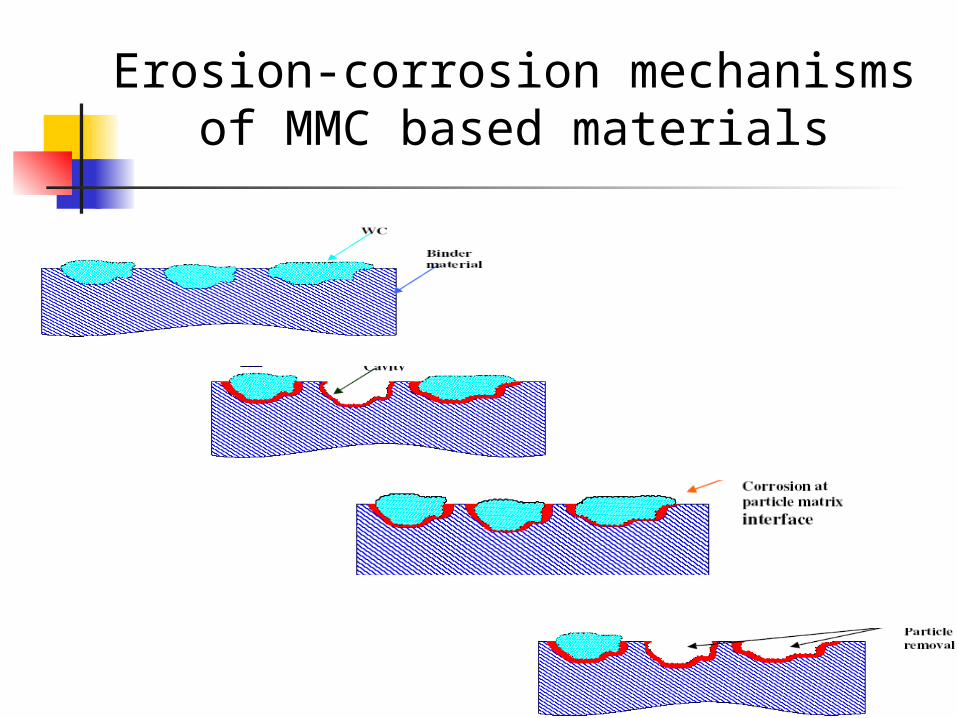
Erosion-corrosion mechanisms of MMC based materials
Kec = Ke + Kc
= {Keo + Ke} + {Kco+ Kc}
Ke = Keo + Ke
Kc = Kco+ Kc
Kec = Erosion- corrosion rate (measured)
Keo = Erosion in the absence of corrosion
Kco = Corrosion in absence of erosion
Ke = Change in erosion due to corrosion (synergistic effect)
Kc = Change in corrosion due to erosion (additive effect)
Kc = Total corrosion rate (estimated using Faraday’s law)
Erosion-corrosion interaction
Erosion-Corrosion Regimes
Erosion KC/KE 0.1
Erosion-Corrosion 0.1≤KC/KE 1
Corrosion-Erosion 1 ≤ KC/KE 10
Corrosion KC/KE ≥10

Erosion-Corrosion Regimes
KC/ KE 0.1 Synergistic
0.1 KC/ KE ≤ 1 Additive- Synergistic
KC/ KE > 1 Additive

Erosion-corrosion mechanism maps
WC/Co-Cr coating
2 ms2 ms-1 impact velocity impact velocity 4 ms4 ms-1 impact velocity impact velocity
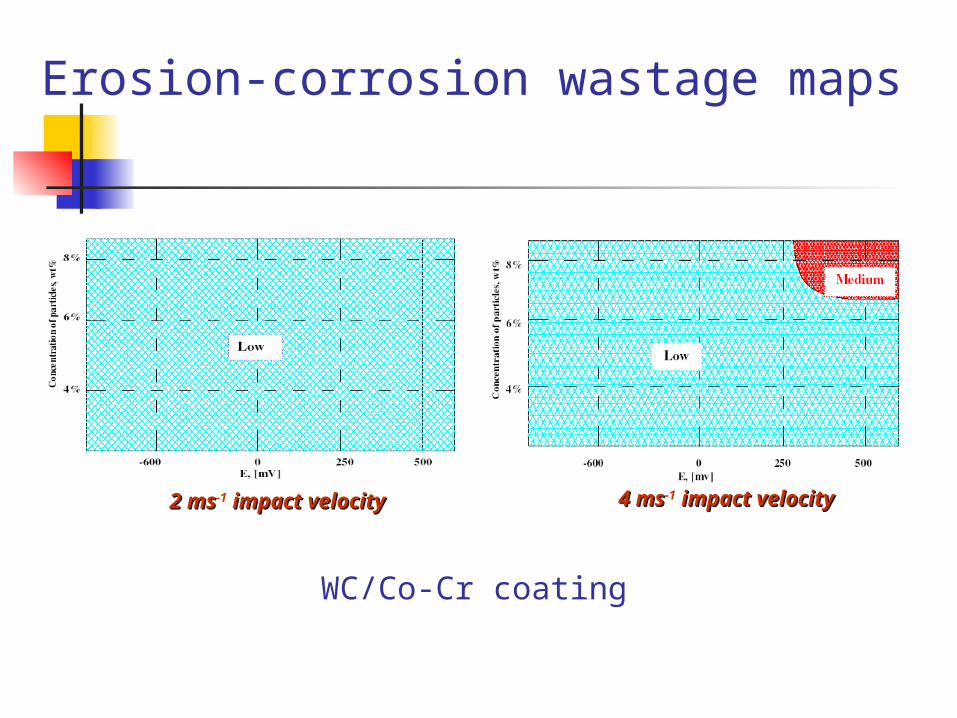
Erosion-corrosion wastage maps
WC/Co-Cr coating
2 ms2 ms-1 impact velocity impact velocity 4 ms4 ms-1 impact velocity impact velocity

Erosion-corrosion additive/synergistic effect maps
WC/Co-Cr coating
2 ms2 ms-1 impact velocity impact velocity 4 ms4 ms-1 impact velocity impact velocity

2 ms2 ms-1 impact velocity impact velocity 4 ms4 ms-1 impact velocity impact velocity
Erosion-corrosion Materials Performance maps

Erosion-corrosion of cermets
Stack, Antonov and Hussainova, 2006

SEM micrograph of surface of Ni-CR3C2 cermet with 40% wt. Ni. Potential - +500mV. Duration of test – 1
hour.
Erosion-corrosion maps for cermets
Stack, Antonov and Hussainova, 2006

Erosion-corrosion map showing the transition between different wastage regimes for a Cr3C2-
Ni cermet
6 % 8%
10%

Erosion-corrosion map showing the transition between different additive regimes for a Cr3C2-Ni cermet
6 % 8 %
10 %

Erosion-corrosion of PVD coatings
Purandare and Stack, 2004

Erosion-corrosion of PVD coatings
3 um

Surface of coating with macro defects
Exposure at +400mV and 90°
Surface after erosion-corrosion at +400 mV and 60°,
3 um
Micrographs of eroded coatings

10
20
30
40
50
60
70
80
90
-1500 -1000 -500 0 500
Imp
ac
t a
ng
le (d
eg
) Erosion only
Erosion-passivation Erosion-dissolution
Dissolution -erosion
Passivation -erosion
E (mV)
Mechanism map for CrN/NbN coating
Impact angle (deg)
20 30 45 60 90 -1000 mV
-400 mV
+400 mV
E (
mV
)
Wastage Map for CrN/NbN coating
HIGH
MEDIUM
LOW
Erosion-corrosion mechanisms maps for coated and uncoated materials
Micro-abrasion-corrosion
Mathew and Stack, 2005
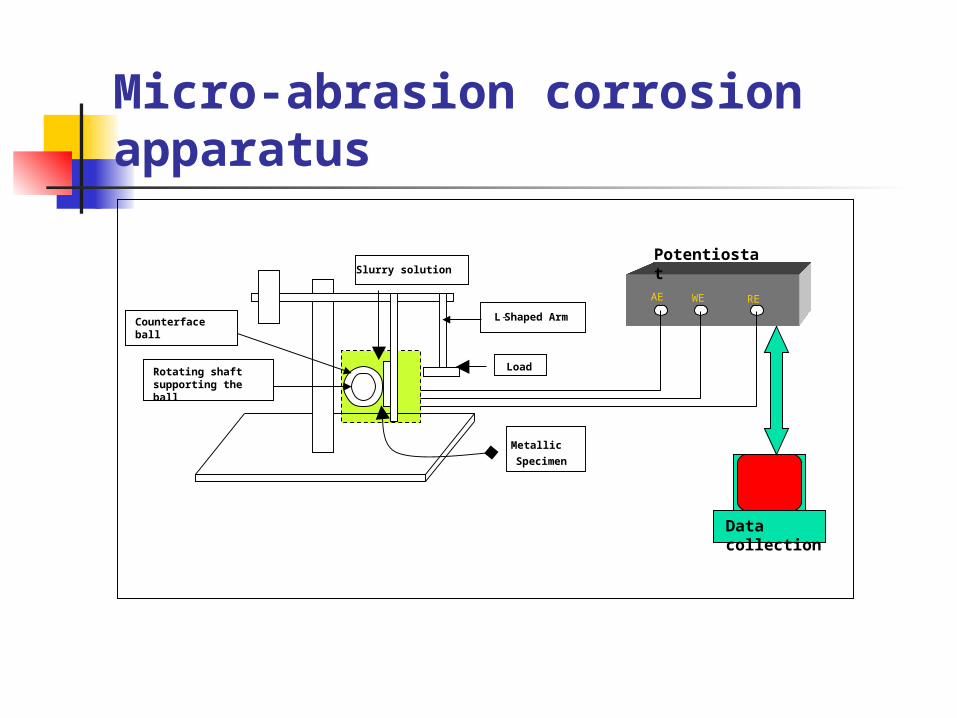
Micro-abrasion corrosion apparatus
Load
Metallic
Specimen
Slurry solution
L -Shaped Arm
Rotating shaft supporting the ball
WE REAE
Potentiostat
Data collection
Counterface ball
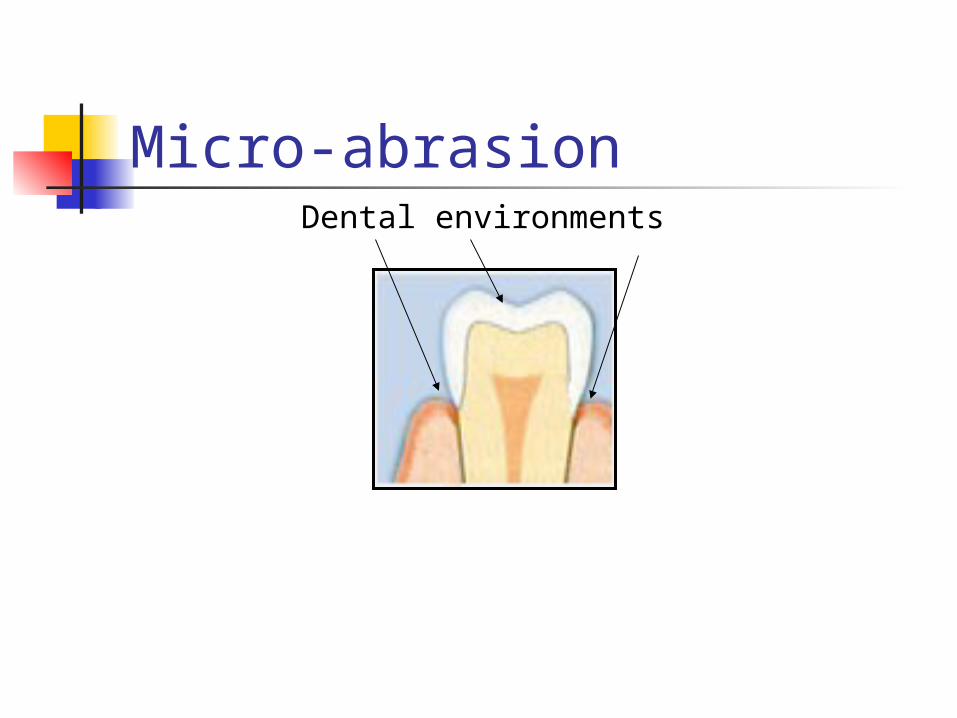
Micro-abrasionDental environments

Micro-abrasionArtificial hip joints
Micro-abrasion process
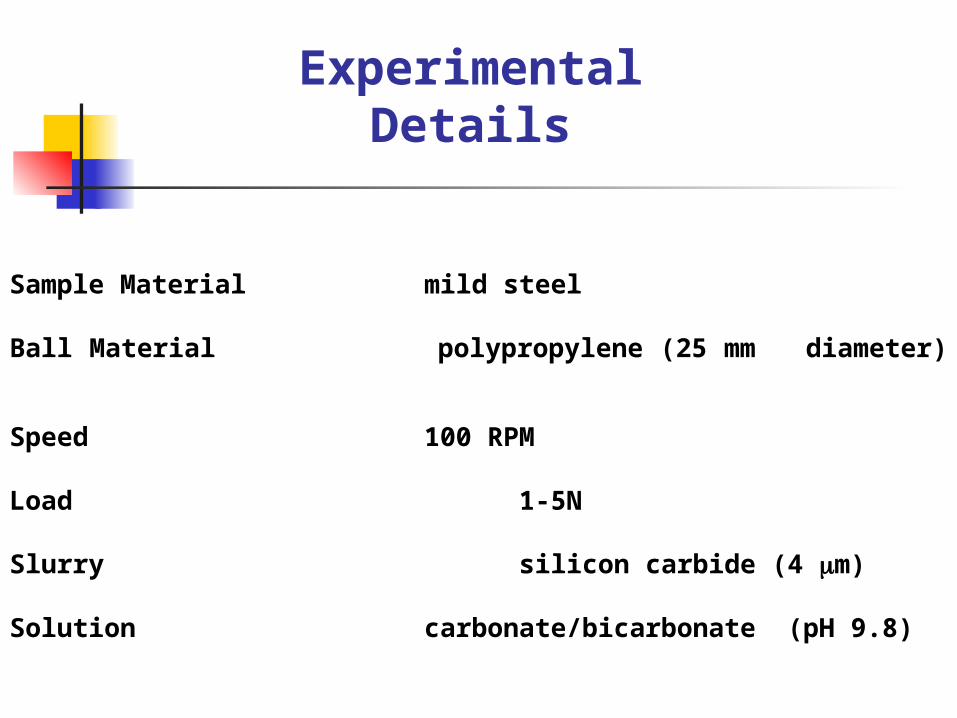
Sample Material mild steel
Ball Material polypropylene (25 mm diameter)
Speed 100 RPM
Load 1-5N
Slurry silicon carbide (4 m)
Solution carbonate/bicarbonate (pH 9.8)
Experimental Details

-1000
-500
0
500
10-3
10-2
10-1
100
Current (mA/cm²)
Po
tentia
l (mV
)
Data Graph
1N
2N
3N
4N
5N
Polarization curves in carbonate/bicarbonate solution-no particles

-1500
-1000
-500
0
500
10-3
10-2
10-1
100
Current (mA/cm²)
Po
tentia
l (mV
)
Data Graph
1N
2N
3N4N
5N
Polarization curves in carbonate/ bicarbonate slurry

Variation of Kac, Ka and Kc with increasing load
At -0.60 V:
At -0.40 V:
0
0.1
0.2
0.3
0.4
0.5
0.6
0.7
0 1 2 3 4 5 6
Load (N)
We
igh
t lo
ss (
g x
10
-3 )
Kac
Kc
Ka
0
0.1
0.2
0.3
0.4
0.5
0.6
0.7
0.8
0 1 2 3 4 5 6
Load (N)
We
igh
t lo
ss (
g x
10
-3 )
Kac
Kc
Ka

Variation of Kac, Kc and Ka with increasing load
At 0 V
At -0.20 V
0
0.05
0.10.15
0.2
0.25
0.30.35
0.4
0.45
0 1 2 3 4 5 6
Load (N)
We
igh
t lo
ss (
g x
10
-3 )
Kac
Kc
Ka
0
0.2
0.4
0.6
0.8
1
1.2
0 1 2 3 4 5 6
Load (N)
Wie
gh
t lo
ss (
g x
10-3 )
Kac
Kc
Ka

Variation of Kac, Kc and Ka with increasing load
At +0.20 V
0
0.05
0.1
0.15
0.2
0.25
0.3
0.35
0.4
0.45
0 1 2 3 4 5 6
Load (N)
We
igh
t lo
ss (
g x
10-3
)Kac
Kc
Ka

At 1N and –0.2 V
SEM images of wear scar on mild steel
At 4N and –0.2 V
At 5N and –0.2 V
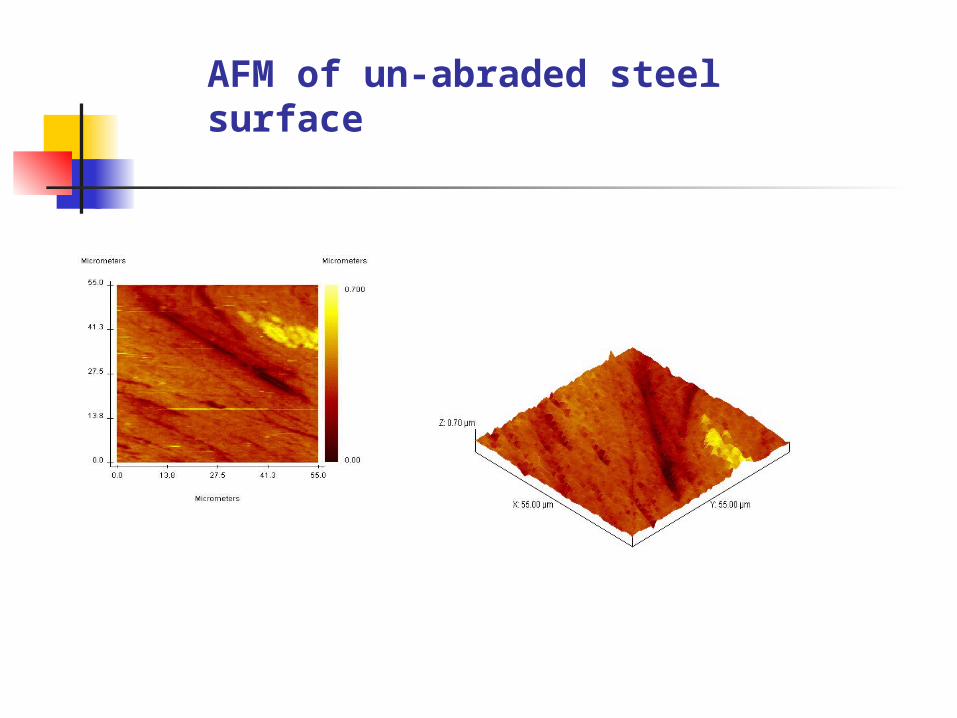
AFM of un-abraded steel surface
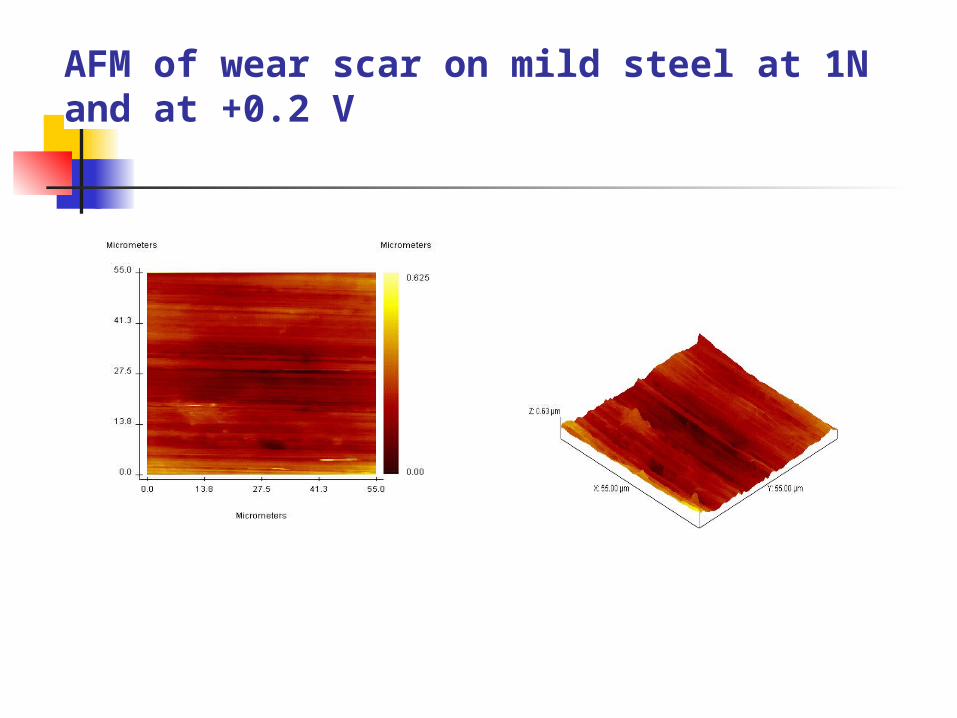
AFM of wear scar on mild steel at 1N and at +0.2 V

Micro-abrasion mechanisms
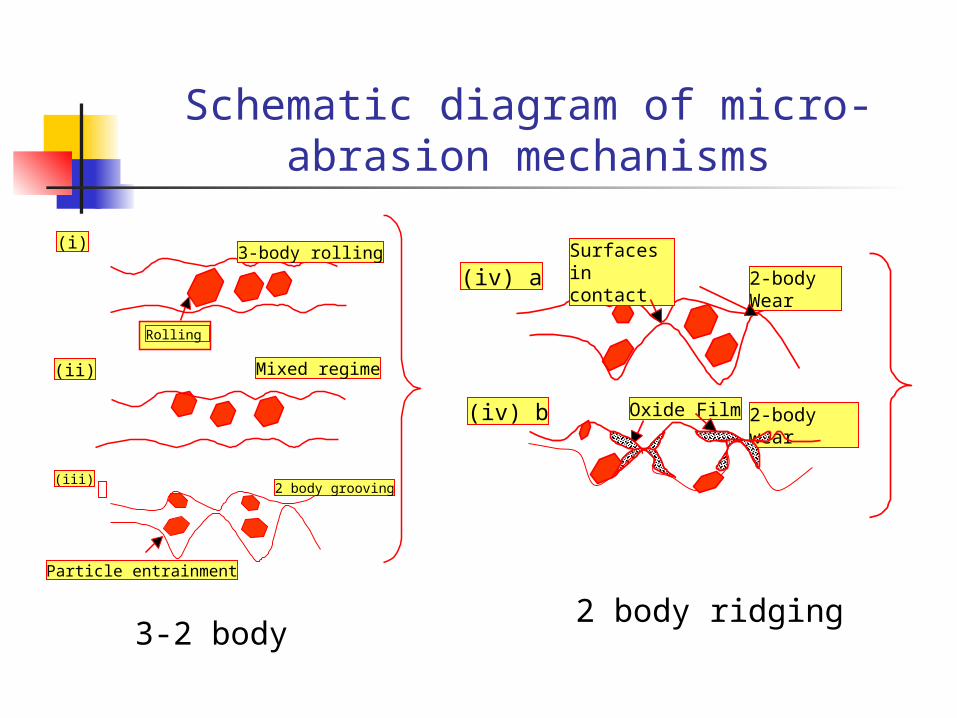
Schematic diagram of micro-abrasion mechanisms
(ii) Mixed regime
(iii) 2 body grooving
Particle entrainment
(i)3-body rolling
Rolling
3-2 body
(iv) a
(iv) b Oxide Film
2-body Wear
2-body wear
Surfaces in contact
2 body ridging

Transitions between regimes for the micro-abrasion process
Applied Load
Wea
r V
olum
e3-2 Body3-2 Body 2 Body
ridging
Results from current study

Wear-mode map for the micro-abrasion process (Adachi and Hutchings, 2003)
Hardness ratio Hs/Hb
1
10-3
0.01 0.1 1 10
Severity contact S ( =W/AvH’)
10-1
100
10-2
Micro-scale abrasion testThree-body
Mixed
Two-body
Three-body abrasion
Two-body abrasion
S’ =(Hs/Hb) =0.0076, = -0.49
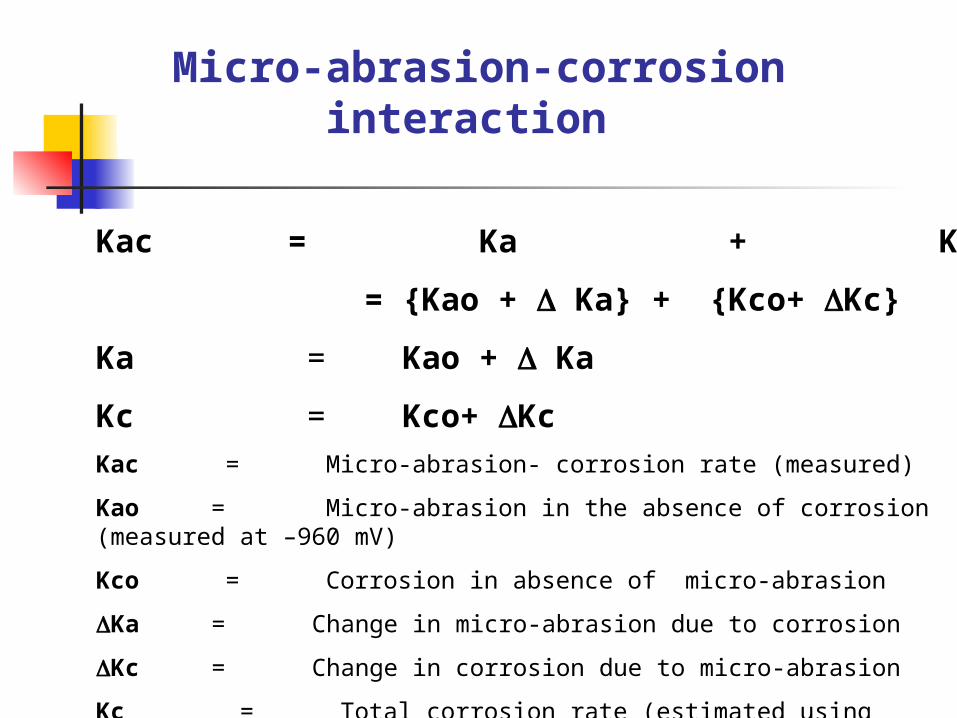
Kac = Ka + Kc
= {Kao + Ka} + {Kco+ Kc}
Ka = Kao + Ka
Kc = Kco+ Kc
Kac = Micro-abrasion- corrosion rate (measured)
Kao = Micro-abrasion in the absence of corrosion (measured at –960 mV)
Kco = Corrosion in absence of micro-abrasion
Ka = Change in micro-abrasion due to corrosion
Kc = Change in corrosion due to micro-abrasion
Kc = Total corrosion rate (estimated using Faraday’s law)
Micro-abrasion-corrosion interaction

Micro-abrasion-corrosion regimes
Corrosion Kc/Ka > 10Corrosion-micro-abrasion 10> Kc/Ka > 1 Micro-abrasion-corrosion 1> Kc/Ka > 0.1Micro-abrasion Kc/Ka < 0.1
Corrosion? Active or passive conditions from polarization behaviour and Pourbaix diagrams
Micro-abrasion? 3 or 2 body behaviour identified using theoretical models

Micro- abrasion-corrosion mechanism map for mild steel/polypropylene couple
1
2
3
4
5
- 0.6 - 0.5 - 0.4 -0.3 -0.2 -0.1 0 0.1 0.2
Potential (V)
Load (N)
2- body- Active dissolution
2-body- Passivation
Passivation – 2 body
Active dissolution- 2 body
2-body -Active/Passive
Active / Passive 2 body
Passivation
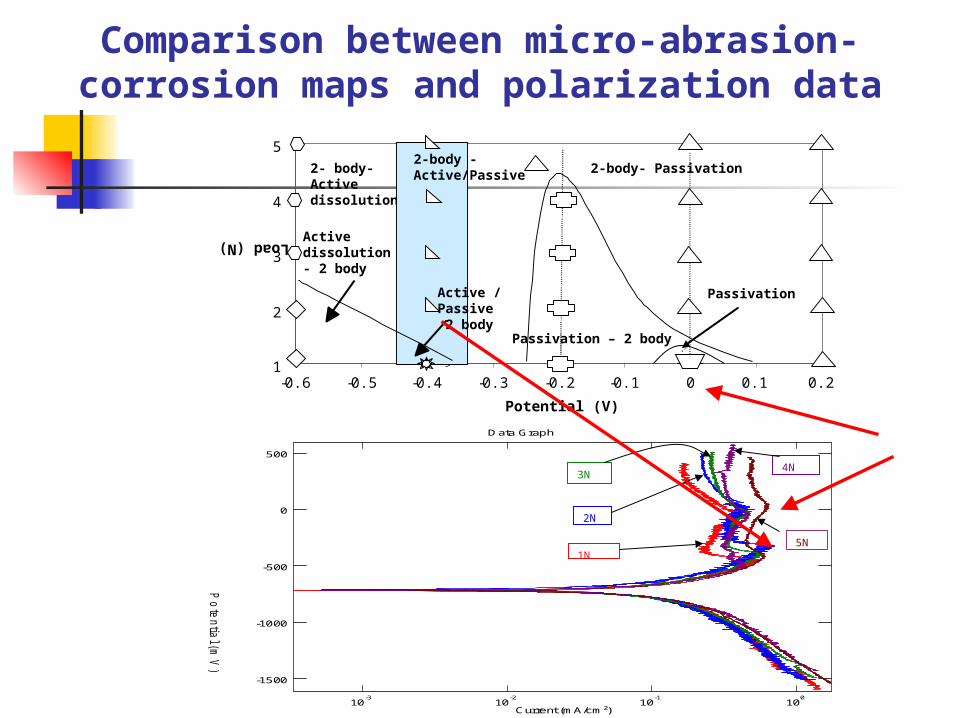
Comparison between micro-abrasion-corrosion maps and polarization data
1
2
3
4
5
-0.6 -0.5 -0.4 -0.3 -0.2 -0.1 0 0.1 0.2
Potential (V)
Load (N)
2- body- Active dissolution
2-body- Passivation
Passivation – 2 body
Active dissolution- 2 body
2-body -Active/Passive
Active / Passive 2 body
Passivation
-1500
-1000
-500
0
500
10-3
10-2
10-1
100
Current (mA/cm²)
Po
tentia
l (mV
)
Data Graph
1N
2N
3N4N
5N

1
2
-0.6 -0.5 -0.4 -0.3 -0.2 -0.1 0 0.1 0.2
Potential (V)
Medium
High
3
4
5
Load (N)
High
Micro-abrasion corrosion wastage map for mild steel/polypropylene couple
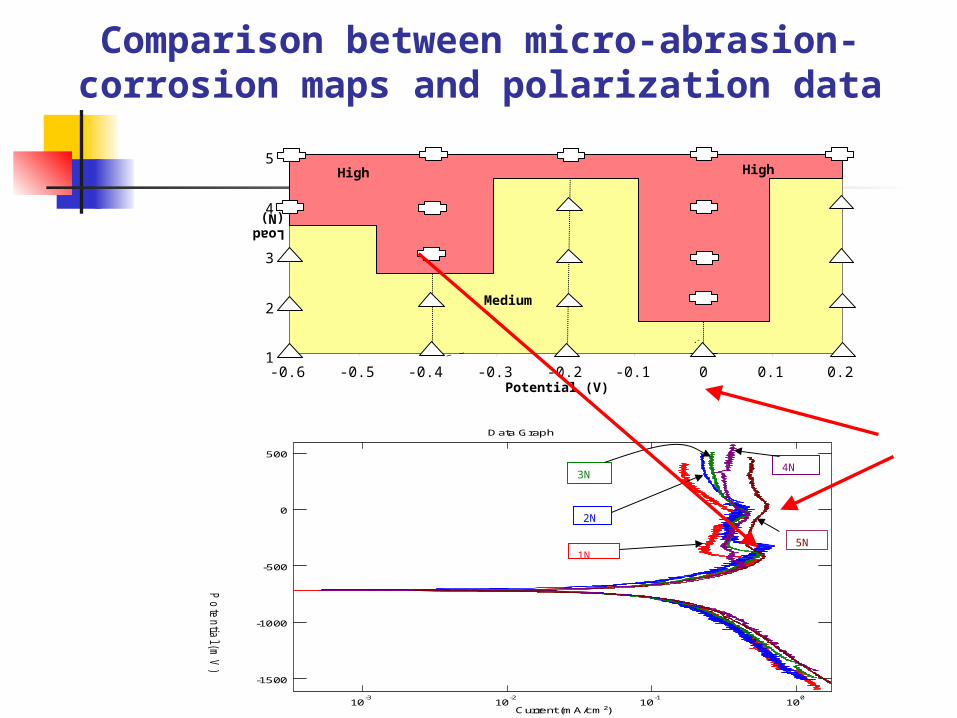
Comparison between micro-abrasion-corrosion maps and polarization data
-1500
-1000
-500
0
500
10-3
10-2
10-1
100
Current (mA/cm²)
Po
tentia
l (mV
)
Data Graph
1N
2N
3N4N
5N
1
2
-0.6 -0.5 -0.4 -0.3 -0.2 -0.1 0 0.1 0.2Potential (V)
Medium
High
3
4
5
Load (N)
High

Comparison between micro-abrasion-corrosion maps
1
2
3
4
5
-0.6 -0.5 -0.4 -0.3 -0.2 -0.1 0 0.1 0.2
Potential (V)
Load (N)
2- body- Active dissolution
2-body- Passivation
Passivation – 2 body
Active dissolution- 2 body
2-body -Active/Passive
Active / Passive 2 body
Passivation
1
2
-0.6 -0.5 -0.4 -0.3 -0.2 -0.1 0 0.1 0.2Potential (V)
Medium
High
3
4
5
Load (N)
High
Discussion Tribo-corrosion maps are a powerful tool
for identifying materials degradation mechanisms
Much work needs to be carried out on the theoretical development of the maps
These maps have the potential to be the future mainstream engineering tools for addressing materials issues in such environments

T.S.N. Sankara Narayanan, Y W. Park and K. Y. Lee Wear, 262,228-233 2007.
Fretting-Corrosion maps

Conclusions Progress has been made in recent years on
the development of tribo-corrosion maps Maps for particulate erosion, sliding wear
and micro-abrasion have been proposed in corrosive environments
Such techniques have potential applications to a wide range of materials issues exposed to tribological and corrosive environments.

Acknowledgements PhD students :T. Abd-El-Badia, M.
Antonov, B.D. Jana, M. Mathew, Y Purandare
Collaborators: P Hovespean, W. Huang, J Jiaren, I Hussaionova