tribology in industry analysis and optimization of turned
TRANSCRIPT
23
Vol. 41, No. 1 (2019) 23-32, DOI: 10.24874/ti.2019.41.01.03
Tribology in Industry
www.tribology.rs
Analysis and Optimization of Turned Surfaces of AISI 1060 using ANOVA and Regression
M.A. Chowdhury a, U.K. Debnath
a, Md. Kamruzzaman a, D.M. Nuruzzaman
b, Md. Shahin Mia a
a
Department of Mechanical Engineering, Dhaka University of Engineering and Technology, Gazipur-1700, Bangladesh, b University Malaysia Pahang, Malaysia.
Keywords:
Surface engineering Cutting tool Turning Roughness Tool life ANOVA Robust design
A B S T R A C T
AISI 1060 carbon steel for turning process is used to find out best cutting parameters using Analysis of Variance (ANOVA) and Regression Concept. Optimization of cutting parameters in turning operation is analyzed in this study. Cutting speed and force affects remarkably on the roughness on the surfaces of the test sample at all cutting operations. The reasonable surface roughness was obtained at a low feed rate in the combination of high cutting speed. Tool vibration was increased with the depth of cut and feed rate. In this study surface roughness was obtained which mostly dependent on the cutting speed, that contribution was 59.74 % and feed rate contribution was found as 13.75 %. The A multilinear regression model was developed to correlate the different cutting parameters.
© 2019 Published by Faculty of Engineering
Corresponding author:
Mohammad Asaduzzaman Chowdhury Department of Mechanical Engineering Dhaka University of Engineering and Technology, Gazipur-1700, Bangladesh. Email: [email protected]
1. INTRODUCTION Surface roughness is one of the noticeable process parameter for ensuring the quality of surfaces at the desired level during turning operation [1-5]. In this study, AISI 1060 carbon steel was selected as work piece material for its wide range of applications in industry. The robust design is applied to analyze the optimum level of surface finishing. Experimental work included the turning operation which is performed by a used 16K20 lathe, USSR. In robust design, the input parameters were considered as cutting speed, feed rate, and depth of cut whereas the output parameter was taken as surface roughness. The extensive literature [6-14] has been available to characterize
the nature of cutting process of different materials but no clear correlations have yet to be found between the surface roughness and cutting parameters [15-17]. This paper represents the multi-objective optimization of cutting parameters in turning operation. Experiments are designed and executed based on Robust Design’s L-27 and orthogonal array design [13,18-21]. This paper discusses the use of robust design parameter design to minimize the surface roughness (µm). Turning is the process in which a single point cutting tool removes material from the periphery of the rotating surface of the cylindrical work piece. The cutting tool was moved parallel and perpendicular to the axis of rotating work piece parallel movement of the cutting tool is called feed
RE
SEA
RC
H

M.A. Chowdhury et al., Tribology in Industry Vol. 41, No. 1 (2019) 23-32
24
rate (F) and perpendicular movement of the cutting tool is called depth of cut (DOC). The to and fro motion of the cutting tool is called cutting speed (M/Min). These are collectively called cutting parameters. The turning operations would finish utilizing a cutting tool, the turning operations, powers and temperature throughout machining make a barbarous nature's domain for those cutting tool. Therefore, tool life is important to evaluate cutting performance. Turning operation was done to produce lower surface roughness of the work piece. The design of experiments is considered on cutting parameters which were adopted to study the surface roughness. This purpose of this paper to find out the contributions of operating parameters in turning operation so that the cutting force on test samples is reduced during the turning process. Many researchers meanwhile apply experimental design technique to optimize the tuning parameter. Nalbalt et al. [18] utilize L9 orthogonal array together with 9 total experiments, to study the overall performance characteristics among turning operations concerning AISI 1030 steel bars using TiN covered tools. Some researchers adopted L-18 and L-16 orthogonal array to analyze experimental data [22,23]. The empirical results show that insert radius, feed rate and depth of cut are the foremost parameters that influenced the surface roughness in turning AISI 1030 carbon steel. Yang et al. [24] carried out an experiment consists of eighteen combinations on an engine lathe the use of tungsten carbide with the grade on P-10 for the machining over S45C steel bars. Several numbers of experiments at different machining conditions were carried out in previous [3-7], but even though no clear findings were yet to be found. To do so, in this study the experimental results are validated with the theoretical results. The cutting parameters that have been chosen areas cutting speed, feed rate and depth of cut along the response variables. The results show that cutting speed and feed rate was the most influencing and noticeable cutting parameters to impact on of the cutting tool life. The confirmation of experiments has been carried out to find out the relationship between experimental and predicted results. In general, when the L/D ratio is higher than 5, it does not give quite high stiffness to the machining
system, and often machine vibration/ chatter results.” This is a limitation of this investigation and it needs to be taken less than 5. 2. EXPERIMENTAL DETAILS
2.1 Materials properties, preparation and
method of measurement In the present study, a tested sample made of AISI 1060 carbon steel was chosen that chemical composition of work material (AISI 1060 Mild steel) shown in Table 1. The thermal treatment, the steel was tempered at 880 0C for an hour and quenched at 280 0C for 2 hours to eliminate stresses and to reduce hardness. As a result, the hardness of the material decreased from 62 HRC to 56–57 HRC. The experimental studies were performed on a Mori Seiki NL 2500 CNC Lathe. The experiments have been done to dry cutting conditions. The tool holder was used that model MWLNR 2525M-0.8W. A cylindrical bar of carbon steel of 115mm in diameter and 600 mm in length was cut by the power saw. Since the diameter of the bar was large, i.e. heavyweight a steady rest was used to hold the cylindrical bar. Chuck keys were tightened iteratively until centering properly being done. After centering, the drilling operation was performed to hold up the cylindrical bar into the headstock and tailstock. Tailstock line center was placed into the drill hole. Then facing operation was performed on the face of the workpiece. Since the workpiece had restful surface and irregular diameter, so turning with the 0.5 mm depth of cut was performed. Surface roughness was measured by a roughness checker and recorded in the experimental data sheet. Since the design variable and depth of cut both are three, the depth of cut and cutting speed were kept constant and the only feed rate was changed according to the level parameters. The operation was performed in 1cm length for each level. For 1’st level, three variables, 9 set of data had been found and since every setup provided 3 different turned surface Al2O3 and TiC-coated (WNMA 080408) inserts were used as the cutting tool material. The surface roughness was measured using a Mitutoyo SJ-301P portable device within the sample length of 2.5 cm. Figure 1 shows the schematic diagram of the turning operation. The range of cutting operating conditions was selected from the ASTM

M.A. Chowdhury et al., Tribology in Industry Vol. 41, No. 1 (2019) 23-32
25
manufacturer’s handbook recommended. These cutting operating parameters are shown in Table 2. Mechanical stylus strategy was utilized as an instrument that opened up and recorded the vertical movements of a stylus displaced at a steady speed at the surface to be measured by Taylor Hobson (UK) Talysurf profilers.
Fig. 1. Schematic diagram of turning operation.
Table 1. Chemical composition of AISI 1060 Mild steel.
Ingredient C Si Mn S P Others
% of composition
0.55-0.65
0.07-0.6
0.6-0.9
0.05 0.03 Rest
Amount
Table 2. Cutting parameters.
Symbol Cutting parameters
Level 1 Level 2 Level 3
A Cutting speed (m/min)
57.30 112.81 143.26
B Depth of cut (mm)
0.50 0.75 1.00
C Feed rate (mm/rev)
0.10 0.15 0.20
2.2 A Typical orthogonal array In this study, the L27 orthogonal array was applied to analyze experimental data and create a different mode [25]. The L27 orthogonal array was intended for considering the effect of 3 independent variable factors each having 3-factor level values. Three (3) independent factors were considered such as cutting speed, feed rate, and depth of cut. The input parameters were cutting speed; feed rate and depth of cut and output parameter is surface roughness. 2.3 Signal to Noise (S/N) ratios For a large number of the process parameter, the traditional experimental design methods are very complicated and difficult to use because it
requires a large number of experimental data. Robust design’s technique allows to study the variation of the process and ultimately to optimize the process by analyzing the minimum number of experimental data. The robust design uses a design of orthogonal array to analyze the entire parameter space with the small number of experiments only. Variability as well as target, using the signal to noise ratio, which is the ratio between responses, means control factors affect and variation. In the field of production engineering, the Robust design is the most used and popular for solving optimization problems [26-28]. Robust design recommends the mean response for determining each experiment in the array and recommends analyzing variation using a signal-to-noise ratio (S/N) equation 1:
𝑆
𝑁= −10 log
1
𝑛(Ʃ𝑦2) (1)
2.4 Selection of number of observations
The number of test observations of each experiment are selected on the basis of judgment to confirm the accuracy of the experimental data.
𝑛 =𝑧𝑠
𝐴�̅� (2)
Equation 2 is used for determining the appropriate number of operating parameters. The basis of the number of respectabilities of each experiment at similar conditions can confirm the confidence level of the requisite accuracy of testing data. 95 % confidence level within 2 % accuracy has been considered during designing the number of observations. Experimental data and results (roughness) are shown in Table 3. Table 3. Experimental data and results (roughness) for three levels of parameters.
Sl. No
Spindle speed (RPM)
Input parameters Output
parameter
Cutting Speed
(m/min)
Depth of Cut (mm)
Feed Rate
(mm/rev)
Surface Roughness
(µm)
S/N Ratio
1 160 57.30 0.5 0.1 2.7 -8.62728
2 160 57.30 0.5 0.15 3.29 -10.3439
3 160 57.30 0.5 0.2 4.66 -13.3677
4 160 57.30 0.75 0.1 4.11 -12.2768
5 160 57.30 0.75 0.15 4.19 -12.4443
6 160 57.30 0.75 0.2 4.56 -13.1793
7 160 57.30 1 0.1 4.71 -13.4604
8 160 57.30 1 0.15 5.97 -15.5195
9 160 57.30 1 0.2 6.73 -16.5603

M.A. Chowdhury et al., Tribology in Industry Vol. 41, No. 1 (2019) 23-32
26
10 315 112.81 0.5 0.1 1.51 -3.57954
11 315 112.81 0.5 0.15 2.06 -6.27734
12 315 112.81 0.5 0.2 3.22 -10.1571
13 315 112.81 0.75 0.1 2.42 -7.67631
14 315 112.81 0.75 0.15 2.68 -8.5627
15 315 112.81 0.75 0.2 3.41 -10.6551
16 315 112.81 1 0.1 2.94 -9.36695
17 315 112.81 1 0.15 3.31 -10.3966
18 315 112.81 1 0.2 4.02 -12.0845
19 400 143.26 0.5 0.1 1.08 -0.66848
20 400 143.26 0.5 0.15 1.23 -1.7981
21 400 143.26 0.5 0.2 2.04 -6.1926
22 400 143.26 0.75 0.1 1.24 -1.86843
23 400 143.26 0.75 0.15 2.17 -6.72919
24 400 143.26 0.75 0.2 2.36 -7.45824
25 400 143.26 1 0.1 2.06 -6.27734
26 400 143.26 1 0.15 2.76 -8.81818
27 400 143.26 1 0.2 2.98 -9.48433
3. RESULTS AND DISCUSSION 3.1 Influence of cutting speed Cutting speed was considered to 57.30 m/min, 112.81 m/min and 143.26 m/min at different tested conditions in this study. Cutting speed affected significantly on the surface roughness at cutting operation the surface roughness decreased with increased spindle speed at different feed rate as the value of 0.1 mm, 0.15 mm, 0.2 mm at depth of cut as 0.5 mm, 0.75 mm and 1 mm as shown in Fig. 2. The results shown in Fig. 2 revealed in the fact that tool vibration increases with low cutting speed; as a result, it increases surface roughness and increasing cutting speed reduces tool vibration and reduces surface roughness. The similar result has been obtained by the different researcher.
a)
b)
c)
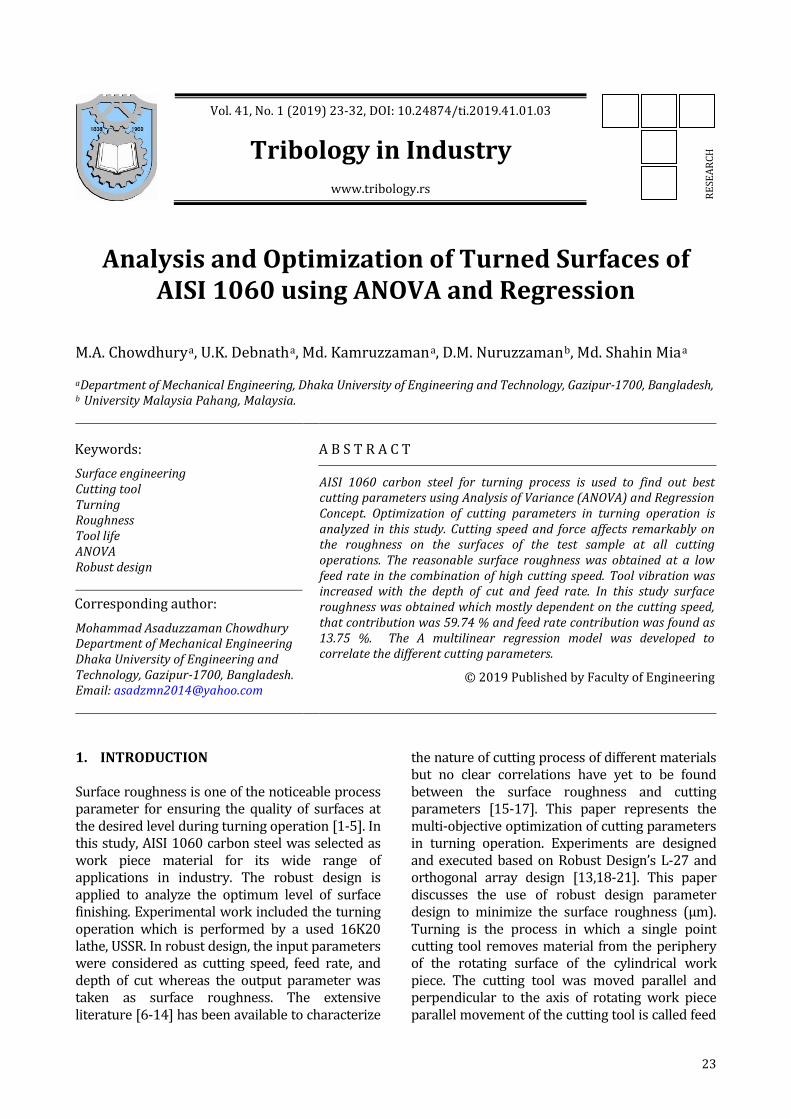
Fig. 2. Surface roughness with cutting speed at different feed rate: a) Depth of cut 0.5 mm, b) Depth of cut 0.75 mm and c) Depth of cut 1 mm. Cutting speed affected by the steady force as cutting speed increased while steady force was reduced and the steady force was increased to reduce cutting force, as a result steady force dominated to the surface roughness. Carbon steel is a ductile material that results in cutting operation built up edges (B.U.E) made which indicated burr formation and poor surface texture. 3.2 Influence of feed rate Feed rate is one of the most important dominating factors of the cutting operation. In the present study, lower level of feed rate was considered because it directly dominated to heat generation with a higher feed rate through higher cutting material removal rate. At the high level of cutting speed, the surface roughness was highly sensitive to feed rate as shown in Fig. 3. It can be noted that if the low feed rate is considered during experimentation and operation, the surface quality is increased as the roughness is decreased. In such a case cutting plays a significant role. Therefore the
M.A. Chowdhury et al., Tribology in Industry Vol. 41, No. 1 (2019) 23-32
27
combination of surface feed rate and cutting speed need to be rearranged for ensuring the better quality of the surface.
a)
b)
c)
Fig. 3. Surface roughness with feed rate at cutting speed: a) Depth of cut 0.5 mm, b) Depth of cut 0.75 mm and c) Depth of cut 1 mm.
The result was similar to the outcome of different researchers [29,30]. Reducing feed rate decreased the cutting force and it was maintained to reduce the stiffness only at low cutting speed though no effect on the high cutting speed. Reducing feed rate decreased tool vibration and increasing feed rate increased tool vibration as a result of increased surface roughness. 3.3 Influence of depth of cut Increasing depth of cut increased the cutting force [31,32]. When the depth of cut is increased and the uncut chip thickness is kept the same at all tested conditions, the specific contact stresses at the tool-chip interfaces, the chip compression ratio defined as the ratio of the chip and the uncut chip thicknesses [33], and the average contact temperature remain unchanged. During the experiment, it is observed that damping effect is reduced with increasing depth of cut. Whenever higher depth of cut is taken for turning operation, which produces chatter and interestingly chatter affects the quality of surface as well as the roughness of the surface. The test results of the depth of cut are displayed in Fig. 4. 3.4 Experimental data analysis n order to the effect of process parameters on the surface roughness, experiments were conducted using L27. The experimental data and S/N ratios are given in Table 4. The graphs were generated shown in Figs. 5 and 6 which show that the surface roughness decreased with the increase of speed and also increase in depth of cut there was the decrement in surface roughness. Robust design Analysis: Surface Roughness versus cutting speed, Feed Rate (mm/Rev.) and Depth of cut (mm). Table 4. Response Table for Signal to Noise Ratios (Smaller is better).
Level Cutting Speed
(m/min)
Depth of cut (mm)
Feed Rate (mm/rev.)
1 -12.86 -6.77 -7.09
2 -8.75 -8.98 -8.98
3 -5.47 -11.33 -11.04
Delta 7.39 4.55 3.92
Rank 1 2 3

M.A. Chowdhury et al., Tribology in Industry Vol. 41, No. 1 (2019) 23-32
28
Fig. 4. Surface roughness with depth of cut at different feed rate: a) Cutting speed 57.30 m/min, b) Cutting speed 112.81 m/min and c) Cutting speed 143.26 m/min.
Fig. 5. Main effect plot of S/N ratio for surface roughness (Ra).
Fig. 6. Plot of Interaction data means for S/N ratio. 3.5 Interpretation of the ANOVA results P-value and total percent of contributions can be considered as an indicator of percentage contributions of different operating parameters which is noted in Table 5, predicting that the null hypothesis is true. The P values is within 0 to 1 in which the values of zero or nearer to zero indicates more contributions as compared to others [34]. That is, lower (<0.05, a commonly used level of significance) p-value meant that the power level has statistically remarkable effect on the surface roughness. Table 5 ensures that all of the test parameters are prominent. Table 5. Analysis of Variance table for Surface Roughness.
Sour. Degree of Freedom
Sum of Squares
Mean of Squares
F-ratio P
value % of
Contribution
A 2 30.48 15.24 176.4 0.00 59.74
B 2 10.57 5.28 61.23 0.00 20.71
C 2 7.02 3.51 40.63 0.00 13.75
A*B 4 1.37 0.34 3.95 0.04 2.68
A*C 4 0.28 0.07 0.81 0.55 0.54
B*C 4 0.59 0.15 0.15 0.24 1.15
Error 8 0.69 0.86 1.35
Total 26 51.02 100
It can be mentioned that if the interaction is significant, the main effect plot of “Cutting speed, Feed rate and depth of cut” are meaningful. Thus, the main effect plot of “Cutting speed, depth of cut and feed rate” should be displayed. In the case of a comparative analysis of the interaction between different factors, A*B= interaction within cutting speed * depth of cut (p=0.04) has a lower p-value than the other two combinations. However, the factor interaction A*C= feed rate depth of cut (p=0.55), contributes less to surface roughness compared to B*C=
a)
b)
c)

M.A. Chowdhury et al., Tribology in Industry Vol. 41, No. 1 (2019) 23-32
29
angle of feed rate depth of cut (p=0.24). In ANOVA analysis, rather than other parameters, cutting speed has 59.74 % of contribution for roughening the surfaces more or less. But in case of feed rate the dominating effect on roughness of the surface is almost 13.75 %. The summarized model results are shown in Table 6. Table 6. Model Summary.
S R-sq R-sq(adj)
0.293888 98.65 % 95.60 %
3.6 Regression analysis of surface roughness
versus cutting parameters Normality, constant variance and independence are three assumptions in ANOVA. The normality plot of the residuals shown that the residuals follow a normal distribution shown in Fig. 7.
Fig. 7. Normality plot of residuals for surface roughness (µm). Variance the plot of residuals versus fitted values and the plot of residuals versus run order did not show any linear pattern as shown in Fig. 8.
Fig. 8. Residuals with fits for surface roughness.
The predicted regression equation was formed from Table 7. Predicted regression surface roughness was measured by this equation and experimental surface roughness was measured by the Taylor Hobson surface roughness checker. The plot between Regression predicted surface roughness and experimental surface roughness values was drawn. Table 7. Coefficients determination.
Term Coef SE
Coef T-Value
P-Value
VIF
Constant 2.094 0.431 4.86 0.000
A -0.029 0.002 -14.91 0.000 1.00
B 3.042 0.349 8.71 0.000 1.00
C 12.46 1.75 7.14 0.000 1.00
Regression Equation:
𝑆𝑢𝑟𝑓𝑎𝑐𝑒 𝑅𝑜𝑢𝑔ℎ𝑛𝑒𝑠𝑠 = 2.094 − 0.0289 ∗ 𝐴 + 3.042 ∗𝐵 + 12.46 ∗ 𝐶 (3)
Optimization of machining parameters and all testing parameters increases the utility for machining economics and save time. A Robust design based surface optimization method is an attempt applying MINITAB software for individual machining parameters in turning operation. Table 8. Objective function achieving table.
Parameter Objective Function
Optimum combination
Cutting speed
(m/min)
Depth of Cut(mm)
Feed Rate (mm/rev)
Ra Minimum 143.26 0.50 0.10
The design of experiments (DOE), Robust design was applied for optimization of cutting parameters. Minimum variance in surface roughness is obtained at lower S/N ratio. These results are listed in Table 8. 3.7 Contour plot and 3D surface with surface
roughness The variation in the surface roughness was obtained from experimental work as shown in Fig. 9. This photograph is the correlation among mathematical values in two dimensions. The results indicates higher tool nose radius had the more suitable surface precision as compared to the lower nose radius in hard turning [9]. Nose radius and surface roughness are increased with the increase in cutting speed. This is due to cutting tool exhibits higher temperature and pressure at the nose in hard

M.A. Chowdhury et al., Tribology in Industry Vol. 41, No. 1 (2019) 23-32
30
turning shown in Fig. 9a. This causes thermal softening of the cutting tool.
a)
b)
c)
Fig. 9. Contour plot with surface roughness at differences testing: a) cutting speed with feed rate, b) cutting speed with depth of cut, and c) feed rate with depth of cut.
It was noted that the second most effective parameter affecting surface roughness is feed rate is shown in Fig. 9c. An increased feed rate which results in increase in the roughness values. Material hardness and strain hardening are both responsible for these trends of results.
However, higher feed rate with cutting speed increased the surface roughness and tool wear. The contour plot shown in Fig. 9b surface roughness was also affected by another parameter which is the depth of cut, increase in depth of cut increased the surface roughness.
4. CONCLUSIONS The following conclusions can be done from this study:
(1) From the results obtained by ANOVA analysis, the influence of surface roughness (Ra) by the cutting parameters like speed, feed, DOC. Feed rate and depth of cut have the different influencing effects on surface roughness. But among them, the surface roughness is reduced with the increase of cutting speed.
(2) Cutting speed has the great contribution (59.74 %) on surface roughness (Ra) as compared to other cutting parameters. Moreover, the contribution of cutting speed to minimize the surface roughness is remarkable. Rather than cutting speed, other parameters even though increase the roughness of the surfaces, but the cutting speed which is acted in oppositely on surfaces to maintain the surface texture within a reasonable level.
(3) The interaction of cutting parameters was also studied for the three responses Ra. The interaction for the cutting parameters was found that speed and depth of cut have a noticeable influence on the response Ra and the percentage contribution of cutting speed and depth of cut is 2.68 % followed by depth of cut and feed rate with 1.15 %, cutting speed and feed rate with 0.54 %.
(4) The residuals followed a normal distribution. On the other hand, the plot of residuals versus fitted values and the plot of residuals versus run order did not show any linear pattern. Therefore, both the constant variance and the independence assumptions satisfied the models.
(5) A multilinear regression model was developed and the values were obtained for the responses Ra which has been compared with measured values. The models are
Feed rate(mm/rev)
Cu
ttin
g s
peed
(m/m
in)
0.200.180.160.140.120.10
140
130
120
110
100
90
80
70
60
>
–
–
–
–
< 2
2 3
3 4
4 5
5 6
6
roughness(µm)
Surface
Contour Plot of Surface roughnes vs Cutting speed(m/, Feed rate(mm/rev
Depth of cut(mm)
Cu
ttin
g s
peed
(m/m
in)
1.00.90.80.70.60.5
140
130
120
110
100
90
80
70
60
>
–
–
–
–
< 2
2 3
3 4
4 5
5 6
6
roughness(µm)
Surface
Contour Plot of Surface roughnes vs Cutting speed(m/, Depth of cut(mm)
Depth of cut(mm)
Feed
rate
(mm
/rev)
1.00.90.80.70.60.5
0.20
0.18
0.16
0.14
0.12
0.10
>
–
–
–
–
< 2
2 3
3 4
4 5
5 6
6
roughness(µm)
Surface
Contour Plot of Surface roughnes vs Feed rate(mm/rev, Depth of cut(mm)

M.A. Chowdhury et al., Tribology in Industry Vol. 41, No. 1 (2019) 23-32
31
adequate with no violation of independence or constant assumption. The results were obtained in this study which led to conclude for turning of AISI 1060 carbon steel bar, after conducting the experiments and analyzing the resulting data.
REFEFERANCES [1] A.M Khorasani, M.R.S. Yazdi, M.S. Safizadeh,
Analysis of machining parameters effects on surface roughness: a review, International Journal of Computational Materials Science and Surface Engineering, vol. 5, iss. 1, pp. 68-84, 2012, doi:10.1504/IJCMSSE.2012.049055
[2] S.R. Das, A. Kumar, D. Dhupal, Experimental investigation on cutting force and surface roughness in machining of hardened AISI 52100 steel using cBN tool, International Journal of Machining and Machinability of Materials, vol. 18, iss. 5-6, pp. 501-521, 2016, doi: 10.1504/IJMMM.2016.078997
[3] M. Mia, N.R. Dhar, Optimization of surface roughness and cutting temperature in high-pressure coolant-assisted hard turning using Taguchi method, The International Journal of Advanced Manufacturing Technology, vol. 88, iss. 1-4, pp. 739-753, 2017, doi: 10.1007/s00170-016-8810-2
[4] M. Mia, M.H. Razi, I. Ahmad, R. Mostafa, S.M. Rahman, D.H. Ahmed, N.R. Dhar, Effect of time-controlled MQL pulsing on surface roughness in hard turning by statistical analysis and artificial neural network, The International Journal of Advanced Manufacturing Technology, vol. 91, iss. 9-12, pp. 3211-3223, 2017, doi: 10.1007/s00170-016-9978-1
[5] M. Mia, N.R. Dhar, Modeling of surface roughness using RSM, FL and SA in dry hard turning, Arabian Journal for Science and Engineering, vol. 43, iss. 3, pp. 1125-1136, 2018, doi: 10.1007/s13369-017-2754-1
[6] M. Mia, N.R. Dhar, Prediction and optimization by using SVR, RSM and GA in hard turning of tempered AISI 1060 steel under effective cooling condition, Neural Computing and Applications, pp. 1-22, 2017, doi: 10.1007/s00521-017-3192-4
[7] M.K. Gupta, G. Singh, P.K. Sood, Experimental investigation of machining AISI 1040 medium carbon steel under cryogenic machining: A comparison with dry machining, Journal of The Institution of Engineers (India): Series C, vol. 96, iss. 4, pp. 373-379, 2015, doi: 10.1007/s40032-015-0178-9
[8] A.T. Abbas, D.Y. Pimenov, I.N. Erdakov, T. Mikolajczyk, E.A. ElDanaf, M.A. Taha, Minimization of turning time for high-strength steel with a given surface roughness using the Edgeworth–Pareto optimization method, The International Journal of Advanced Manufacturing Technology, vol. 93, iss. 5-8, pp. 2375-2392, 2017, doi: 10.1007/s00170-017-0678-2
[9] G.M. Krolczyk, R.W. Maruda, J.B. Krolczyk, P. Nieslony, S. Wojciechowski, S. Legutko, Parametric and nonparametric description of the surface topography in the dry and MQCL cutting condition, Measurement, vol. 121, pp. 225-239, 2018, doi: 10.1016/j.measurement.2018.02.052
[10] P. Sivaiah, D. Chakradhar, Multi-objective optimisation of cryogenic turning process using Taguchi-based grey relational analysis, International Journal of Machining and Machinability of Materials, vol. 19, iss. 4, pp. 297-312, 2017, doi: 10.1504/IJMMM.2017.086161
[11] R. Vinayagamoorthy, M.A. Xavior, Taguchi-fuzzy inference system and grey relational analysis to optimise process with multiple performance characteristics in precision turning of Ti-6AL-4V, International Journal of Computer Aided Engineering and Technology, vol. 8, no. 295-323, 2016, doi: 10.1504/IJCAET.2016.077606
[12] M.K. Gupta, P.K. Sood, V.S. Sharma, Optimization of machining parameters and cutting fluids during nano-fluid based minimum quantity lubrication turning of titanium alloy by using evolutionary techniques, Journal of Cleaner Production, vol. 135, pp. 1276-1288, 2016, doi: 10.1016/j.jclepro.2016.06.184
[13] T.Ş, Kıvak, S. Mert, Application of the Taguchi technique for the optimization of surface roughness and tool life during the milling of Hastelloy C22, Materials Testing, vol. 59, no. 1, pp. 69-76, 2017.
[14] J.S. Dureja, V.K. Gupta, V.S. Sharma, M. Dogra, M. S. Bhatti, A review of empirical modeling techniques to optimize machining parameters for hard turning applications, Proceedings of the Institution of Mechanical Engineers, Part B: Journal of Engineering Manufacture, vol. 230, no. 3, pp. 389-404, 2016, doi: 10.1177/0954405414558731
[15] H.K. Dave, K.P. Desai, H.K. Raval, A Taguchi approach-based study on effect of process parameters in electro discharge machining using orbital tool movement, International Journal of Machining and Machinability of Materials, vol. 13, iss. 1 pp. 52-66, 2013, doi: 10.1504/IJMMM.2013.051908
M.A. Chowdhury et al., Tribology in Industry Vol. 41, No. 1 (2019) 23-32
32
[16] T.U. Siddiqui, M. Shukla, P.B. Tambe, Optimisation of surface finish in abrasive water jet cutting of Kevlar composites using hybrid Taguchi and response surface method, International Journal of Machining and Machinability of Materials, vol. 3, iss. 3-4, pp. 382-402, 2008, doi: 10.1504/IJMMM.2008.02097
[17] A. Manna, B. Bhattacharyya, Taguchi method based optimization of cutting tool flank wear during turning of PR-Al/20vol.% SiC-MMC, International Journal of Machining and Machinability of Materials, vol. 1, iss. 4, pp. 488-499, 2006, doi: 10.1504/IJMMM.2006.012355
[18] M. Nalbant, H. Gökkaya, G. Sur, Application of Taguchi method in the optimization of cutting parameters for surface roughness in turning, Materials & design, vol. 28, iss. 4, pp. 1379-1385, 2007, doi: 10.1016/j.matdes.2006.01.008
[19] S. Debnath, M.M. Reddy, Q.S. Yi, Influence of cutting fluid conditions and cutting parameters on surface roughness and tool wear in turning process using Taguchi method, Measurement, vol. 78, pp. 111-119, 2016, doi: 10.1016/j.measurement.2015.09.011
[20] U.K. Debnath, M.A. Chowdhury, D.M. Nuruzzaman, M.M. Rahman, B.K. Roy, M.A. Kowser, M.M. Islam, Erosion characteristics of Teflon under different operating conditions, Journal of Polymer Engineering, vol. 35, iss. 9, pp. 889-904, 2015, doi: 10.1515/polyeng-2014-0359
[21] U.K. Debnath, M.A. Chowdhury, D.M. Nuruzzaman, The experimental characteristics and evaluation of nylon-12 in erosion process, Journal of Testing and Evaluation, vol. 45, iss. 3, pp. 773-787, 2017, doi: 10.1520/JTE20150154
[22] T.S. Rajesh, R.V. Rao, Parameter Optimization of Amalgamated Al2O3-40% TiO2 Atmospheric Plasma Spray Coating on SS304 Substrate Using TLBO Algorithm, Journal of Surface Engineered Materials and Advanced Technology, vol. 6, no. 3, 2016, doi: 10.4236/jsemat.2016.63009
[23] T. Yih-Fong, C. Fu-Chen, Multiobjective process optimisation for turning of tool steels, International Journal of Machining and Machinability of materials, vol. 1, iss. 1, pp. 76-93, 2006, doi: 10.1504/IJMMM.2006.010659
[24] W.H. Yang, Y.S. Tarng, Design optimization of cutting parameters for turning operations based on the Taguchi method, Journal of materials processing technology, vol. 84, iss. 1-3, pp. 122-129, 1998, doi: 10.1016/S0924-0136(98)00079-X
[25] J.A. Ghani, I.A. Choudhury, H.H. Hassan, Application of Taguchi method in the optimization of end milling parameters, Journal of materials processing
technology, vol. 145, iss. 1, pp. 84-92, 2004, doi: 10.1016/S0924-0136(03)00865-3
[26] S. Mahapatra, A. Patnaik, Optimization of wire electrical discharge machining (WEDM) process parameters using Taguchi method, The International Journal of Advanced Manufacturing Technology, vol. 34, iss. 9-10, pp. 911-925, 2007, doi: 10.1007/s00170-006-0672-6
[27] K. Palanikumar, Application of Taguchi and response surface methodologies for surface roughness in machining glass fiber reinforced plastics by PCD tooling, The International Journal of Advanced Manufacturing Technology, vol. 36, no. 1-2, pp. 19-27, 2008, doi: 10.1007/s00170-006-0811-0
[28] M. Mia, P.R. Dey, M.S. Hossain, M.T. Arafat, M. Asaduzzaman, M.S. Ullah, S.T. Zobaer, Taguchi S/N based optimization of machining parameters for surface roughness, tool wear and material removal rate in hard turning under MQL cutting condition, Measurement, vol. 122, pp. 380-391, 2018, doi: 10.1016/j.measurement.2018.02.016
[29] A.B. Abdullah, L.Y. Chia, Z. Samad, The effect of feed rate and cutting speed to surface roughness, Asian Journal of Scientific Research, vol. 1, no. 1, pp. 12-21, 2008.
[30] V.P. Astakhov, S. Shvets, The assessment of plastic deformation in metal cutting, Journal of Materials Processing Technology, vol. 146, iss. 2, pp. 193-202, 2004, doi: 10.1016/j.jmatprotec.2003.10.015
[31] V. Sivaraman, S. Sankaran, L. Vijayaraghavan, The effect of cutting parameters on cutting force during turning multiphase microalloyed steel, Procedia CIRP, vol. 4, pp. 157-160, 2012, doi: 10.1016/j.procir.2012.10.028
[32] K.C. Anil, M.G. Vikas, B.S. Teja, K.S.l. Rao, Effect of cutting parameters on surface finish and machinability of graphite reinforced Al-8011 matrix composite, in IOP Conference Series: Materials Science and Engineering, vol. 191, no. 1, pp. 012025, 2017.
[33] I. Korkut, M.A. Donertas, The influence of feed rate and cutting speed on the cutting forces, surface roughness and tool–chip contact length during face milling, Materials & design, vol. 28, iss. 1, pp. 308-312, 2007, doi: 10.1016/j.matdes.2005.06.002
[34] A.T. Abbas, D.Y. Pimenov, I.N. Erdakov, M.A. Taha, M.S. Soliman, M.M. El Rayes, ANN Surface Roughness Optimization of AZ61 Magnesium Alloy Finish Turning: Minimum Machining Times at Prime Machining Costs, Materials, vol. 11, no. 5, p. 808, 2018, doi: 10.3390/ma11050808