trigona sp. and apis sp. honey as natural corrosion...
TRANSCRIPT

i
Trigona sp. AND Apis sp. HONEY AS NATURAL
CORROSION INHIBITOR FOR ALUMINIUM
ALLOY IN 1 M PHOSPHORIC ACID
by
NUR IZZANA BINTI SULAIMAN
Thesis submitted in fulfilment of the requirements
for the degree of
Master of Science
September 2016

ii
ACKNOWLEDGEMENT
Alhamdulillah. First and foremost, I am so grateful to Allah SWT for giving me this
opportunity to complete my study. I wish to express my sincere appreciation to my
supervisor, Prof. Mohd Jain Noordin Mohd Kassim and my co-supervisor, Prof.
Afidah Abdul Rahim for constantly guiding and encouraging me throughout this
study. Thank you for giving me advice and suggestions in my lab work and thesis
until its final form. I am grateful for their patience and constructive comments that
enriched this research project.
I would also like to express millions of thanks to my family and loved ones
especially my parents, Mr. Sulaiman bin Md Dom and Mrs. Rahmah binti Awang. I
would also like to acknowledge with much appreciation the help of the technical staff
of the School of Chemical Sciences, for their valuable comments, sharing their time
and knowledge on this research when this study was carried out and also giving the
permission and cooperation to use all the machines and necessary tools in the
laboratory. They have contributed towards my understanding and thoughts.
Last but not least, I would like to express my sincere thankfulness to all my
colleagues and others who provided assistance and help me during this research.
Their views and tips are useful indeed. I would like to extend my thankful to Pusat
Pengajian Sains Kimia, Institut Pengajian Siswazah, Universiti Sains Malaysia Pulau
Pinang for giving me the place and opportunity throughout this study.
iii
TABLE OF CONTENTS
Acknowledgement ii
Table of Content iii
List of Tables vi
List of Figures viii
List of Symbols and Abbreviations xi
Abstrak xiii
Abstract xv
CHAPTER ONE: INTRODUCTION
1.1 Background of study 1
1.2 Problem statement 4
1.3 Research objectives 5
CHAPTER TWO: LITERATURE REVIEW
2.1 Corrosion 6
2.2 Techniques in corrosion studies 8
2.2.1 Weight loss measurement 8
2.2.2 Potentiodynamic polarization measurement 9
2.2.3 Electrochemical impedance spectroscopy (EIS) measurement 11
2.2.4 Pitting corrosion 14
2.3 Corrosion of aluminium 15
2.3.1 Corrosion of aluminium in phosphoric acid 18
2.4 Corrosion protection 18
2.5 Corrosion inhibitor 20
2.5.1 Type of inhibitors 21
2.6 Adsorption process 23
2.6.1 Adsorption isotherm 25
2.7 Honey 27
2.7.1 Phenolic acid and p-coumaric acid 31

iv
CHAPTER THREE: EXPERIMENTAL
3.1 Aluminium specimens 34
3.2 Inhibitors 34
3.3 Medium 35
3.4 Characterization of stingless bee honey and natural honey 35
3.4.1 Fourier transform infrared spectroscopy (FTIR) analysis 35
3.4.2 Determination of total phenol by Folin-Ciocalteau Assay 35
3.4.3 Determination of total antioxidant capacity by using
phosphomolybdenum method
36
3.5 Identification of p-coumaric acid by mass spectrometry in inhibitors 36
3.6 Corrosion inhibition tests 37
3.6.1 Weight loss measurement method 37
3.6.2 Electrochemical measurement 37
3.6.2 (a) Potentiodynamic polarization 38
3.6.2 (b) Electrochemical impedance spectroscopy (EIS) 38
3.6.2 (c) Cyclic polarization 39
3.7 Effect of temperature on the corrosion inhibition of aluminium 39
3.7.1 Free Gibbs energy, ∆Gads and adsorption isotherm 40
3.8 Potential zero charge (PZC) 40
3.9 Surface analysis by using SEM-EDX 40
CHAPTER FOUR: RESULTS AND DISCUSSIONS
4.1 Composition of aluminium specimen 42
4.2 Fourier transform infrared spectroscopy (FTIR) analysis of honeys 42
4.3 Total phenol contents of honeys by Folin-Ciocalteau Assay 47
4.4 Total antioxidant capacity by using phosphomolybdenum method 49
4.5 Identification of p-coumaric by Liquid Chromatography Mass
Spectrometry (LC/MS) in honeys
50
4.6 Effect of honey’s concentration on corrosion of aluminium 55
4.6.1 Weight loss measurement method 55
4.6.2 Potentiodynamic polarization measurement 59

v
4.6.3 Electrochemical impedance spectroscopy (EIS) 66
4.6.4 Pitting corrosion 73
4.7 Effect of temperature effect on corrosion of aluminium 77
4.7.1 Adsorption isotherm and free Gibbs energy, ΔGads 88
4.8 The potential of zero charge (PZC) of aluminium 96
4.9 The mechanism of the inhibitors 99
4.10 Surface analysis 104
CHAPTER FIVE: CONCLUSION 108
CHAPTER SIX: RECOMMENDATIONS FOR FUTURE RESEARCH 111
REFERENCES 112
vi
LIST OF TABLES
Page
Table 4.1 EDX analysis of aluminium specimen 42
Table 4.2 FTIR peaks and description of stingless bee honey and natural
honey
45
Table 4.3 Weight loss measurement of aluminium in 1 M H3PO4 with
and
without various concentrations of stingless bee honey at 303 K
for 24 hours
56
Table 4.4 Weight loss measurement of aluminium in 1 M H3PO4 with
and
without various concentrations of natural honey at 303 K for
24 hours
56
Table 4.5 Data from polarization measurement of aluminium in 1 M
H3PO4 in the absence and presence of various concentration
of stingless bee honey
65
Table 4.6 Data from polarization measurement of aluminium in 1 M
H3PO4 in the absence and presence of various concentration of
natural honey
65
Table 4.7 The parameters of electrochemical (EIS) for aluminium in 1 M
H3PO4 with the presence of stingless bee honey in 303 K
72
Table 4.8 The parameters of electrochemical (EIS) for aluminium in
1 M H3PO4 with the presence of natural honey in 303 K
72
Table 4.9 Pitting corrosion test parameters for 1 M H3PO4 solution, 1500
ppm natural honey and 1500 ppm stingless bee honey
75
Table 4.10 The effect of temperature for stingless bee honey in various
concentrations on aluminium in 1 M H3PO4
79
Table 4.11 The effect of temperature for natural honey in various
concentrations on aluminium in 1 M H3PO4
80
Table 4.12 Activation parameters of the dissolution reaction of
aluminium in 1 M H3PO4 in the absence and presence of
stingless bee honey
85
Table 4.13 Activation parameters of the dissolution reaction of 85
vii
aluminium in 1 M H3PO4 in the absence and presence of
natural honey
Table 4.14 Langmuir adsorption isotherm values of stingless bee honey
and natural honey
93
Table 4.15
Frumkin adsorption isotherm values of stingless bee honey
and
natural honey
93
Table 4.16 Temkin adsorption isotherm values of stingless bee honey and
natural honey
93
Table 4.17 The value potential of zero charge (PZC) and Er for the
aluminium in phosphoric acid, stingless bee honey and
natural honey
98
viii
LIST OF FIGURES
Page
Figure 2.1 Tafel plot 10
Figure 2.2 Equivalent circuit 11
Figure 2.3 Nyquist plot 13
Figure 2.4 Bode plot 14
Figure 2.5 Electrochemical mechanism of corrosion aluminium 17
Figure 2.6 The stingless bee hive 30
Figure 2.7 Natural honey hive 31
Figure 2.8 The chemical structure of p-coumaric acid 33
Figure 4.1 Comparison between FTIR spectrum for stingless bee honey
and natural honey
46
Figure 4.2 Calibration curve of standard gallic acid absorbance at
wavelength 765 nm against concentration of standard
gallic acid
48
Figure 4.3 Calibration curve of standard ascorbic acid absorbance at
wavelength 695 nm against concentration of standard
ascorbic acid
50
Figure 4.4 The full scan mass spectra of p-coumaric acid in the stingless
bee honey
52
Figure 4.5 The full scan mass spectra of p-coumaric acid in the natural
honey
53
Figure 4.6 The correlation between inhibition efficiency with
concentration for stingless bee honey and natural honey at
303
K taken with weight loss measurement
57
Figure 4.7 The correlation of corrosion rate with concentration for
both inhibitors at 303 K
58
Figure 4.8 Tafel plot of aluminium in 1 M H3PO4 with and without of
various concentrations of stingless bee honey
63
Figure 4.9 Tafel plot of aluminium in 1 M H3PO4 with and without of 64
ix
various concentrations of natural honey
Figure 4.10 The Randle’s CPE circuit model 68
Figure 4.11 The Nyquist plot for stingless bee honey at 303 K of
aluminium in 1 M H3PO4
70
Figure 4.12 The Nyquist plot for natural honey at 303 K of aluminium in
1 M H3PO4
71
Figure 4.13 Cyclic polarization curve for 1 M H3PO4 76
Figure 4.14 Cyclic polarization curve for 1500 ppm stingless bee honey
in 1 M H3PO4
76
Figure 4.15 Cyclic polarization curve for 1500 ppm natural honey in
1 M H3PO4
77
Figure 4.16 Arrhenius plot for ln CR vs 1000/T for aluminium in 1 M
H3PO4 at various concentration of stingless bee honey
82
Figure 4.17 Arrhenius plot for ln CR vs 1000/T for aluminium in 1 M
H3PO4 at various concentration of natural honey
82
Figure 4.18 Transition state plot for ln CR/T vs 1000/T for aluminium in
1 M H3PO4 at various concentration of stingless bee
honey
86
Figure 4.19 Transition state plot for ln CR/T vs 1000/T for aluminium in
1 M H3PO4 at various concentration of natural honey
86
Figure 4.20 Langmuir adsorption isotherm plot for stingless bee honey
and natural honey in 1 M H3PO4 at 303 K
90
Figure 4.21 Frumkin adsorption isotherm plot for stingless bee honey
and natural honey in 1 M H3PO4 at 303 K
91
Figure 4.22 Temkin adsorption isotherm plot for stingless bee honey
and natural honey in 1 M H3PO4 at 303 K
92
Figure 4.23 The relation between conductivity against potential on
the aluminium surface in 1 M H3PO4 in the absence
and presence of stingless bee honey and natural honey
98
Figure 4.24 Schematic illustration of adsorption mechanism of p-
coumaric acid on aluminium in 1 M H3PO4 interface
103
Figure 4.25 EDX spectrum, SEM micrograph and composition element
in the surface of aluminium which is untreated, B) the
106

x
surface of aluminium that immersed in 1 M H3PO4 solution
with 140 X magnification
Figure 4.26 EDX spectrum, SEM micrograph and composition element
in
C) the surface of aluminium that immersed in 1500 ppm
stingless bee honey, D) the surface of aluminium
that immersed in 1500 ppm natural honey with 140 X
magnification
107
xi
LIST OF SYMBOL AND ABBREVIATIONS
CPE Constant phase element
CR Corrosion rate
EIS Electrochemical Impedance Spectroscopy
EDX Energy Dispersive X-Ray Spectroscopy
FTIR Fourier Transform Infrared Spectroscopy
H3PO4 Phosphoric acid solution
IE Inhibition Efficiency
Mpy Mils of penetration per year
PZC Potential Zero Charge
SEM Scanning Electron Microscopy
XRF X-Ray Fluorescene Spectroscopy
Ea Activation energy
Ecorr Corrosion potential
Epit Pitting potential
Er Antropy ‘rational’ corrosion potential
Erp Repassivation potential
icorr Corrosion current density
∆H Enthalpy change (kJ mol-1
)
∆S Entropy change (J K-1
mol-1
)
∆Gads Gibbs free energy change (kJ mol-1
)
mA cm-2
Miliampere per centimetre square

xii
mm y-1
Milimetres per year
mV Milivolt
mV s-1
Milivolt per second
Rct Resistance charge transfer
Rp Polarization resistance
Rs Solution resistance
R2 Regression coefficient
v/v Volume per volume
w/v Weight per volume
Ω cm2 Ohm’s centimetre square

xiii
MADU Trigona sp. DAN Apis sp. SEBAGAI PERENCAT KAKISAN SEMULA
JADI BAGI ALOI ALUMINIUM DALAM 1 M ASID FOSFORIK
ABSTRAK
Dua jenis sampel madu, madu kelulut (Trigona sp.) dan madu lebah (Apis
sp.) telah dipilih dan dikaji sebagai perencat kakisan bagi aloi aluminium dalam
larutan 1 M asid fosforik (H3PO4). Kajian pencirian telah dijalankan untuk
menentukan kumpulan fungsi dalam madu yang bertanggungjawab dalam proses
perencatan. Keputusan spektroskopi inframerah Fourier transformasi (FTIR)
menunjukkkan kewujudan kumpulan fungsi utama yang boleh memenuhi ciri
keperluan sebagai perencat kakisan organik yang baik. Analisis kedua-dua madu
dengan menggunakan spektroskopi jisim kromatografi cecair dengan menggunakan
kolum C18 fasa berbalik menunjukkan kehadiran asid p-kumarik di dalam madu
yang merupakan salah satu daripada sebatian fenolik yang mempunyai kapasiti
antioksida tertinggi. Kandungan fenolik dan kapasiti antioksida madu kelulut
didapati lebih tinggi daripada madu lebah. Peratusan keberkesanan perencatan (IE %)
kedua-dua madu telah disiasat dalam 1 M H3PO4 menggunakan kaedah penentuan
kehilangan berat, pengukuran potensiodinamik, dan pengukuran spektroskopi
impedans elektrokimia (EIS). Kajian mendapati bahawa IE % kedua-dua madu
tersebut bertambah dengan pertambahan kepekatan madu yang digunakan.
Berdasarkan pengukuran kekutuban potensiodinamik, nilai IE % paling tinggi
didapati pada kepekatan optima (1500 ppm) iaitu 78.6 % bagi madu kelulut dan 73.9
% bagi madu lebah. Pengukuran kekutuban potensiodinamik menunjukkan bahawa
kedua-dua madu bertindak sebagai perencat jenis campuran dengan kesan perencat
xiv
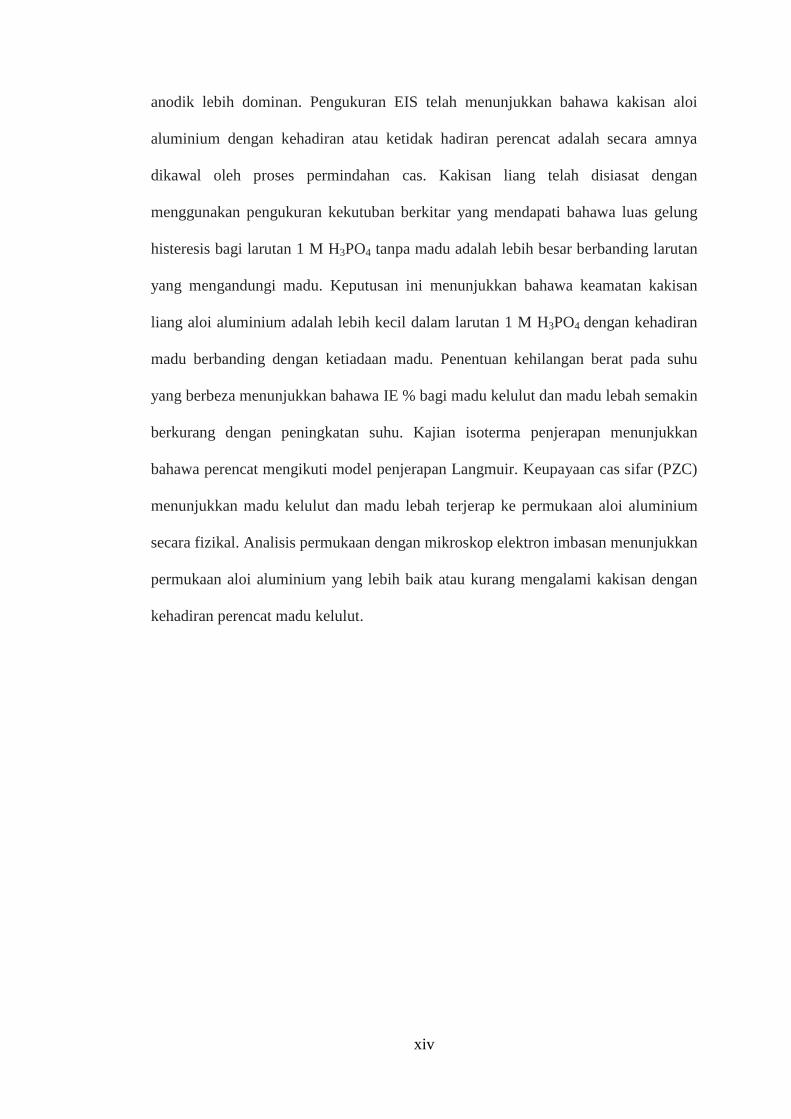
anodik lebih dominan. Pengukuran EIS telah menunjukkan bahawa kakisan aloi
aluminium dengan kehadiran atau ketidak hadiran perencat adalah secara amnya
dikawal oleh proses permindahan cas. Kakisan liang telah disiasat dengan
menggunakan pengukuran kekutuban berkitar yang mendapati bahawa luas gelung
histeresis bagi larutan 1 M H3PO4 tanpa madu adalah lebih besar berbanding larutan
yang mengandungi madu. Keputusan ini menunjukkan bahawa keamatan kakisan
liang aloi aluminium adalah lebih kecil dalam larutan 1 M H3PO4 dengan kehadiran
madu berbanding dengan ketiadaan madu. Penentuan kehilangan berat pada suhu
yang berbeza menunjukkan bahawa IE % bagi madu kelulut dan madu lebah semakin
berkurang dengan peningkatan suhu. Kajian isoterma penjerapan menunjukkan
bahawa perencat mengikuti model penjerapan Langmuir. Keupayaan cas sifar (PZC)
menunjukkan madu kelulut dan madu lebah terjerap ke permukaan aloi aluminium
secara fizikal. Analisis permukaan dengan mikroskop elektron imbasan menunjukkan
permukaan aloi aluminium yang lebih baik atau kurang mengalami kakisan dengan
kehadiran perencat madu kelulut.

xv
Trigona sp. AND Apis sp. HONEY AS NATURAL CORROSION INHIBITOR
FOR ALUMINIUM ALLOY IN 1 M PHOSPHORIC ACID
ABSTRACT
Two types of honey samples, stingless bee honey (Trigona sp.) and natural
honey (Apis sp.) were selected and studied as aluminium alloy corrosion inhibitor in
1 M phosphoric acid (H3PO4). The characterization studies have been conducted to
determine the heteroatoms in honey that are responsible for inhibition process.
Fourier transform infrared (FTIR) spectroscopy results suggest the presence of
important functional groups that fulfilled the requirement as a potent organic
corrosion inhibitor. The analysis of both honeys by liquid chromatography mass
spectrometry with a reversed phase C18 column was done and the analysis showed
evidence on the presence of p-coumaric acid, one of the phenolic compounds that has
the highest antioxidant capacity. The phenolic content and antioxidant capacity
showed stingless bee honey have the highest content compared to natural honey. The
percentage inhibition efficiency (IE %) of the honeys were investigated in 1 M
H3PO4 by means of weight loss method, potentiodynamic polarization and
electrochemical impedance spectroscopy (EIS) measurement. These analysis showed
IE % for both honeys increased with the increasing of the concentration of honeys.
Potentiodynamic polarization method gave the highest IE %, which were 78.6 % for
stingless bee honey and 73.9 % for natural honey at optimum concentration (1500
ppm). Potentiodynamic polarization measurement indicated that the inhibitors act as
mixed type inhibitors with predominant anodic inhibition. EIS measurement showed
that the corrosion of aluminium alloy with and without inhibitors was mainly
xvi
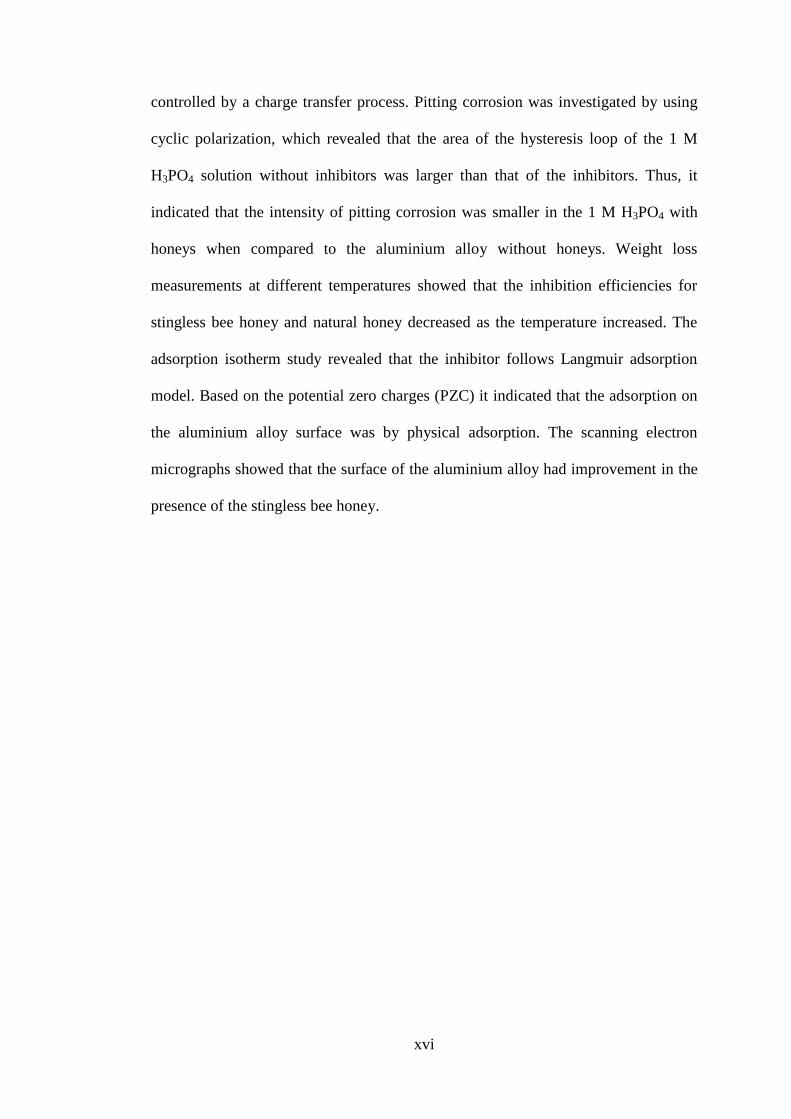
controlled by a charge transfer process. Pitting corrosion was investigated by using
cyclic polarization, which revealed that the area of the hysteresis loop of the 1 M
H3PO4 solution without inhibitors was larger than that of the inhibitors. Thus, it
indicated that the intensity of pitting corrosion was smaller in the 1 M H3PO4 with
honeys when compared to the aluminium alloy without honeys. Weight loss
measurements at different temperatures showed that the inhibition efficiencies for
stingless bee honey and natural honey decreased as the temperature increased. The
adsorption isotherm study revealed that the inhibitor follows Langmuir adsorption
model. Based on the potential zero charges (PZC) it indicated that the adsorption on
the aluminium alloy surface was by physical adsorption. The scanning electron
micrographs showed that the surface of the aluminium alloy had improvement in the
presence of the stingless bee honey.

1
CHAPTER ONE
INTRODUCTION
1.1 Background of study
Corrosion studies of aluminium and its alloys have received considerable
attention because of their technological importance and industrial application.
Aluminium and aluminium alloys are mainly used as parts in automobiles, aerospace
and building structures, household appliances, containers and electronic devices
(Philip and Schweitzer, 2003; Vargel, 2004). A remarkable economic and industrial
importance of aluminium and its alloy are due to their low cost, light weight, high
thermal and electrical conductivity. Additionally, aluminium and its alloy have good
corrosion resistance toward the atmosphere and many aqueous media due to the
formation of thin and highly protective oxide film which protects them from further
corrosion. However, in the presence of aggressive environments the protective layer
can be destroyed and corrosive attack takes place (Abd El Rehim et al., 2004;
Elewady et al., 2008).
Acid pickling is one of the industrial cleaning processes used for removal of
scales or oxide on the metallic substrates. The main acids abundantly used in
industries are hydrochloric and sulphuric acid. One of the severe problems, in using
these acids, is corrosion of metallic substrates. Phosphoric acid medium is widely
used for acid cleaning and electro-polishing of aluminium and its alloys (Kuo and
Tsai, 2000; Vargel, 2004; Ghulamullah et al., 2015). Even though dissolution rate of
aluminium in phosphoric acid medium is lower compared to the dissolution in
hydrochloric or sulphuric acid medium, it does corrode aluminium and its alloys and
2
its corrosion is not at all negligible (Fouda et al., 2012; Prabhu and Padmalatha,
2013). Therefore, it is necessary to use inhibitors for controlling the corrosion of
aluminium in phosphoric acid solution during cleaning processes (Amin, 2009;
Fouda et al., 2012; Prabhu and Rao, 2013).
Corrosion inhibitors are compounds that are added in small quantities to an
environment to prevent corrosion of metals. Most of the efficient acid inhibitors are
organic compounds containing nitrogen, sulphur and oxygen atoms in their molecule
(Sastri, 1998; Mahmoud and Ahmed, 2006). Many synthetic organic compounds,
such as triazole derivatives (Khaleed and Al-Qahtani, 2009), Schiff base (Ashassi-
Sorkhabi, et al., 2006), pyridine derivatives (Kliskic et al., 1997), triazine derivatives
(Wang, 2006) are effective corrosion inhibitors in acidic media. Unfortunately, the
synthetic organic compounds cause damage to the environment, toxic to humans and
other living organisms (Gece, 2011). In the past two decades the research in the field
of green inhibitors has been addressed toward the goal of using cheap and effective
with low environmental impact. In an attempt to find corrosion inhibitors that are
environmentally safe, there has been a growing trend in the use of natural products
such as products derived from plants, animals or minerals as corrosion inhibitors for
aluminium in acid-cleaning process (Vargel, 2004; Ghulamullah et al., 2015). The
reason for this is the presence of complex organic species such as tannins,
polyphenols, alkaloids, carbohydrates and proteins as well as their acid hydrolysis
products. Polyphenols, flavonoids and phenolic acids extracted from different plants
have shown to have anticorrosive as well as antioxidant activity (Raja et al., 2008;
Sangeetha et al., 2011). The use of these natural products is more effective and
highly environmentally benign and harmless compared to organic and inorganic
3
inhibitors used in chemical or any industrial applications (Obot et al., 2011; Prabhu
et al., 2013; Sangeetha et al., 2013).
Aside from plants, honey is also a natural product reported to be good for
retarding the corrosion rate of different types of materials in various environments
(El-etre, 1998; Berkovic et al., 2008; Rosliza et al., 2010; Wan et al., 2011). Natural
honey offers interesting possibilities for corrosion inhibition because it is safe,
inexpensive, readily available and highly soluble in water (Berkovic et al., 2008;
Rosliza, et al., 2010). Honey mainly consists of glucose and fructose but also
contains amino acids, phenolic compounds, organic acids, vitamins, minerals, lipids,
enzymes and other phytochemicals (Baltrusaityte et al., 2007; Silva et al., 2013).
Similarly with plant extracts the polyphenolic compounds from honey are considered
as one of the important groups of components identified in honey having
anticorrosive activity. However, the use of stingless bee honey as a corrosion
inhibitor for any metal or alloy has not been reported in the literature. Like natural or
honey from natural honey, hundreds of bioactive substances have already been found
in stingless bee honey from different species in different countries (Oddo et al.,
2008; Silva et al., 2013). Among the compounds with biological activity that are
present in stingless bee honey are the compounds that display antioxidant capacity,
such as phenolic acids, flavonoids and the enzyme glucose oxidase and catalase
(Aljadi and Kamaruddin, 2004). Thus, it was expected for stingless bee honey to
have anticorrosive properties as shown by natural honey.
4
1.2 Problem statement
Corrosion inhibitors are widely used in industry to reduce the corrosion rate
of aluminium and its alloys in contact with aggressive environment. The
environmental toxicity of organic and synthetic corrosion inhibitors have prompted
the search for eco-friendly corrosion inhibitors as they are biodegradable, do not
contain heavy metals, ecologically acceptable, inexpensive, readily available and
renewable. Most eco-friendly corrosion inhibitors are developed based on natural
products such as plants or products derived from plants, animals and minerals.
Although substantial research has been reported on the anti-corrosive of natural
honey on aluminium, works on stingless bee honey have not been reported. Stingless
bee honey contains polyphenolic compounds which have anti-corrosive activities.

5
1.3 Research objectives
The aim of this research is to determine the corrosion inhibition efficiency of
stingless bee honey and its relationship to the phenolic contents and antioxidant
activity. In order to achieve this aim, the research is divided into several objectives:
1. To determine the functional groups in stingless bee and natural honey to identify
the functional group responsible for corrosion inhibition.
2. To determine the phenolic contents and antioxidant activity in both honeys.
3. To study the correlation between polyphenolic contents based on the total
phenolic contents and antioxidant activity of both honeys on the corrosion
inhibition of aluminium alloy in 1 M H3PO4 solution.
4. To determine the corrosion inhibition efficiency of both honeys on the aluminium
alloys in 1 M H3PO4 solution by electrochemical and chemical methods as well
as surface analysis.
5. To evaluate the thermodynamic aspects of inhibitors and adsorption corrosion
inhibition of stingless bee honey on aluminium.
6. To propose the inhibition mechanism based on inhibitors adsorption profile.

6
CHAPTER TWO
LITERATURE REVIEW
2.1 Corrosion
Corrosion is the process of chemical or electrochemical reaction of metals
and its alloys with the environment which causes a destructive effect (Eker and
Yuksel, 2005; Ahmad, 2006). Corrosion process converts the refined metal to more
stable oxide or salts (Manappallil, 2015; Reyes-Tovar, 2015). The degradation of the
useful properties of materials and structures will occur due to the corrosion including
strength, appearance and permeability to liquid and gases. The exposure to moisture
in air caused many structural alloys to corrode. It may form a pit or crack onto the
surface. Corrosion processes are responsible for many bad effects in the industrial
process.
Prevention is the most practical way and achievable than complete
elimination to prevent major accident due to corrosion problem. There are several
accidents due to corrosion. In 1995, there was an explosion due to corrosion through
processing chemicals at the Gaylord Chemical Corporation plant in Bogalusa,
Louisiana. It was caused by a large reddish-brown vapour which was leaking due to
corrosion and released from the tank (Dotson and Jones, 2005). There were also
several accidents due to the pitting corrosion of aircraft and helicopters that may
cause problems in our industry where around 1997, there was a serious incident
caused by corrosion and pitting present in bell helicopter in stringer and fuselage
(Hoeppner et al., 2000). In December 1967, the U.S. Highway 35 Bridge connecting
Point Pleasant, West Virginia and Kanauga, Ohio suddenly collapsed into the Ohio

7
River. From the inspection and investigation from the researchers over the years, it
was caused by the stress corrosion and corrosion fatigue which allowed the crack to
grow and caused failure to the entire structure (LeRose, 2001). All this happened
when the corrosion process was not prevented and minimized. These are the
examples of the fatal accidents due to corrosion that have been reported.
There are several types of corrosion including wet corrosion and dry
corrosion. Wet corrosion of metals occurs involving the process of oxidation and
reduction through electron transfer (Einar, 2004). The oxidation process is the
process of losing electron of the metal atoms as the surrounding environment gains
the electrons in the reduction process. The cathode is metal, liquid or gas which gains
the electrons whilst the metal where electrons are lost is called the anode. Dry
corrosion occurs when there is no water or moisture to accelerate the corrosion
process (Shreir, 2013). There are many factors that showed the corrosiveness of the
environment. The amount of the oxygen or the presence of water and the moisture
could greatly accelerate the rate of the corrosion (Martinez, 2012).
The components involved in the electrochemical corrosion cell are anode,
cathode, electrolyte as well as the electrical conductor which is between the anode
and cathode for the flow of the electric current (Steven, 2016). The electrons can
flow through metal from the anodic to the cathode regions with the presence of the
electrolyte in order to transport ions to or from the metal (Stephen, 2012). The
corrosion will not occur when any of the components is absent.

8
2.2 Techniques in corrosion studies
2.2.1 Weight loss measurement
The weight loss method is well-known and also the simplest technique from
all the corrosion monitoring techniques. This method involves exposing the specimen
of the metal to the process of the environment in a certain time and finally removing
the specimen for analysis (Doua’a, 2015). It is the basic method which is obtained
from the weight loss of the specimen. The corrosion rate may be expressed as the
weight loss taking place over the period of exposure. Several factors should be
considered when the data is obtained. The factors are the size of the immersion
metal, volume of the electrolyte and also the time of immersion (Aisha et al., 2015).
The corrosion rate is calculated in the unit millimetre per year (mm yr-1
) on the basis
of the apparent surface area while the percentage inhibition efficiency (IE %) was
calculated using Equation 2.7 (Tebbji et al., 2011). The immersion time depends on
the condition in the studies. There were several researches that used different
immersion times such as 8 hours (Yiase, et al., 2014), 3 days (El-Etre and Abdallah,
2000) and 60 days (Wan, et al., 2011).
There are several advantages for the weight loss method. This technique is
applicable to all environments and the weight loss may be readily determined and
corrosion rate can be easily calculated. Inhibitor performance can also be easily
assessed and corrosion deposits may be observed and also analysed.
9
2.2.2 Potentiodynamic polarization measurement
The phenomenon of corrosion may be explained in terms of the
electrochemical reactions. Electrochemical technique should be used to study the
phenomenon. The potentiodynamic polarization measurement is the characterization
of the metal specimen by its current-potential relationship in aqueous environment.
Passivation tendencies and effects of the inhibitors or the oxidizers on the specimen
can be easily investigated with this method (Calderon et al., 2015). Thus, the
corrosion characteristic of the metals and alloys can be compared. This technique can
provide significant useful information regarding the corrosion mechanisms, corrosion
rate and susceptibility of specific materials to corrosion in the designated
environment. The term polarization is related to a shift or the change in potential
which is caused by a flow of the current (Linda, 1994). The rate where the anodic or
cathodic take place on the working electrode is the representation of the current.
Once a metal specimen is immersed in a corrosive medium, both the
reduction and oxidation processes will happen on its surface. Ecorr may be defined as
a potential at which the rate of oxidation is exactly equal to the rate of reduction. It
predominates at the expense of the cathodic current when the specimen is polarized
slightly more positive than Ecorr (Zhila, 2015). Obviously, if the specimen is polarized
in the negative direction, the cathodic current predominates and the anodic
component becomes negligible.
There are three important electrodes in this technique which are the working
electrode, an auxiliary electrode and a saturated calomel reference electrode. The
Tafel plot (Figure 2.1) is done on the metal specimen by polarizing the specimen
about 250 mV anodically and cathodically from the corrosion potential, Ecorr. The

10
potential scan rate can be 0.1 – 1.0 mVs-1
. It relates to the potential change with time.
Then, from the extrapolating linear portion of the curve to Ecorr of Tafel plot, the
corrosion current icorr is obtained (Shetty et al., 2016).
Figure 2.1: Tafel plot (Zaki, 2006)
The parameters in the potentiodynamic polarization method are the corrosion
potential, Ecorr, the corrosion current, icorr, the anodic and cathodic Tafel constant (βa
and βc) and corrosion rate (CR). Corrosion rate is defined as the rate of the metal
surface to be corroded. The corrosion rate can be calculated by using this equation:
(2.1)
Where icorr (µA cm-2
) is the corrosion current density, ρ (g cm-3
) is the density of the
corroding metal and Mew (g) is the equivalent weight of the corroding metal.

11
2.2.3 Electrochemical impedance spectroscopy (EIS) measurement
EIS measurement is the other method to evaluate and investigate corrosion
inhibition. This measurement is the laboratory technique to know about the
mechanism for electrochemical reaction and to investigate the passive surface
(Pieterse, 2014). This technique is usually measured by applying an AC potential to
an electrochemical cell and measuring the current through the cell. It is a technique
where a small amplitude signal with voltage between 5 to 50 mV is applied to the
specimen over the range of frequencies (Popkirov et al., 1995). The frequency range
for the corrosion system is usually from 0.001 Hz to 100 kHz.
The important part of this analysis is to create an equivalent circuit for the
system. The interpretation of the electrochemical response is usually in terms of an
equivalent circuit (Zelinka et al., 2009). The common electrochemical circuit is used
to describe a metal or the electrolyte interface (Figure 2.2). As the linear polarization
method is valuable for bare metals in many situations, it is deficient for metals that
are coated with the electricity insulating material and for bare metals which is when
the electrolyte is not very conductive. This problems may solve by EIS method.
Figure 2.2: Equivalent circuit

12
From the figure above, there are three main electrical components which are
represented by Rs, Rp, and Cdl. The relationship between Rp and Cdl is when the
inhibitor concentration increases thus the polarization resistance, Rp will also
increase and double layer capacitance, Cdl will decrease. Therefore, the inhibition
efficiency obtained will increase. The decreasing of the Cdl may be interpreted as the
adsorption of inhibitor onto the electrode surface. Rp is always inversely proportional
to the corrosion current density icorrr. It can be seen through the Stern-Geary relation
(Song and Saraswathy, 2007) as follows:
(2.2)
Where βa and βc is the anodic and cathodic Tafel slopes respectively.
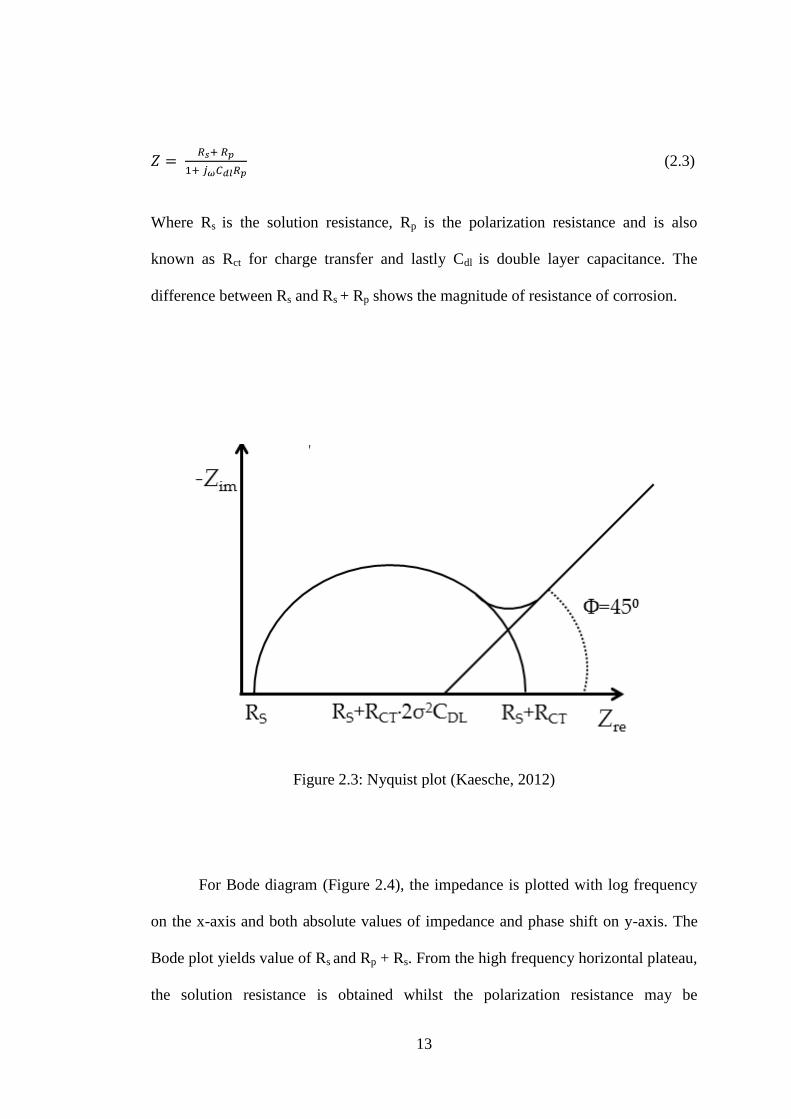
Generally, EIS spectra are plotted in Bode and Nyquist diagrams. For Nyquist
diagram, -Zimaginary is plotted against Zreal and frequency is contained implicitly. A
typical Nyquist plot (Figure 2.3) is known as a complex impedance plane plot. It
shows imaginary versus real impedance component. The resulting semi-circle will
appear on the plot. The solution resistance is read by extrapolating semicircle toward
the left. Then, polarization resistance will be read from the extrapolation semicircle
toward the right (Dawib, 2013). In the Nyquist plot, the impedance can be
represented as a vector of length |Z|. The angle between this vector and the x-axis is
ϕ. The value of parameters such as Rs, Rp and Cdl may be obtained by using the
equation below:
13
(2.3)
Where Rs is the solution resistance, Rp is the polarization resistance and is also
known as Rct for charge transfer and lastly Cdl is double layer capacitance. The
difference between Rs and Rs + Rp shows the magnitude of resistance of corrosion.
Figure 2.3: Nyquist plot (Kaesche, 2012)
For Bode diagram (Figure 2.4), the impedance is plotted with log frequency
on the x-axis and both absolute values of impedance and phase shift on y-axis. The
Bode plot yields value of Rs and Rp + Rs. From the high frequency horizontal plateau,
the solution resistance is obtained whilst the polarization resistance may be

14
determined at low frequency. Lastly, the curve represents a straight line with slop of
-1 at intermediate frequency. The double layer capacitance, Cdl is determined by
extrapolating this line to y-axis.
Figure 2.4: Bode plot (Zaki, 2006)
2.2.4 Pitting corrosion
Pitting corrosion is the important problem which is the root of many
corrosion failures. The surface of the metal is being attacked in small localized area
in the pitting corrosion. The effect from the pitting corrosion is marked even though
very little metal is removed from the pitting corrosion. The metals or alloys which
are exposed to the solution containing aggressive anions, will result in the pitting
corrosion. It leads to the formation of cavities or holes. The pitting corrosion may be
formed through chemistry of the environment as well as the leading condition (Loto,
2013).

15
The potential characteristics are found from the electrochemical studies of the
pitting corrosion. The technique of the cyclic polarization is for the measurement of
the pitting tendencies of a specimen in a given metal-solution system. Stable pits are
formed at the noble potential which is lower than pitting potential Epit to the
repassivation potential Erp. In the cyclic polarization experiment, the potential limit
above which the formation of pitting begins represents Epit while for Erp refers to the
limit below which the metal remains passive. Erp was the potential which the forward
and reverse scan cross. The size of the pitting loop is a rough indication of pitting
tendency. The tendency to pit is larger when the loop is larger (Frankel, 1998).
2.3 Corrosion of aluminium
Aluminium is a metal with good electrical and thermal conductivity despite
the lightweight with density of 2.71 g cm-3
(Gerengi, et al., 2014). At present,
aluminium and its alloy are widely used in many applications such as in the field of
automotive, aerospace, food handling, construction, electrical transmission, and heat
exchange (Oki, et al 2013; Fouda, et al 2014; Al-Mhyawi, 2014). Pure aluminium
had also been known as too soft to be used as a heavy duty material for large
structures. Even though it is too soft, high strength aluminium alloys can be
transformed by adding appropriate alloying elements such as silicon, copper,
magnesium and zinc (Ghoneim, et al., 2012). Aluminium is always alloyed as it
improves the mechanical properties especially when tempered. Physically,
aluminium is a relatively soft, durable, ductile and lightweight metal with appearance
ranging from silvery to dull grey in colour which also depends on the surface
roughness. Despite of all the properties, it is also nonmagnetic and does not easily
ignite. Aluminium is also recyclable which has substantial scrap value and well
established market for recycling, providing for both economic and environmental
16
benefits (Davis, 1999). Chemically, aluminium resists corrosion due to the thin
surface layer of aluminium oxide that is formed when it is exposed to the air.
Unfortunately, in highly acidic solutions, the passivation layer can be destroyed and
corrosion takes place. Thus, corrosion studies of aluminium and aluminium alloys
get so many attention by researchers because it will affect the importance of
technologies and also industrial applications (Ameer, et al., 2012; Hassan and
Zaafarany, 2013; Sangeetha, et al., 2013; Chaubey, et al., 2015).
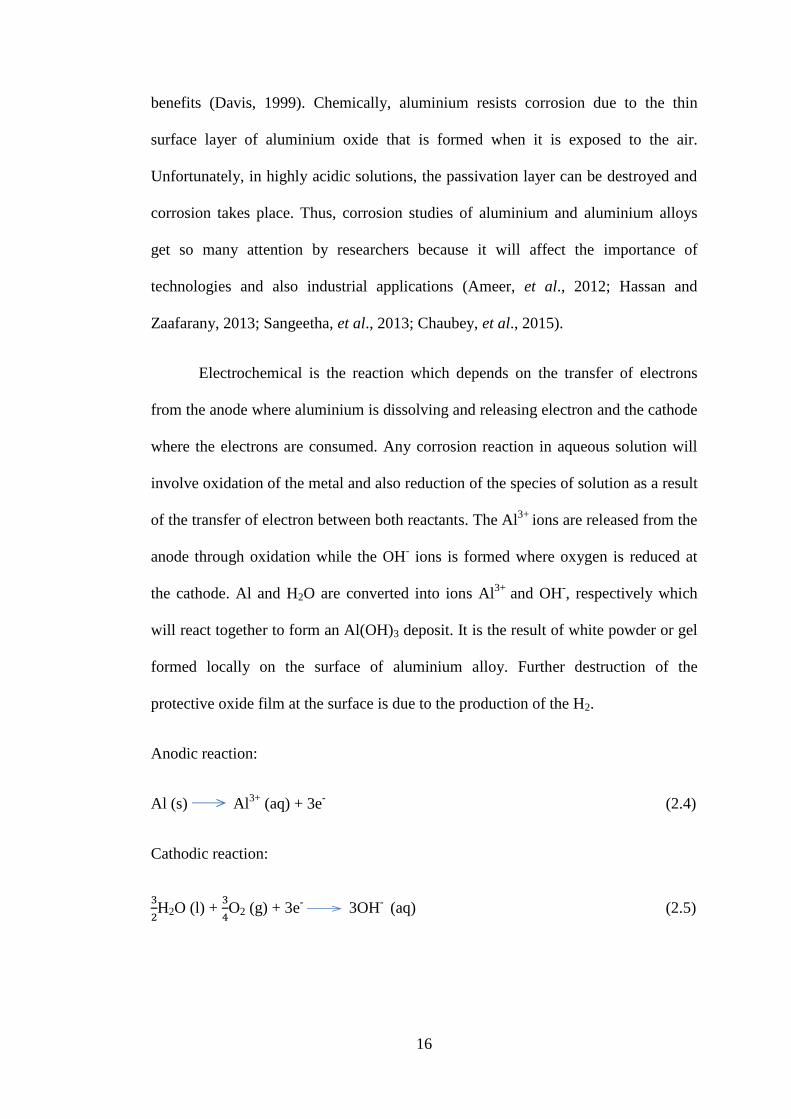
Electrochemical is the reaction which depends on the transfer of electrons
from the anode where aluminium is dissolving and releasing electron and the cathode
where the electrons are consumed. Any corrosion reaction in aqueous solution will
involve oxidation of the metal and also reduction of the species of solution as a result
of the transfer of electron between both reactants. The Al3+
ions are released from the
anode through oxidation while the OH- ions is formed where oxygen is reduced at
the cathode. Al and H2O are converted into ions Al3+
and OH-, respectively which
will react together to form an Al(OH)3 deposit. It is the result of white powder or gel
formed locally on the surface of aluminium alloy. Further destruction of the
protective oxide film at the surface is due to the production of the H2.
Anodic reaction:
Al (s) Al3+
(aq) + 3e- (2.4)
Cathodic reaction:
H2O (l) +
O2 (g) + 3e
- 3OH
- (aq) (2.5)

17
The cathodic reaction represented by Equation 2.4 exemplifies corrosion in natural
environment where corrosion occurs at nearly neutral pH values. In acidic solution,
the cathodic reaction is (Salah et al., 2012):
3H+
(aq) + 3e-
H2 (g) (2.6)
Figure 2.5: Electrochemical mechanism of corrosion aluminium
(Mainier et al., 2014).
The electrons transfer through the metal to the cathode. The combination
between aluminium cation and the hydroxyl anion in the liquid will produce solid
precipitate as in Figure 2.5. Once both anodic and cathodic partial reaction combines,
the aluminium hydroxide is obtained (Equation 2.7 and 2.8). As a result, the white
crystalline corrosion product powder will be formed and found on the surface of
aluminium.
Al3+
(aq) + 3OH
- (aq) Al(OH)3 (s) (2.7)
Al3+
(aq)+3H2O(l) H+(aq)+Al(OH)3(s) (2.8)
18
Hydrogen ions are consumed by the process. The pH in the droplet rises as
the aluminium corrodes. Then, hydroxide ions (OH-) appear in water as the hydrogen
ion concentration falls. Next, they react with aluminium ions to produce insoluble
aluminium hydroxide or green rust.
2.3.1 Corrosion of aluminium in phosphorus acid
Phosphoric acid, H3PO4, is colourless, odourless and also non- volatile with
the syrup consistency solution and also known as orthophosphoric acid and
phosphoric (V) acid. It is one of the major industrial chemicals which is widely used
for the preparation of semiconductors and printed circuit board and also as the
cleaning section in industry (Bank, 1997) . Despite that, H3PO4 is also used to
remove mineral deposits from the process equipment and boilers. Other than that, it
is being used for acid pickling and electro-polishing of aluminium (Amin, et al.,
2009). In the industrial applications, H3PO4 is used in the metal treatment. In metal
treatment, purified phosphoric acid and phosphates are used in the process which is
phosphating metal surface. It is to insulate them electrically and encourages paint to
adhere to the treated surface. Furthermore, H3PO4 is also used in water treatment to
prevent the deposition of lime scale and control the pH of water (Haman, 2015).
H3PO4 which is a weak acid towards aluminium and its alloy has strong
corrosiveness. Due to the strong corrosiveness on aluminium and their alloy, it is
necessary to choose the right methods to control the corrosion of aluminium and also
aluminium alloy in the H3PO4 solution. Nowadays, the protection of metals against
the corrosion is a popular topic among researchers and receives great attention to
prevent bad effects in the industry.
19
2.4 Corrosion protection
Corrosion protection is a method or technique to control the corrosion of a
metal surface. It protects and minimizes the stage of corrosion which is commonly
used for steel, fuel pipelines, tanks, ships and offshore oil platform. The cost and also
the effectiveness of the method chosen to be used should be considered. There are
many alternatives to prevent and minimize corrosion. Generally, there are several
methods for controlling corrosion which involve the application of good design,
materials selection, usage of protection of cathodic and anodic, application of
protective coating layer and also by using corrosion inhibitors (Garverick, 1994). The
corrosion protection can be minimized by using the proper design which include the
material selection, drainage and also the access for maintenance. All the factors to
get the proper design might prevent the corrosion and will minimize corrosion
problem.
Other than that, selecting the material is one of the important methods that
can prevent corrosion (Benjamin et al., 2006). Each industry has different material
selection processes. Thus, with good and proper selecting material the corrosion
protection will be essential for a long term. Next, cathodic protection is a more
effective method to resist corrosion. For this protection, it requires changing the
electrode potential of the metallic article or structure (Graeme, 2005). Therefore, the
base metal is ensured to become the cathodic element of the circuit. Anodic
protection is a potential-control electrochemical technique which usually prevents
corrosion of the metal in the strong acidic or alkaline environment (Edeleanu, 1960).
The other method to prevent corrosion is by applying a coating layer to the
metal. It is called barrier protection which is the oldest and most widely used
20
corrosion protection method. The protection will act by isolating the base metal from
the environment such as paints, the hot-dip galvanized coating which is barrier
protecting the metal (Francis, 2010). It works by coating the metal with a protective
coating that forms a tight barrier to prevent exposure to oxygen, water and salt
(Popoola et al., 2014). Better protection occurs when the permeability of the coating
system to the water is lower. The metal is protected as long as the barrier prevents
corrosion. However, corrosion will begin when the barrier is breached.
Corrosion inhibitors are either organic or inorganic chemicals, formulations
that are added only in a small quantity to the corrosive environment to reduce
corrosion process on the protected surface. There are several matters to be considered
to choose the corrosion inhibitors. The inhibitors must have the ability to reduce the
corrosion rates. Lastly, it must not have side effects especially to the environment
and become environmentally friendly corrosion inhibitor.
2.5 Corrosion inhibitor
In the industry, corrosion is one of the problems that should be solved. This
phenomenon must be controlled to prevent accidents or bad effects. Corrosion
inhibitors are compounds that will decrease the corrosion rate of the material
typically a metal or an alloy when it is combined with a liquid or gas (Anbarasi, et
al., 2013). Generally, inhibitors are substances or mixtures that may prevent or
minimize the corrosion with low concentration and in aggressive inhibited
environment. Preventing corrosive substance to the metal involves the mechanism
for inhibiting corrosion which is usually through the formation of coating often a
passivation layer. The corrosion rate can be reduced through adsorption of molecules
onto the metal surface (Peme, et al., 2015). It can also be reduced by decreasing the
21
diffusion rate for reactants to the surface of the metal. The electrical resistance of the
metal surface should be increased to decrease corrosion rate. There are many factors
to be considered when choosing an inhibitor such as cost and amount, availability
and most importantly, it is safe to the environment. However, at present, many
corrosion inhibitors show secondary effects that will damage the environment. Thus,
the research community began searching for friendly environmentally friendly
inhibitors such as organic inhibitors (Rani et al., 2012; Palou et al., 2014).
In the mechanism of the inhibitor, the inhibitor is chemically adsorbed onto
the surface of the metal and will form a protective thin film. It will lead to the
formation of a film by the oxide protection of the base metal. Many systems and
commercial applications use inhibitors such as in cooling system, water processing,
paints, oil and gas production units and refinery units (Saji, 2010). The development
of corrosion inhibitor technology is widely used since the 1950’s and 1960’s (Sheeja,
2016). However, some of the inhibitors have high toxicity which is related to the bad
environmental effects and health problems. Due to these reasons, strict international
laws were imposed and the corrosion inhibitor must be reduced. Thus, researchers
develop organic inhibitors which are environmentally friendly.
2.5.1 Types of inhibitors
Corrosion inhibitors can be classified according to the types of materials to be
protected. For example in the oil refining processes, it must be of special interest for
carbon steel which has a major component of iron. It must also inhibit copper-zinc
alloys which is the most common materials used in the design of refineries
(Aliofkhazraei, 2014). Other than that, corrosion inhibitors can be classified as
anodic and cathodic inhibitors. Anodic inhibitors inhibit oxidation of the metal while

22
cathodic inhibitors inhibit the reduction of oxygen and hydrogen. Both processes
represent mixed inhibitors. Lastly, it can be categorized according to the types of
compound that forms the active ingredient in the formulation which is inorganic or
organic corrosion inhibitors. There are various organic and inorganic inhibitors such
as molybdates, phosphonates, silicates and triazoles (Antonijevic and Petrovic, 2008).
Inorganic inhibitors are the ones that have active substance of inorganic
compound. Application of organic compounds and natural products as corrosion
inhibitors are the best alternative to the more toxic inorganic compounds
(Ghulamullah et al., 2015). Chromium is example of the inorganic inhibitor which
widely used as a potential corrosion inhibitor due to their higher efficiency
(McCafferty, 1979, 1989). In spite of their advantage as corrosion inhibitor,
chromates exhibit high toxicity and it is prohibited to be used in industrial
application in high amount (Kesavan et al., 2012).
Organic inhibitor is a compound that has large molecular weight with the
presence of heteroatom group. The examples of heteroatom group are nitrogen,
oxygen, and also sulphur. Organic inhibitors which are from the flavonoids, alkaloids
and other natural products obtained from natural sources like plants is called as
natural organic inhibitors. The natural organic inhibitors are also efficient for metal
corrosion inhibition. It all depends on the metals, the electrolyte used and also the
types of plants itself. The examples of the natural organic inhibitors are natural
honey (El-Etre and Abdallah, 2000), Lupinous albus L. (Abdel-Gaber et al., 2009),
artemisia oil (Benabdellah et al., 2006), lawsonia (El-Etre et al., 2005), Papaia,
Poinciana pulcherrima, Cassia occidentalis and Datura stramonium seeds (Zucchi
and Mashi, 1985), Delonix regia extract (Abiola et al., 2007) and Ocimum basilicum
extract (Oguzie et al., 2006). Other than that, some organic inhibitors also include

23
synthetic compound with negligible toxicity. Synthetic organic inhibitor is capable of
bringing harm to the environment by the toxicity (Wan et al., 2011). Most of them
are highly toxic which may cause bad impact to human and also the environment.
From previous researches, there are many examples of synthetic compound which
are used as an inhibitor such as indole derivatives (Dudukcu et al., 2004), 2-
hydrazino-6-methyl-benzothiazole (Ajmal et al., 1994), thiophene derivatives (Galal
et al., 2005), hexadecyl pyridinium bromide (HPB) and hexadecyl trimethyl
ammonium bromide (HTAB) (El-Maksoud, 2004), polyaniline and poly (o-
methoxyaniline) (Kilmartin et al., 2002) and 2,5-bis(n-methoxyphenyl)-1,3,4-
oxadiazoles (Bentiss et al., 2002).
Due to the bad effect towards the environment, the researchers now focus on
the environmentally friendly corrosion inhibitors. From the view point of economic
and the environment, the natural product and plant extracts are an excellent
alternative as inhibitors due to the biodegradability and availability. The inhibitor is
efficient due to its compatibility with the environment, economical for application
and can produce the desired effect when presented in small concentrations. The
inhibitor efficiency (IE %) can be measured with the given equation (Taleb et al.,
2011) :
(2.9)
Where is the corrosion rate in the absence of inhibitor while W is the corrosion
rate in the presence of inhibitor.
2.6 Adsorption process

24
In recent years, the development of the natural organic inhibitors becomes
popular among researchers due to the eco-friendly effect especially to the
environment. The important process for the chemical reaction is the process of
adsorption. The process of adsorption on metal surface is through blocking the active
sites by displacing water molecules and forming a compact barrier film which is to
decrease the corrosion rate (Obot and Obi-Egbedi, 2010). According to Ahamad and
Quraishi (2009), the adsorption of inhibitors on metal or solution interface is
influenced by the nature and surface charge of metal, the type of the aggressive
electrolyte and chemical structure of the inhibitors.
The process that involves charge sharing or charge transfer between the
inhibitor molecules and the metal surface is called chemisorption. It is a slow
reaction compared to the physical adsorption (Al-Azzawi and Hammud, 2014). The
electron transfer is typical for the transition metal that has low energy electron
orbitals. In the chemisorption, electron will be transferred by the compounds that
have relatively loose band electrons. Chemisorption is the most effective process
rather than physically adsorbed. As the temperature increases, adsorption and
inhibition will decrease. It is also specifically but not completely reversible (Sastri,
1998).
Physically adsorbed inhibitors will interact rapidly but they are easily
removed from the surface. This adsorption is caused by the electrostatic force which
exists between ionic charges or dipoles on inhibitor. Physisorption is also caused by
the electrostatic charge at the metal surface. Generally, the electrostatic adsorption
force is relatively weak and has low activation energy. The increase in temperature
will facilitate desorption of physically adsorbed inhibitor molecules. The molecules
of water will be adsorbed to the metal surface which is immersed in an aqueous