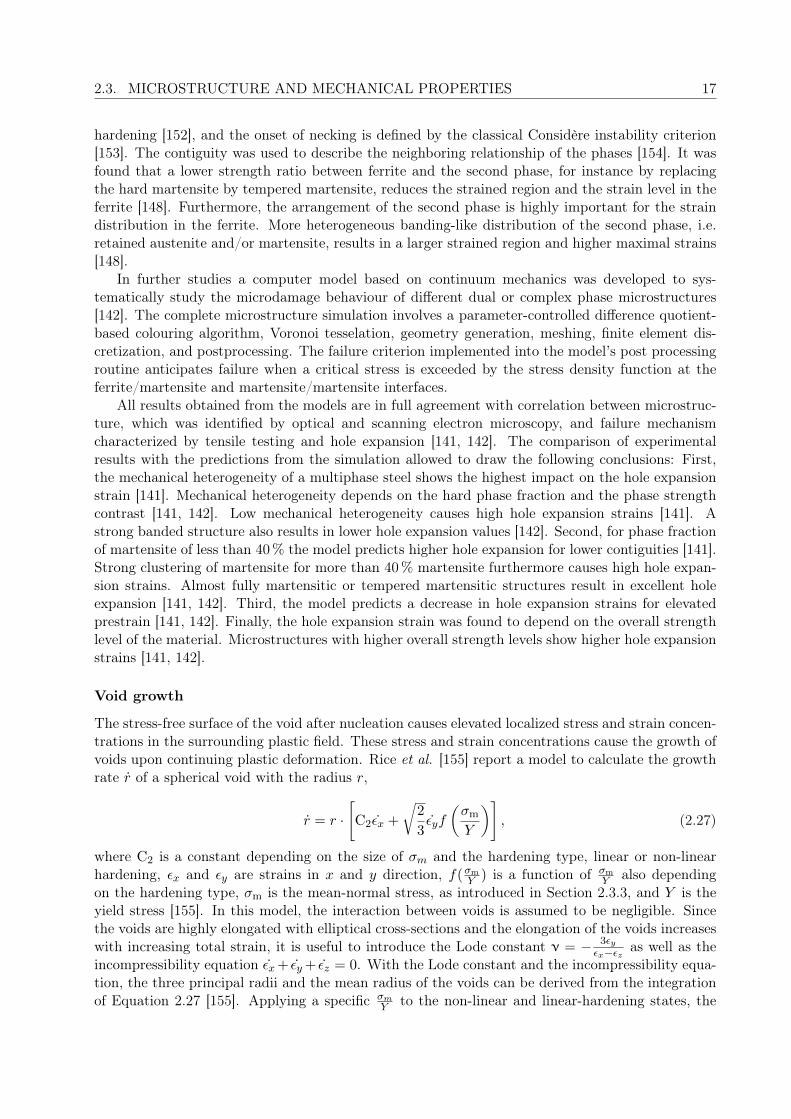
trip-assisted thin sheet steel with a bainitic and/or ... · a strength reduction of the matrix and...
TRANSCRIPT

TECHNISCHE UNIVERSITÄT MÜNCHEN
Fakultät für MaschinenwesenLehrstuhl für Werkstoffkunde und Werkstoffmechanik
mit Materialprüfamt für den Maschinenbau
TRIP-assisted Thin Sheet Steelwith a Bainitic and/or Martensitic Matrix
Effects of Alloying Elements and Heat Treatment onPhase Transformations, Microstructures, and Mechanical Properties
Katharina Maria Angelika Hausmann
Vollständiger Abdruck der von der Fakultät für Maschinenwesen der Technischen Universität
München zur Erlangung des akademischen Grades eines
Doktor-Ingenieurs (Dr.-Ing.)
genehmigten Dissertation.
Vorsitzender: Univ.-Prof. Dr.-Ing. Markus Lienkamp
Prüfer: 1. Univ.-Prof. Dr. mont. habil. Dr. h. c. Ewald Werner
2. Univ.-Prof. Dr.-Ing. Wolfgang Bleck, RWTH Aachen
Die Dissertation wurde am 15.10.2014 bei der Technischen Universität München eingereicht und
durch die Fakultät für Maschinenwesen am 13.03.2015 angenommen.

Meiner Familie gewidmet...To my family...
ii

Danksagung
Zuallererst danke ich Herrn Prof. Dr. Ewald Werner, Inhaber des Lehrstuhls für Werkstoffkunde undWerkstoffmechanik an der Technischen Universität München, für die Unterstützung und Förderungdieser Arbeit und die Übernahme des Hauptreferats. Herrn Prof. Dr. Wolfgang Bleck, Leiter desInstituts für Eisenhüttenkunde an der Rheinisch-Westfälischen Technischen Hochschule Aachen,danke ich für die Übernahme des Koreferats.
Mein besonderer Dank gilt Herrn Dr. Andreas Pichler, Leiter der Forschung und EntwicklungBusiness Unit Band der voestalpine Stahl GmbH, für die Möglichkeit, an diesem Thema arbeitenund durch viele interessante Diskussionen und Anregungen von ihm lernen zu dürfen. Ich dankeHerrn Dr. Daniel Krizan, Projektleiter der Werkstoffentwicklung Kaltband voestalpine Stahl GmbH,besonders für die Einführung in das Thema und die Erfahrungsweitergabe.
Für die finanzielle Unterstützung und die Möglichkeit, in Forschung, Entwicklung und Produktionzu arbeiten, danke ich der voestalpine Stahl GmbH. Der gesamten Forschungsgruppe gilt meinDank für das ausgezeichnete Arbeitsklima und die ständige Bereitschaft zu Diskussionen undErfahrungsaustausch. Ich danke den engagierten Mitarbeitern der Werkstoffentwicklung, der Prüf-technik und Analytik sowie der Umformtechnik der voestalpine Stahl GmbH für die Hilfsbereitschaft,die qualitativ hochwertigen Untersuchungen und die fachlichen Diskussionen. Allen Beteiligtendanke ich für die konstruktive Zusammenarbeit bei der Produktion der Stahlgüten. Schließlich dankeich der Alloy Development Group Seibersdorf für die Unterstützung bei den TEM-Untersuchungen.
iii

Zusammenfassung
Stahlfeinblech mit bainitischem und/oder martensitischem Gefüge und Restaustenit gewinnt in derAutomobilindustrie auf Grund seines Potentials zur Verringerung des Treibstoffverbrauchs von Fahr-zeugen zunehmend an Bedeutung. Die hohe Festigkeit dieser Stähle der dritten Generation der ad-vanced high strength steels (AHSS) ermöglichen die Massereduzierung von Fahrzeugen bei Erhaltungoder Verbesserung der Sicherheitsstandards. Ein wesentlicher Vorteil von Stahl mit bainitischemund/oder martensitischem gegenüber polygonal-ferritischem Gefüge ist die geringerer Kantenriss-empfindlichkeit und das dadurch verbesserte Crashverhalten. Der Restaustenit erhöht die Dehnungund verbessert somit die Tiefziehbarkeit des Stahls. Viele bisher entwickelten TRIP-assisted bainitic-ferritic (TBF) und Quench- und Partitioning (Q&P)-Stähle enthalten 1,5Massenprozent Siliziumzur Verhinderung der Zementitausscheidung insbesondere während der Auslagerung. Bei der Pro-duktion von Stählen mit diesem Siliziumgehalt wurde jedoch eine Oxidschicht auf den Walzen undden nachfolgenden Stahlbändern beobachtet.
Ziel der vorliegenden Arbeit war die Entwicklung und die industrielle Herstellung bainitischerund/oder martensitischer Stähle mit Restaustenit der dritten Generation der AHSS und einemSiliziumgehalt von weniger als 1Massenprozent. Dazu wurde der Einfluss des Legierungskonzeptsund der Wärmebehandlung auf das Gefüge und die mechanischen Eigenschaften von TBF undQ&P-Stählen untersucht.
Die Ergebnisse dieser Arbeit zeigen, dass TBF und Q&P-Stähle mit geringeren Siliziumgehaltenals bisher üblich bei geschickter Wahl der restlichen Zusammensetzung und der Wärmebehandlungähnliche Kombinationen an Festigkeit, Dehnung und Lochaufweitung aufweisen können. Durch dieZugabe von Mangan wird für niedrige Auslagerungstemperaturen ein höherer Restaustenitanteil er-zielt. Durch die Zugabe von Niob wird das Gefüge verfeinert, die Umwandlung beschleunigt und dieMorphologie des Bainit geändert. Das Absenken der Abschrecktemperatur führt zu größerer Loch-aufweitung. Mit geringen Mengen polygonalen Ferrits kann der Restaustenitanteil und die Dehnungbei gleicher Festigkeit erhöht werden, ohne dabei die Lochaufweitung wesentlich zu verringern. Dieim Rahmen dieser Arbeit gewonnenen Erkenntnisse flossen in die industrielle Produktion von TBFund Q&P-Stählen einer Zugfestigkeit von 980 und 1180MPa ein.
iv

Abstract
As part of the third generation of advanced high-strength steels (AHSS) TRIP-assisted steels havebeen developed to improve vehicle fuel economy and passenger safety. In 2013, TRIP-assisted steelswith bainitic and/or martensitic matrix with a tensile strength of 1180MPa were adopted by aJapanese automobile manufacturer. The main advantage of the new steel grades is their excellentstretch-flangeability and improved crash performance compared to TRIP-assisted steels with polyg-onal ferritic matrix. The commercialized TRIP-assisted bainitic-ferritic (TBF) and Quench andPartitioning (Q&P) steels comprise a silicon content of 1.5mass% to avoid cementite formationduring overaging. This silicon content results in a silicon oxide layer that is picked up by the rollson the production line and causes undesirable indentations on the following sheet surface.
In the present work, TBF and Q&P steels with a silicon content below 1mass% and a tensilestrength of 980MPa and 1180MPa were systematically investigated. The effect of alloying conceptsand heat treatments on phase transformations, microstructures, and mechanical properties wasstudied in detail. The results of this work show that for specific alloying concepts and heat treat-ments, TBF and Q&P steels with reduced silicon contents can exhibit combinations of strength,elongation, and hole expansion strain which are similar to those of the steels with conventionalsilicon contents. Higher amounts of manganese result in higher amounts of retained austenite forlow overaging temperatures. The addition of niobium refines the microstructure, accelerates thephase transformations, and changes the morphology of the bainite. A lower quench temperatureresults in higher hole expansion strain. The introduction of small amounts of polygonal ferriteinto the microstructure can enhance the amount of retained austenite and elongation for the samestrength level without affecting the hole expansion strain. On the basis of laboratory investigations,new alloying and processing strategies for TBF and Q&P steels were developed in order to yieldenhanced combinations of strength, elongation, and stretch-flangeability. The newly designed 980and 1180MPa grades were successfully produced in the industrial line.
v

vi

Contents
1 Introduction 1
2 Literature 52.1 TBF and Q&P steels . . . . . . . . . . . . . . . . . . . . . . . . . . . . . . . . . . . . 52.2 Alloying elements in TBF and Q&P steels . . . . . . . . . . . . . . . . . . . . . . . . 8
2.2.1 Carbon . . . . . . . . . . . . . . . . . . . . . . . . . . . . . . . . . . . . . . . 82.2.2 Silicon . . . . . . . . . . . . . . . . . . . . . . . . . . . . . . . . . . . . . . . . 92.2.3 Manganese . . . . . . . . . . . . . . . . . . . . . . . . . . . . . . . . . . . . . 92.2.4 Chromium . . . . . . . . . . . . . . . . . . . . . . . . . . . . . . . . . . . . . . 102.2.5 Niobium . . . . . . . . . . . . . . . . . . . . . . . . . . . . . . . . . . . . . . . 10
2.3 Microstructure and mechanical properties . . . . . . . . . . . . . . . . . . . . . . . . 112.3.1 Strength and strengthening mechanisms . . . . . . . . . . . . . . . . . . . . . 112.3.2 Strain-hardening behaviour . . . . . . . . . . . . . . . . . . . . . . . . . . . . 122.3.3 Failure mechanism . . . . . . . . . . . . . . . . . . . . . . . . . . . . . . . . . 16
3 Experimental Procedure 193.1 Laboratory production of annealed sheets . . . . . . . . . . . . . . . . . . . . . . . . 19
3.1.1 Material . . . . . . . . . . . . . . . . . . . . . . . . . . . . . . . . . . . . . . . 193.1.2 Production of cold-rolled sheets . . . . . . . . . . . . . . . . . . . . . . . . . . 193.1.3 Annealing cycles . . . . . . . . . . . . . . . . . . . . . . . . . . . . . . . . . . 213.1.4 Laboratory annealing of industrially cold-rolled sheets . . . . . . . . . . . . . 21
3.2 Industrial production of annealed sheets . . . . . . . . . . . . . . . . . . . . . . . . . 223.2.1 Material . . . . . . . . . . . . . . . . . . . . . . . . . . . . . . . . . . . . . . . 223.2.2 Production of cold-rolled sheets . . . . . . . . . . . . . . . . . . . . . . . . . . 233.2.3 Annealing cycles . . . . . . . . . . . . . . . . . . . . . . . . . . . . . . . . . . 23
3.3 Microstructure characterization and mechanical testing . . . . . . . . . . . . . . . . . 233.3.1 Metallography . . . . . . . . . . . . . . . . . . . . . . . . . . . . . . . . . . . 233.3.2 Magnetic measurements . . . . . . . . . . . . . . . . . . . . . . . . . . . . . . 253.3.3 X-ray diffraction . . . . . . . . . . . . . . . . . . . . . . . . . . . . . . . . . . 263.3.4 Dilatometry . . . . . . . . . . . . . . . . . . . . . . . . . . . . . . . . . . . . . 263.3.5 Mechanical testing . . . . . . . . . . . . . . . . . . . . . . . . . . . . . . . . . 27
4 Results 294.1 Influence of alloying elements on TBF and Q&P sheet steel . . . . . . . . . . . . . . 29
4.1.1 Silicon in the 980 grade . . . . . . . . . . . . . . . . . . . . . . . . . . . . . . 294.1.2 Silicon in the 1180 grade . . . . . . . . . . . . . . . . . . . . . . . . . . . . . . 334.1.3 Manganese in the 980 grade . . . . . . . . . . . . . . . . . . . . . . . . . . . . 364.1.4 Manganese in the 1180 grade . . . . . . . . . . . . . . . . . . . . . . . . . . . 394.1.5 Chromium in the 980 grade . . . . . . . . . . . . . . . . . . . . . . . . . . . . 43
vii

viii CONTENTS
4.1.6 Chromium in the 1180 grade . . . . . . . . . . . . . . . . . . . . . . . . . . . 464.1.7 Niobium in the 980 grade . . . . . . . . . . . . . . . . . . . . . . . . . . . . . 504.1.8 Niobium in the 1180 grade . . . . . . . . . . . . . . . . . . . . . . . . . . . . . 59
4.2 Influence of annealing cycle on TBF and Q&P sheet steel . . . . . . . . . . . . . . . 624.2.1 Quench temperature . . . . . . . . . . . . . . . . . . . . . . . . . . . . . . . . 624.2.2 Time at quench temperature . . . . . . . . . . . . . . . . . . . . . . . . . . . 654.2.3 Intermediate holding . . . . . . . . . . . . . . . . . . . . . . . . . . . . . . . . 674.2.4 Intercritical annealing . . . . . . . . . . . . . . . . . . . . . . . . . . . . . . . 68
4.3 Failure mechanisms . . . . . . . . . . . . . . . . . . . . . . . . . . . . . . . . . . . . . 704.3.1 Void nucleation and growth . . . . . . . . . . . . . . . . . . . . . . . . . . . . 704.3.2 Fracture surface characterization . . . . . . . . . . . . . . . . . . . . . . . . . 72
4.4 Industrial trials on 1180 MPa Q&P sheet steel . . . . . . . . . . . . . . . . . . . . . . 76
5 Discussion 815.1 Phase transformations, microstructures, and mechanical properties:
A general overview . . . . . . . . . . . . . . . . . . . . . . . . . . . . . . . . . . . . . 815.1.1 Phase transformation kinetics . . . . . . . . . . . . . . . . . . . . . . . . . . . 815.1.2 Microstructure and the amount of retained austenite . . . . . . . . . . . . . . 825.1.3 Mechanical properties . . . . . . . . . . . . . . . . . . . . . . . . . . . . . . . 86
5.2 Influence of alloying elements on TBF and Q&P sheet steel . . . . . . . . . . . . . . 885.2.1 Silicon . . . . . . . . . . . . . . . . . . . . . . . . . . . . . . . . . . . . . . . . 885.2.2 Manganese . . . . . . . . . . . . . . . . . . . . . . . . . . . . . . . . . . . . . 925.2.3 Chromium . . . . . . . . . . . . . . . . . . . . . . . . . . . . . . . . . . . . . . 995.2.4 Niobium . . . . . . . . . . . . . . . . . . . . . . . . . . . . . . . . . . . . . . . 102
5.3 Influence of annealing cycle on TBF and Q&P sheet steel . . . . . . . . . . . . . . . 1075.3.1 Quenching . . . . . . . . . . . . . . . . . . . . . . . . . . . . . . . . . . . . . . 1075.3.2 Impact of polygonal ferrite . . . . . . . . . . . . . . . . . . . . . . . . . . . . 109
5.4 Failure mechanisms . . . . . . . . . . . . . . . . . . . . . . . . . . . . . . . . . . . . . 1105.5 Industrial trials on 1180 MPa Q&P sheet steel . . . . . . . . . . . . . . . . . . . . . . 112
6 Summary 115
Bibliography 119

Chapter 1
Introduction
The growing interest in vehicle safety, fuel economy and performance standards gives rise to thedevelopment of new materials. Sheet steel remains the first choice of new light-weight materials forautomotive applications, as it offers the advantages of excellent formability, high strength, outstand-ing crash performance, and reasonable costs. To stay ahead of the mounting economic challengesin the automotive industry, steel research and development experts have made great effort to im-prove the mechanical properties of sheet steel. As a result, the introduction of so-called advancedhigh-strength steels (AHSS) began in the late 1990s [1]. Since this time various AHSS grades havebeen successfully produced and adopted by automobile manufacturers, and their use has increasedconsiderably in recent years. The share of AHSS in newly designed cars averages approximately 18to 20% and is expected to grow significantly in the near future.
Conventional high-strength steel (HSS), including bake hardening steel, high-strength IF steels,and microalloyed steel enable tensile strengths of up to approximately 600MPa. Solid solutionhardening, precipitation strengthening, and grain refinement are strengthening mechanisms of thesesteels. To achieve higher strength levels it is necessary to change the microstructure constituents.This was accomplished by the implementation of dual phase (DP) steels [2, 3]. The combination ofhard martensitic inclusions embedded in a soft ferritic matrix enables significantly higher strengthlevels compared to conventional HSS.
However, a strength increase is accompanied by a loss in elongation as long as no new physicalmechanism comes into play. With the exploitation of transformation-induced plasticity (TRIP) thisnatural reciprocal correlation is broken by adding elongation through strain-induced martensitetransformation (SIMT) [4].
At the beginning of development of the first AHSS, attention was focused on high elongationsin combination with high strength. However, the comparably low edge crack resistance of DPsteels can result in cracks during the forming of automotive parts [5]. In addition, reduced edgeformability can impair the crash performance of specific car components [6]. Investigations onthe crash behaviour have shown that advanced bending and hole expansion properties are highlyimportant for crash performance of AHSS [3, 7, 8]. As attention was shifted from deep drawabilityand stretch formability towards edge crack susceptibility and crash performance, complex phase(CP) steels began to emerge. With a microstructure of small amounts of martensite, retainedaustenite and sometimes ferrite/pearlite embedded in a bainitic matrix, much higher yield strengthsand hole expansion values can be achieved. DP, TRIP, and CP steels are often referred to as thefirst generation AHSS [1, 9].
Further improvement in favourable strength-ductility combinations were achieved by fully austeniticmicrostructures, which can be achieved by a high manganese content of 12 to 35mass%. Twinning-induced plasticity (TWIP), Duplex, and Triplex steels, known as the so-called second generation
1
2 CHAPTER 1. INTRODUCTION
AHSS, offer mechanical properties superior to those of the first generation AHSS [10, 11]. In addi-tion, some second generation AHSS grades contain high aluminum content, which can reduce thevehicle mass through lower steel density. The stacking fault energy of the austenite, which dependson the composition of the steel, decides the transformation mechanism. TWIP steels exhibit out-standing combinations of strength and elongation, as a result of their plasticity-induced twinning[11]. Duplex steels transform from austenite to hexagonal martensite to near cubic martensite [12].In Triplex steels the austenite hardens via shear-band-induced plasticity, however, no strain-inducedε-martensite is formed, since the austenite is very stable [10]. However, second generation AHSS areunfavourable for the automotive industry primarily because of their high alloying and processingcosts.
Most recently, evolution in AHSS has brought about a third generation, including TRIP-assistedbainitic ferrite (TBF) and quench and partitioning (Q&P) steels. These steels contain retainedaustenite to utilize the TRIP effect embedded in a harder matrix compared to their predecessors[13–16]. The microstructure of these steels consists of retained austenite inclusions embedded in abainitic and/or (tempered) martensitic matrix. Variations in alloying elements and heat treatmentcan be used to adjust the strength of the matrix and the amount of retained austenite to obtainthe desired mechanical properties. High quench and overaging temperatures, for instance, result ina strength reduction of the matrix and can promote the amount of retained austenite enhancingstrain hardening and elongations. Quenching and/or overaging at lower temperatures leads to aharder matrix that improves the toughness of the steel.
In the past decade, TBF and Q&P steels were the object of extensive research [17–21]. How-ever, fundamental questions regarding the influence of alloying elements and heat treatment onmicrostructure and mechanical properties remained unanswered. Even though manganese has longbeen used to stabilize the austenite, lower the austenitizing (A3) temperature, and enhance solidsolution strengthening, the effects of manganese on the transformation kinetics and therefore themorphology of bainite are not fully understood [2, 22–25]. Furthermore, since polygonal ferrite isavoided in TBF and Q&P steels, the influence of small amounts of polygonal ferrite in a mainlybainitic and/or (tempered) martensitic microstructure containing retained austenite has not beenstudied. Fracture mechanics and damage of DP steels have been thoroughly investigated, while anin-depth understanding of the mechanisms occurring during plastic deformation of TBF or Q&Psteels is still missing. The effect of microalloying in TBF steels has been addressed by Sugimoto etal. [26, 27]. However, several questions remained. A high silicon content of 1.5mass% was estab-lished early on in TBF and Q&P steels due to its highly relevant role in stabilizing the austeniteby preventing carbon precipitation [13, 28]. High silicon content, however, results in detrimentalsilicon-oxides on the strip surface.
The goal of this work is to gain fundamental understanding of industrially produced TBF andQ&P sheet steels designed for a tensile strength of 980 and 1180MPa. A major challenge of thesethird-generation AHSS steels is the prevention or reduction of the silicon-oxide layer on the stripsurface. This study aims to reduce the silicon content of these steels to below 1.0mass% andchromium is used to partially substitute silicon in its function to prevent carbon precipitation.
To achieve a cost-effective production of cold-rolled TBF and Q&P steels, this study is specif-ically aimed at adapting the chemical composition to the specific setup and equipment of theindustrial production line. A key challenge of the present work is to develop a better understandingof the effect of carbon, silicon, manganese, chromium, molybdenum and niobium on phase trans-formations, microstructures, and mechanical properties via systematic laboratory studies. The goalof this study is to achieve the industrial realization of the sheet steel by developing an alloyingconcept based on the influence of selected variations in the annealing cycle. The quenching andoveraging parameters are varied in order to evaluate the capability of the steel to form desirableamounts of retained austenite with favourable stability. To characterize the microstructure the

3
steels are investigated using optical microscopy and scanning electron microscopy. Transmissionelectron microscopy experiments are conducted to reveal more detailed insight into bainite mor-phology as well as carbide size and distribution. This work aims to gain an in-depth understandingof phase transformation kinetics from continuous and isothermal dilatometer experiments supportedby thermodynamic calculations on the phase stability in para-equilibrium condition.
Tensile tests and hole expansion tests are conducted in order to correlate microstructures, phasetransformations, and mechanical properties. Since high impact on edge formability is expected dueto polygonal ferrite in the microstructure and phase transformations, the influence of annealingand intermediate holding experiments on hole expansion properties is investigated. It is envisionedthat gaining an in-depth understanding of the fracture mechanics and damage behaviour of thesteel provided by quantitative and qualitative void analysis will ultimately help steel producers tofurther improve the mechanical properties of the sheet steel.
The goal of this work was to choose the most advanced alloying concept and annealing cycle forthe industrial achievement of 980 and 1180MPa grades based on the results from fine tuning in thelaboratory. This study aims to adopt the newly designed TBF and Q&P steels to the industrialproduction line.

4 CHAPTER 1. INTRODUCTION

Chapter 2
Literature
2.1 TBF and Q&P steels
TRIP-assisted steels have been under development since 1985 in an effort to significantly reducevehicle mass using materials with high strength and elongation [29–33]. The excellent stretch-formability of these steels facilitated the deep drawing and press forming of the automotive parts.However, it was found that the stretch-flangeability of TRIP steels with ferritic matrix is insufficientand requires improvement for some car components [13, 34, 35]. Bainitic steels, by contrast wereknown for their outstanding edge formability as a result of their fine uniform lath structure [36].In order to overcome the drawback in stretch-flangeability of TRIP-assisted steels, Sugimoto et al.proposed in 2000 a replacement of the ferrite matrix with bainite, thus introducing a new steel type,the TRIP-assisted Bainitic-Ferritic sheet steel [13, 35].
In 2003, Speer et al. introduced a new process route termed Quenching and Partitioning toproduce a new type of advanced high-strength steel grade [37]. This process route involves fullaustenitization of the cold-rolled sheets, quenching between martensite start (Ms) and martensitefinish (Mf) and overaging either at this quench temperature or at a higher temperature. Thefinal microstructure consists of at least tempered martensite from the initial quenching, retainedaustenite enriched in carbon during overaging, and small amounts of fresh martensite formed duringfinal cooling. In addition, cementite can precipitate and bainite can form during overaging. A modelwas established based on constrained para-equilibrium describing the amount of retained austeniteas a function of quench temperature. The model accounts for carbon partitioning from the as-quenched supersaturated martensite to the retained austenite [37–40]. The amount of bainite isneglected in this model because of the large martensite fraction. On the basis of this model thepotential of the mechanical properties of Q&P steels for the automotive industry was evaluatedwith respect to strength and elongation [21, 41–43].
Q&P steels were developed under different circumstances and motives, in spite of their similarityto TBF steels. Research on Q&P steel focused on the understanding of the Quench and Partitioningprocess on a scientific level [37–40]. In TBF steel research, a great deal of attention has been given tothe properties of the bainitic matrix, as implied by the denomination TBF, TRIP-assisted BainiticFerrite, as a consequence of efforts to improve stretch-flangeability and later on crash performance,while maintaining the TRIP effect [13, 34, 35]. The intention in Q&P steel development, on theother hand, was to maximize the TRIP effect. Due to its significant strain-hardening potential, theTRIP effect was subject to growing interest. In Q&P steel research, the retained austenite inclusionsthemselves and the enhancement of their stability through carbon enrichment were at the center ofinterest rather than the matrix properties and the interplay between matrix and inclusions [39–41].
TBF and Q&P steels comprise 0.15 to 0.3mass% carbon, 1.5mass% silicon, and 1.5 to 2.5mass%
5
6 CHAPTER 2. LITERATURE
manganese. The strength of martensite is proportional to the carbon content [44, 45]. Lower bainiteexhibits a higher strength than upper bainite due to its finer lath structure and its greater dislo-cation density, but also because finely dispersed cementite particles are located within the bainitelaths of lower bainite, whereas coarser cementite particles are precipitated between the upper bai-nite laths [46]. Further, carbon is of great importance for the amount and stability of the retainedaustenite [28, 39, 47]. Silicon plays a crucial role in preventing carbon from precipitating in theform of carbides [48–52]. The addition of manganese is valuable for TBF and Q&P steels to de-celerate phase transformations and in particular to avoid the formation of polygonal ferrite [2, 53].The following section, Section 2.2, provides a more detailed description of the alloying elements’influence on phase transformations, microstructures, and mechanical properties.
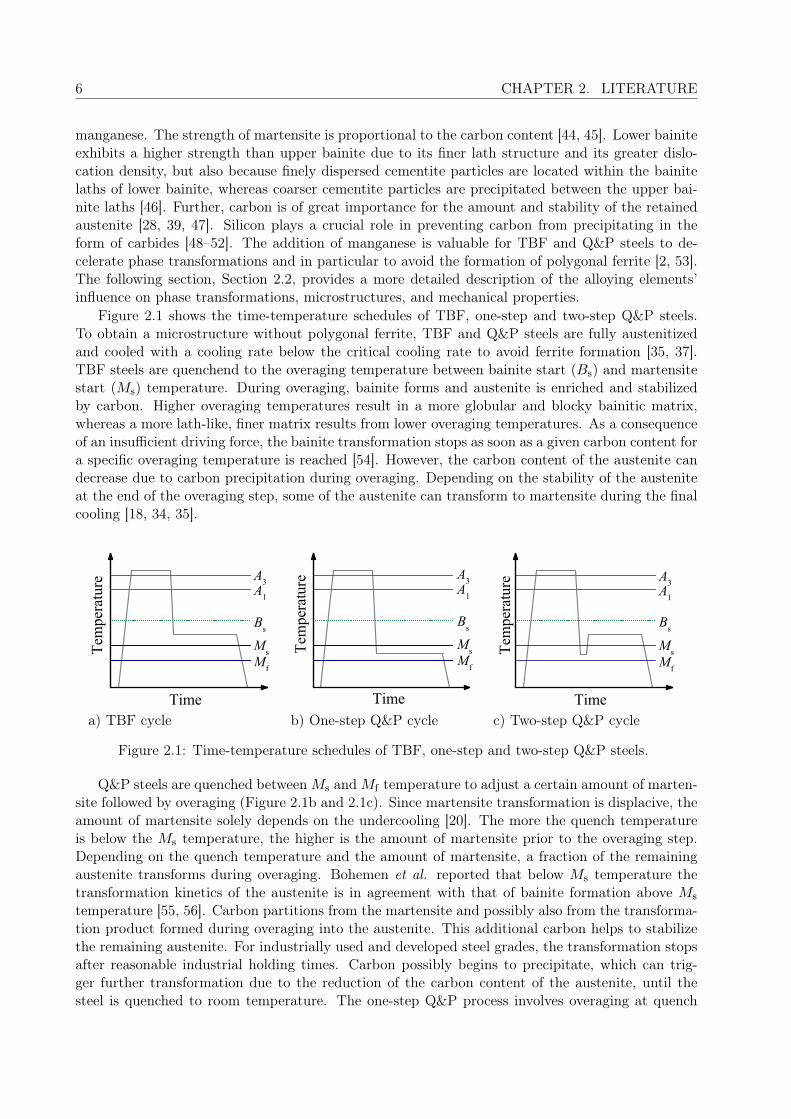
Figure 2.1 shows the time-temperature schedules of TBF, one-step and two-step Q&P steels.To obtain a microstructure without polygonal ferrite, TBF and Q&P steels are fully austenitizedand cooled with a cooling rate below the critical cooling rate to avoid ferrite formation [35, 37].TBF steels are quenchend to the overaging temperature between bainite start (Bs) and martensitestart (Ms) temperature. During overaging, bainite forms and austenite is enriched and stabilizedby carbon. Higher overaging temperatures result in a more globular and blocky bainitic matrix,whereas a more lath-like, finer matrix results from lower overaging temperatures. As a consequenceof an insufficient driving force, the bainite transformation stops as soon as a given carbon content fora specific overaging temperature is reached [54]. However, the carbon content of the austenite candecrease due to carbon precipitation during overaging. Depending on the stability of the austeniteat the end of the overaging step, some of the austenite can transform to martensite during the finalcooling [18, 34, 35].
0 2 4 6 8 100
2
4
6
8
10 Mf
Temperature
Time
Ms
Bs
A3A1
0 2 4 6 8 100
2
4
6
8
10 Mf
Ms
Bs
A3A1
Time
Temperature
0 2 4 6 8 100
2
4
6
8
10 Mf
Temperature
Time
Ms
Bs
A3A1
a) TBF cycle b) One-step Q&P cycle c) Two-step Q&P cycle
Figure 2.1: Time-temperature schedules of TBF, one-step and two-step Q&P steels.
Q&P steels are quenched betweenMs andMf temperature to adjust a certain amount of marten-site followed by overaging (Figure 2.1b and 2.1c). Since martensite transformation is displacive, theamount of martensite solely depends on the undercooling [20]. The more the quench temperatureis below the Ms temperature, the higher is the amount of martensite prior to the overaging step.Depending on the quench temperature and the amount of martensite, a fraction of the remainingaustenite transforms during overaging. Bohemen et al. reported that below Ms temperature thetransformation kinetics of the austenite is in agreement with that of bainite formation above Ms
temperature [55, 56]. Carbon partitions from the martensite and possibly also from the transforma-tion product formed during overaging into the austenite. This additional carbon helps to stabilizethe remaining austenite. For industrially used and developed steel grades, the transformation stopsafter reasonable industrial holding times. Carbon possibly begins to precipitate, which can trig-ger further transformation due to the reduction of the carbon content of the austenite, until thesteel is quenched to room temperature. The one-step Q&P process involves overaging at quench
2.1. TBF AND Q&P STEELS 7
temperature, while in the two-step Q&P process the steel is reheated and held at a temperatureabove quench temperature. According to TBF steels, matrix morphology as well as the amountand stability of the retained austenite of Q&P steels can be influenced by choosing correspondingoveraging time and temperature parameters.
It has been shown that isothermal decomposition of austenite below Ms temperature afterathermal martensite formation is in agreement with the kinetics of bainite formation above Ms
temperature [55, 57]. Bainite in the form of extremely thin platelets was obtained by isothermaltransformation at temperatures of approximately 200 C, where diffusional transformation in a giventime is not possible [58].
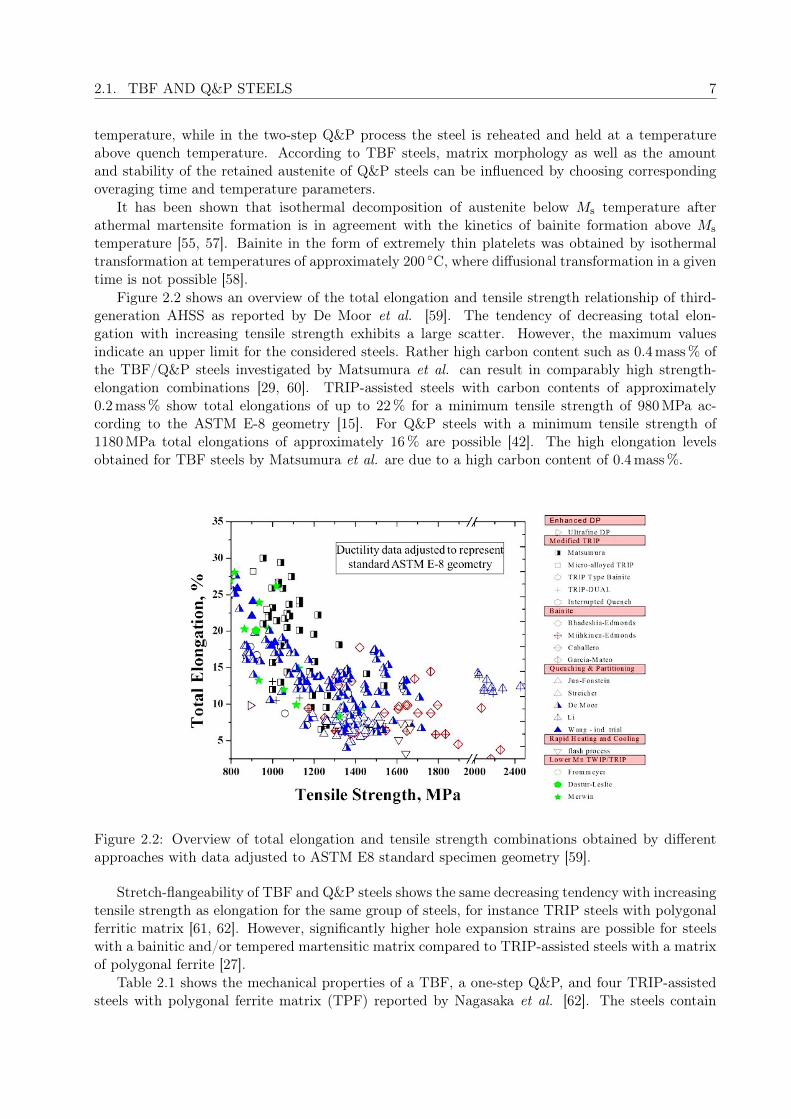
Figure 2.2 shows an overview of the total elongation and tensile strength relationship of third-generation AHSS as reported by De Moor et al. [59]. The tendency of decreasing total elon-gation with increasing tensile strength exhibits a large scatter. However, the maximum valuesindicate an upper limit for the considered steels. Rather high carbon content such as 0.4mass% ofthe TBF/Q&P steels investigated by Matsumura et al. can result in comparably high strength-elongation combinations [29, 60]. TRIP-assisted steels with carbon contents of approximately0.2mass% show total elongations of up to 22% for a minimum tensile strength of 980MPa ac-cording to the ASTM E-8 geometry [15]. For Q&P steels with a minimum tensile strength of1180MPa total elongations of approximately 16% are possible [42]. The high elongation levelsobtained for TBF steels by Matsumura et al. are due to a high carbon content of 0.4mass%.
Figure 2.2: Overview of total elongation and tensile strength combinations obtained by differentapproaches with data adjusted to ASTM E8 standard specimen geometry [59].
Stretch-flangeability of TBF and Q&P steels shows the same decreasing tendency with increasingtensile strength as elongation for the same group of steels, for instance TRIP steels with polygonalferritic matrix [61, 62]. However, significantly higher hole expansion strains are possible for steelswith a bainitic and/or tempered martensitic matrix compared to TRIP-assisted steels with a matrixof polygonal ferrite [27].
Table 2.1 shows the mechanical properties of a TBF, a one-step Q&P, and four TRIP-assistedsteels with polygonal ferrite matrix (TPF) reported by Nagasaka et al. [62]. The steels contain

8 CHAPTER 2. LITERATURE
1.5mass% silicon, 1.5mass% manganese and varying amounts of carbon. Increased carbon contentresults in considerably increased strength when the TPF steels are compared at the same overagingtemperature. Interestingly, uniform and total elongation of all four TPF steels are nearly thesame. This can be explained by the increase in the amount of retained austenite resulting fromthe higher carbon content. The expected loss in elongation as a consequence of higher strength iscompensated by a gain in elongation from the TRIP effect. Hole expansion strains of the TPF steels,in contrast, decrease with increasing carbon content. The one-step Q&P steel with a tensile strengthof 1154MPa shows a strongly enhanced hole expansion strain of 40% compared to 18% of steelTPF4 with 50MPa lower tensile strength. Even though held at a much higher overaging temperatureof 450 C, the hole expansion strain of the TBF steel with 0.2mass% carbon is comparable to thehole expansion strain of TPF3, which exhibits a 20MPa lower tensile strength, contains 0.3mass%carbon, and was held at 400 C overaging temperature. This evidently manifests the contribution ofa harder martensitic and/or bainitic matrix to the improvement of stretch-flangeability comparedto the steel grades with a ferritic matrix.
Table 2.1: Carbon content, overaging temperature, and mechanical properties including hole ex-pansion strains of TBF/one-step Q&P, and TPF steels, reported by Nagasaka et al. [62].
Steel C [mass%] Toa [C] Rp02 [MPa] Rm [MPa] Au [%] A25 [%] λ [%]One-step Q&P 0.2 375 971 1154 4.4 7.8 40TBF 0.2 450 617 918 14.2 18.2 23TPF1 0.1 400 429 651 27.8 37.2 58TPF2 0.2 400 526 825 31.7 36 40TPF3 0.3 400 562 895 28.6 32.2 24TPF4 0.4 400 728 1103 29.6 32.8 18
2.2 Alloying elements in TBF and Q&P steels
2.2.1 Carbon
As an austenite stabilizer, carbon enlarges the austenite region in CCT and TTT diagrams inparticular to lower transformation temperatures [63]. The driving force for diffusive and displacivefcc-bcc transformations is reduced. As a result, kinetics of these transformations is decelerated bythe addition of carbon [64]. Carbon diffuses faster in ferrite than in austenite by orders of magnitude[46]. Since the solubility of carbon in fcc is greater than in bcc, the carbon diffuses into, enriches,and stabilizes austenite against transforming into martensite during overaging or final cooling [37].This partitioning process makes it possible to obtain higher amounts of retained austenite in TBFand Q&P steels with greater stability against martensite transformation.
In addition to the deceleration of bainite transformation kinetics, carbon influences the bainiteand martensite morphology. Pickering reported that the transition temperature between upperand lower bainite transformation first increases, then decreases until it remains constant with in-creasing carbon content [65]. Plates tend to form in both martensite and bainite at large carbonconcentrations [46].
The hardness of a bainitic or martensitic matrix increases with increasing carbon content [45].Therefore, carbon is used to increase hardness and strength of TBF and Q&P steels. Highercarbon content in the retained austenite results in its stabilization and thereby improves the strain-hardening behaviour resulting in elevated elongation and n-values (Section 2.3.2).

2.2. ALLOYING ELEMENTS IN TBF AND Q&P STEELS 9
2.2.2 Silicon
Silicon partitions to and stabilizes ferrite [66, 67]. As a result, the A3 temperature is increased bysilicon additions [49]. The ferrite-stabilizing effect refers to ortho-equilibrium at high temperature,where all elements can diffuse relevant distances. The same tendency was observed in weakerform for overaging temperatures, at which the diffusion of substitutional elements such as silicon isnegligible [52].
Silicon prevents carbon from precipitating in the form of iron carbides, most commonly cementite[48–52]. This role is of critical importance for TBF and Q&P steels, since the carbon stabilizes theaustenite during overaging, which results in favourable amounts of retained austenite of desirablestability [16, 64, 68]. For instance during the formation of upper bainite, the formation of interlathcementite can be suppressed by addition of silicon in a way that high-carbon interlath retainedaustenite is obtained instead [69]. Furthermore, Owen et al. [49] reported, that three decompositionstages are present during overaging of steels with 0.5 to 1.2mass% carbon. During the first stage,martensite decomposes to ε-carbide in pseudo-equilibrium with low carbon martensite. The secondstage involves the formation of bainite and the third stage is characterized by the formation ofcementite and ferrite. A silicon content of up to 2.2mass% was investigated. It was found that muchhigher overaging temperatures are required to trigger third-stage decomposition in the presence ofsilicon. [49].
Jacques et al. found that silicon addition of 1.5mass% retards cementite formation duringbainite transformation at 350 to 400 C [64]. 0.38mass% Si was insufficient for carbon enrichment ofthe austenite [64]. However, it has been proven possible to achieve nearly 10 vol.% retained austenitewith this silicon content in combination with 0.18mass% carbon and 1.3mass% manganese for anoveraging temperature of 370 C and a short overaging time of 15 s. The suppression of carbonprecipitation by silicon additions decelerates bainite transformation [64]. Previous research onthe effect of silicon in para- and ortho-equilibrium conditions showed that para-equilibrium is onecondition for the retardation of cementite such that silicon must be trapped in cementite [52].However, this criterion is insufficient, and lattice defects are required to reduce the amount ofcarbon available for precipitation [52].
Despite the important positive effects of silicon on TBF and Q&P steels mentioned above, greateffort has been put into the reduction of the silicon content because a high silicon content resultsin silicon-oxides on the strip surface. These oxides can be picked up by the rolls of the productionline and leave traces on the subsequent steel strips [70, 71].
2.2.3 Manganese
Manganese stabilizes the austenite [2]. All transformation temperatures in thermodynamic equi-librium are decreased through the addition of manganese [72]. Concerning kinetics, manganesedecreases the diffusivity of carbon in the austenite [53]. Increased manganese content drags theferrite-austenite interface mobility [22, 73]. Cementite formation is decelerated by the addition ofmanganese [50, 74–76]. Once formed, however, manganese partitions to cementite easily [77–81].
Manganese strongly tends to macrosegregation [82–84]. For instance, high manganese contentscan result in unfavourable band formation in TRIP steels [24, 85]. To avoid longitudinal manganesesulfides, which are particularly detrimental for edge formability, calcium is used to bind sulfur toform spherical particles.
TRIP, Q&P, and TBF steels in the literature are usually comprised of approximately 1.5 to1.6mass% manganese [13, 27, 86–88]. It was found that a manganese content of approximately2.5mass% is more useful for TRIP-assisted steels without polygonal ferrite than for steels withprimarily bainitic and/or martensitic matrix due to its potential to stabilize austenite [89].

10 CHAPTER 2. LITERATURE
2.2.4 Chromium
While chromium thermodynamically stabilizes ferrite, it significantly slows all diffusion-controlledphase transformation kinetics, in particular at high temperatures [90, 91]. A shift of all isothermalphase transformations to longer times has been reported in the literature [92]. As a result, theamount of low-temperature transformation products such as martensite and lower bainite is higherfor higher chromium contents.
Although chromium retards cementite formation [50, 74–76], it enriches in cementite [77, 78,80, 81, 93–98]. The decomposition of martensite is inhibited by chromium additions providingenhanced tempering resistance, which enables to sustain the strength of the matrix during overag-ing. Chromium can be used to replace silicon in its function of preventing carbon precipitation,which indirectly contributes to increase the amount of retained austenite [99]. This helps to avoiddetrimental silicon oxides on the sheet surface (Section 2.2.2).
2.2.5 Niobium
As one of the most important microalloying elements, niobium strongly contributes to grain re-finement and precipitation hardening [100]. As described by the Hall-Petch relationship shown inEquation 2.6, grain refinement significantly increases a steel’s strength [101–103]. In addition tomicroalloyed HSLA steels, this increase in strength as a result of niobium microalloying has alsobeen observed in DP and TRIP steels [87, 104–107]. Grain refinement, furthermore, improves man-ufacturability, final properties, and performance of microalloyed steels [87, 107]. A higher amountof retained austenite was found in niobium-alloyed TRIP steels as a result of the grain refinementcaused by niobium additions [104, 105]. This was explained by the formation of ferrite duringcooling, which promotes carbon enrichment of the austenite.
The grain refinement through niobium additions is achieved by the pinning effect of secondaryphase particles and/or the solute drag effect. The solute drag effect refers to the effect of soluteatoms on grain boundaries. Finely dispersed precipitates such as niobium carbides and/or nitridescan also significantly pin the grain boundary [108]. When a grain boundary intersects a particle,a portion of the boundary is eliminated. A force is required to pull the boundary away from theparticle, which lowers the grain boundary mobility [108].
The solubility of niobium monocarbides, mononitrides, and carbonitrides in austenite in equi-librium can be described by the solubility product [109]:
log[Nb][C]C1 [N]C2 = C3 −C4
T, (2.1)
where Nb, C, and N are the amounts of niobium, carbon, and nitrogen, C1−4 are fit parametersdepending on the matrix composition, and T is the temperature. The main difference betweenthe many existing solubility products is the method used to obtain a given solubility product, i.e.thermodynamic calculations or experimental separation of precipitates [100]. The actual amountand size of niobium precipitates during steel production in an industrial environment, however, cansignificantly deviate from equilibrium calculations and depend on formation kinetics, which can bedescribed by sigmoidal phase transformation curves, such as the Johnson-Mehl-Avrami-Kolmogorovequation [110] (Section 5.2.2).
In the right amount and size niobium carbides provide important precipitation hardening [26,111, 112]. The magnitude of precipitation strengthening is determined by size, shape, and volumefraction of the carbides or nitrides formed [113, 114]. Gladman introduced a model based on theAshby-Orowan relationship, which allows estimation of particle size and volume fraction effects onprecipitation strengthening [113]. An increase in strength by precipitation hardening of 240MPa by0.09mass% niobium is predicted by the model. Experimental work shows that the full hardening
2.3. MICROSTRUCTURE AND MECHANICAL PROPERTIES 11
potential of niobium precipitation on strength is not achieved, because in practice some of the nio-bium precipitates in austenite at high temperatures and coarse niobium carbides do not contributeto precipitation hardening as opposed to finely dispersed niobium carbides [100, 115].
Finally, Sugimoto et al. reported, that grain refinement triggered by niobium additions canaccelerate the bainite transformation [26]. Bainite morphology appeared much more globular in theTBF steels with niobium additions compared to the rather lath-like bainite of the TBF steels withoutniobium. Furthermore, an increase in non-martensitic fraction at low overaging temperatures due toniobium additions has been observed [26]. These changes in microstructure of the investigated TBFsteels, result in enhanced total elongation through niobium addition, while tensile strength remainsunaffected. stretch-flangeability can be significantly improved by niobium addition, especially foroveraging at low temperatures of 300 to 350 C [26].
2.3 Microstructure and mechanical properties of TBF and Q&Psteels
The description of the mechanical properties of TBF and Q&P steels requires fundamental under-standing of their microstructure. The following section provides an overview of the strength, thestrain-hardening behaviour, and the failure mechanisms as a consequence of the microstructure ofTBF and Q&P sheet steels.
2.3.1 Strength and strengthening mechanisms
Crystalline materials can be deformed plastically by the movement and formation of new dislocations[116]. To move a dislocation a critical shear stress needs to be applied. The required normal forceto reach this critical shear stress depends on the orientation of the slip system. Due to the differentorientations of the grains, the beginning of plastic deformation in polycrystalline materials, i.e. theyield strength, is reached as soon as the critical shear stress is exceeded in every grain [117].
The strength of a material can be increased by increasing the required stress to move or formnew dislocations by the addition of lattice defects. It is therefore the superposition of the internalfriction, also called Peierls-Nabarro stress to move a dislocation within the defect free lattice σ0 andthe strengthening mechanisms taking place. A frequently used approach to calculating the strengthis the assumption that the total strength is the sum of each strength contribution ∆σi from differentstrengthening mechanisms [65]:
σ = σ0 +∑i
∆σi. (2.2)
An important mechanism to increase the strength is solid solution strengthening. Paraelastic,dielastic, and chemical interactions between the lattice and the substitutional element impair thedislocation glide resulting in higher strength of the material [118–120]. Solid solution strengthen-ing via chemical interaction can be expressed by the so-called Suzuki effect [120]. Substitutionalelements can lower the stacking fault energy by causing dislocations to move and increasing thedistance between partial dislocations. This results in a higher stress required to move the disloca-tion increasing the overall strength of the material proportional to the square root of the alloyingelement concentration ca [120]:
∆σc ∝√ca. (2.3)
At low alloy concentrations, the contribution of each alloying element to solid solution strength-ening is typically estimated by an empirical approach of linear superposition:

12 CHAPTER 2. LITERATURE
∆σcl ∝∑a
Saca, (2.4)
where Sa is a strengthening constant describing the extent of the contribution of each alloyingelement a to solid solution strengthening.
Further, the increase in dislocation density through plastic deformation contributes to impaireddislocation mobility. The strength is proportional to the dislocation density ρ as follows:
∆σρ ∝√ρ. (2.5)
The dislocation density of bainite is commonly higher than in polygonal ferrite, except for thedislocation density in highly deformed ferrite. In lower bainite the dislocation density is higher thanin upper bainite, and martensite exhibits the highest dislocation density.
A smaller grain size results in a shorter mean free path for dislocation slip and dislocation pileup at grain boundaries. The increase in the strength of a material through grain refinement can bedescribed by the Hall-Petch equation [102, 103]:
∆σHP ∝1√d, (2.6)
where d is the diameter of a sphere with equivalent volume to the volume of the grain. The Hall-Petch equation applies to polygonal ferrite. The strength of bainite, and martensite also increaseswith decreasing lath thickness down to very small lath thicknesses.
Non-metallic inclusions and precipitates can result in precipitation-strengthening. The addi-tional strength necessary for a dislocation to bow around a particle is proportional to the particlevolume fraction f and inversely proportional to the particle radius r, as described by the Orowanstrengthening [101]:
∆σO ∝√f
r. (2.7)
If the radius of the particle is smaller than a critical radius, and depending on whether it is acoherent or incoherent particle, the stress required to cut the particle can be smaller than to bowaround it. The stress to cut a particle is proportional to the square root of its equivalent radius[121]:
∆σK ∝√f ·√r. (2.8)
Since different phases in multiphase steels feature specific arrangements, the critical stress tomove or form new dislocations varies from phase to phase. The empirical rule of mixture can beused to estimate the tensile strength of multiphase steels based on volume fraction fi and strengthσi of the respective phase p:
Rm =∑p
fiσi. (2.9)
2.3.2 Strain-hardening behaviour
Strain-hardening is the increase in strength as a result of increasing formation of new dislocations,as described by Equation 2.5. Thus, the stress σ is a function of the dislocation density ρ. It canbe quantified by applying the shear modulus G, the Burgers vector b, the dislocation density, anda geometry factor α as follows:

2.3. MICROSTRUCTURE AND MECHANICAL PROPERTIES 13
σ = σ0 + αGb√ρ. (2.10)
The response of a material to stress is an increase in strain. The extent to which the stressincreases with the strain can be expressed by strain-hardening rate θ. The strain-hardening rateis the slope of the stress-strain curve defined by the increment of strength dσ divided by a givenstrain increment dϕ [122]:
θ =dσ
dϕ, (2.11)
In 1909, Ludwik postulated an equation, which is frequently used as one of the simplest empiricalequations to describe the relationship between stress and logarithmic strain ϕ [123]:
σ = Cϕn, (2.12)
where the n-value is the strain-hardening exponent typically given for a specific strain range. Forinstance, n4−6 represents the strain-hardening exponent for the strain range of 4 to 6%. Thedifferential n-value n′ can be derived from the strain-hardening exponent as follows:
n′ =d lnσ
d lnϕ= θ · ϕ
σ. (2.13)
Plasticity and strain-hardening behaviour of multiphase materials can be described by dislo-cation models, continuum mechanics, and continuum dislocation mechanics. Ashby introduced adislocation model based on geometrically necessary dislocations ρg [124, 125]. In this model, thedislocation density ρ is composed of statistically stored dislocations ρs and geometrically necessarydislocations: ρ = ρs + ρg. Statistically stored dislocations trap each other randomly. Geometricallynecessary dislocations are required to accommodate the plastic shear gradients and to allow compat-ible deformation of two phases. Rigid cubic particles are assumed to be embedded in a deformabletwo-phase material. The density of geometrically necessary dislocations is proportional to the meanmacroscopy shear strain. For cubic particles of the length a and the volume fraction f , the densityρg of geometrically necessary dislocations can be calculated as follows:
ρg =6γf
a · b. (2.14)
This approach has been extended by Fischmeister and Karlsson to a case of coarse plasticallydeformable inclusions in a soft crystalline matrix [126, 127]. In this case, the density of geometricallynecessary dislocations is composed of dislocations at the grain boundary ρgb and those caused bythe deformation difference between inclusions and matrix ρi. The dislocation density at the grainboundary is proportional to the macroscopic mean deformation and inversely proportional to themean free path of dislocation slip λmf :
ρgb ∝γ
λmf. (2.15)
The dislocation density as a result of deformation difference between the inclusions of the volumefraction f and the matrix can be calculated as follows:
ρi = C1 ·f
1− f· γ − γibλmf
, (2.16)

14 CHAPTER 2. LITERATURE
where C1 is a constant and γi the shear deformation of the inclusions. The strength increase canbe calculated by deploying the sum of both dislocation densities to Equation 2.5.
The second approach to describing plasticity and strain-hardening in multiphase materials iscontinuum mechanics. This approach exhibits some remarkable distinctions to dislocation models.Fischmeister and Karlsson state that the load transfer between two phases of different hardness is ofhigher importance for the strengthening of multiphase steels than the contribution of geometricallynecessary dislocations [128]. Continuum mechanics accounts for this load transfer as opposed todislocation models [129]. The most important difference between the approaches introduced hereinis that dislocation based models by Ashby depend on the size of the particle or inclusion, while thecontinuum model introduced by Fischmeister and Karlsson is independent of the particle size. Forthe load transfer between two phases exposed to parallel loading in the elastic region, the strain εαin the elastically deformed phase α is equal to the strain εβ in the elastically deformed phase β andequal to total strain ε [128]: εα = εβ = ε. As a result, the ratio between the stresses of the twoelastically deformed phases σα and σβ is equal to the ratio between their elastic moduli Eα and Eβ:
σβσα
=Eβ
Eα. (2.17)
In the case of serial loading, the stresses in the two elastically deformed phases are equal to thetotal stress σ: σα = σβ = σ. Thus, in analogy to the parallel loading, the ratio between the strainsof the two elastically deformed phases is equal to the ratio between their elastic moduli for the serialloading:
εβεα
=Eβ
Eα, (2.18)
where εα and εβ are the strains in phase α and β, respectively. The following equations formulatedby Tamura et al. [130] are empirical approaches to calculating total strain ε and total stress σapplying the rule of mixture:
σ = fασα + fβσβ, (2.19)
ε = fαεα + fβεβ. (2.20)
These equations are in good agreement with empirical data [128]. However, both equationscannot be true in the elastic region. In the plastic region, the equations match empirical data moreaccurately, but are not justifiable. The stress and strain transfer between the two phases for anycase between parallel and serial loading can be determined by the slope coefficient q:
q =σβ − σαεβ − εα
. (2.21)
Figure 2.3 shows the stress-strain curves in each of the two phases as a function of volumefraction of each phase and the total stress-strain curve of both phases [128]. The size of the slopecoefficient is determined by the relation between stress and strain transfer. A higher slope coefficientindicates a closer result to the parallel loading case. The lower the slope coefficient, the closer thesituation to serial loading. In addition to the parameters given by Equation 2.21 such as volumefraction and flow stress, the slope coefficient depends on the geometry and the strain-hardening ofthe two phases.
In addition to Ashby’s model, where the inclusion is rigid, the strength of matrix as well asinclusion can be varied employing the approach by Fischmeister and Karlsson [128], as illustratedby Figure 2.3.

2.3. MICROSTRUCTURE AND MECHANICAL PROPERTIES 15
Figure 2.3: Stress and strain distribution between two phases according to Equation 2.19 andEquation 2.20 [128].
During SIMT of TRIP-assisted steels, the volume fraction of the hard martensite phase in theinclusion increases at the cost of the volume fraction of the softer austenite phase during straining.As demonstrated by Reisner and Fischer et al. [131, 132], the continuum mechanics approach allowsto quantify the plastic deformation using finite element calculations accounting for the varying phasefractions during SIMT.
TBF and Q&P steels are multiphase steels containing retained austenite. As mentioned above,retained austenite transforms via SIMT during straining [47, 131, 133]. The strain-induced transfor-mation from austenite to martensite involves a volume increase of the retained austenite/martensiteinclusion. Geometrically necessary dislocations are required to compensate the misfit due to thevolume change [124]. The additional increase in dislocation density results in particularly highstrain-hardening and higher strength (Equation 2.10). As a result, the strength increment is higherfor the corresponding strain increment, which is equivalent to an increase in strain-hardening rate(Equation 2.11). Since the required strain to initiate SIMT depends on the stability of the retainedaustenite, the impact of the TRIP effect on the strain-hardening behaviour depends on the retainedaustenite stability. The retained austenite stability is influenced by the amount of austenite sta-bilizing elements [68], in particular the carbon content [134, 135]. At very low carbon levels, theaustenite transforms at very low strain levels, which was found to detrimentally affect total elon-gation of the steel [131]. For carbon concentrations over 1.8mass%, some of the retained austenitecan remain untransformed, thus, the TRIP effect is not entirely made use of [32].
The retained austenite stability is furthermore affected by the size of the retained austenitegrains [68, 133, 134, 136, 137]. The influence of grain size on retained austenite stability resultsfrom the dependency of interfacial energy on the ratio between surface area and surface volume.The inclusion/matrix interface can pin dislocations in their movement. A critical stress has tobe overcome to cut or surround the particle (Equation 2.3.1). The stress necessary to form newdislocations is frequently lower than to move existing pinned dislocations. Therefore, a higher surfacearea to volume ratio results in higher dislocation density per volume decreasing the interfacial energyfor SIMT [68, 136, 137].
Finally, the shape or phase morphology of retained austenite as well as its location within thematrix has a significant impact on resistance of retained austenite to SIMT with the global strainapplied to the steel. Lamellar retained austenite structure is more stable than equiaxed retainedaustenite grains [138], and retained austenite surrounded by a strong bainitic matrix is more resistantto martensite transformation than retained austenite surrounded by a weaker ferritic matrix [139].

16 CHAPTER 2. LITERATURE
2.3.3 Failure mechanism
Void formation at inclusions or precipitates
Ductile failure in steel consists of void nucleation, growth, and coalescence [140]. In multiphasesteels in particular DP steels micro-voids are generated either by hard martensite cracking, alsocalled cleavage, and/or by intergranular fracture, i.e. decohesion of the interfaces of the secondphases[141, 142]. To initiate decohesion between a particle and its matrix, the elastic strain energyof the particle has to be greater or equal to the surface energy of the void that will be created [143–146]. This condition is necessary but insufficient. In addition, the maximum shear and/or normalstress at the particle interface has to exceed the critical stress at the inclusion/matrix interface toinitiate void nucleation.
The maximum stress on a particle σmax in a matrix at the particle interface can be calculatedas the sum of the maximum deviatoric stress s, the macroscopic mean-normal stress σm, and theelevated local stress σl [140, 143, 144]:
σmax = s+ σm + σl. (2.22)
This maximum stress on the particle needs to be at least equal to the surface energy of the voidthat will be created, in order for a void to nucleate [143, 144, 146].
Brown and Stobbs introduced a model based on geometrically necessary dislocations, whichdescribes the elevated local stress on the particle interface as proportional to the square root ofstrain divided by the particle radius r [140]:
σl ∝
√εb
r. (2.23)
Argon et al. reported an analysis of both non-hardening and linear-hardening plastic flow arounda circular-cylindrical inclusion in a pure-shear deformation field. According to their model, a voidcan nucleate, if the maximum stress σmax at the inclusion/matrix interface is equal to a criticalstress σc [145]:
σmax = σc. (2.24)
The maximum stress σmax on the inclusion interface is given by the sum of the equivalent stressσe on the inclusion interface and the mean-normal stress:
σmax = σe + σm. (2.25)
The equivalent stress can be calculated by the von Mises equation with the principal stressesσ1, σ2, and σ3, as follows [140, 147]:
σe =1
2[(σ1 − σ2)2 + (σ1 − σ3)2 + (σ2 − σ3)2]
1/2
. (2.26)
Failure at phase boundaries in multiphase steels
Failure in multiphase steels can initiate at boundaries between phases of strong hardness differencesor by cracking within the hard phase [148–150]. Employing continuum mechanics by means of finiteelement based micromechanical models is valuable to describe and understand plasticity and failurein particular regarding steels with high phase contrasts such as dual phase steels [141, 142, 148, 151].Krempaszky et al. developed a micromechanical model to describe the deformation behaviour of DPsteels [148]. The flow behaviour described by this model is assumed as elastoplastic with isotropic
2.3. MICROSTRUCTURE AND MECHANICAL PROPERTIES 17
hardening [152], and the onset of necking is defined by the classical Considère instability criterion[153]. The contiguity was used to describe the neighboring relationship of the phases [154]. It wasfound that a lower strength ratio between ferrite and the second phase, for instance by replacingthe hard martensite by tempered martensite, reduces the strained region and the strain level in theferrite [148]. Furthermore, the arrangement of the second phase is highly important for the straindistribution in the ferrite. More heterogeneous banding-like distribution of the second phase, i.e.retained austenite and/or martensite, results in a larger strained region and higher maximal strains[148].
In further studies a computer model based on continuum mechanics was developed to sys-tematically study the microdamage behaviour of different dual or complex phase microstructures[142]. The complete microstructure simulation involves a parameter-controlled difference quotient-based colouring algorithm, Voronoi tesselation, geometry generation, meshing, finite element dis-cretization, and postprocessing. The failure criterion implemented into the model’s post processingroutine anticipates failure when a critical stress is exceeded by the stress density function at theferrite/martensite and martensite/martensite interfaces.
All results obtained from the models are in full agreement with correlation between microstruc-ture, which was identified by optical and scanning electron microscopy, and failure mechanismcharacterized by tensile testing and hole expansion [141, 142]. The comparison of experimentalresults with the predictions from the simulation allowed to draw the following conclusions: First,the mechanical heterogeneity of a multiphase steel shows the highest impact on the hole expansionstrain [141]. Mechanical heterogeneity depends on the hard phase fraction and the phase strengthcontrast [141, 142]. Low mechanical heterogeneity causes high hole expansion strains [141]. Astrong banded structure also results in lower hole expansion values [142]. Second, for phase fractionof martensite of less than 40% the model predicts higher hole expansion for lower contiguities [141].Strong clustering of martensite for more than 40% martensite furthermore causes high hole expan-sion strains. Almost fully martensitic or tempered martensitic structures result in excellent holeexpansion [141, 142]. Third, the model predicts a decrease in hole expansion strains for elevatedprestrain [141, 142]. Finally, the hole expansion strain was found to depend on the overall strengthlevel of the material. Microstructures with higher overall strength levels show higher hole expansionstrains [141, 142].
Void growth
The stress-free surface of the void after nucleation causes elevated localized stress and strain concen-trations in the surrounding plastic field. These stress and strain concentrations cause the growth ofvoids upon continuing plastic deformation. Rice et al. [155] report a model to calculate the growthrate r of a spherical void with the radius r,
r = r ·[C2εx +
√2
3εyf
(σm
Y
)], (2.27)
where C2 is a constant depending on the size of σm and the hardening type, linear or non-linearhardening, εx and εy are strains in x and y direction, f(σmY ) is a function of σm
Y also dependingon the hardening type, σm is the mean-normal stress, as introduced in Section 2.3.3, and Y is theyield stress [155]. In this model, the interaction between voids is assumed to be negligible. Sincethe voids are highly elongated with elliptical cross-sections and the elongation of the voids increaseswith increasing total strain, it is useful to introduce the Lode constant ν = − 3εy
εx−εz as well as theincompressibility equation εx+ εy + εz = 0. With the Lode constant and the incompressibility equa-tion, the three principal radii and the mean radius of the voids can be derived from the integrationof Equation 2.27 [155]. Applying a specific σm
Y to the non-linear and linear-hardening states, the

18 CHAPTER 2. LITERATURE
model shows good agreement with experimental results [156]. For higher strains the results from adual-population void nucleation model match even better with the experimental values [155].
Void coalescence
Void coalescence is characterized by a sudden catastrophic coalescence of microvoids that nucleateand grow at the sites of inclusions [140]. During this internal necking process, the fracture surfaceis mathematically equivalent to a stationary discontinuity in the plastic velocity-field [157].
The onset of internal necking can be identified by a critical condition for microvoid coalescence.Thomason et al. [158] report a dependency of the plastic limit-load failure of the intervoid matrixon the volume fraction of voids fv given as follows:
σn
(1−
√fv
)= σ, (2.28)
where σn is critical mean stress for the initiation of internal necking and σ is the total stress.

Chapter 3
Experimental Procedure
3.1 Laboratory production of annealed sheets
3.1.1 Material
In this work, TBF and Q&P steels with silicon contents below 1mass% and chromium additionsof approximately 0.3mass% were investigated, since literature on this subject is missing to thisdate, despite the critical importance to reduce the silicon content of these steels. To investigate theinfluence of alloying elements on phase transformations, microstructure and mechanical properties,laboratory melts for TBF and Q&P sheet steels with two different strength levels were planned. Onegroup was designed for a minimum tensile strength of 980MPa, termed 980 grade in the following,and the other was chosen for 1180MPa minimum tensile strength, named 1180 grade. For eachof these groups a base composition was developed, as shown in Table 3.1. The composition ofeach laboratory melt for the 980 grade and the 1180 grade is given in Table 3.2 and Table 3.3,respectively. To achieve the elevated strength level, a higher carbon content and a slightly highermanganese content was chosen for the 1180 grade. Carbon, silicon, manganese, and chromiumwere varied within the following ranges: 0.16 to 0.2mass% carbon, 0.7 to 1.0mass% silicon, 2.2 to2.6mass% manganese, 0.01 to 0.4mass% chromium. A niobium content of 0.02 to 0.09mass% wasadded to the niobium-free base compositions. To avoid deviations within the composition of eachgroup, three or four melts were cast from the main melt, subsequently increasing the content of theinvestigated element.
Table 3.1: Base composition of the investigated steel grades [mass%].Steel C Si + Cr Mn + Mo Nb P S N980 grade 0.15 - 0.20 0.9 - 1.3 2.1 - 2.5 < 0.05 < 0.01 < 0.01 < 0.0071180 grade 0.17 - 0.22 1.0 - 1.4 2.3 - 2.7 < 0.05 < 0.01 < 0.01 < 0.007
3.1.2 Production of cold-rolled sheets
To obtain material for mechanical testing, air-cast ingots were hot-rolled in a two-step procedure.In the first step 400mm x 150mm x 150mm cuboids were hot-rolled to 38mm thickness. Thestrips were reheated to 1180 C and hot-rolled to 4mm thickness in the second step. A finish rollingtemperature of around 900 C and a coiling temperature of 650 C were chosen for the hot rollingprocess. The steels were then cold-rolled with forward tension to a thickness of 1mm. Samples forchemical analysis, dilatometer samples, and samples for laboratory annealing simulations were cutfrom the as-cold-rolled strips.
19

20 CHAPTER 3. EXPERIMENTAL PROCEDURE
Table 3.2: Composition of the investigated laboratory TBF and Q&P steels designed for a minimumtensile strength of 980MPa [mass%].Steel C Si Cr Mn + Mo Nb P S N0.7Si980 0.15 - 0.20 0.7 < 0.5 2.1 - 2.5 < 0.05 < 0.01 < 0.01 < 0.0070.8Si980 0.15 - 0.20 0.8 < 0.5 2.1 - 2.5 < 0.05 < 0.01 < 0.01 < 0.0070.9Si980 0.15 - 0.20 0.9 < 0.5 2.1 - 2.5 < 0.05 < 0.01 < 0.01 < 0.0071.0Si980 0.15 - 0.20 1 < 0.5 2.1 - 2.5 < 0.05 < 0.01 < 0.01 < 0.007Steel C Si + Cr Mn Mo Nb P S N2.2Mn980 0.15 - 0.20 0.9 - 1.3 2.2 < 0.3 < 0.05 < 0.01 < 0.01 < 0.0072.4Mn980 0.15 - 0.20 0.9 - 1.3 2.4 < 0.3 < 0.05 < 0.01 < 0.01 < 0.0072.5Mn980 0.15 - 0.20 0.9 - 1.3 2.5 < 0.3 < 0.05 < 0.01 < 0.01 < 0.007Steel C Si Cr Mn + Mo Nb P S N0.01Cr980 0.15 - 0.20 0.6 - 1.0 0.01 2.1 - 2.5 < 0.05 < 0.01 < 0.01 < 0.0070.2Cr980 0.15 - 0.20 0.6 - 1.0 0.2 2.1 - 2.5 < 0.05 < 0.01 < 0.01 < 0.0070.4Cr980 0.15 - 0.20 0.6 - 1.0 0.4 2.1 - 2.5 < 0.05 < 0.01 < 0.01 < 0.007Steel C Si + Cr Mn + Mo Nb P S N0Nb980 0.15 - 0.20 0.9 - 1.3 2.1 - 2.5 < 0.002 < 0.01 < 0.01 < 0.0070.025Nb980 0.15 - 0.20 0.9 - 1.3 2.1 - 2.5 0.025 < 0.01 < 0.01 < 0.0070.045Nb980 0.15 - 0.20 0.9 - 1.3 2.1 - 2.5 0.045 < 0.01 < 0.01 < 0.0070.09Nb980 0.15 - 0.20 0.9 - 1.3 2.1 - 2.5 0.090 < 0.01 < 0.01 < 0.007
Table 3.3: Composition of the investigated laboratory TBF and Q&P steels designed for a minimumtensile strength of 1180MPa [mass%].Steel C Si + Cr Mn + Mo Nb P S N0.16C1180 0.16 1.0 - 1.4 2.1 - 2.5 < 0.05 < 0.01 < 0.01 < 0.0070.18C1180 0.18 1.0 - 1.4 2.1 - 2.5 < 0.05 < 0.01 < 0.01 < 0.0070.21C1180 0.2 1.0 - 1.4 2.1 - 2.5 < 0.05 < 0.01 < 0.01 < 0.007Steel C Si Cr Mn + Mo Nb P S N0.8Si1180 0.17 - 0.22 0.8 < 0.5 2.3 - 2.7 < 0.05 < 0.01 < 0.01 < 0.0070.9Si1180 0.17 - 0.22 0.9 < 0.5 2.3 - 2.7 < 0.05 < 0.01 < 0.01 < 0.0071.0Si1180 0.17 - 0.22 1 < 0.5 2.3 - 2.7 < 0.05 < 0.01 < 0.01 < 0.007Steel C Si + Cr Mn Mo Nb P S N2.2Mn1180 0.17 - 0.22 1.0 - 1.4 2.2 < 0.3 < 0.05 < 0.01 < 0.01 < 0.0072.4Mn1180 0.17 - 0.22 1.0 - 1.4 2.4 < 0.3 < 0.05 < 0.01 < 0.01 < 0.0072.6Mn1180 0.17 - 0.22 1.0 - 1.4 2.6 < 0.3 < 0.05 < 0.01 < 0.01 < 0.007Steel C Si Cr Mn + Mo Nb P S N0.01Cr1180 0.17 - 0.22 0.6 - 1.0 0.01 2.3 - 2.7 < 0.05 < 0.01 < 0.01 < 0.0070.1Cr1180 0.17 - 0.22 0.6 - 1.0 0.1 2.3 - 2.7 < 0.05 < 0.01 < 0.01 < 0.0070.2Cr1180 0.17 - 0.22 0.6 - 1.0 0.2 2.3 - 2.7 < 0.05 < 0.01 < 0.01 < 0.0070.4Cr1180 0.17 - 0.22 0.6 - 1.0 0.4 2.3 - 2.7 < 0.05 < 0.01 < 0.01 < 0.007Steel C Si + Cr Mn + Mo Nb P S N0Nb1180 0.17 - 0.22 1.0 - 1.4 2.3 - 2.7 < 0.002 < 0.01 < 0.01 < 0.0070.02Nb1180 0.17 - 0.22 1.0 - 1.4 2.3 - 2.7 0.02 < 0.01 < 0.01 < 0.0070.04Nb1180 0.17 - 0.22 1.0 - 1.4 2.3 - 2.7 0.04 < 0.01 < 0.01 < 0.0070.08Nb1180 0.17 - 0.22 1.0 - 1.4 2.3 - 2.7 0.08 < 0.01 < 0.01 < 0.007

3.1. LABORATORY PRODUCTION OF ANNEALED SHEETS 21
3.1.3 Annealing cycles
The cold-rolled heavily deformed ferritic-pearlitic microstructure of TBF and Q&P steels was fullyaustenitized followed by the quenching and overaging step. As-cold-rolled samples of all 980 and1180 grade TBF laboratory melts were heated with 25K/s, fully austenitized at 900 C, cooled at50K/s to overaging temperature Toa. Further, the samples were held at various temperatures inthe bainitic region and below Ms temperature between 350 and 475 C applying overaging times toa
from 30 to 600 s and finally quenched to room temperature with 50K/s (Figure 3.1).
Figure 3.1: Laboratory annealing cycles for the investigated TBF and one-step Q&P steels.
3.1.4 Laboratory annealing of industrially cold-rolled sheets
Detailed investigations on the influence of alloying elements on microstructure and mechanical prop-erties provided the base for the industrial production of a selected 980 grade with the most promisingmechanical properties. The industrial manufacturability of this 980 grade was demonstrated by thesuccessful production of steel IN980 (Table 3.4). In this work, selected laboratory annealing cycleswere carried out on the industrially produced IN980.
Table 3.4: Composition of the industrially produced 980 grade [mass%].Steel C Si + Cr Mn + Mo Nb P S NIN980 0.15 - 0.20 0.9 - 1.3 2.1 - 2.5 < 0.05 < 0.01 < 0.01 < 0.007
The influence of quench temperature and time at quench temperature on microstructure andmechanical properties of two-step Q&P heat-treated steels was studied applying the annealingcycle given in Figure 3.2. The cold-rolled sheets were fully austenitized, rapidly cooled to quenchtemperature with a cooling rate of 80K/s, followed by reheating, overaging, and finally quenching toroom temperature. Quench temperatures of 260, 280, 300, 320, 340, 360, and 380 C were applied tosteel IN980 for a time at quench temperature of 3 s. In further trials, this steel was held at selectedtimes at quench temperature of 0, 2, 4, 8, 20, and 40 s at a quench temperature of 350 C.
A polygonal ferritic matrix is commonly known to be less attractive for edge crack formabilitythan a bainitic and/or martensitic matrix. In this study, the influence of polygonal ferrite onmechanical properties of TRIP-aided steels with primarily bainitic and/or martensitic matrix hasbeen investigated. The importance of avoiding polygonal ferrite as a microstructure component ofthese steels was evaluated. The influence of the amount of polygonal ferrite on mechanical propertiesof these steels was quantified. Two different ways were applied to introduce polygonal ferrite intothe microstructure, see Figure 3.3. The first approach involves an additional holding step at a

22 CHAPTER 3. EXPERIMENTAL PROCEDURE
Figure 3.2: Two-step Q&P cycles with varying quench temperature Tq and time at quench temper-ature tq.
temperature Tf , where polygonal ferrite forms, that is between A3 and bainite start temperatureBs (Figure 3.3a). Holding temperatures of Tf = 525 C and 625 C and holding times of tf = 2, 6,10, and 40 s were chosen to adjust the desired amount of polygonal ferrite. In further trials, theannealing temperature (Tan) was set close to and below the A3 temperature to provoke polygonalferrite by intercritical annealing (Figure 3.3b). For this purpose, cold-rolled sheets of grade IN980were annealed at Tan = 780, 790, 800, 810, 820, and 900 C for 120 s. The sheets were then quenchedto overaging temperature Toa = 400 C with a cooling rate of 80K/s, isothermally held for 600 sand quenched to room temperature at 50K/s.
Figure 3.3: Annealing cycles (time-temperature schedules) applied to introduce polygonal ferriteinto the matrix a) via an additional holding step upon continuous cooling at holding temperatureTf for holding time tf and b) via intercritical annealing at annealing temperature (Tan).
3.2 Industrial production of annealed sheets
3.2.1 Material
A key challenge in the present work is the industrial realization of a grade with a minimum tensilestrength of 1180MPa and reduced silicon content offering both excellent deep drawability as well asoutstanding edge formability. Based on the results from the laboratory experiments, a composition

3.3. MICROSTRUCTURE CHARACTERIZATION AND MECHANICAL TESTING 23
was chosen which provides the most preferable mechanical properties and supports a cost-effectiveindustrial production of the grade. Microstructure and mechanical properties of the benchmarkgrade, IN1.5Si1180, containing 1.5mass% silicon and the newly developed grade, IN0.9Si1180, withchromium additions and a silicon content < 1mass%, were compared and their advantages werecarefully evaluated. The chemical compositions of the industrially produced 1180 sheet steel gradesused in this work are shown in Table 3.5.
Table 3.5: Composition of the industrial steel grades in mass%.Steel C Si Cr Mn + Mo Nb P S NIN1.5Si1180 0.17 - 0.22 1.5 < 0.2 2.3 - 2.7 < 0.05 < 0.01 < 0.01 < 0.007IN0.9Si1180 0.17 - 0.22 0.9 < 0.6 2.3 - 2.7 < 0.05 < 0.01 < 0.01 < 0.007
3.2.2 Production of cold-rolled sheets
Slabs of the compositions given in Table 3.5 were produced in a continuous caster. The slabs werereheated followed by hot rolling in a one-stand roughing mill with five reverse strokes and a sevenstand finishing mill. The final hot rolling temperature was approximately 900 C and the coilingtemperature approximately 600 C. To reduce the required cold rolling forces, the hot-rolled bandswere batch annealed at a temperature of 600 or 650 C. The tensile strengths before and after batchannealing were approximately 1200 to 1250MPa and 650 to 700MPa, respectively. The batchannealed bands were cold-rolled in a five stand cold rolling mill to the final thicknesses st of 1, 1.2,and 1.4mm. Finally, the cold-rolled strips were annealed in a continuous annealing line.
3.2.3 Annealing cycles
The cold-rolled strips were annealed in the continuous annealing line of voestalpine Stahl. In thisline the strips were electrolytically cleaned and annealed in a protective atmosphere of 95% N2
and 5% H2. The annealing process consists of heating, soaking, slow jet gas cooling, rapid jetgas cooling, overaging, and final cooling. The time-temperature schedules of the annealing cyclesare shown in Figure 3.4a. An annealing temperature of 850 C, a slow jet cooling temperature of720 C, and a strip speed of 80m/min were chosen. Three overaging temperatures, 360, 380, and400 C were applied, and a quench temperature range of 280 to 380 C was investigated. Withinone coil the quench temperature was lowered up to five times in steps of 10 to 20K (Figure 3.4b).The annealed sheets were finished in a skin-pass mill.
3.3 Microstructure characterization and mechanical testing
3.3.1 Metallography
Microstructures were evaluated by optical microscopy (OM), field emission gun-scanning electronmicroscopy, and transmission electron microscopy (TEM). The OM samples were etched usingLePera’s etchant, one half of which consists of 1% Na2S2O5 in aqueous solution and the other halfof 4% picric acid in ethanol [159]. This etching technique enables to distinguish between the bainiticand/or (tempered) martensitic matrix, the polygonal ferrite, and the retained austenite/martensiteinclusions. The examinations were conducted on a Zeiss Observer Z1m Axio with 500x and 1600xmagnification.
For scanning electron microscopy observations, the samples were mechanically polished usingfirst silicon oxide paper (STRUERS OPS) with different grain sizes of grits 320, 800, 1200, and 2400,

24 CHAPTER 3. EXPERIMENTAL PROCEDURE
a) b)
Figure 3.4: a) Industrial annealing cycle (time-temperature schedule) of the continuous annealingline, b) scheme of the quench temperature as a function of strip position s.
then water rinsed followed by air pressure cleaning the surface in between the different grit steps.Subsequently, mechanical polishing on a Struers Rotoforce was conducted using Struers MOL 3µmdiamant spray and ethanol for 4minutes in the first step and Struers MOL 1µm diamant sprayand ethanol for 4min in a second step. After intermediate etching with 5% Nital, i.e. ethanol with5 vol.% HNO3, for 10 s, a final mechanical polishing step was conducted using Struers MOL 1µmdiamant spray and ethanol for 4min. Finally, the samples were electropolished with the StruersLectroPol using 750ml ethanol (96 vol.%), 50ml destilled water, 80ml perchloric acid and 5 g citricacid monohydrate at a temperature of 5 C.
A field emission scanning electron microscope, Zeiss SUPRA 25, equipped with both in-lensand secondary electron detector was used for scanning electron microscopy (SEM). Electrons withrather small emission angle to the sample surface were collected by applying high voltages of up to10 keV. In this study, the in-lens detector has been used for SEM images, if not indicated otherwise.
In preparation for TEM the samples were produced by mechanical grinding up to a graining of2400 using 3mm diameter disks followed by electropolishing in acetic acid with 5-10% perchloricacid. TEM examinations were carried out with a voltage of 200 kV on a STEM Philips CM20 anda high resolution TEM Tecnai F20.
Finally, energy-dispersive X-ray spectroscopy (EDX) was employed to characterize the chemicalcomposition of selected areas of the observed sample surface, in particular to determine the type ofinclusions.
Quantitative void analysis
The quantitative void analysis was conducted by applying the secondary detector of the ZeissSUPRA 25, which runs on only 300 eV barely accelerating the electrons towards the detector. Thisdetector is recommended for void detection as it reduces the contrast between the microstructuralcomponents and between matrix and inclusions, while the voids remain clearly visible. Figure 3.5shows examples of SEM images used for quantitative void analysis and taken by applying thesecondary electron detector.
For qualitative and quantitative void analysis, the tested tensile samples were cut in the middleof the width of the sample and the surface of the cut was examined within the necking area in the

3.3. MICROSTRUCTURE CHARACTERIZATION AND MECHANICAL TESTING 25
a) Toa = 350 C b) Toa = 425 C
Figure 3.5: Scanning electron micrographs as used for quantitative void analysis of steel 0Nb1180for selected distances to the fracture surface and overaging temperatures Toa = 350 C and 425 C(SE2 detector, Zeiss SUPRA 25).
middle of the thickness. SEM images were taken of the cross section in the middle of the thicknessin 200µm steps to the fracture surface. The size of each void and the number of voids in eachmicrograph was determined using the software ImageJ [160]. The void density was determined fromthe number of voids within each SEM image divided by its area of 0.2mm by 0.15mm.
3.3.2 Magnetic measurements
The amount of retained austenite was measured by means of saturation magnetization method(SMM), also called Joch-Isthmus method [161, 162]. In this method a flux sensoring measurementcoil is exposed to a high homogeneous magnetic field. When a magnetic specimen is pushed throughthe surrounding coaxial measurement coil, the integral of the voltage pulse Uind is induced in thecoil. The magnetization J can be calculated from this voltage pulse in the following way:
J =
∫UinddtNl V
, (3.1)
where N is a device and calibration constant, l is the length of the measurement coil and V isthe volume of the specimen. To calculate the actual amount of retained austenite, a referencemagnetization is required. The reference magnetization is the magnetization of a specimen with thesame composition and without retained austenite in the microstructure. It can either be obtainedfrom a measurement or a calculation based on fittings from measurements. In this work, thefollowing equation was applied to calculate the reference magnetization Jref :
Jref = JFe −∑i
αi ·Ai. (3.2)
JFe is the magnetization of pure iron (2.158 T), αi is the reference factor of element i given inTable 3.6 and Ai is the amount of the alloying element in volume percent.
Applying equations 3.1 and 3.2 it is possible to determine the amount of retained austenite fγby measuring the voltage pulse of a specimen pushed through the yoke:

26 CHAPTER 3. EXPERIMENTAL PROCEDURE
fγ =Jref − JJref
· 100%. (3.3)
Table 3.6: Austenite reference element factors αi in T/% for the calculation of the reference mag-netization (Equation 3.2).
Alloying Element C Si Mn Al Cr MoReference Factor 0.15 0.048 0.0244 0.057 0.0305 0.600
3.3.3 X-ray diffraction
Carbon content of the retained austenite and phase fractions were determined by employing theX’Pert Pro PANalytic X-ray diffractometer. After polishing with silicon oxide paper, the sameprocedure as already described for the SEM samples was used, with the exception of electropolishing.Four peaks each of austenite and ferrite were monitored. The intensity and the position of each peakwere determined by peak fitting software. The phase fractions were determined by applying theRietveld method to the peak intensity [163, 164]. The peak position provides the lattice parameter,which was used to determine the carbon content of the retained austenite. The carbon content canbe determined directly using various empirically fitted equations. In this work, the thermodynamiccalculation tool Thermo-Calc c© TCFE6 [165], which is also based on empirical fitting, was usedfor this purpose. The carbon content was varied to match the lattice constant of the fcc latticeextrapolated to room temperature.
3.3.4 Dilatometry
Continuous and isothermal dilatometer experiments were conducted on as-cold-rolled material(1 x 3.5 x 10mm) using a Bähr dilatometer DIL 805 A/D. The samples were exposed to conductiveheating and subsequent cooling using nitrogen gas. The purpose of this study was to characterizethe transformation behaviour for sheet steels with the compositions listed in Table 3.2 to 3.5. Thesamples for the isothermal and the continuous dilatometer experiments were heated with 25K/sand fully austenitized at 900 C for 60 s. The austenitization step was followed by quenching witha cooling rate of 50K/s to overaging temperature for the isothermal heat treatment (Figure 3.7a).For continuous cooling experiments, the cooling rate was varied between 3 and 80K/s accordingto Figure 3.7b. Isothermal heat treatment was varied in a temperature range of 250 to 600 C in50K steps and additionally 375 C and 425 C with an overaging time of 1200 s (Figure 3.7a). Theaustenitization behaviour was studied by heating with a heating rate of 3K/s, annealing at 900 Cfor 60 s and quenching with a cooling rate of 30K/s, as shown in Figure 3.7c.
As a measure of the transformation progress, the normalized length of the dilatometer samplewas determined according to the following equation:
∆lnorm = (l − l0) /lmax · 100 %, (3.4)
where l is the current, l0 the initial, and lmax the total sample length after quenching to roomtemperature. Figure 3.6c illustrates how these lengths of the dilatometer analysis are determinedby a fit of the ferrite and the austenite curve as well as a shift of the ferrite curve by the amount ofretained austenite. The thermal expansion of the specimen at a given temperature is taken into ac-count for both fits. The initial length refers to the beginning of the overaging step for the isothermalexperiments and to the sample length before quenching for continuous cooling experiments.

3.3. MICROSTRUCTURE CHARACTERIZATION AND MECHANICAL TESTING 27
Figure 3.6: Scheme of the dilatometer analysis including the difference ∆l between the current lengthof the sample and the sample length at room temperature, austenite fraction, ferrite fraction, andretained austenite correction. The grey quadratic fit of the curve from room temperature to Ac3
temperature is the difference between the length of the untransformed ferritic specimen and thesample length at room temperature. The blue dotted linear fit of the curve above Ar3 temperatureis the difference between length of the fully austenitized specimen and the sample length at roomtemperature.
Table 3.7: Tensile test geometries of tested F07 and F01.Sample F07 F01gauge length [mm] 80±0.1 35±0.05sample length [mm] 250±0.1 100±0.025sample width [mm] 20±0.1 12.5 ±0.025tolerance [mm] 0.05 0.05
3.3.5 Mechanical testing
Tensile test
Flat tensile tests have been performed according to the international standard ISO 6892-1. Strengthvalues such as yield strength and tensile strength as well as elongation, in particular uniform andtotal elongation, under exposure of a monotone momentum-free quasi-static increasing uniaxialtensile load were determined from the conducted tensile tests.
Industrially produced tensile samples were tested with a gauge length of 80mm, while laboratoryannealed tensile samples had been machined to a gauge length of 35mm before tensile testing.Sample geometries are listed in Table 3.7.
In addition to basic values such as yield strength, tensile strength and uniform elongation,the strain-hardening behaviour can be deduced from the stress strain-curve by calculating strain-hardening values such as strain-hardening exponent n, the strain-hardening rate θ, and the differ-ential n-value, as described in Section 2.3.2.
The stability of retained austenite against SIMT was investigated by means of interrupted tensiletests. For this, tensile strains between 1 and 10% were applied in steps of 1%. An additionalspecimen was strained to 0.5% tensile strain.

28 CHAPTER 3. EXPERIMENTAL PROCEDURE
a) b) c)
Figure 3.7: Dilatometer annealing cycles: a) Overaging (Toa = 250, 300, 350, 375, 400, 425, 450,500, 550, and 600 C), b) continuous cooling (cooling rate T = 3, 10, 20, 30, 40, 50, and 80K/s),and c) austenitization.
Hole expansion test
Hole expansion tests (HET) have been conducted for selected samples according to the hole ex-panding test method of ISO/TS 16630:2009(E), metallic materials. Figure 3.8 shows a sketch ofthe axis-symmetrical hole expansion test setup with die, matrix and sample. D0 denote the initialdiameter, Dh the final diameter, and Dd the die diameter.
Figure 3.8: Hole expansion test sketch. 1: Sample, 2: Matrix, 3: Rim, 4: Punch, 5: Crack.
The hole expansion value is calculated as follows:
λ =Df −D0
D0∗ 100 (3.5)
Hole expansion tests on samples with punched holes are widely used in industry. In the presentwork, all hole expansion data will refer to specimens with punched holes if not indicated otherwise.

Chapter 4
Results
4.1 Influence of alloying elements on TBF and Q&P sheet steel
4.1.1 Silicon in the 980 grade
Silicon plays an important role as an alloying element for TRIP-assisted steels such as TBF andQ&P steels. As described in Section 2.2.2, its function in suppressing cementite precipitation is ofcritical importance for austenite stabilization through carbon partitioning during the overaging step.However, significant effort has been put into reducing the amount of silicon caused by the mentionedshortcomings such as Si-oxides on the surface. It is therefore important to evaluate the effect ofsilicon additions to the investigated steel grades. It will be shown that small variations in siliconcontent can largely affect phase transformation, microstructure and, thus, mechanical properties ofthe herein presented base composition designed for 980MPa minimum tensile strength. Parts ofthe results presented in this section were previously published [166].
Dilatometer experiments were conducted to use information about phase transformation toexplain changes in mechanical properties caused by the addition of silicon. The transformed phasefractions as a function of temperature during continuous cooling at 3, 10, and 80K/s of the 980 gradeare shown in Figure 4.1a for a silicon content of 0.8, 0.9, and 1.0mass%. The addition of siliconresults in slight acceleration of diffusion-controlled phase transformations. AboveMs temperature ofapproximately 370 C, the higher the silicon content, the higher the transformed fraction for a giventemperature irrespective of cooling rate. Thus, polygonal as well as bainitic ferrite forms faster dueto the addition of silicon. It is worth noting, that Ms temperature appears to be higher for highersilicon contents, which is possibly a consequence of the mentioned promoted diffusion-controlledphase transformation.
Figure 4.1b shows the isothermal time temperature transformation (TTT) diagram of the980 grade silicon variants. There are minor changes of phase transformation behaviour duringoveraging as a result of changes in silicon content within the observed range of 0.8 to 1.0mass%. Inthe complete observed range from 350 to 600 C, phase transformation is slightly shifted to longeroveraging times with increasing silicon content. The acceleration in transformation kinetics duringcontinuous cooling appears to be in contradiction to the deceleration during overaging. This canbe explained by the fact that silicon acts both as accelerator and decelerator of transformationkinetics. On the one hand, as a ferrite stabilizer, silicon increases the A3 temperature and siliconadditions lead to higher driving forces for ferrite formation. On the other hand, silicon additionsreduce the diffusivity of elements such as carbon lowering the velocity of diffusion-controlled phasetransformations.
Figure 4.2 shows LePera etched optical micrographs of steels 0.8Si980, 0.9Si980, and 1.0Si980for overaging temperatures 350 C and 425 C. Brown areas are tempered martensite (TM) or lower
29

30 CHAPTER 4. RESULTS
200 300 400 500 600 7000
20
40
60
80
100
T [°C]
f trans
[%]
~Ms (10%)
3 K/s 10 K/s 80 K/s 0.8Si980 0.9Si980 1.0Si980
SiSi
0.1 1 10 100 1000
300
400
500
600
20 % 60 % 0.8Si980 0.9Si980 1.0Si980
T oa [°
C]
toa
[s]
Figure 4.1: a) Transformed phase fraction during continuous cooling (T = 3K/s, 10K/s, 80K/s)and b) isothermal TTT diagram of 20% and 60% transformed phase fraction of steels 0.8Si980,0.9Si980 and 1.0Si980 (Tan = 900 C, T ≈ 70K/s).
bainite (LB). (Upper) bainite (UB) can be brownish or blue. The lath size of the bainite increasesfrom low to high overaging temperatures. At high overaging temperatures, bainite can becomeglobular and carbide-free. Black dots indicate carbide precipitates, usually cementite. Carbidespreferably precipitate at grain boundaries or laths, which helps to visualize them and distinguishbetween the microstructure components. Purely white areas indicate retained austenite. There aredifferent types of retained austenite with different shapes such as globular grains or lath-like films.Large white regions can be a mixture of retained austenite and martensite MA. Polygonal ferrite isrepresented by light plain blue regions without carbides.
Some polygonal ferrite is visible in particular in the microstructure with the highest silicon con-tent (Figure 4.2c). The brownish tempered martensite as well as the brown-blue lower bainite areasbecome more structured and lath-like with increasing silicon content at 350 C overaging temper-ature. For this overaging temperature, the number and size of the white retained austenite grainsincreases with increasing silicon content, resulting in a higher total amount of retained austenite.At the higher overaging temperature of 425 C, the size of the retained austenite/martensite islandand the number of cementite particles slightly decrease with increasing silicon content. A decreasein the number of carbides with increasing silicon content is visible for this overaging temperature.
Figures 4.3a shows yield strength, tensile strength, uniform elongation, and amount of retainedaustenite as a function of overaging time for overaging temperatures 350 C and 425 C. For 350 C,the yield strengths first drop at low overaging times and subsequently increase to a large extent of upto more than 100MPa with increasing overaging time, whereas for 425 C overaging temperatureyield strengths remain constant throughout the entire range of overaging temperatures. Tensilestrength decreases first strongly then less pronounced with increasing overaging time until it reachesa plateau at high overaging times above 300 s. The uniform elongation remains fairly constant withinthe whole overaging time range at low overaging temperature of 350 C. At the high overagingtemperature of 425 C, a strong increase in uniform elongation is present with overaging time up to180 s followed by a slight drop and a plateau from 300 s to 600 s. The amount of retained austeniteshows a similar behaviour with overaging temperature compared to uniform elongation. It remainsalmost constant with variations in overaging time for 350 C. However, the amount of retainedaustenite slightly increases from 60 s to 120 s overaging temperature and then slightly decreaseswithin 120 s to 600 s overaging time for both overaging temperatures.

4.1. INFLUENCE OF ALLOYING ELEMENTS ON TBF/Q&P SHEET STEEL 31
a) 0.8Si980, Toa = 350 C b) 0.9Si980, Toa = 350 C c) 1.0Si980, Toa = 350 C
d) 0.8Si980, Toa = 425 C e) 0.9Si980, Toa = 425 C f) 1.0Si980, Toa = 425 C
Figure 4.2: LePera etched optical micrographs of Q&P and TBF 980 grade silicon variants 0.8Si980,0.9Si980, and 1.0Si980 for fixed overaging temperatures of 350 C and 425 C comprising polygonalferrite (F), bainite (B), lower bainite (LB), tempered martensite (TM), retained austenite (A) andretained austenite/martensite islands (MA) (toa = 600 s, T ≈ 50K/s).
In comparing the different silicon contents, yield strength slightly decreases for an overagingtemperature of 350 C and then increases with increasing silicon content, whereas this trend ispresent but negligible at 425 C overaging temperature. The slight increase in tensile strength forthe high overaging temperature and the decrease in tensile strength with increasing silicon contentat low overaging temperature slightly exceeds the scatter band of 20MPa. In contrast to the minorchanges in yield and tensile strength, higher silicon content results in a slight increase in uniformelongation and the amount of retained austenite in the entire range of overaging times. In particularfor 425 C overaging temperature, uniform elongation is higher for higher silicon contents. There isan absolute increase in uniform elongation of 1%, which is equivalent to 20% with increasing siliconcontent from 0.8Si980 to 0.9Si980, whereas the additional increase in uniform elongation from grade0.9Si980 to 1.0Si980 is negligible. The amount of retained austenite, in contrast, shows the greatestincrease from steel 0.9Si980 to 1.0Si980.
Yield strength, tensile strength, uniform elongation, and amount of retained austenite as afunction of overaging temperature are shown in Figures 4.3b for an overaging time of 600 s. Thegeneral tendency of yield strength with overaging temperature is a strong decrease up to an overagingtemperature of 450 C. The yield strength for an overaging temperature of 475 C lies within thescatter band of that for 450 C overaging temperature. Tensile strength decreases with increasing

32 CHAPTER 4. RESULTS
600
800
1000
Toa 350 °C 425 °C0.8Si980 0.9Si980 1.0Si980
R p0.2 [M
Pa]
800
1200
1600
R m[M
Pa]
4
8
12
A u [%]
Si
0 200 400 6000
4
8
12
16
Si
toa [s]
f [v
ol. %
]
Si
Si
Si
Si
600
800
1000
0.8Si980 0.9Si980 1.0Si980
R p0.2 [M
Pa]
800
1200
1600
R m[M
Pa]
4
8
12
A u [%]
Si
Si
350 375 400 425 450 4750
4
8
12
16
Toa [°C]
f [v
ol. %
]
a) b)
Figure 4.3: Yield strength, tensile strength, uniform elongation, and amount of retained austenite ofgrades 0.8Si980, 0.9Si980, and 1.0Si980 a) as a function of overaging time for overaging temperaturesToa = 350 C and Toa = 425 C, b) as a function of overaging temperature (toa = 600 s).
overaging temperature in the entire observed range of 350 to 475 C. The decrease is, however,less pronounced above 400 C. A sigmoidal increase of uniform elongation from 350 C to 425 Coveraging temperature is followed by a decrease. The increase of retained austenite with increasingoveraging temperature is rather straight, and the drop in the amount of retained austenite above

4.1. INFLUENCE OF ALLOYING ELEMENTS ON TBF/Q&P SHEET STEEL 33
425 C is much more pronounced when compared to that of the uniform elongation.The changes in yield and tensile strength with variations in silicon content mutually fall into each
of their scatter bands. However, at overaging temperatures up to 375 C, the yield strength slightlyincreases with increasing silicon content. As shown in Figure 4.3b, uniform elongation and amountof retained austenite increase with increasing silicon content for almost all overaging temperatures.However, the influence of silicon decreases as the overaging temperature increases, and for the TBFsteels that were held at 475 C for 600 s, uniform elongation is the same for all 980 silicon variants.
4.1.2 Silicon in the 1180 grade
The transformed phase fraction during continuous cooling of the 1180 grade silicon variants isshown in Figure 4.4a. In contrast to the 980 grade variants, continuous phase transformation isslightly shifted to lower amounts of transformed fraction by the addition of silicon. As shown inFigure 4.4b, higher silicon content results in decelerated phase transformation within a range of 450to 600 C overaging temperature. This deceleration is more pronounced than the one observed inthe 980 grade variants. However, outside this overaging temperature window, the TTT curves ofthe different silicon variants are very similar.
200 300 400 500 600 7000
20
40
60
80
100 3 K/s 10 K/s 80 K/s 0.8Si1180 0.9Si1180 1.0Si1180
T [°C]
f trans
[%] ~M
s (10%)
Si
Si
0.1 1 10 100 1000
300
400
500
600
20 % 60 % 0.8Si1180 0.9Si1180 1.0Si1180
T oa
[°C
]
toa
[s]
SiSi
Figure 4.4: a) Transformed phase fraction during continuous cooling (T = 3K/s, 20K/s, 80K/s)and b) isothermal TTT diagram of 20% and 60% transformed phase fraction for steels 0.8Si1180,0.9Si1180, and 1.0Si1180 (Tan = 900 C, T ≈ 70K/s).
LePera etched micrographs of the 1180 silicon variants are shown in Figure 4.5. For an overagingtemperature of 350 C the morphology of the tempered martensitic/bainitic matrix significantlyvaries between the different silicon variants. The lath structure is clearly visible in the event ofhigher silicon content, whereas the microstructure is much more blurry, globular and interwoven(Figure 4.5a-c) toward lower silicon content. A slight decrease in the amount of carbides and anincrease in number and size of retained austenite grains with increasing silicon content is visible for350 C overaging temperature.
The structure of the bainitic matrix of the microstructures that were held at 425 C overagingtemperature is also coarser in the steels with lower silicon content (Figure 4.5d-f). For 425 Coveraging temperature, the amount of carbides decreases with increasing silicon content even moreso than at 350 C. The size of the retained austenite/martensite islands is very similar within thesilicon variants but slightly larger for higher silicon contents.
Yield strength, tensile strength, uniform elongation, and the amount of retained austenite as a

34 CHAPTER 4. RESULTS
a) 0.8Si1180 Toa = 350 C b) 0.9Si1180 Toa = 350 C c) 1.0Si1180 Toa = 350 C
d) 0.8Si1180 Toa = 425 C e) 0.9Si1180 Toa = 425 C f) 1.0Si1180 Toa = 425 C
Figure 4.5: LePera etched optical micrographs of Q&P and TBF 1180 grade silicon variants0.8Si1180, 0.9Si1180, and 1.0Si1180 for fixed overaging temperatures of 350 C and 425 C com-prising polygonal ferrite (F), bainite (B), lower bainite (LB), tempered martensite (TM), retainedaustenite (A) and retained austenite/martensite islands (MA) (toa = 600 s, T ≈ 50K/s).
function of overaging time and overaging temperature are shown in Figures 4.6. There are someremarkable differences between the general trends of the mechanical properties of the 980 and1180 grade silicon variants as a function of overaging time. The decrease in yield strength withincreasing overaging time is much more pronounced and lasts up to 120 s overaging time. Foran overaging temperature of 425 C, the yield strength shows a strong decrease and continues todecrease, however, less pronounced with increasing overaging time. This behaviour is in strongcontrast to the 980 grade, where the yield strength for elevated overaging temperatures is nearlyindependent of overaging temperature.
When the absolute values of the observed properties are compared at the end of the overagingstep after 600 s overaging, yield strength is more than 1000MPa, which is 100MPa higher in the1180 than in the 980 silicon variants for an overaging temperature of 350 C. Contrastingly at 425 Coveraging temperature, yield strength is 50MPa lower in the 1180 silicon variants when comparedto the 980 group for the same overaging time. Furthermore, the drop in yield and tensile strengthat the beginning of the overaging step is much more pronounced in the 1180 group as opposed tothe 980 variants, where it is almost negligible. The tensile strength of the 980 group is 980MPa foran overaging temperature of 425 C and ∼220MPa higher for 350 C overaging temperature. In the1180 group, tensile strength is 1150MPa for 425 C overaging temperature and only 150MPa higher

4.1. INFLUENCE OF ALLOYING ELEMENTS ON TBF/Q&P SHEET STEEL 35
600
800
1000
Toa 350 °C 425 °C0.8Si1180 0.9Si1180 1.0Si1180
R p0.2 [M
Pa]
Si
800
1200
1600
R m[M
Pa]
4
8
12
A u [%]
0 200 400 6000
4
8
12
16
toa [s]
f [v
ol. %
]
600
800
1000
0.8Si1180 0.9Si1180 1.0Si1180
R p0.2 [M
Pa]
800
1200
1600
R m[M
Pa]
4
8
12
A u [%]
350 375 400 425 450 4750
4
8
12
16
Toa [°C]
f [v
ol. %
]
Si
a) b)
Figure 4.6: Yield strength, tensile strength, uniform elongation, and amount of retained austeniteof grades 0.8Si1180, 0.9Si1180, and 1.0Si1180 a) as a function of overaging time for overagingtemperatures Toa = 350 C and Toa = 425 C, b) as a function of overaging temperature (toa = 600 s).
at an overaging temperature of 350 C. Uniform elongation of the 980 and the 1180 silicon variantsare 5 and 10% for 350 and 425 C overaging temperature, respectively. The difference betweenuniform elongation of the 980 and the 1180 silicon variants is almost negligible. The low overagingtemperature of 350 C results in amounts of retained austenite of 2 to 4 vol.%, while all silicon

36 CHAPTER 4. RESULTS
variants of the 1180 grade comprise 6 vol-% at the end of the overaging step. With ∼18 vol.%,the 1180 silicon variants contain approximately twice as much retained austenite compared to the980 group for the high overaging temperature of 425 C. The differences between the mechanicalproperties and amount of retained austenite for different silicon contents within the 1180 groupare much less pronounced compared to the 980 group. For the low overaging temperature, theyield strength of the steel with the highest silicon content is higher compared to the other variants.A slight increase in tensile strength with increasing silicon content can be observed in the entireinvestigated range of overaging times. In terms of all other observed properties the 1180 groupsilicon variants behave very similar to each other.
Mechanical properties and the amount of retained austenite as a function of overaging temper-ature are shown in Figures 4.6b. It is worth noting, that the tensile strength of the 1180 gradesilicon variants increases with increasing overaging temperature above 425 C. This is in contrast tothe 980 group, where it continues to decrease.
The yield strength of steel 1.0Si1180 is distinctly higher compared to grade 0.8Si1180 and0.9Si1180 for nearly all overaging temperatures below Toa = 450 C. Tensile strength slightly in-creases with increasing silicon content at almost all overaging temperatures, as opposed to the 980group, which shows negligible changes in tensile strengths with varying silicon content within theobserved range. The trends of uniform elongation with increasing overaging temperature of the980 and the 1180 grade are comparable. While the uniform elongation of the 980 silicon variantssignificantly increases with increasing silicon content, in the 1180 group uniform elongation evenslightly decreases for higher amounts of silicon. The amount of retained austenite in the 1180 siliconvariants is higher for higher silicon contents up to an overaging temperature of 425 C.
4.1.3 Manganese in the 980 grade
The choice of the appropriate manganese content is crucial to many important characteristic prop-erties such as transformation kinetics and austenite stability of TBF and Q&P steels. This chapterprovides the results of investigations on the influence of 2.2 to 2.6mass% manganese on phasetransformations, microstructure, and mechanical properties of the 980 group TBF/Q&P steels.
The transformed phase fraction during continuous cooling at a rate of 3, 10, and 80K/s of the980 grade manganese variants is shown in Figure 4.7a. Increasing the cooling rate results in loweramounts of transformed phase fraction during cooling. Manganese significantly shifts the phasetransformation to lower transformed phase fractions for a given temperature. Ms temperatureis slightly lower for higher manganese contents. Isothermal phase transformation is significantlydecelerated at all overaging temperatures by the addition of manganese.
Figure 4.8 shows LePera etched optical micrographs of the 980 manganese variants for overagingtemperatures 350 C and 425 C with an overaging time of 600 s. The steels that were held at lowoveraging temperature exhibit a more lath-like rather than globular microstructure with a muchsmaller lath thickness and longer laths compared to the steels with the same composition and higheroveraging temperature. The matrix of the low overaging temperature (Figure 4.8a-c) is also darkercompared to the high overaging temperature (Figure 4.8d-f), which can be explained by the finerdistribution of carbides within the lath structure. Retained austenite/martensite islands are largerat the higher overaging temperature. However, this difference is much more pronounced in thesilicon variants of the 980 and even more so in the 1180 grade, as can be seen above (Figure 4.2 and4.5).
The matrix of steel 2.2Mn980 is more globular compared to steels 2.4Mn980 and 2.5Mn980. Inparticular at an overaging temperature of 350 C, steels 2.4Mn980 and 2.5Mn980 are much morelath-like than steel 2.2Mn980. At higher overaging temperature, the microstructures of the steelswith higher manganese contents are also finer and the grains are slightly smaller as opposed to

4.1. INFLUENCE OF ALLOYING ELEMENTS ON TBF/Q&P SHEET STEEL 37
200 300 400 500 600 7000
20
40
60
80
100 3 K/s 10 K/s 80 K/s 2.2Mn980 2.4Mn980 2.6Mn980
T [°C]
f trans
[%]
Mn
~Ms (10%)
0.1 1 10 100 1000
300
400
500
600
Mn
20 % 60 % 2.2Mn980 2.4Mn980 2.6Mn980
T oa [°
C]
toa
[s]
Figure 4.7: a) Transformed phase fraction during continuous cooling (T = 3K/s, 10K/s, 80K/s)and b) isothermal TTT diagram of 20% and 60% transformed phase fraction of steels 2.2Mn980,2.4Mn980 and 2.5Mn980 (Tan = 900 C, T ≈ 70K/s).
steel 2.2Mn980. Furthermore, the steel with the lowest manganese content of 2.2mass% containssmall amounts of polygonal ferrite (Figure 4.8a). The size of the retained austenite/martensiteislands slightly increases with increasing manganese content in the steels that were held at 425 C(Figure 4.8d-f). Finally, for both overaging temperatures, some carbide-depleted areas are presentin the steel with the lowest manganese content, 2.2Mn980.
Figure 4.9a shows yield strength, tensile strength, uniform elongation, and the amount of re-tained austenite as a function of overaging time of the 980 manganese variants. The yield strengthfirst decreases then increases with increasing overaging for an overaging temperature of 350 C. Atthe high overaging temperature of 425 C steel 2.2Mn980 and 2.4Mn980 show a strong then slightdecrease in yield strength in accordance to the 1180 silicon variants. The yield strength of the steelwith the lowest manganese content, however, increases with increasing overaging time after 180 soveraging. The strongly decreasing trend in tensile strength of the manganese variants with increas-ing overaging time is also in good agreement with both the 980 and the 1180 silicon variants aswell as the plateau for longer overaging times. However, the tensile strength slightly increases withincreasing overaging time above an overaging time of 180 s for an overaging temperature of 425 C.Similar to the silicon variants, uniform elongation remains at 5% for all overaging times at the lowoveraging temperature. At an overaging temperature of 425 C, however, uniform elongation firstincreases with increasing overaging time, in accordance with the silicon variants, but then decreaseswith increasing overaging temperature. The same trends can also be observed for the amount ofretained austenite, except for the two variants with the highest manganese content, which keep theirhigh amounts of retained austenite at long overaging times.
While the yield strength increases with increasing manganese content for an overaging tempera-ture of 350 C, a decrease in yield strength with increasing manganese content is observed for 425 Coveraging temperature for longer overaging times than 60 s, which becomes more pronounced forprolonged overaging times. Manganese additions slightly increase the tensile strength to the sameextent for all overaging times and for both overaging temperatures. While the uniform elongationof 5% is unaffected by manganese additions at the 350 C overaging temperature, the variant withthe lowest manganese content shows lower uniform elongation than the other variants for overagingtimes of more than 120 s. The amount of retained austenite increases with increasing manganesecontent at both overaging temperatures, however, more pronounced for the higher overaging tem-

38 CHAPTER 4. RESULTS
a) 2.2Mn980, Toa = 350 C b) 2.4Mn980, Toa = 350 C c) 2.5Mn980, Toa = 350 C
d) 2.2Mn980, Toa = 425 C e) 2.4Mn980, Toa = 425 C f) 2.5Mn980, Toa = 425 C
Figure 4.8: LePera etched optical micrographs of TBF heat-treated 980 grade manganese vari-ants 2.2Mn980, 2.4Mn980, and 2.5Mn980 for overaging temperatures 350 C and 425 C comprisingpolygonal ferrite (F), bainite (B), lower bainite (LB), tempered martensite (TM), retained austenite(A) and retained austenite/martensite islands (MA) (toa = 600 s, T ≈ 50K/s).
perature.With respect to the manganese influence as a function of overaging temperature (Figure 4.9b),
the yield strength decreases with increasing manganese content for overaging temperatures 400 Cand 425 C, and is unaffected by variations in manganese content above or below these temperatures.Tensile strength increases with increasing manganese content, in particular at higher overaging tem-peratures. Up to 400 C overaging temperature, uniform elongation slightly increase with increasingoveraging temperature. Above this temperature, uniform elongation for higher manganese contentdecreases more pronounced with increasing overaging temperature. At an overaging temperatureof 475 C, the tendency is inverse compared to 425 C, i.e. higher manganese content results inlower uniform elongation. The amount of retained austenite is higher for higher manganese contentbelow 450 C overaging temperature. The increase in retained austenite with increasing overagingtemperature up to 425 C is much more pronounced for steel 2.4Mn980 and 2.5Mn980 as opposedto grade 2.2Mn980. Above this temperature, the amount of retained austenite of steel 2.5Mn980drops significantly to almost the same level as grade 2.2Mn980.

4.1. INFLUENCE OF ALLOYING ELEMENTS ON TBF/Q&P SHEET STEEL 39
600
800
1000
Mn
Mn
Mn
Toa 350 °C 425 °C2.2Mn980 2.4Mn980 2.6Mn980
R p0.2 [M
Pa]
Mn
Mn
Mn
800
1200
1600
R m[M
Pa]
4
8
12
A u [%]
0 200 400 6000
4
8
12
16
toa [s]
f [v
ol. %
]
600
800
1000
2.2Mn980 2.4Mn980 2.6Mn980
R p0.2 [M
Pa]
Mn
Mn800
1200
1600
R m[M
Pa]
4
8
12
A u [%]
350 375 400 425 450 4750
4
8
12
16
Toa [°C]
f [v
ol. %
]
a) b)
Figure 4.9: Yield strength, tensile strength, uniform elongation, and amount of retained austeniteof grades 2.2Mn980, 2.4Mn980, and 2.5Mn980 a) as a function of overaging time for overagingtemperatures Toa = 350 C and Toa = 425 C, b) as a function of overaging temperature (toa = 600 s).
4.1.4 Manganese in the 1180 grade
This section shows the response of phase transformation behaviour, microstructure, and mechanicalproperties to manganese variants in the 1180 base composition. The continuous and isothermalphase transformation behaviour is represented by Figure 4.10. An increase in manganese content

40 CHAPTER 4. RESULTS
from 2.2 to 2.6mass% results in a significant shift of transformations to lower phase fractions fora given temperature during continuous cooling. The transformed fraction of microstructure com-ponents formed at higher overaging temperature are therefore much greater for steels with lowermanganese content. Further, Ms temperature is lowered by manganese additions. Manganese,furthermore, shifts the isothermal transformation to longer overaging times. From 350 to 450 Coveraging temperature the deceleration of isothermal transformation through the addition of man-ganese is comparable. Above 450 C, the effect is much stronger and increases with increasingoveraging temperature.
200 300 400 500 600 7000
20
40
60
80
100 3 K/s 10 K/s 80 K/s 2.2Mn1180 2.4Mn1180 2.6Mn1180
T [°C]
f trans
[%]
Mn
~MS (10%)
Mn
0.1 1 10 100 1000
300
400
500
600
Mn
20 % 60 % 2.2Mn1180 2.4Mn1180 2.6Mn1180
T oa [°
C]
toa
[s]
Figure 4.10: a) Transformed phase fraction during continuous cooling (T = 3K/s, 10K/s, 80K/s)and b) isothermal TTT diagram of 20% and 60% transformed phase fraction of steels 2.2Mn1180,2.4Mn1180 and 2.6Mn1180 (Tan = 900 C, T ≈ 70K/s).
Figure 4.11 shows LePera etched optical micrographs of the 1180 grade manganese variants foroveraging temperatures 350 C and 425 C with an overaging time of 600 s. The differences betweenthe different manganese grades of the same heat treatment are even more subtle than between the980 manganese variants. The microstructure is also generally finer for higher manganese contentsat this overaging temperature.
Steels 2.4Mn1180 and 2.6Mn1180 comprise some retained austenite/martensite (MA) islandseven for an overaging temperature of 350 C, which are relatively large and are brownish in partic-ular towards the center of the inclusion (Figure 4.11b and 4.11c). These areas indicate temperedmartensite. The carbon content decreases towards the center of the MA islands, since the diffusiondistance for carbon atoms during overaging is larger. Therefore, the center is more likely to trans-form to martensite, which is auto-tempered upon the final cooling. Auto-tempered martensite ismore likely for higher manganese contents and lower overaging temperatures such as 350 C, becauseof the larger austenite grains and the smaller diffusion distances at this temperature compared tohigher overaging temperatures. The stabilization of the austenite by manganese additions doesnot necessarily result in more retained austenite, since there is less interstitially dissolved carbonavailable as a result of carbon precipitation, and the diffusion distances of the carbon are shorterat lower overaging temperatures.
Similar to the 980 manganese variants, the retained austenite/martensite islands of the 1180 gradefor an overaging temperature of 425 C increase in size and amount with increasing manganese con-tent (Figure 4.11d-f). In steel 2.6Mn1180 for 425 C overaging temperature, banding of retainedaustenite/martensite islands is present. Finally, in analogy to the 980 grade, some areas exist witha lower amount of carbides in the steel with the lowest manganese content (Figure 4.11a).

4.1. INFLUENCE OF ALLOYING ELEMENTS ON TBF/Q&P SHEET STEEL 41
a) 2.2Mn1180, Toa = 350 C b) 2.4Mn1180, Toa = 350 C c) 2.6Mn1180, Toa = 350 C
d) 2.2Mn1180, Toa = 425 C e) 2.4Mn1180, Toa = 425 C f) 2.6Mn1180, Toa = 425 C
Figure 4.11: LePera etched optical micrographs of TBF heat-treated 1180 grade manganese variants2.2Mn1180, 2.4Mn1180, and 2.6Mn1180for overaging temperatures 350 C and 425 C comprisingpolygonal ferrite (F), bainite (B), lower bainite (LB), tempered martensite (TM), retained austenite(A) and retained austenite/martensite islands (MA) (toa = 600 s, T ≈ 50K/s).
Yield strength, tensile strength, uniform elongation, and the amount of retained austenite asa function of overaging time are shown in Figure 4.12a. An increase in manganese content resultsin an increase of yield strength at short overaging times and a strong decrease at long overagingtimes. For the overaging temperature of 350 C, this is because steel 2.4Mn1180 and even more sograde 2.2Mn1180 show a decrease and then an increase of yield strength with increasing overagingtime. At the high overaging temperature, the decrease in yield strength is much stronger for highermanganese contents.
Tensile strength shows the same behaviour as yield strength at 425 C, whereas at 350 C highermanganese content brings about higher tensile strengths. Higher manganese contents, furthermore,result in significantly enhanced uniform elongation at both overaging temperatures. The manganesevariants show the same tendency for the amount of retained austenite as a function of overaging timeas for uniform elongation except for the steel with the highest manganese content, which exhibits asignificant drop in the amount of retained austenite with increasing overaging time.
In contrast to the 980 group, manganese shows a very strong impact on mechanical proper-ties and the amount of retained austenite as a function of overaging temperature (Figure 4.12b).Mechanical properties and amount of retained austenite show a switch in tendencies with man-ganese content at a given overaging temperature. Up to an overaging temperature of 425 C, yield

42 CHAPTER 4. RESULTS
600
800
1000
Mn
Toa 350 °C 425 °C2.2Mn1180 2.4Mn1180 2.6Mn1180
R p0.2 [M
Pa]
Mn
Mn
Mn
Mn
Mn
800
1200
1600
R m[M
Pa]
4
8
12
A u [%]
0 200 400 6000
4
8
12
16
toa [s]
f [v
ol. %
]
600
800
1000
1200
2.2Mn1180 2.4Mn1180 2.6Mn1180
R p0.2 [M
Pa]
Mn
Mn
Mn
Mn
800
1200
1600
R m[M
Pa]
4
8
12
A u [%]
350 375 400 425 450 4750
4
8
12
16
Toa [°C]
f [v
ol. %
]
a) b)
Figure 4.12: Yield strength, tensile strength, uniform elongation, and amount of retained austeniteof grades 2.2Mn1180, 2.4Mn1180, and 2.6Mn1180 a) as a function of overaging time for overagingtemperatures Toa = 350 C and Toa = 425 C, b) as a function of overaging temperature (toa = 600 s).
strength decreases with increasing manganese content, whereas the addition of manganese abovethis temperature results in enhanced yield strength. The same tendencies exist in the behaviour oftensile strength for changes in the manganese content. However, these trends are less pronouncedat low and more pronounced at high overaging temperature. The turning point of these tenden-

4.1. INFLUENCE OF ALLOYING ELEMENTS ON TBF/Q&P SHEET STEEL 43
cies is shifted to a lower overaging temperature of 400 C. Inverse behaviour is reflected in uniformelongation and the amount of retained austenite. Within the overaging temperature range of 350to 400 C, uniform elongation and amount of retained austenite are distinctly greater for highermanganese contents. In contrast, above this temperature range, both of these values are lower forhigher manganese contents.
4.1.5 Chromium in the 980 grade
Chromium has been found suitable as a partial substitute for silicon in TBF/Q&P steels [99,167]. Cementite precipitation can successfully be delayed by the addition of chromium. Unlikealuminum, which has frequently been used to substitute silicon in TRIP steels, chromium doesnot increase Ac3 temperature which is a necessary requirement to fully austenitize the steel on theindustrial production line. However, chromium decelerates bainite transformation. To evaluate theoverall industrial benefits and the effectiveness of chromium for the investigated TBF/Q&P steels,a chromium content of 0.01, 0.2 and 0.4 mass% was added to the base composition. This sectionprovides insight into phase transformation behaviour, microstructure, and mechanical properties ofthe 980 manganese variants.
Figure 4.13a shows the transformed fraction during continuous cooling. Chromium significantlydecelerates fcc-bcc transformation upon continuous cooling. A chromium content of 0.4mass% isscarcely sufficient to prevent ferrite formation and some (upper) bainite still forms with a coolingrate of 50K/s (Figure 4.13a). The isothermal time temperature transformation (TTT) plot of steelgrade 0.01Cr980, 0.2Cr980 and 0.4Cr980 is shown in Figure 4.13b. Chromium significantly deceler-ates isothermal transformation for all investigated overaging temperatures above Ms temperatureMs ≈ 378 C. The higher the overaging temperature, the stronger the deceleration of the phasetransformation.
200 300 400 500 600 7000
20
40
60
80
100 3 K/s 50 K/s 0.01Cr980 0.2Cr980 0.4Cr980
T [°C]
f trans
[%]
~Ms (10%)
Cr
0.1 1 10 100 1000
300
400
500
600
20 % 60 % 0.01Cr980 0.2Cr980 0.4Cr980
T oa [°
C]
toa
[s]
Cr
a) b)
Figure 4.13: a) Transformed phase fraction during continuous cooling at rates of 3 and 50 K/s, b)isothermal TTT curve for steel grades 0.01Cr980, 0.2Cr980 and 0.4Cr980.
LePera etched optical micrographs of Q&P and TBF steels 0.01Cr980, 0.2Cr980, and 0.4Cr980for fixed overaging temperatures of 350 C and 425 C are shown in Figure 4.14. Steel 0.01Cr980comprises significant amounts of polygonal ferrite, while grade 0.2Cr980 and 0.4Cr980 contain veryfew small polygonal ferrite grains. This is the case for both overaging temperatures. However, it ismuch more obvious for an overaging temperature of 350 C compared to 425 C, because polygonalferrite etches tempered martensite and lower bainite much more distinctly than upper bainite, wherethe transition between the microstructure components is unclear. While the bainitic/tempered

44 CHAPTER 4. RESULTS
martensitic matrix of steel 0.01Cr980 is rather homogeneous, higher chromium content results ina larger variety of bainite types, lath structures, and carbide distributions (Figure 4.14a-c). Theamount of retained austenite grains increases with increasing chromium content at 350 C. Themorphology of the (upper) bainite for the steels that were held at an overaging temperature of425 C is very similar for the different chromium variants. There are less precipitates present athigher chromium contents in particular at 425 C. The size of the retained austenite/martensiteislands is also larger for higher chromium contents (Figure 4.14d-f).
a) 0.01Cr980, Toa = 350 C b) 0.2Cr980, Toa = 350 C c) 0.4Cr980, Toa = 350 C
d) 0.01Cr980, Toa = 425 C e) 0.2Cr980, Toa = 425 C f) 0.4Cr980, Toa = 425 C
Figure 4.14: LePera etched optical micrographs of Q&P and TBF heat-treated 980 grade chromiumvariants 0.01Cr980, 0.2Cr980, and 0.4Cr980 for fixed overaging temperatures of 350 C and 425 Ccomprising polygonal ferrite (F), bainite (B), lower bainite (LB), tempered martensite (TM), re-tained austenite (A) and retained austenite/martensite islands (MA) (toa = 600 s, T ≈ 50K/s).
Yield strength, tensile strength, uniform elongation, and the amount of retained austenite asa function of overaging time are shown in Figure 4.15a. All investigated properties increase withincreasing chromium content. However, the increase is much more pronounced from steel 0.01Cr980to 0.2Cr980 than from 0.2Cr980 to 0.4Cr980. Uniform elongation behaves slightly differently, as itshows similar values of all grades at low overaging temperatures and a equal increase with chromiumcontent at high overaging temperatures.
As seen in Figure 4.15b, yield strength decreases at low and increases at high overaging temper-atures with increasing chromium content. Tensile strength, in contrast, consistently shows highervalues for higher chromium contents in the complete range of investigated overaging temperaturesfrom 350 C to 475 C. However, this trend is more pronounced at high overaging temperatures.The amount of retained austenite is significantly higher in steels 0.2Cr980 and 0.4Cr980 than ingrade 0.01Cr980, and slightly higher in steel 0.4Cr980 than in grade 0.2Cr980 at all overaging tem-peratures, except for 350 C. The difference in uniform elongation between the different chromium

4.1. INFLUENCE OF ALLOYING ELEMENTS ON TBF/Q&P SHEET STEEL 45
grades is almost negligible. The steel with the highest chromium content shows a higher uniformelongation for 425 C and a lower uniform elongation for the highest overaging temperature of 475 Cas compared to the grades with the lower chromium content.
600
800
1000
Toa 350 °C 425 °C0.01Cr980 0.2Cr980 0.4Cr980
R p0.2 [M
Pa]
Cr
Cr
Cr
Cr
800
1200
1600
R m[M
Pa]
4
8
12
A u [%]
0 200 400 6000
4
8
12
16
toa [s]
f [v
ol. %
]
600
800
1000
0.01Cr980 0.2Cr980 0.4Cr980
R p0.2 [M
Pa]
800
1200
1600
R m[M
Pa]
Cr
Cr
4
8
12
A u [%]
350 375 400 425 450 4750
4
8
12
16
Toa [°C]
f [v
ol. %
]
Cr
Cr
a) b)
Figure 4.15: Yield strength, tensile strength, uniform elongation, and amount of retained austen-ite of grades 0.01Cr980, 0.2Cr980 and 0.4Cr980 a) as a function of overaging time for overagingtemperatures Toa = 350 C and Toa = 425 C, b) as a function of overaging temperature (toa = 600 s).

46 CHAPTER 4. RESULTS
4.1.6 Chromium in the 1180 grade
The transformation behaviour during continuous cooling and overaging has been studied by selecteddilatometer experiments. As seen in Figure 4.16a, the transformed fraction during cooling with acooling rate of 3K/s decreases with increasing chromium content. For the high cooling rate of50K/s, ferrite and bainite forms during cooling of the 0.01Cr1180 grade, whereas this formation issuppressed by a chromium content of 0.2mass% Cr and above. Ms temperature is approximately360 C and slightly lower for higher chromium content, as indicated by the transformed fractioncurves of 0.2Cr1180 and 0.4Cr1180 with a cooling rate of 50K/s.
Figure 4.16b shows, that chromium decelerates the isothermal bainite formation at all over-aging temperatures from 350 to 550 C. The higher the overaging temperature, the stronger thedeceleration of phase transformations by chromium additions. Between 400 and 550 C overagingtemperature, chromium slows down phase transformation kinetics particularly pronounced. In ad-dition, it is worth noting that isothermal phase transformation kinetics remains essentially the samefor the investigated 1180 chromium variants at an overaging temperature of 300 C. Interestingly,at 600 C, the isothermal phase transformation is decelerated at first and then accelerated as thechromium content increases.
200 300 400 500 600 7000
20
40
60
80
100 3 K/s 50 K/s 0.01Cr1180 0.2Cr1180 0.4Cr1180
T [°C]
f trans
[%]
~MS (10%)
Cr
Cr
0.1 1 10 100 1000
300
400
500
600
Cr
20 % 60 % 0.01Cr1180 0.2Cr1180 0.4Cr1180
T oa [°
C]
toa
[s]
a) b)
Figure 4.16: a) Transformed phase fraction during continuous cooling at rates of 3 and 50 K/s, b)isothermal TTT curve for steel grades 0.01Cr1180, 0.2Cr1180 and 0.4Cr1180.
The normalized length as a function of overaging time as shown in Figure 4.17a indicates botha deceleration of isothermal transformation and a lower amount of bainite at which the isothermaltransformation proceeds at a very slow rate. The same trend has been found for all overagingtemperatures.
Thermo-Calc c© TCFE6 [165] calculations can be used to identify, if the reason for the loweramount of bainite formed during overaging is of thermodynamic or kinetic nature. Figure 4.17bshows the phase diagram and the T0 temperature obtained from Thermo-Calc c© calculations. TheT0 temperature is the temperature at which the Gibbs free energy of the fcc structure equals thatof the bcc structure for a given carbon content [46]. According to the T0 concept, bainite trans-formation can only occur at a temperature below T0 temperature. Chromium increases the A1
temperature and very slightly decreases the T0 as well as A3 temperature. However, the influenceof chromium content on T0 temperature appears almost negligible in the investigated range. Thus,the presumable stagnation of the isothermal transformation at lower amounts of bainite for higherchromium contents is not a consequence of a shift in T0 temperature. In fact, the driving force

4.1. INFLUENCE OF ALLOYING ELEMENTS ON TBF/Q&P SHEET STEEL 47
for transformation should be higher for higher chromium contents, since A1 temperature increaseswith increasing chromium content. A possible explanation is that chromium strongly deceleratesthe diffusion in particular after a specific amount of bainite has formed. This is inversely propor-tional lower for higher chromium contents. This means that for infinitely long overaging times, allchromium variants would exhibit very similar amounts of bainite during overaging.
0.0 0.2 0.4 0.6 0.8500
600
700
800
900
+
Cr
T [°
C]
C [mass %]
0.01Cr1180 0.2Cr1180 0.4Cr1180
T0
+
a) b)
Figure 4.17: a) Normalized length during overaging at Toa = 425 C of grades 0.01Cr1180, 0.2Cr1180and 0.4Cr1180. b) Phase diagram and T0 temperature of grades 0.01Cr1180, 0.2Cr1180 and0.4Cr1180 in thermodynamic equilibrium calculated using Thermo-Calc c©.
LePera etched optical micrographs of the 1180 grade chromium variants are shown in Figure 4.18for overaging temperatures 350 C and 425 C. The bainite morphology changes from lath-like tomore globular with increasing chromium content for an overaging temperature of 350 C, whereasthere is no notable difference between the bainite morphologies of the different chromium variants at425 C overaging temperature. The steel with the lowest chromium content contains small amountsof polygonal ferrite, which is particularly visible for 350 C overaging temperature due to a greatercontrast to the surrounding lower bainitic/tempered martensitic matrix. The number of retainedaustenite grains of approximately 1µm in equivalent diameter increases with increasing chromiumcontent for an overaging temperature of 350 C. Steel 0.4Cr1180 exhibits some relatively largeretained austenite/martensite inclusions with brownish tempered martensite in the center for theoveraging temperature of 350 C. The size of the retained austenite/martensite inclusions at 425 Coveraging temperature strongly increases with increasing chromium content.
SEM images can provide more detailed insight than optical micrographs into the morphologyof bainite and retained austenite as well as the presence and shape of fine inclusions in particularcarbides (Figure 4.19). For an overaging temperature of 350 C, the bainite of the grade with thelowest chromium content, 0.01Cr1180, is finer, and the laths are both thinner and longer comparedto the grade 0.4Cr1180 (Figure 4.19a). Distinctly higher amounts of retained austenite are presentin the grade with the high chromium content at this overaging temperature. The retained austeniteof steel 0.4Cr1180 is more block-like, while most of the retained austenite of the grade with lowchromium content exists in the form of small films between the bainite laths (Figure 4.19a-c).Grade 0.01Cr1180 also contains more carbides, most of which are cementite as detected by EDXmeasurements.
For the higher overaging temperature of 425 C, the bainite morphology is more lath-like and the

48 CHAPTER 4. RESULTS
a) 0.01Cr1180, Toa = 350 C b) 0.2Cr1180, Toa = 350 C c) 0.4Cr1180, Toa = 350 C
d) 0.01Cr1180, Toa = 425 C e) 0.2Cr1180, Toa = 425 C f) 0.4Cr1180, Toa = 425 C
Figure 4.18: LePera etched optical micrographs of Q&P and TBF heat-treated 1180 grade chromiumvariants 0.01Cr1180, 0.2Cr1180, and 0.4Cr1180 for fixed overaging temperatures of 350 C and425 C comprising polygonal ferrite (F), bainite (B), lower bainite (LB), tempered martensite (TM),retained austenite (A) and retained austenite/martensite islands (MA)(toa = 600 s, T ≈ 50K/s).
laths are separated by thin retained austenite films for steels 0.01Cr1180 and 0.2Cr1180 as opposedto grade 0.4Cr1180 (Figure 4.19b). The bainite morphology of steel 0.4Cr1180, in contrast, ismuch coarser, and contains less cementite compared to the steels with the lower chromium content.The size of the retained austenite/martensite islands strongly increases with increasing chromiumcontent for 425 C overaging temperature.
Yield strength, tensile strength, uniform elongation, and amount of retained austenite as a func-tion of overaging time are shown in Figure 4.20a. In principle, the trends of mechanical propertiesand amount of retained austenite with increasing overaging temperature are in good agreement withthose of the 1180 grade manganese or silicon variants. However, the decreasing and then increasingtendency of the yield strength is not as pronounced as seen for the other 1180 variants. Furthermore,uniform elongation continues to increase for the highest chromium content and the low overagingtemperature of 350 C, while it decreases for the lowest chromium content at the higher overagingtemperature. The former tendency can be observed for the 1180 manganese variant as well, whereasthe later trend is typical only for this specific composition. The behaviour of the amount of retainedaustenite with overaging time is in good agreement with the 1180 manganese variants.
Similar to the 1180 manganese variants, the yield strength shifts from an increase to a decreasewith increasing chromium content at overaging times of more than 180 s for an overaging tempera-ture of 350 C. At the higher overaging temperature of 425 C, yield strength consistently increaseswith increasing chromium content. Higher chromium content results in higher tensile strength val-ues within the whole range of overaging times, particularly at high overaging temperature. The

4.1. INFLUENCE OF ALLOYING ELEMENTS ON TBF/Q&P SHEET STEEL 49
a) 0.01Cr1180, Toa = 350 C b) 0.2Cr1180, Toa = 350 C c) 0.4Cr1180, Toa = 350 C
d) 0.01Cr1180, Toa = 425 C e) 0.2Cr1180, Toa = 425 C f) 0.4Cr1180, Toa = 425 C
Figure 4.19: SEM images of Q&P and TBF heat-treated 1180 grade chromium variants 0.01Cr1180,0.2Cr1180, and 0.4Cr1180 for fixed overaging temperatures of 350 C and 425 C comprising polyg-onal ferrite (F), bainite (B), lower bainite (LB), tempered martensite (TM), retained austenite (A)and retained austenite/martensite islands (MA) (toa = 600 s, T ≈ 50K/s).
uniform elongation increases at low and decreases at high overaging temperatures with increasingchromium content. This behaviour is unique among the investigated alloying concepts, since an in-crease in an alloying element such as silicon or manganese usually results in an increase in uniformelongation, except for the 980 manganese variants at the low overaging temperature and the 1180silicon variants, where the changes as a consequence of alloying additions are negligible. The amountof retained austenite also increases at low and decreases at high overaging temperatures with in-creasing chromium content. The tendency towards this behaviour is present in the 1180 manganesevariants.
The results of mechanical properties and amount of retained austenite as a function of overagingtemperature are shown in Figure 4.20b. The yield strength as a function of overaging time shiftsfrom decreasing to increasing yield strength with increasing chromium content. Such a tendencywas also found in the 1180 manganese variants. Higher chromium content results in higher tensilestrength with a strongly increasing tendency for higher overaging temperatures. Uniform elongationslightly increases for higher chromium contents at 350 C, and strongly decreases for overagingtemperatures above 400 C. Similar behaviour was observed in the 1180 grade manganese variants,with a stronger increase in uniform elongation with increasing manganese content at low overagingtemperatures. The amount of retained austenite is significantly higher for higher chromium contentsand overaging temperatures up to 400 C, and drops to lower values which are similar among thedifferent chromium variants for higher overaging temperatures.

50 CHAPTER 4. RESULTS
600
800
1000
Toa 350 °C 425 °C0.01Cr1180 0.2Cr1180 0.4Cr1180
R p0.2 [M
Pa]
Cr
Cr
Cr
Cr
800
1200
1600
R m[M
Pa]
4
8
12
A u [%]
0 200 400 6000
4
8
12
16
toa [s]
f [v
ol. %
]
600
800
1000
0.01Cr1180 0.2Cr1180 0.4Cr1180
R p0.2 [M
Pa]
Cr
Cr
Cr
Cr
800
1200
1600
R m[M
Pa]
4
8
12
A u [%]
350 375 400 425 450 4750
4
8
12
16
Toa [°C]
f [v
ol. %
]
a) b)
Figure 4.20: Yield strength, tensile strength, uniform elongation, and amount of retained austeniteof grades 0.01Cr1180, 0.2Cr1180 and 0.4Cr1180 a) as a function of overaging time for overagingtemperatures Toa = 350 C and Toa = 425 C, b) as a function of overaging temperature (toa = 600 s).
4.1.7 Niobium in the 980 grade
Niobium plays a crucial role for grain refinement and precipitation strengthening in many steelgrades [87, 100, 106, 107, 168–170]. The influence of niobium on conventional TRIP steels is thor-oughly documented in literature [171, 172]. The present work fills the gap of combining third-
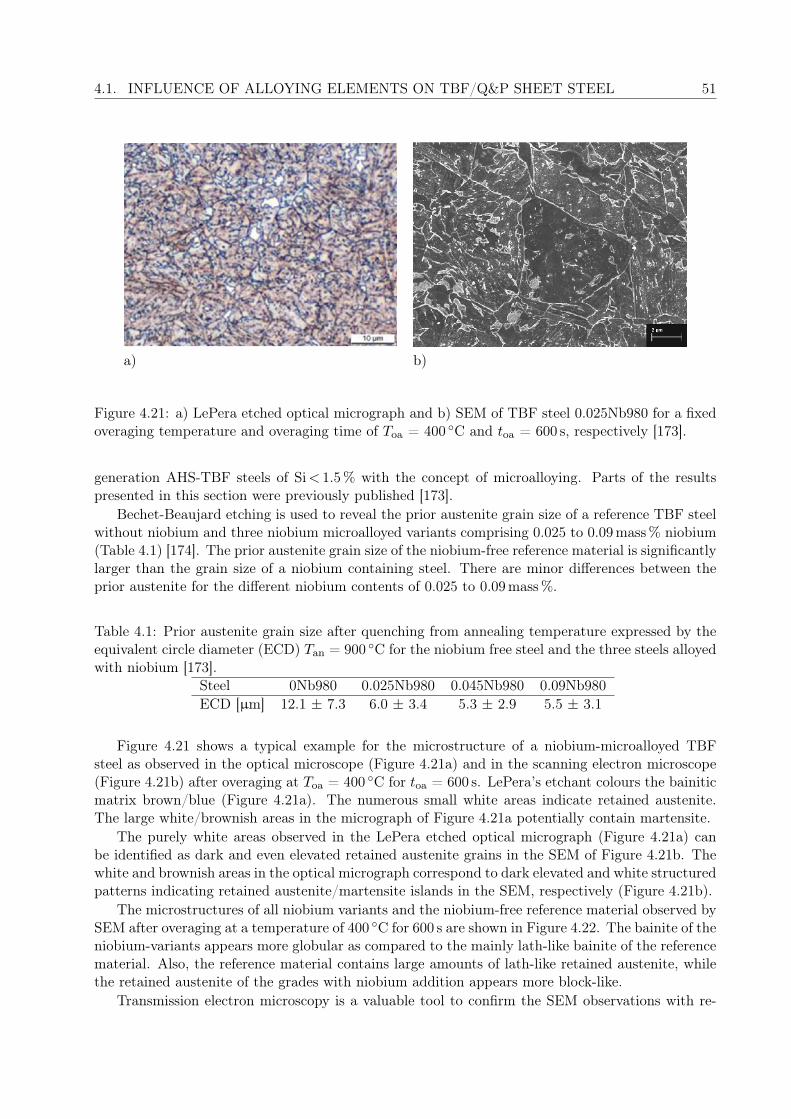
4.1. INFLUENCE OF ALLOYING ELEMENTS ON TBF/Q&P SHEET STEEL 51
a) b)
Figure 4.21: a) LePera etched optical micrograph and b) SEM of TBF steel 0.025Nb980 for a fixedoveraging temperature and overaging time of Toa = 400 C and toa = 600 s, respectively [173].
generation AHS-TBF steels of Si< 1.5% with the concept of microalloying. Parts of the resultspresented in this section were previously published [173].
Bechet-Beaujard etching is used to reveal the prior austenite grain size of a reference TBF steelwithout niobium and three niobium microalloyed variants comprising 0.025 to 0.09mass% niobium(Table 4.1) [174]. The prior austenite grain size of the niobium-free reference material is significantlylarger than the grain size of a niobium containing steel. There are minor differences between theprior austenite for the different niobium contents of 0.025 to 0.09mass%.
Table 4.1: Prior austenite grain size after quenching from annealing temperature expressed by theequivalent circle diameter (ECD) Tan = 900 C for the niobium free steel and the three steels alloyedwith niobium [173].
Steel 0Nb980 0.025Nb980 0.045Nb980 0.09Nb980ECD [µm] 12.1 ± 7.3 6.0 ± 3.4 5.3 ± 2.9 5.5 ± 3.1
Figure 4.21 shows a typical example for the microstructure of a niobium-microalloyed TBFsteel as observed in the optical microscope (Figure 4.21a) and in the scanning electron microscope(Figure 4.21b) after overaging at Toa = 400 C for toa = 600 s. LePera’s etchant colours the bainiticmatrix brown/blue (Figure 4.21a). The numerous small white areas indicate retained austenite.The large white/brownish areas in the micrograph of Figure 4.21a potentially contain martensite.
The purely white areas observed in the LePera etched optical micrograph (Figure 4.21a) canbe identified as dark and even elevated retained austenite grains in the SEM of Figure 4.21b. Thewhite and brownish areas in the optical micrograph correspond to dark elevated and white structuredpatterns indicating retained austenite/martensite islands in the SEM, respectively (Figure 4.21b).
The microstructures of all niobium variants and the niobium-free reference material observed bySEM after overaging at a temperature of 400 C for 600 s are shown in Figure 4.22. The bainite of theniobium-variants appears more globular as compared to the mainly lath-like bainite of the referencematerial. Also, the reference material contains large amounts of lath-like retained austenite, whilethe retained austenite of the grades with niobium addition appears more block-like.
Transmission electron microscopy is a valuable tool to confirm the SEM observations with re-

52 CHAPTER 4. RESULTS
a)0Nb980 b) 0.025Nb980
c)0.045Nb980 d) 0.09Nb980
Figure 4.22: SEM images of a) 0Nb980 b) 0.025Nb980 c) 0.045Nb980 d) 0.09Nb980 heat-treatedTBF steels for a fixed overaging temperature of Toa = 400 C (toa = 600 s, T ≈ 50K/s) [173].
spect to the change in bainite and retained austenite morphology as well as to gain quantitativeinformation on carbide precipitation. The TEM analysis performed on all investigated steel grades(Figure 4.23) confirm the SEM results in terms of the above-mentioned morphology changes. More-over, considerably less cementite is found in the bainite of the niobium microalloyed TBF steelscompared to the reference material. The black round dots appearing in the grade 0.045Nb980 (Fig-ure 4.23c) and even larger in the grade 0.09Nb980 (Figure 4.23d) were identified as niobium carbidesusing EDX.
The composition of the carbides was identified by selected area diffraction (SAD) in the transmis-sion electron microscope. Figure 4.24 gives an example for the identification of a large precipitate.The Laue-Bragg indices Figure 4.24b were deduced from selected area diffraction patterns (SADP)(Figure 4.24a).
Two populations of NbC particles are present in the niobium-containing steels. Quantitativeanalysis (Table 4.2) reveals that all niobium variants contain both NbC particle populations. While

4.1. INFLUENCE OF ALLOYING ELEMENTS ON TBF/Q&P SHEET STEEL 53
a) b) c) d)
Figure 4.23: TEM images of a) 0Nb980 b) 0.025Nb980 c) 0.045Nb980 d) 0.09Nb980 heat-treatedTBF steels for a fixed overaging temperature of Toa = 400 C (toa = 600 s, T ≈ 50K/s) [173].
Figure 4.24: a) Selected Area Diffraction Pattern (SADP) and b) Laue-/Bragg-indices of a NbCparticle shown in Figure 4.23d [173].
the density of coarse NbC particles remarkably increases with the niobium content, no significanttrend was found regarding the density of fine NbC particles.
Table 4.2: Two NbC particle populations, fine and coarse, characterized by the equivalent cir-cle diameter (ECD) and density of these precipitates in the steels 0.025Nb980, 0.045Nb980, and0.09Nb980 [173].
fine NbC particlesSteel 0.025Nb980 0.045Nb980 0.09Nb980ECD [nm] 5.7 ± 1.9 6.4 ± 2.8 6.7 ± 3.0Particle density [1/m2] 76 ± 13 65 ± 21 82 ± 28
coarse NbC particlesSteel 0.025Nb980 0.045Nb980 0.09Nb980ECD [nm] 82 ± 18 73 ± 52 89 ± 51Particle density [1/m2] 0.10 ± 0.06 0.21 ± 0.10 0.41 ± 0.18
The amount of undissolved niobium was measured before and after annealing in order to investi-

54 CHAPTER 4. RESULTS
gate the potential to dissolve the NbC particles during annealing. The greater the niobium contentthe more niobium precipitates were observed (Figure 4.25). Since the results for the as-cold-rolledand annealed samples mutually fall into their scatter bands, a significant dissolution or further pre-cipitation of NbC during the austenitization step can be excluded. Due to the filtering techniqueemployed in this analysis, fine particles are hardly detected. The amounts shown are thus minimumamounts of niobium carbides.
Figure 4.25: Amount of undissolved niobium as a function of the overall niobium content for steelgrades 0.025Nb980, 0.045Nb980, and 0.09Nb980 measured by ICP-MS [173].
The transformed austenite fraction of continuously cooled samples (T = 50K/s) is shown inFigure 4.26a as a function of temperature. Down to a temperature of 400 C the reference materialdoes not begin to transform, whereas the austenite of the niobium alloyed steels transforms startingat 640 C until the overaging temperature is reached where roughly 20% ferrite and upper bainiteare formed. The same transformation behaviour is observed for all niobium variants.
Figure 4.26b illustrates the effect of niobium on the isothermal bainite transformation (IBT) at400 C. All steel grades transform approximately with the same velocity as indicated in the insert,and IBT is completed after 120 s. The amount of isothermal bainite as shown in Figure 4.26b is lessfor niobium microalloyed steels. The fractions of both the isothermal bainite and the transformationproduct of cooling to overaging (Figure 4.26a) add up to approximately the same amount.
The amount of retained austenite as a function of overaging time for the investigated niobiummicroalloyed TBF steels and the reference material are shown in Figure 4.27a. It initially increasesin all steel grades, followed by a saturation after approximately 200 s. The most significant increaseof retained austenite as compared to the reference material was observed for the 0.025Nb980 steel.A further increase of the niobium content does not result in a further increase of the amount ofretained austenite.
The stability of retained austenite against strain induced martensitic transformation was studiedby measuring the amount of retained austenite as a function of tensile strain by means of interruptedtensile tests (Figure 4.27b). The amount of retained austenite decreases with increasing plasticdeformation. A significant amount of retained austenite of up to 4 vol.% remains untransformeduntil fracture strain is reached. All steel grades show almost the same stability behaviour.
The carbon content of retained austenite for the series of TBF heat-treated samples was de-termined by XRD measurements based on lattice constants according to Dyson and Holmes [175].All steels, the reference material as well as the niobium microalloyed variants, contain the sameamount of carbon in the retained austenite of 0.98mass% after an isothermal heat treatment at
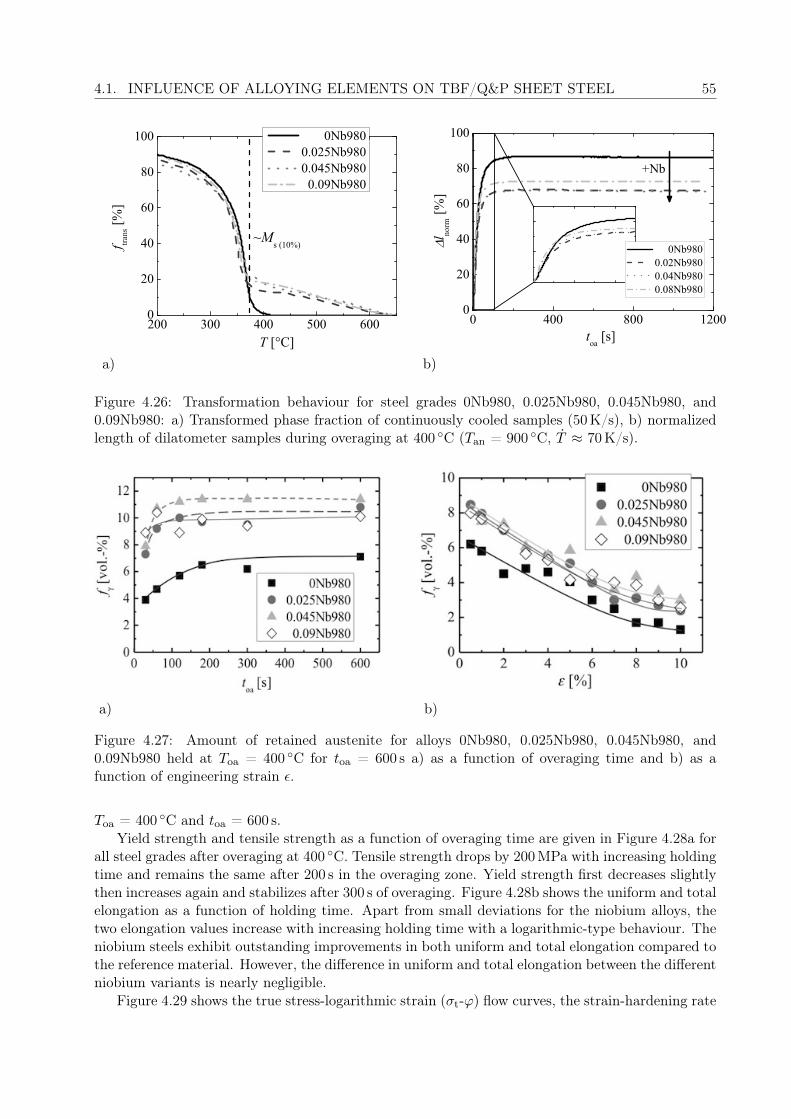
4.1. INFLUENCE OF ALLOYING ELEMENTS ON TBF/Q&P SHEET STEEL 55
200 300 400 500 6000
20
40
60
80
100
f tra
ns [%
]
T [°C]
~Ms (10%)
0Nb980 0.025Nb980 0.045Nb980 0.09Nb980
+Nb
0 400 800 12000
20
40
60
80
100
l norm
[%]
toa
[s]
0Nb980 0.02Nb980 0.04Nb980 0.08Nb980
a) b)
Figure 4.26: Transformation behaviour for steel grades 0Nb980, 0.025Nb980, 0.045Nb980, and0.09Nb980: a) Transformed phase fraction of continuously cooled samples (50K/s), b) normalizedlength of dilatometer samples during overaging at 400 C (Tan = 900 C, T ≈ 70K/s).
a) b)
Figure 4.27: Amount of retained austenite for alloys 0Nb980, 0.025Nb980, 0.045Nb980, and0.09Nb980 held at Toa = 400 C for toa = 600 s a) as a function of overaging time and b) as afunction of engineering strain ε.
Toa = 400 C and toa = 600 s.Yield strength and tensile strength as a function of overaging time are given in Figure 4.28a for
all steel grades after overaging at 400 C. Tensile strength drops by 200MPa with increasing holdingtime and remains the same after 200 s in the overaging zone. Yield strength first decreases slightlythen increases again and stabilizes after 300 s of overaging. Figure 4.28b shows the uniform and totalelongation as a function of holding time. Apart from small deviations for the niobium alloys, thetwo elongation values increase with increasing holding time with a logarithmic-type behaviour. Theniobium steels exhibit outstanding improvements in both uniform and total elongation compared tothe reference material. However, the difference in uniform and total elongation between the differentniobium variants is nearly negligible.
Figure 4.29 shows the true stress-logarithmic strain (σt-ϕ) flow curves, the strain-hardening rate

56 CHAPTER 4. RESULTS
0 100 200 300 400 500 600600
800
1000
1200
1400
b)
Rp0.2 Rm
0Nb980 0.025Nb980 0.045Nb980 0.09Nb980
R p0.2, R
m [M
Pa]
toa
[s]a)
0
48
12
0Nb980 0.045Nb980 0.025Nb980 0.09Nb980
A 25 [%
]
0 100 200 300 400 500 6000
4
8
0Nb980 0.045Nb980 0.025Nb980 0.09Nb980
A u [%]
toa [s]
Figure 4.28: a) Yield strength Rp0.2 and tensile strength Rm, b) uniform elongation Au, and totalelongation A25 as a function of overaging time at Toa = 400 C for steel grades 0Nb980, 0.025Nb980,0.045Nb980, and 0.09Nb980.
θ, and the differential n-value n′ as a function of logarithmic strain of the alloys that were heldat 400 C for 600 s. The flow curve of the niobium-free reference material is steeper and its strain-hardening rate and differential n-value are distinctly higher than those of the niobium containingvariants, especially up to approximately 2% of logarithmic strain. This results in higher elongationvia elevated strain-hardening with increasing strain.
Mechanical properties and amount of retained austenite of the grade 0.025Nb980 as a functionof overaging temperature are shown in Figure 4.30. Both yield and tensile strength decrease andelongations increase with overaging temperature. The relation between mechanical properties andoveraging temperature can be divided into three stages, namely into rather flat plateaus at temper-atures below Ms temperature as well as above 450 C and a linear range in between the plateaus.The amount of retained austenite increases with overaging temperature, decreases remarkably withoveraging time at the highest overaging temperature of 475 C and reaches its highest values after120 s of overaging at 450 C.
Hole expansion strain as a function of overaging temperature is shown in Figure 4.31. The holeexpansion strain decreases with increasing holding temperature, and the addition of niobium barelyaffects the hole expansion strain.

4.1. INFLUENCE OF ALLOYING ELEMENTS ON TBF/Q&P SHEET STEEL 57
700
800
900
1000
1100
1200
t [MPa
]
0
2
4
6
0Nb980 0.025Nb980 0.045Nb980 0.09Nb980
[103 M
Pa]
0.00 0.02 0.04 0.06 0.08 0.10
0.08
0.12
0.16
n' [-
]
[-]
Figure 4.29: Flow curves (σt vs. ϕ), strain-hardening rate θ and differential n-value n′ as a functionof logarithmic strain ϕ for all steel grades annealed at Toa = 400 C for toa = 600 s.

58 CHAPTER 4. RESULTS
Figure 4.30: Tensile strength Rm, yield strength Rp0.2, yield ratio Rp0.2/Rm, total elongation A25,uniform elongation Au, and the amount of retained austenite fγ as a function of overaging temper-ature for the grade 0.025Nb980.
Figure 4.31: Hole expansion strain λ as a function of overaging temperature after toa = 600 s forthe reference material and all 980 niobium variants.
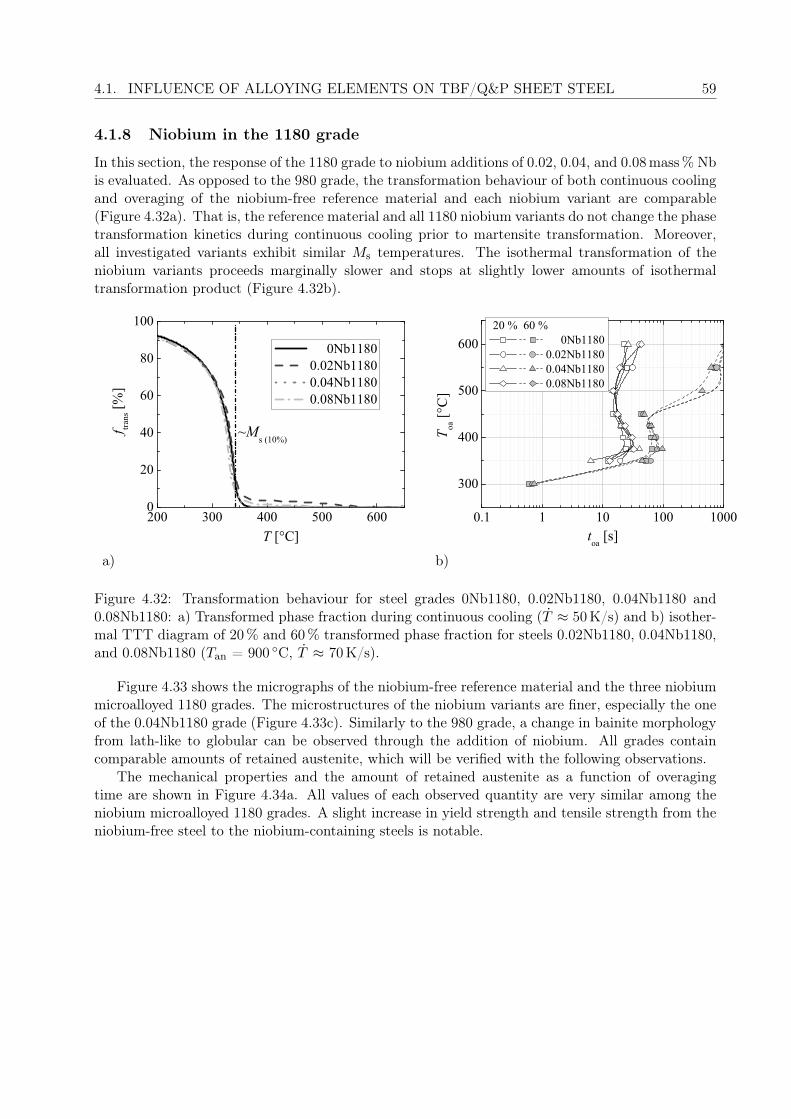
4.1. INFLUENCE OF ALLOYING ELEMENTS ON TBF/Q&P SHEET STEEL 59
4.1.8 Niobium in the 1180 grade
In this section, the response of the 1180 grade to niobium additions of 0.02, 0.04, and 0.08mass% Nbis evaluated. As opposed to the 980 grade, the transformation behaviour of both continuous coolingand overaging of the niobium-free reference material and each niobium variant are comparable(Figure 4.32a). That is, the reference material and all 1180 niobium variants do not change the phasetransformation kinetics during continuous cooling prior to martensite transformation. Moreover,all investigated variants exhibit similar Ms temperatures. The isothermal transformation of theniobium variants proceeds marginally slower and stops at slightly lower amounts of isothermaltransformation product (Figure 4.32b).
200 300 400 500 6000
20
40
60
80
100
f trans[%
]
T [°C]
0Nb1180 0.02Nb1180 0.04Nb1180 0.08Nb1180
~Ms (10%)
0.1 1 10 100 1000
300
400
500
600 20 % 60 %
0Nb1180 0.02Nb1180 0.04Nb1180 0.08Nb1180
T oa [°
C]
toa
[s]
a) b)
Figure 4.32: Transformation behaviour for steel grades 0Nb1180, 0.02Nb1180, 0.04Nb1180 and0.08Nb1180: a) Transformed phase fraction during continuous cooling (T ≈ 50K/s) and b) isother-mal TTT diagram of 20% and 60% transformed phase fraction for steels 0.02Nb1180, 0.04Nb1180,and 0.08Nb1180 (Tan = 900 C, T ≈ 70K/s).
Figure 4.33 shows the micrographs of the niobium-free reference material and the three niobiummicroalloyed 1180 grades. The microstructures of the niobium variants are finer, especially the oneof the 0.04Nb1180 grade (Figure 4.33c). Similarly to the 980 grade, a change in bainite morphologyfrom lath-like to globular can be observed through the addition of niobium. All grades containcomparable amounts of retained austenite, which will be verified with the following observations.
The mechanical properties and the amount of retained austenite as a function of overagingtime are shown in Figure 4.34a. All values of each observed quantity are very similar among theniobium microalloyed 1180 grades. A slight increase in yield strength and tensile strength from theniobium-free steel to the niobium-containing steels is notable.

60 CHAPTER 4. RESULTS
a) 0Nb1180 b) 0.02Nb1180
c) 0.04Nb1180 d) 0.08Nb1180
Figure 4.33: LePera etched optical micrographs of TBF heat-treated 1180 grade niobium variants a)0Nb1180 b) 0.02Nb1180 c) 0.08Nb1180 for a fixed overaging temperature and time of Toa = 400 Cand toa = 600 s, respectively, comprising lower polygonal ferrite (F), bainite (B), lower bainite (LB),tempered martensite (TM), retained austenite (A) and retained austenite/martensite islands (MA)(T ≈ 50K/s).

4.1. INFLUENCE OF ALLOYING ELEMENTS ON TBF/Q&P SHEET STEEL 61
600
800
1000
Toa 350 °C 425 °C 0Nb1180 0.02Nb1180 0.04Nb1180 0.08Nb1180
R p0.2 [M
Pa]
800
1200
1600
R m[M
Pa]
4
8
12
A u [%]
0 200 400 6000
4
8
12
16
toa [s]
f [v
ol. %
]
600
800
1000
0Nb1180 0.02Nb1180 0.04Nb1180 0.08Nb1180
R p0.2 [M
Pa]
800
1200
1600
R m[M
Pa]
4
8
12
A u [%]
350 375 400 425 450 4750
4
8
12
16
Toa [°C]
f [v
ol. %
]
a) b)
Figure 4.34: Yield strength, tensile strength, uniform elongation, and amount of retained austeniteof grades 0Nb1180, 0.02Nb1180, 0.04Nb1180 and 0.08Nb1180 a) as a function of overaging time foroveraging temperatures Toa = 350 C and Toa = 425 C, b) as a function of overaging temperature(toa = 600 s).

62 CHAPTER 4. RESULTS
4.2 Influence of annealing cycle on TBF and Q&P sheet steel
4.2.1 Quench temperature
This section demonstrates the influence of quench temperature on microstructure, amount of re-tained austenite, and mechanical properties on TRIP-assisted steels with bainitic and/or martensiticmicrostructure. The industrially produced steels of this work exhibit higher levels of purity in com-position compared to the laboratory-produced sheets. As a result of this and other differences inproduction, the mechanical properties, in particular hole expansion strains, of industrially producedsheets can differ from those of laboratory-produced material. In most cases, industrially producedsteels show slightly more advanced combinations of mechanical properties than those of laboratory-produced steels with similar composition and heat treatment. Figure 4.35 shows LePera etchedoptical micrographs of two-step Q&P heat-treated sheet steel IN980 and IN0.9Si1180 for selectedquench temperatures (Toa = 450 C, toa = 300 s and Toa = 400 C, toa ≈ 450 s, respectively).
a) Tq = 280 C, IN980 b) Tq = 320 C, IN980 c) Tq = 340 C, IN980
d) Tq = 280 C, IN0.9Si1180 e) Tq = 320 C, IN0.9Si1180 f) Tq = 340 C, IN0.9Si1180
Figure 4.35: LePera etched optical micrographs of two-step Q&P heat-treated sheet steel for quenchtemperatures Tq = 280 C, Tq = 320 C and Tq = 340 C comprising bainite (B) and retainedaustenite (A). Upper row: IN980, lower row: IN0.9Si1180. The cold-rolled sheets of both steels wereindustrially produced. Steel IN980 was annealed in the laboratory by electrical resistance (tq = 3 s,Toa = 450 C, toa = 300 s) and grade IN0.9Si1180 was produced in the industrial annealing line(Toa = 400 C, toa ≈ 450 s).
The size of the retained austenite grains increases with increasing quench temperature in bothgrades. However, the shape of the retained austenite islands is independent of quench tempera-

4.2. INFLUENCE OF ANNEALING CYCLE ON TBF/Q&P SHEET STEEL 63
ture. The lower contrast of the white retained austenite islands to the surrounding matrix indicatethat less retained austenite is present in the grade IN0.9Si1180. However, magnetic measurementsconfirmed that both grades contain the same amount of retained austenite for a given quenchtemperature (Figure 4.36b). There is no visible difference in the amount and size of the carbidesbetween different quench temperatures or between the two different grades. The former austenitegrain boundary is clearly visible only in the grade IN980.
Yield strength, tensile strength, uniform elongation, and the amount of retained austenite as afunction of quench temperature of steel IN980 and IN0.9Si1180 are shown in Figure 4.36. Tensilestrength and even more so yield strength decrease with increasing quench temperature to the sameextent in both grades, while the absolute tensile strength of the grade IN0.9Si1180 is 100MPa andits yield strength is 200MPa higher than that of the grade IN980 (Figure 4.36a). Uniform and totalelongation are insignificantly lower for the grade IN0.9Si1180 than for grade IN980 and increase withincreasing quench temperature, as the amount of retained austenite also increases in both grades(Figure 4.36b). Hole expansion strain of the grade IN0.9Si1180 remarkably decreases with increasingquench temperature (Figure 4.36a). It drops below 20% above Tq = 340 C, while exceeding 50%for below Tq = 280 C. Steel IN980 shows the same tendency in hole expansion strain with quenchtemperature. However, grade IN980 is less quench-temperature-sensitive and decreases much moreslowly with increasing quench temperature resulting in significantly higher hole expansion strain of37% vs. 23% for a quench temperature of Tq = 340 C.
800
1000
1200
1400
IN980 IN0.9Si1180
R p0.2, R
m [M
Pa]
Rp02
Rm
IN980 IN0.9Si1180
260 280 300 320 340 360 3800
20
40
[%]
Tq [°C]
0
4
8
12
16
IN980 IN0.9Si1180
Au A80
IN980 IN0.9Si1180
A u, A80
[%]
260 280 300 320 340 360 3800
5
10
15
f [v
ol. %
]
Tq [°C]a) b)
Figure 4.36: a) Hole expansion strain, yield strength, tensile strength, b) amount of retainedaustenite, uniform elongation, and total elongation A80 as a function of quench temperature oftwo-step Q&P heat-treated sheet steels IN980 (tq = 3 s, Toa = 450 C, toa = 300 s) and IN0.9Si1180(Toa = 400 C, toa ≈ 450 s) for quench temperatures Tq = 280 C and 340 C.

64 CHAPTER 4. RESULTS
Figure 4.37 shows the engineering stress-strain curves of steel grades IN980 and IN0.9Si1180.Steel grade IN980 was originally designed for a minimum tensile strength of 980MPa, in combinationwith TBF heat treatments and overaging temperatures above Ms temperature. Exposed to quenchtemperatures as low as Tq = 280 C and Tq = 340 C below Ms temperature (Ms ≈ 375 C) beforeoveraging, it shows quite high tensile strength of 1085 and 1125 MPa, respectively. The strengthlevels and the stress-strain curves of grade IN980 are much more alike for the different quenchtemperatures compared to those of grade IN0.9Si1180. It is important to note that the lower quenchtemperature of Tq = 280 C postpones yielding in both steels. The low strain-hardening rate atstrains directly above the yield strength of IN980 at a quench temperature of Tq = 280 C couldindicate an onset of the development of a yield point elongation. The stress-strain curves can bedivided into a range of strain-hardening before necking and post-uniform deformation. Interestingly,the grade IN980 shows similar strain-hardening behaviour, except for the delayed yielding, but verydistinct post-uniform deformation. While the strain-hardening behaviour of steel IN980 is verysimilar for both quench temperatures, steel IN0.9Si1180 shows much stronger strain-hardening at aquench temperature of Tq = 340 C compared to Tq = 280 C.
0 4 8 12 16600
800
1000
1200
1400
IN980, Tq = 280 °C IN980, Tq = 340 °C IN0.9Si1180, Tq = 280 °C IN0.9Si1180, Tq = 340 °C
[MPa
]
[%]
Figure 4.37: Engineering stress-strain curves of two-step Q&P heat-treated sheet steels IN980(tq = 3 s, Toa = 450 C, toa = 300 s) and IN0.9Si1180 (Toa = 400 C, toa ≈ 450 s) for quenchtemperatures Tq = 280 C and 340 C.
Figure 4.38 shows the differential n-value and the strain-hardening rate as a function of logarith-mic strain of the same steel grades and quench temperatures as in Figure 4.37. The strain-hardeningrate of both steels is very similar for a quench temperature of 340 C. It begins at 20,000 MPa, dropsstrongly at low strains, and decays towards higher strains. In contrast, the strain rates of both steelsare very different at a quench temperature of 280 C. It begins lower for steel IN0.9Si1180 and decaysto values comparable to those for the higher quench temperature. The strain rate of grade IN980,however, begins with distinctly high values and drops to much lower rates. Likewise, the differentialn-value of both steels is very similar for a quench temperature of 340 C, but slightly higher in thecase of steel IN980 for a given strain. This steel also exhibits a higher maximum differential n-value,which correlates with the elevated uniform elongation (Figure 4.36). The differential n-values atthe lower quench temperature of 280 C are generally lower and very distinct between the steels,which is in good agreement with the diverging strain-hardening rates for this heat treatment. While

4.2. INFLUENCE OF ANNEALING CYCLE ON TBF/Q&P SHEET STEEL 65
the differential n-value of steel IN980 for this quench temperature is shifted to higher strains upto a logarithmic strain of 0.03 compared to both steels at the higher quench temperature, steelIN0.9Si1180 begins at similar values, but exhibits a peak at 0.001, drops to half the peak value, anddoes not regain values as high as those of steel IN980.
0
5
10
15
20
25
30
35
n' [-
]
0.00 0.02 0.04 0.06 0.08 0.100.00
0.04
0.08
0.12
0.16
[100
0 M
Pa]
[-]
IN980, Tq = 280 °C IN980, Tq = 340 °C IN0.9Si1180, Tq = 280 °C IN0.9Si1180, Tq = 340 °C
Figure 4.38: Strain-hardening rate and differential n-value as a function of logarithmic strain oftwo-step Q&P heat-treated sheet steels IN980 (tq = 3 s, Toa = 450 C, toa = 300 s) and IN0.9Si1180(Toa = 400 C, toa ≈ 450 s) for quench temperatures Tq = 280 C and 340 C.
4.2.2 Time at quench temperature
This section demonstrates the influence of the time at quench temperature on microstructure,amount of retained austenite, and mechanical properties of two-step Q&P heat-treated sheet steel.Time at quench temperature refers to how long the steel was held at quench temperature afterquenching and before reheating to overaging temperature in a two-step Q&P annealing cycle. Fig-ure 4.39 shows the LePera etched micrographs of steel IN980 for various times at quench tempera-ture. The matrix appears to become much finer with increasing time at quench temperature. Thesize of the retained austenite/martensite islands decreases with increasing time at quench temper-ature. The brownish areas indicate carbon-depleted zones within the islands used to be austeniteprior to the final cooling. Therefore, they commonly correspond to fresh martensite. In some cases,brownish areas within a white inclusion like these can indicate (auto-)tempered martensite. Here,however, temperatures are too low and time is too short to allow relevant tempering during the finalcooling. After 8 s time at quench temperature, there are no more brownish areas of fresh martensiteleft (Figure 4.39d-f). The MA islands disappear completely for 40 s time at quench temperature,and only retained austenite grains are left (Figure 4.39f). For short times at quench temperaturesignificant amounts of retained austenite appear in a film-type elongated shape (Figure 4.39a-c),

66 CHAPTER 4. RESULTS
while prolonged quenching results in a larger number of small, round and finely dispersed retainedaustenite are present (Figure 4.39d-f). Finally, the carbide density slightly increases with increasingtime at quench temperature. With the higher amount of finely dispersed carbides more subgrainboundaries and laths seem to become visible.
a) tq = 0 s b) tq = 2 s c) tq = 4 s
d) tq = 8 s e) tq = 20 s f) tq = 40 s
Figure 4.39: LePera etched optical micrographs of the two-step Q&P heat-treated sheet steel IN980for various times at quench temperature comprising bainite (B), retained austenite (A), and retainedaustenite/martensite islands (MA) (T ≈ 80K/s, Tq = 350 C, Toa = 450 C, toa = 300 s).
Yield strength, tensile strength, uniform elongation, and the amount of retained austenite areshown in Figure 4.40. Interestingly, tensile strength, even more so yield strength, and in particularhole expansion strain increase strongly with increasing time at quench temperature. Uniform elon-gation and total elongation decrease with increasing time at quench temperature. The amounts ofretained austenite are approximately at the same level within the first 20 s of quenching, while theamount of retained austenite slightly drops at the longest time of 40 s at quench temperature.

4.2. INFLUENCE OF ANNEALING CYCLE ON TBF/Q&P SHEET STEEL 67
a) b)
Figure 4.40: a) Yield strength, tensile strength, hole expansion strain, b) uniform elongation, totalelongation A25 and amount of retained austenite as a function of time at quench temperature oftwo-step Q&P heat-treated sheet steel IN980 (T ≈ 80K/s, Tq = 350 C, Toa = 450 C, toa = 300 s).
4.2.3 Intermediate holding
To produce small amounts of polygonal ferrite, an intermediate holding step was conducted uponcooling to overaging in addition to the TBF heat treatment. The LePera etched optical micrographsof the same steel including intermediate holding are shown in Figure 4.41 for various intermediateholding temperatures and holding times. The steel that was held at 575 C for 2 s shows severalscattered blue islands depleted of carbides and free of ferrite laths, whereas no polygonal ferrite isvisible in the microstructure of Tf = 625 C and tf = 2 s (Figure 4.41a and 4.41d). Considerableamounts of polygonal ferrite can be found in Figure 4.41b, while the steel of higher intermedi-ate holding temperature (Figure 4.41e) again resembles the purely TBF heated treated referencematerial. However, it contains a small amount of carbide-depleted polygonal ferrite. After 40 s ofintermediate holding time, the steel begins to appear like a TRIP steel with polygonal ferritic matrixfor both holding temperatures. The matrix primarily consists of polygonal ferrite with embeddedretained austenite/martensite islands.
Figure 4.42 shows yield strength, tensile strength, uniform elongation, total elongation, and holeexpansion strain as a function of the intermediate holding time. Yield strength, tensile strength,and hole expansion strain decrease, while uniform and total elongation increase with increasingintermediate holding time particularly pronounced at short intermediate holding times decayingwith an exponential type of trend.
Yield strength and tensile strength decrease by 60MPa within the first 6 s of intermediate holdingfor both intermediate holding temperatures. After 80 s intermediate holding time yield strengthdrops to less than half its original value of 900MPa. Tensile strength decreases from 1100MPa toaround 900MPa within 80 s of intermediate holding. Uniform and total elongation both increaseby 2% within 6 s and by 10% after 80 s of intermediate holding in absolute numbers. The lateris equivalent to a doubling of uniform elongation. Short holding times significantly lower the holeexpansion strain. Intermediate holding for tf = 6 s results in a relative loss of 20% in hole expansionstrain. After 80 s of intermediate holding, hole expansion strain is reduced to half its original valueof 56%.

68 CHAPTER 4. RESULTS
a) Tf = 575 C, tf = 2 s b) Tf = 575 C, tf = 6 s c) Tf = 575 C, tf = 40 s
d) Tf = 625 C, tf = 2 s e) Tf = 625 C, tf = 6 s f) Tf = 625 C, tf = 40 s
Figure 4.41: LePera etched optical micrographs of steel IN980 with varying intermediate holdingtemperatures Tf and intermediate holding times tf to induce polygonal ferrite upon cooling tooveraging (T ≈ 80K/s, Toa = 400 C and toa = 600 s). The microstructures contain polygonalferrite (F), bainite (B), retained austenite (A), and retained austenite/martensite islands (MA).
Overall differences are minor when the two intermediate holding temperatures are compared.Steels that were intermediately held at the lower temperature of 575 C are more sensitive to longintermediate holding times in terms of tensile strength and elongations, but less sensitive with re-spect to hole expansion strain. With the higher intermediate holding temperature, yield strengthis slightly higher at short intermediate holding times and 30MPa lower after intermediate holdingfor 80 s. Tensile strength is 25MPa higher for 625 C intermediate holding temperature consistentlyfor all intermediate holding times. In absolute terms, elongations are 1% higher for the lower inter-mediate holding temperature. Very short holding at 575 C for 2 s does not change hole expansionstrain, whereas higher holding temperature of 625 C results in slightly reduced hole expansion. Holeexpansion strain is significantly higher for the lower intermediate holding temperature in particularafter 40 s of intermediate holding, where it is 38% instead of 30%. The sheet steel with nearlycompletely polygonal ferritic matrix of the same material, as seen in Figure 4.41c and 4.41f, stillreaches rather high hole expansion strains of 30 and 25% for an intermediate holding temperatureof 575 C and 625 C, respectively.
4.2.4 Intercritical annealing
In further trials, polygonal ferrite was induced via intercritical annealing. The microstructures ofthis investigation largely differ from those of the intermediate holding step. Figure 4.43 shows optical

4.2. INFLUENCE OF ANNEALING CYCLE ON TBF/Q&P SHEET STEEL 69
0 2 4 6 20 40 60 800
1020304050
[%]
tf [s]
05
10152025
u25
[%]
400
600
800
1000
1200R
m A
25 (t
f = 0 s)
Rp0.2
, Au, (t
f = 0 s)
Au
A25
Rm
Rp0.2
Tf = 575°C
Tf = 625°C
R p0.2, R
m [M
Pa]
Figure 4.42: Yield strength, tensile strength, uniform elongation, total elongation, and hole expan-sion strain of steel grade IN980 as a function of intermediate holding time tf at holding temperatureTf (T ≈ 80K/s, Toa = 400 C and toa = 600 s).
micrographs of steel IN980 for different annealing temperatures Tan (A3 ≈ 820 C). The amount ofpolygonal ferrite and the size of the retained austenite islands increase with decreasing annealingtemperature. The segregation bands that appear in all microstructures, though less pronounced inthe reference TBF heat-treated material in Figure 4.43a, arise primarily from the strong segregationtendency of manganese, as described in Section 4.1.3. The lower the Tan, the more pronounced thesegregation bands appear, and the larger the retained austenite/martensite islands. Finally, thecarbides become less disperse with decreasing annealing temperature, which means they are smallerand more homogeneously distributed.
Figure 4.44 shows yield strength, tensile strength, uniform elongation, the amount of retainedaustenite, and hole expansion strain of steel grade IN980 as a function of annealing temperature.Tensile strength increases almost linearly, whereas the other properties show a sigmoidal trend whereyield strength and hole expansion increase and retained austenite and elongations decrease withincreasing annealing temperature. Interestingly, there is no significant difference in hole expansionstrain between 810 C, 820 C and 900 C annealing temperature. However, a 30 C drop in annealingtemperature from 810 C to 780 C results in a relative loss of 50% in hole expansion strain.
Once the microstructure has turned into a classical TRIP type appearance with polygonal ma-

70 CHAPTER 4. RESULTS
a) Tan = 900 C b) Tan = 820 C c) Tan = 810 C
d) Tan = 800 C e) Tan = 790 C f) Tan = 780 C
Figure 4.43: LePera etched optical micrographs of a-e) intercritical annealed and f) fully austeni-tized steel IN980 for varying annealing temperatures Tan to induce polygonal ferrite upon coolingto overaging (T ≈ 80K/s, tan = 120 s, Toa = 400 C and toa = 600 s). Denomination of the mi-crostructure constituents: Polygonal ferrite (F), pearlite (P), bainite (B), and retained austenite(A). Pearlite is difficult to distinguish from bainite by optical microscopy, but was determined bySEM and dilatometry.
trix, the hole expansion strain is cut to half the initial value of its bainitic counterpart, irrespectivelyof whether the matrix was obtained via intermediate holding or intercritical annealing.
4.3 Failure mechanisms
4.3.1 Void nucleation and growth
The mechanical properties of the TBF/one-step Q&P heat-treated steels used for the following voidanalysis are given in Table 4.3.
Table 4.3: Mechanical properties of TBF/one-step Q&P heat-treated steel 0Nb980 used for voidanalysis.
Steel Toa [C] Rp02 [MPa] Rm [MPa] Au [%] A25 [%] fγ [%] n2−4 [-]0Nb980 350 1007 1240 5 10 3.1 0.0590Nb980 375 981 1177 5 10 3.9 0.0650Nb980 400 817 1067 7 11 7.3 0.120Nb980 425 646 1015 8 13 10.4 0.1825

4.3. FAILURE MECHANISMS 71
0
20
40
60
[%]
780 800 820 900400
600
800
1000
Rp02
Rm
R p0.2, R
m [M
Pa]
Tan
[°C]
8
10
12
14
16
f [v
ol. %
]780 800 820 900
0
10
20
Au
A25
A u, A25
[%]
Tan [°C]
a) b)
Figure 4.44: a) Hole expansion strain, yield strength and tensile strength, b) amount of retainedaustenite, uniform elongation and total elongation A25 of steel grade IN980 as a function of annealingtemperature Tan (T ≈ 80K/s, tan = 120 s, Toa = 400 C and toa = 600 s).
Figure 4.45a shows the void density of tensile tested steel 0Nb980 as a function of distance to thefracture surface for selected overaging temperatures. The void density exponentially decays withincreasing distance to the fracture surface. The higher the overaging temperature, the higher thevoid density. The void density of the same samples as a function of strain in thickness direction,the engineering strain in thickness direction, is shown in Figure 4.45b. When the two figures arecompared, the void density increases with increasing strain in thickness direction as it increases withdecreasing distance to the fracture surface. However, in relation to the strain in thickness directionthe increase is less pronounced. Strains in thickness direction at uniform elongation, which arethe lowest strain in thickness direction given, are higher for higher overaging temperatures. Themaximum strain in thickness direction is only slightly higher for higher overaging temperatures.
The average ECD of all voids as a function of strain in thickness direction of steel 0Nb980is shown in Figure 4.46 for selected overaging temperatures. The average ECD increases withincreasing strain in thickness direction. It is important to note that the average ECDs of thedifferent overaging temperatures exhibit quite similar values. Interestingly, even at the lowest strainin thickness direction of 0.12%, which correspond to uniform elongation, voids are still present.The void density in a strain range from 0.12% to 0.25% (Figure 4.45b), which is equivalent to adistance from the fracture surface of 1100 to 700µm (Figure 4.45a), is at a considerable amount of0.005µm−2. Particularly the ECD of these voids is remarkably high with up to 200 nm (Figure 4.46).
Figure 4.47 shows SEM images of steel 0Nb980 for a distance at 100µm to the fracture surfacein the middle of thickness and width of the sample for overaging temperatures of Toa = 350 C and425 C. The magnifications to the right of each overview image represent selected voids characteristicfor each steel. A few voids are present within the bainitic ferritic matrix without the presence of ahard inclusion (top right image of Figure 4.47a). The majority of voids are located at the interface

72 CHAPTER 4. RESULTS
1200 1000 800 600 400 200 00.00
0.04
0.08
0.12 T
oa = 350 °C
Toa
= 375 °C T
oa = 400 °C
Toa
= 425 °C
Voi
d de
nsity
[µm
-2]
Distance to fracture surface [µm]0.1 0.2 0.3 0.4 0.5 0.6
0.00
0.04
0.08
0.12 T
oa = 350 °C
Toa
= 375 °C T
oa = 400 °C
Toa
= 425 °C
Voi
d de
nsity
[µm
-2]
Thickness strain [-]a) b)
Figure 4.45: Void density of steel 0Nb980 for selected overaging temperatures: a) Void density asa function of distance to the fracture surface, b) void density as a function of strain in thicknessdirection.
Figure 4.46: Average ECD of all voids as a function of strain in thickness direction of steel 0Nb980for selected overaging temperatures.
of hard martensitic inclusions. Often these voids surround a sharp corner of the hard inclusion,which is typically associated with high localized strain (e.g. in the top right image of Figure 4.47b).
4.3.2 Fracture surface characterization
Figure 4.48 shows the fracture surfaces of two tensile tested TBF/one-step Q&P heat-treated steels,the mechanical properties of which are given in Table 4.4. Steels 2.5Mn980 and 2.6Mn1180 wereexposed to the same TBF annealing cycle involving an overaging temperature of Toa = 400 C(Figure 4.48a-d). Both steels show one population of dimple sizes represented by log-normal dis-tribution. While the steel 2.5Mn980 and 2.6Mn1180 are comparable with respect to dimple sizeand density, their shape largely varies (Figure 4.48a-d). The dimples of the fracture surface of steel2.5Mn980 are very round and deep compared to grade 2.6Mn1180, which shows rather flat anddistorted dimples that appear drawn out to a side.

4.3. FAILURE MECHANISMS 73
The dimples are even flatter for the same steel 2.6Mn1180, when it was held at a lower overagingtemperature of Toa = 350 C (Figure 4.48e,f). It is important to note that this overaging temperatureeven brings about two distinct dimple populations. The density of small dimples of 0.2 to 2µm inECD is very high, there are very few dimples of medium size, and there is a considerable amountof dimples with ECDs of approximately 10µm.
Table 4.4: Mechanical properties of TBF/one-step Q&P heat-treated steels 2.5Mn980 and2.6Mn1180 for tensile test fracture surfaces shown in Table 4.48 (toa = 600 s).
Steel Toa Rp02 Rm Au A25
2.5Mn980 400 C 778MPa 1063MPa 8% 14%2.6Mn1180 400 C 690MPa 1147MPa 11% 18%2.6Mn1180 350 C 945MPa 1317MPa 7% 13%

74 CHAPTER 4. RESULTS
b)
c)
a) Toa = 350 C d)
f)
g)
e) Toa = 425 C h)
Figure 4.47: SEM images of steel 0Nb980 for a distance at 100µm to the fracture surface in themiddle of thickness and width of the sample. The steel was TBF/Q&P heat-treated at overagingtemperatures of a-d) Toa = 350 C and e-h) Toa = 425 C, respectively (toa = 600 s, T ≈ 50K/s).

4.3. FAILURE MECHANISMS 75
a) 2.5Mn980, Toa = 400 C b) 2.5Mn980, Toa = 400 C
c) 2.6Mn1180, Toa = 400 C d) 2.6Mn1180, Toa = 400 C
e) 2.6Mn1180, Toa = 350 C f) 2.6Mn1180, Toa = 350 C
Figure 4.48: Fracture surfaces of tensile tested TBF/one-step Q&P heat-treated steels 2.5Mn980 foran overaging temperature of Toa = 400 C and 2.6Mn1180 for overaging temperatures of Toa = 400 Cand 350 C (toa = 600 s). The mechanical properties are shown in Table 4.4.

76 CHAPTER 4. RESULTS
4.4 Industrial trials on 1180 MPa Q&P sheet steel
The following results will demonstrate the effect of the changes in composition of the industri-ally produced 1180 MPa Q&P sheet steels on phase transformation behaviour, microstructure andmechanical properties.
Figure 4.49 shows the LePera etched micrographs of industrially produced two-step Q&P sheetsteels IN1.5Si1180 and IN0.9Si1180. The steels were annealed at 850 C, quenched to Tq = 340 Cor 360 C, and held at 380 C. Steel IN1.5Si1180 shows a significant amount of polygonal ferrite,whereas there is no polygonal ferrite present in steel IN0.9Si1180. The microstructure of steelIN0.9Si1180 is much finer than that of steel IN1.5Si1180. When the different quench temperaturesare compared, the microstructures of both IN1.5Si1180 and IN0.9Si1180 are finer and more lath-likefor a quench temperature of 340 C compared to 360 C. There is less bainite present in IN1.5Si1180at Tq = 360 C as opposed to 340 C. The amount of polygonal ferrite and bainite as well as the sizeof the retained austenite/martensite island are considerably greater in the steel IN1.5Si1180 thatwas quenched to 360 C compared to the steel of the same composition quenched to 340 C.
a) IN1.5Si1180, Tq = 340 C b) IN1.5Si1180, Tq = 360 C
c) IN0.9Si1180, Tq = 340 C d) IN0.9Si1180, Tq = 360 C
Figure 4.49: LePera etched micrographs of industrially produced two-step Q&P steels a),b)IN1.5Si1180 and c),d) IN0.9Si1180 for quench temperatures of a),c) Tq = 340 C and b),d)Tq = 360 C comprising polygonal ferrite (F), bainite (B), tempered martensite (TM), retainedaustenite (A), and retained austenite/martensite islands (MA) (Toa = 380 C, Tan = 850 C).
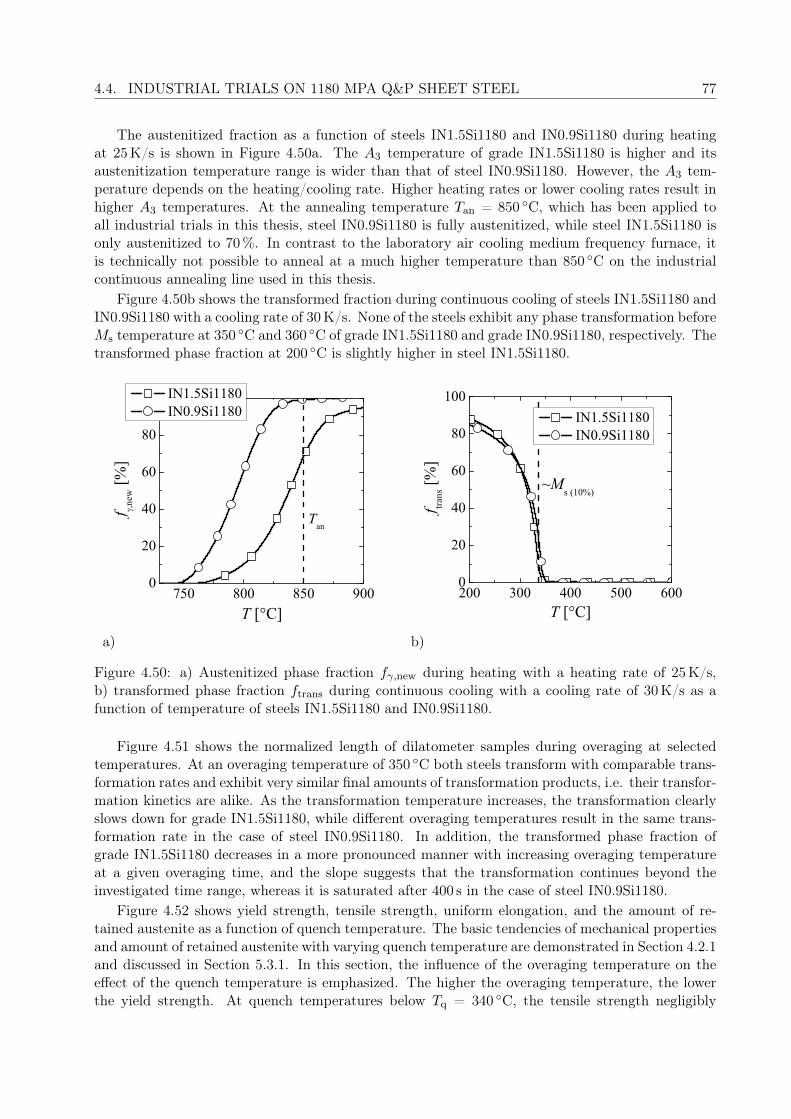
4.4. INDUSTRIAL TRIALS ON 1180 MPA Q&P SHEET STEEL 77
The austenitized fraction as a function of steels IN1.5Si1180 and IN0.9Si1180 during heatingat 25K/s is shown in Figure 4.50a. The A3 temperature of grade IN1.5Si1180 is higher and itsaustenitization temperature range is wider than that of steel IN0.9Si1180. However, the A3 tem-perature depends on the heating/cooling rate. Higher heating rates or lower cooling rates result inhigher A3 temperatures. At the annealing temperature Tan = 850 C, which has been applied toall industrial trials in this thesis, steel IN0.9Si1180 is fully austenitized, while steel IN1.5Si1180 isonly austenitized to 70%. In contrast to the laboratory air cooling medium frequency furnace, itis technically not possible to anneal at a much higher temperature than 850 C on the industrialcontinuous annealing line used in this thesis.
Figure 4.50b shows the transformed fraction during continuous cooling of steels IN1.5Si1180 andIN0.9Si1180 with a cooling rate of 30K/s. None of the steels exhibit any phase transformation beforeMs temperature at 350 C and 360 C of grade IN1.5Si1180 and grade IN0.9Si1180, respectively. Thetransformed phase fraction at 200 C is slightly higher in steel IN1.5Si1180.
750 800 850 9000
20
40
60
80
100 IN1.5Si1180 IN0.9Si1180
f new [%
]
T [°C]
Tan
200 300 400 500 6000
20
40
60
80
100
f trans
[%]
T [°C]
~Ms (10%)
IN1.5Si1180 IN0.9Si1180
a) b)
Figure 4.50: a) Austenitized phase fraction fγ,new during heating with a heating rate of 25K/s,b) transformed phase fraction ftrans during continuous cooling with a cooling rate of 30K/s as afunction of temperature of steels IN1.5Si1180 and IN0.9Si1180.
Figure 4.51 shows the normalized length of dilatometer samples during overaging at selectedtemperatures. At an overaging temperature of 350 C both steels transform with comparable trans-formation rates and exhibit very similar final amounts of transformation products, i.e. their transfor-mation kinetics are alike. As the transformation temperature increases, the transformation clearlyslows down for grade IN1.5Si1180, while different overaging temperatures result in the same trans-formation rate in the case of steel IN0.9Si1180. In addition, the transformed phase fraction ofgrade IN1.5Si1180 decreases in a more pronounced manner with increasing overaging temperatureat a given overaging time, and the slope suggests that the transformation continues beyond theinvestigated time range, whereas it is saturated after 400 s in the case of steel IN0.9Si1180.
Figure 4.52 shows yield strength, tensile strength, uniform elongation, and the amount of re-tained austenite as a function of quench temperature. The basic tendencies of mechanical propertiesand amount of retained austenite with varying quench temperature are demonstrated in Section 4.2.1and discussed in Section 5.3.1. In this section, the influence of the overaging temperature on theeffect of the quench temperature is emphasized. The higher the overaging temperature, the lowerthe yield strength. At quench temperatures below Tq = 340 C, the tensile strength negligibly

78 CHAPTER 4. RESULTS
0 200 400 600 800 1000 12000
20
40
60
80
100
l norm
[%]
toa [s]
Toa = 350°C Toa = 400°C Toa = 450°C
0 200 400 600 800 1000 12000
20
40
60
80
100
l norm
[%]
toa [s]
Toa = 350°C Toa = 400°C Toa = 450°C
a) IN1.5Si1180 b) IN0.9Si1180
Figure 4.51: Normalized length of dilatometer samples during overaging of steels a) IN1.5Si1180,b) IN0.9Si1180 (Toa = 350 C, 400 C, and 450 C).
decreases, whereas above Tq = 340 C it remains above 1200MPa for an overaging temperature ofToa = 400 C, whereas it decreases for lower quench temperatures. An increase in overaging temper-ature results in a more pronounced effect of quench temperature on hole expansion strain, uniformand total elongation. Hole expansion strain is therefore lower for higher overaging temperatures forquench temperatures of 300 C and below, whereas a rather low quench temperature of Tq = 280 Ccombined with the highest overaging temperature the highest hole expansion strain of more than50% are reached. While at high quench temperatures above 340 C uniform and total elongationare slightly lower for an overaging temperature of Toa = 400 C. The lower the quench temperaturebelow Tq = 340 C, the more pronounced the differences between elongations of different overagingtemperatures, where higher overaging temperatures result in higher total elongation and in par-ticular higher uniform elongation. Interestingly, the amount of retained austenite is unaffected bychanges in overaging temperatures in the range of 360 C to 400 C. Furthermore, attention shouldbe paid to the comparison between the performance of the preceding steel grade and the newlydeveloped 1180MPa grade. The tensile strength of steel IN1.5Si1180 remains rather constant, whilethe amount of retained austenite and elongations increase and decrease again with increasing inquench temperature. In the same manner, yield strength decreases and increases again with in-creasing quench temperature. Hole expansion strain of steel IN1.5Si1180 shows the same tendencieswith slightly higher values for the overaging temperature of Toa = 400 C and the given quenchtemperature range compared to grade IN0.9Si1180.
Tensile strength and hole expansion strain as a function of total elongation of steels IN1.5Si1180and IN0.9Si1180 are shown in Figure 4.53a. Uniform elongation and hole expansion strain as a func-tion of yield ratio are shown in Figure 4.53b. The graphs comprise various overaging temperaturesToa of 360 to 400 C in combination with a wide range of quench temperatures Tq of 280 to 420 C.While the overall performance of the two grades is comparable, some considerable differences ap-pear in particular at the high end of total elongation and tensile strength. The tensile strength levelremains slightly above 1180MPa (Figure 4.53a). Higher uniform and in particular total elongationof up to 15% are achieved by the predecessor IN1.5Si1180 compared to steel IN0.9Si1180 up to aquench temperature of 360 C. Interestingly, there is hardly any difference in uniform elongation of

4.4. INDUSTRIAL TRIALS ON 1180 MPA Q&P SHEET STEEL 79
800
1000
1200
1400
R p0.2, R
m [M
Pa]
Rp02
Rm
20
40
60
[%]
4
8
12
16 Au A80
A u, A80
[%]
280 300 320 340 360 3804
8
12
16
IN0.9Si1180: Toa = 400 °C Toa = 380 °C Toa = 360 °C
IN1.5Si1180: Toa = 380 °C
f [v
ol. %
]
Tq [°C]
Figure 4.52: Yield strength, tensile strength, hole expansion strain, uniform elongation, total elon-gation, and amount of retained austenite of industrially produced two-step Q&P heat-treated steelsIN1.5Si1180 and IN0.9Si1180 as a function of quench temperature, i.e. quench temperature Tq, forvarious overaging temperatures Toa of 360, 380, and 400 C (toa = 460 s).
the two steels at a quench temperature of 380 C. Steel IN0.9Si1180, in contrast, clearly succeedsin terms of hole expansion strain well above 50% in combination with total elongations of morethan 10%. Interestingly, for an overaging temperature of Toa = 380 C the decrease in hole expan-sion strain with increasing total elongation is not very pronounced. An increase in yield ratio is anecessary but insufficient condition for an increase in hole expansion strain (Figure 4.53b).

80 CHAPTER 4. RESULTS
1150
1200
1250
1300
1350
R m [M
Pa]
8 10 12 14 160
20
40
60
[%]
A80 [%]
6
8
10
12
A u [%]
0,6 0,7 0,8 0,9 1,00
20
40
60
[%]
Rp0.2/Rm [-]
a) b)
68
1012
0,6 0,7 0,8 0,9 1,00
204060
1.5Si1180 0.9Si1180 Tq [°C] Toa [°C] Tq [°C] Toa [°C]
400 380 380 - 340 400 360 - 280 400 340 370 420 - 380 400 380 - 280 380 380 - 340 380 340 - 280 400 380 - 280 360
360 - 300 380
Figure 4.53: a) Hole expansion strain and tensile strength as a function of total elongation A80, b)hole expansion strain and uniform elongation as a function of yield ratio of industrially producedtwo-step Q&P steels of compositions IN1.5Si1180 and IN0.9Si1180 for various annealing cycles(Tan = 850 C).

Chapter 5
Discussion
5.1 Phase transformations, microstructures, and mechanicalproperties: A general overview
5.1.1 Phase transformation kinetics
The investigated steels show similarities in phase transformations, microstructures, and mechanicalproperties, which are typical for TBF and Q&P steels. This section will present the generallyobserved tendencies, explain their origin, and demonstrate the scope of action to design specificproperties of TBF and Q&P steels.
Phase transformation diagrams are used to estimate the time and temperature at which a phaseforms. The transformed phase fraction specific time-temperature heat treatment can be determinedfrom the dilatation measured at a given time and temperature (Section 3.3.4). Continuous coolingtransformation (CCT) diagrams and time temperature transformation (TTT) diagrams show thecontinuous and isothermal phase transformation behaviour of TBF and Q&P steels prior to andduring overaging. Figure 5.1a shows a schematic diagram of the transformed phase fraction duringcontinuous cooling. The type of transformation product during continuous cooling depends on thecooling rate.
Above Ms temperature, higher cooling rates shift the transformation to lower temperatures(Figure 5.1a). If cooled at high cooling rates above the critical cooling rate, i.e. more than 50 to70K/s in the 980 grade and 30 to 50K/s in the 1180 grade, there is insufficient time for diffusionaltransformation and displacive transformation takes place below Ms temperature of approximately380 C. Due to the higher carbon and manganese content as well as the slightly elevated siliconcontent, phase transformations are generally more sluggish and critical cooling rate as well as Ms
temperature are lower for the 1180 compared to the 980 base composition. At low cooling rates, aslightly enhanced phase transformation rate above 600 C at the beginning of the transformationduring continuous cooling indicates ferrite and/or pearlite formation, as shown in Figure 5.1. Bainiteforms below the temperature range for ferrite transformation and above the Ms temperature.
The time-temperature curve for a given transformed phase fraction during overaging is shownin the TTT diagram of Figure 5.1b. During overaging, pearlite can form in addition to (polygonal)ferrite, which is indicated by an acceleration of phase transformation at relatively high overagingtemperatures for TBF steels (Figure 5.1b). In this work, pearlite was observed in some of the inves-tigated steels that were held at the highest temperatures within the applied overaging temperaturerange of up to 600 C. Bainite forms below temperatures at which polygonal ferrite and pearliteform and above Ms temperature. Upper bainite and globular or carbide-free bainite tend to format rather high temperatures in this range. Lower bainite is more likely to form at lower overaging
81

82 CHAPTER 5. DISCUSSION
temperatures.If the steel is cooled below Ms temperature at a higher velocity than the critical cooling rate,
a certain amount of the austenite transforms to martensite. The amount of martensite formedcan be quantified by the empirical athermal Koistinen-Marburger equation [176]. An isothermaltransformation occurs dring overaging below Ms temperature. The kinetics of this transformationcorresponds to those of the bainite formation above Ms temperature, as mentioned in Section 2.1[55, 57]. Therefore, the isothermal transformation product below Ms is referred to as bainite for-mation in the corresponding literature references. Martensite formed upon cooling to overagingtemperature serves as a nucleation site and promotes the bainite formation. Therefore, isothermalphase transformation is accelerated below Ms (Figure 5.1b). It is important to note that an ac-celeration of phase transformations also occurs close to and above Ms temperature. This can beexplained by inhomogeneities in composition. The Ms temperature is given for the overall chemicalcomposition, whereas the local Ms may vary due to local differences in the chemical composition.This acceleration of phase transformations below the bainite C-curve, i.e. below as well as close toand above Ms, is called swing-back [89, 177].
a) CCT b) TTT
Figure 5.1: Time-temperature-transformation diagrams: a) Transformed phase fraction during con-tinuous cooling (CCT) for two cooling rates T1 < T2. The dashed lines divide the diagram intodifferent temperature ranges, at which ferrite, pearlite, bainite and martensite form. b) Time-temperature curve for a given transformed phase fraction (black curve) during overaging at a giventemperature (TTT). The dashed C curves indicate the time-temperature range at which ferrite,pearlite, and bainite form. The dashed line indicates Ms temperature. The black arrow denotes theswing back phenomenon, i.e. the acceleration of isothermal phase transformation with decreasingoveraging temperature close to and above Ms [89, 177]. The isothermal phase transformation alsocontinues below Ms (see Section 2.1).
The influence of alloying elements on phase transformations will be discussed in detail in Sec-tion 5.2 of this chapter.
5.1.2 Microstructure and the amount of retained austenite
The typical trend in the amount of retained austenite with proceeding overaging time is shown inFigure 5.2a. For very short overaging times, the majority of the large austenite fraction presentat the end of the overaging step is unstable at room temperature and transforms to martensiteupon the final cooling. The amount of retained austenite rapidly increases at the beginning of the

5.1. A GENERAL OVERVIEW 83
overaging step. While bainite forms during overaging, interstitially dissolved carbon can diffuse andpartition from the newly transformed bainite to the remaining austenite. Higher carbon contentprovides higher stability of the austenite against martensite transformation upon the final cooling.Furthermore, the amount of austenite is reduced by the amount of bainite formed at overagingtemperature. A lower amount of austenite during overaging means that the carbon in the austeniteis spread over a lower volume fraction, which results in a higher average carbon content in theaustenite. Smaller austenite islands result in shorter diffusion distances in the austenite. Therefore,more carbon diffuses closer to the center of the austenite islands.
a) b)
Figure 5.2: Scheme of the amount of retained austenite as a function of a) overaging time and b)overaging temperature (I: low Toa, II: medium Toa, III: high Toa).
The SEM images of Figures 5.3a and 5.3b show that the amount of bainite and retained austeniteincreases, while the fraction of fresh martensite decreases for short overaging times. The microstruc-ture of steel 0.2Cr1180 still shows large areas of fresh martensite formed during the final quenchingafter holding for 30 s at an overaging temperature of 400 C (Figure 5.3a). After 120 s of overaging,the amount of bainite is higher, the retained austenite islands are larger, and there is almost nomore fresh martensite (Figure 5.3b).
After the initial increase, there are three options for the further development of the amount ofretained austenite during overaging (Figure 5.2a). Each of these following scenarios occurs withina typical overaging temperature range (Figure 5.2b). As shown in Figure 5.2b, the amount ofretained austenite increases up to a peak and then decreases with increasing overaging temperature(e.g. Figure 4.20). In the first option after the initial increase in the amount of retained austenite asoveraging proceeds, the amount of retained austenite stays at the same level (I and IIβ, Figure 5.2a).This is typical for low and medium overaging temperatures (I and II, Figure 5.2b). Second, theamount of retained austenite slightly continues to increase (IIα, Figure 5.2a), which can be observedfor medium overaging temperatures (IIα, Figure 5.2a). Third, the amount of retained austenitedecreases as the overaging time proceeds (III, Figure 5.2a). This tendency is mainly found forhigher overaging temperatures (III, Figure 5.2b).
In the first option after the initial increase in the amount of retained austenite with increasingoveraging time, bainite transformation stops, which is indicated by a plateau in the amount ofretained austenite (I and IIβ in Figure 5.2a). Figure 5.3 shows an example of case IIβ. As indi-cated by Figures 5.3b and 5.3c, most of the bainite has transformed after overaging for 120 s, andthe partitioning of carbon resulting in the stabilization of the majority of the austenite to roomtemperature corresponds to IIα, as shown in Figure 5.2a. This is why both microstructures are

84 CHAPTER 5. DISCUSSION
very similar. According to the T0-concept, this scenario may happen as soon as the critical carboncontent is reached in the austenite, which corresponds to T0 = Toa [46]. After the bainite formationhas stopped, either no more carbon partitions to the austenite or further partitioning does not resultin higher amounts of retained austenite but further stabilization of the existing austenite.
The lower amount of retained austenite at low overaging temperatures (I in Figure 5.2) com-pared to medium overaging temperatures can be explained as follows: Carbide precipitation duringoveraging is more pronounced for low overaging temperatures, as seen in (Figure 5.4a). On the onehand, transformation is faster below the swing-back phase at lower overaging temperatures. On theother hand, diffusion rates are lower at lower overaging temperatures. As a consequence, there mightbe not enough time and the carbon is too slow to diffuse to the austenite. In addition, the driv-ing force for carbide precipitation is higher and the solubility of carbon in the bainitic/martensiticmatrix is lower at lower overaging temperatures.
The second option after the initial increase is, that the amount of retained austenite continuesto increase. As long as this is the case (IIα, Figure 5.2a), there is still carbon diffusing from thebainite into the austenite during overaging and this carbon contributes to the stabilization of furtheramounts of austenite to room temperature. This does not necessarily have to involve further bainiteformation because carbon can continue to partition from the existing bainite to the austenite.
The critical carbon content c0 at which bainite formation stops increases with decreasing tem-perature. Thus, higher amounts of bainite can form at medium overaging temperatures compared tohigh overaging temperatures until bainite formation stops. This leads to smaller austenite islands,that are comprised of higher carbon content prior to the final cooling when compared to higheroveraging temperatures. Furthermore, at medium overaging temperatures less carbides are presentin the bainitic matrix compared to lower overaging temperatures (Figure 5.4b vs. Figure 5.4a,respectively). Thus, more carbon remains dissolved and stabilizes the austenite, which results inhigher amounts of retained austenite. As a consequence, the amount of retained austenite is highestfor medium overaging temperatures (II in Figure 5.2), as confirmed by Figure 5.4b.
Finally, the third possible continuation after the initial increase is a drop in the amount ofretained austenite with increasing overaging time (III in Figure 5.2a). At higher overaging temper-atures, the bainite formation stops at lower amounts of bainite. This is because, according to theT0 concept, at higher overaging temperature the critical carbon concentration c0 required to stopbainite transformation is lower. For higher overaging temperatures carbon diffusion is faster andthe driving force for carbide precipitation is lower. Therefore, the bainite formed at high overagingtemperatures such as 475 C contains much less carbides compared to lower overaging temperatures,as can be seen in Figure 5.4c.
However, in the case of the drop in the amount of retained austenite with proceeding overagingtime, carbon precipitates from the austenite during overaging reducing the amount of austenitethat can be stabilized to room temperature. One option to explain the carbon precipitation is theformation of pearlite. Another possibility is the precipitation of carbon in the form of carbides.The most common carbide in the present steels is cementite. However, transition carbides are alsopossible. For both of these options, carbon precipitation from the austenite reduces its carboncontent and, thereby, its stability. On the one hand, austenite decomposition by carbon precipi-tation, e.g. in the form of cementite, directly reduces the amount of austenite. Steels that wereheld at high overaging temperatures such as steel 0.2Cr1180 in Figure 5.4c contain large fractionsof fresh martensite and may contain pearlite formed during overaging. The longer the overagingtime, the more of the austenite transforms to pearlite during overaging. On the other hand, carbonprecipitation can deplete the remaining austenite of carbon. The later can lower the stability of theaustenite, thereby promoting the decomposition of the austenite to martensite upon final cooling.As a result, higher overaging temperatures above the peak in the amount of retained austenite givenin Figure 5.2b, lead to lower amounts of retained austenite.

5.1. A GENERAL OVERVIEW 85
a) 0.2Cr1180, toa = 30 s b) 0.2Cr1180, toa = 120 s c) 0.2Cr1180, toa = 600 s
Figure 5.3: SEM images of TBF heat-treated steel 0.2Cr1180 for overaging times of a) toa = 30 s,b) toa = 120 s, and c) toa = 600 s comprising bainite (B), lower bainite (LB), austenite (A) andmartensite (M) (Toa = 400 s, T ≈ 50K/s).
a) 0.01Cr1180, Toa = 350 C b) 0.01Cr1180, Toa = 425 C c) 0.01Cr1180, Toa = 475 C
Figure 5.4: SEM images of Q&P and TBF steel 0.01Cr1180 for various overaging temperaturescomprising polygonal ferrite (F), pearlite (P), bainite (B), lower bainite (LB), tempered marten-site (TM), retained austenite (A) and retained austenite/martensite islands (MA) (toa = 600 s,T ≈ 50K/s). a) Toa = 350 C corresponding to I in Figure 5.2b, b) Toa = 425 C (II in Fig-ure 5.2b), and c) Toa = 475 C (III in Figure 5.2b).
The stabilization procedure of the retained austenite via carbon partitioning during the overagingstep is different in comparison to conventional TRIP steels [107, 172]. The most important differ-ence between conventional TRIP steels and TRIP-assisted steels with bainitic and/or martensiticmatrix is, that conventional TRIP steels comprise almost no carbides down to overaging temper-atures of 350 C. In the TRIP-assisted TBF and Q&P sheet steels presented in this work, carbideprecipitations are present at most overaging temperatures, albeit less pronounced at higher overag-ing temperatures. Furthermore, in the presence of polygonal ferrite from intercritical annealing ofconventional TRIP steels, the gain in the amount of retained austenite correlates with the overagingtemperature. As long as the gain in diffusion velocity has a higher impact on phase transformationrate than the reduction of the thermodynamic driving force, higher overaging temperatures resultin the faster progression of diffusion-controlled phase transformations. Therefore, the amount ofretained austenite in conventional TRIP steels is higher for higher overaging temperatures afterthe same overaging time. In TBF steels, in contrast, the isothermal bainite transformation stopsat the latest when the critical carbon content c0 of the austenite is reached for a given overaging

86 CHAPTER 5. DISCUSSION
temperature.Speer et al. [40] developed a model to describe the amount of retained austenite and assumed the
amount of retained austenite to be the residual of the total amount of austenite after annealing lessthe initial amount of martensite formed before overaging and less the martensite formed during finalcooling depending on the austenite stability. However, bainite formation is not taken into accountin this approach. The present work demonstrates the significant influence of bainite formation andcarbon partitioning in particular into the austenite during overaging on the amount of retainedaustenite of TBF and Q&P steels.
5.1.3 Mechanical properties
Mechanical properties are explained on the basis of the knowledge gained about the overall mi-crostructure and especially the amount of retained austenite. Figure 5.6 shows the trend of me-chanical properties as a function of overaging time and overaging temperature. Looking at thebeginning of the overaging step, the yield strength of TBF or Q&P heat-treated steels rapidly de-creases with increasing overaging time (Figure 5.6a). In this first step, bainite rapidly forms. Asdescribed in detail above, the amount of retained austenite also increases for the beginning of theoveraging step mainly due to carbon partitioning in combination with the reduction of the size of theaustenite grains before cooling. As a result, the amount of fresh martensite in the microstructuresignificantly decreases with progressing bainite transformation for the beginning of the overagingstep (Figure 5.3a). The replacement of hard fresh martensite by softer microstructure componentssuch as bainite leads to an increase in uniform and total elongation and a decrease in the overallstrength of the material.
After the initial decrease, there are three options for the further development of the yield strengthas overaging time progresses (Figure 5.6a). These different possibilities roughly correspond tooveraging temperature ranges (I: low Toa, II: medium Toa, III: high Toa) marked in Figure 5.6band Figure 5.2b. At low overaging temperature, yield strength changes its tendency to an increasewith increasing overaging time. This gain in yield strength arises in particular from two differentsources: first, the strongest improving effect on yield strength appears to be the continuing reductionof the size and amount of the fresh martensite islands. Second, the present work shows that yieldstrength benefits from lower amounts of retained austenite. The effect of tempering on yield strengthis much lower than that of changes in the size and amount of fresh martensite and/or retainedaustenite inclusions. As overaging proceeds, yield strength only slightly increases as a result ofmatrix tempering.
Figure 5.5a-c in combination with yield strength and amount of retained austenite shown inFigure 4.12a confirm the importance of the amount of retained austenite for yield strength. De-spite the significant decrease in the amount of fresh martensite as overaging time proceeds, yieldstrength remains at the same level. Here, the decrease in the amount of fresh martensite appearsto be compensated by the increase in the amount of retained austenite, as shown in Figure 4.12a.Moreover, if both the amount of retained austenite as well as the amount of fresh martensite de-crease, yield strength significantly increases. In both cases, tensile strength stays at similar values,and the morphology of the matrix looks similar for the different overaging times. Thus, it can beconcluded that the amount of retained austenite not only largely promotes uniform elongation, butalso significantly impairs yield strength (Figure 4.12a).
Tensile strength also strongly decreases with increasing overaging time considering short over-aging times (Figure 5.6a). This also can be attributed to the loss in strength as a result of thereplacement of fresh martensite by bainite, as explained above for yield strength. The most re-markable thing about tensile strength is that it stays at the same level after the initial drop, whichcan be explained as follows: most of the retained austenite transforms to martensite via SIMT

5.1. A GENERAL OVERVIEW 87
a) 2.2Mn1180 b) 2.4Mn1180 c) 2.6Mn1180
Figure 5.5: LePera etched optical micrographs of Q&P steel 2.6Mn1180 for a fixed overagingtemperature of Toa = 350 C comprising lower bainite (LB), tempered martensite (TM), retainedaustenite (A), and retained austenite/martensite islands (MA) (T ≈ 50K/s). a) toa = 120 s, b)toa = 180 s, and c) toa = 600 s.
during straining below the onset of necking. Therefore, the replacement of martensite by retainedaustenite through further stabilization of the austenite by carbon partitioning prior to cooling toroom temperature has little effect on the microstructure present at uniform elongation.
Furthermore, tensile strength first decreases then increases with increasing overaging tempera-ture (Figure 5.6b). The main reason for the decrease in tensile strength with increasing overagingtemperature in the low overaging temperature range is a result of the change in bainitic/martensiticmatrix. The lath thickness increases with increasing overaging temperature, which contributes tothe reduced strength of the matrix. In addition, the strength of the matrix decreases as overagingtemperature increases, because the carbides are less dispersed at higher overaging temperatures.The change in the tendency of tensile strength to an increase with increasing overaging temperaturein the high overaging temperature range arises from the increase in the amount of retained austeniteand martensite in the final microstructure as a consequence of the T0 effect.
Uniform elongation as a function of overaging time (Figure 5.6a) correlates very well with theamount of retained austenite overall (Figure 5.2a). This means that uniform elongation increaseswith increasing overaging temperature for low overaging temperatures, whereas the opposite is thecase for high overaging temperatures. In analogy to the amount of retained austenite, the overagingtemperature above which the tendency changes is lower for the 1180 grade than for the 980 grade.As mentioned above, this is because the additional carbon and manganese in the 1180 grade stabilizethe austenite and result in higher amounts of austenite before the final cooling. Due to the largersize and the lower carbon content of the austenite, less retained austenite is stabilized to roomtemperature resulting in higher amounts of fresh martensite. Higher amounts of fresh martensiteinstead of bainite result in higher tensile strength and lower uniform elongation, as described in thefirst paragraph of this section. The replacement of retained austenite by fresh martensite does notnecessarily result in higher tensile strength, but it considerably deteriorates uniform elongation.
At high overaging temperatures, uniform elongation does not decrease as drastically as theamount of retained austenite with increasing overaging temperature. This can be explained by themuch softer, more globular and less lath-like (upper) bainitic matrix at higher overaging temper-atures. It is worth noting that the uniform elongation of both the 980 and the 1180 group areat a similar level, while yield and tensile strength are on average 100 to 200MPa higher for the1180 steels than for the 980 grades (e.g. Figure 4.6a and 4.6b). This is a result of the significantlyhigher amount of retained austenite in the 1180 grade, which in many cases is almost twice that of

88 CHAPTER 5. DISCUSSION
the 980 grade. The higher amount of retained austenite compensates the loss in uniform elongation,which is expected to arise from such a significant strength increase.
a) b)
Figure 5.6: Scheme of yield strength, tensile strength, and uniform elongation as a function of a)overaging time and b) overaging temperature (I: low Toa, II: medium Toa, III: high Toa).
5.2 Influence of alloying elements on TBF and Q&P sheet steel
5.2.1 Silicon
In this chapter, the effect of silicon on phase transformation behaviour, amount of retained austenite,microstructure, and mechanical properties is discussed.
As shown in Figure 4.1a, phase transformations during continuous cooling are slightly acceleratedby silicon additions to the 980 grade for almost the whole investigated temperature range. Thetemperature at which ferrite begins to form from austenite, Ar3, upon cooling at a rate of 3K/s is alsoslightly higher for higher silicon contents (Figure 4.1a). The acceleration in phase transformationsduring continuous cooling can be explained as follows: as a ferrite stabilizer, silicon increases theAr3 temperature. As a result the thermodynamic driving force of phase transformations determinedby the difference between the current and Ar3 temperature is higher. The higher the transformationtemperature, the stronger silicon accelerates phase transformations. The possible reason might bethat at higher temperatures the temperature difference between the current and Ar3 temperature is

5.2. INFLUENCE OF ALLOYING ELEMENTS ON TBF/Q&P SHEET STEEL 89
smaller. Therefore, changes in the Ar3 temperature can have a greater impact on the thermodynamicdriving force at temperatures closer to Ar3 temperature.
In contrast, silicon decelerates phase transformations in the entire investigated temperature-timewindow during overaging (Figure 4.4b). Both the mostly carbide-free pre-isothermal transformationproduct as well as the suppression of carbide precipitation by silicon can contribute to a highercarbon content in the austenite, which most probably enhances its stability. The higher stability ofthe austenite decreases the thermodynamic driving force and decelerates the phase transformationduring overaging.
A second explanation for the deceleration of isothermal phase transformation is that a higheramount of substitutionally dissolved silicon can contribute to the solute drag effect. Silicon canimpair the mobility of the grain boundary between the remaining austenite and the new transfor-mation product. However, this influence is limited to the temperature-time window at which silicondiffusion velocity is only slightly lower than the grain boundary velocity of the phase transforma-tion. Since silicon is a substitutional element, high overaging temperatures are required to fulfil thispremise given the present industry-related overaging time range.
An important finding of the present work is that silicon decelerates phase transformations inthe 1180 grade during continuous and isothermal transformation almost in the entire observed timeand temperature window (Figure 4.4). The austenite stabilizing and the solute drag effect arisingfrom the higher carbon, manganese, silicon, and chromium content apparently outweigh the ferritestabilizing effect of silicon on phase transformations in the case of the grade 1180.
Only at very high overaging temperatures of more than 550 C, silicon accelerates the isothermalphase transformation in this grade (Figure 4.4b). Here, pearlite is observed to form faster forhigher silicon contents, even though silicon retards the precipitation of carbon from the austenite.This effect was previously reported for conventional C-Si-Mn TRIP steels [178]. The promotionof pearlite formation by silicon additions at high overaging temperatures might be a result ofthe stronger impact of changes in Ar3 temperature on the thermodynamic driving force at higheroveraging temperatures. Moreover, silicon diffuses much faster at these temperatures, allowing asilicon redistribution in favour of carbon precipitation. In addition, the high carbon diffusion rate atthese temperatures support a more rapid accumulation of carbon to precipitate. This observationis in good agreement with literature [52]. Based on thermodynamic calculations, Kozeschnik etal. state that silicon decelerates cementite formation in para-equilibrium only, while in ortho-equilibrium no deceleration through silicon additions is observed [52].
Microstructure and amount of retained austenite are in good agreement with the observationson phase transformations (Figure 4.2 and 4.3). Silicon increases the amount of retained austeniteup to an overaging temperature of 425 C in particular in the 980 grade. This can be attributed tothe higher stability of the austenite and its higher carbon content through the reduction of carbonprecipitation resulting from silicon additions. This hypothesis is supported by the observation ofreduced presence of carbides in this grade for higher silicon content. Furthermore, for the 980 gradepolygonal ferrite is observed in the steel with the highest silicon content, grade 1.0Si980, as a resultof the accelerated phase transformation at high temperatures during continuous cooling (Figure 4.1).Finally, a more lath-like and structured bainite can be observed for higher silicon content. This ismost likely a result of the retarded bainite formation. The lath-structure of bainite or martensitetends to become blurry, and the laths tend to vanish as tempering proceeds, which can be attributedto precipitation of the formerly interstitially dissolved carbon. The formation of bainite is later inthe event of higher silicon content, so its tempering time is shorter. Therefore, tempering is lessprogressed and the bainite is more lath-like and structured for greater silicon additions.
In the 1180 grade, there is only a very slight increase in the amount of retained austenite fromthe lowest to the two higher silicon contents (Figure 4.6). The amount of retained austenite isalready much higher in all variants of the 1180 grade as opposed to the 980 grade. The austenite is
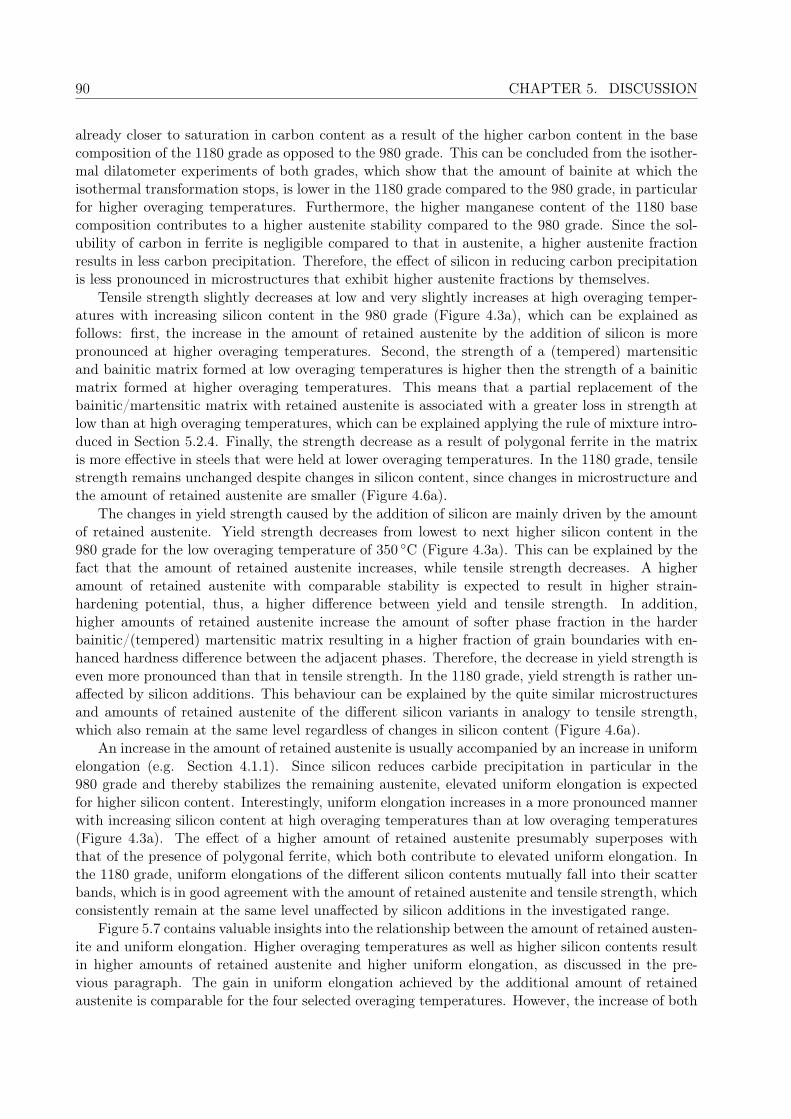
90 CHAPTER 5. DISCUSSION
already closer to saturation in carbon content as a result of the higher carbon content in the basecomposition of the 1180 grade as opposed to the 980 grade. This can be concluded from the isother-mal dilatometer experiments of both grades, which show that the amount of bainite at which theisothermal transformation stops, is lower in the 1180 grade compared to the 980 grade, in particularfor higher overaging temperatures. Furthermore, the higher manganese content of the 1180 basecomposition contributes to a higher austenite stability compared to the 980 grade. Since the sol-ubility of carbon in ferrite is negligible compared to that in austenite, a higher austenite fractionresults in less carbon precipitation. Therefore, the effect of silicon in reducing carbon precipitationis less pronounced in microstructures that exhibit higher austenite fractions by themselves.
Tensile strength slightly decreases at low and very slightly increases at high overaging temper-atures with increasing silicon content in the 980 grade (Figure 4.3a), which can be explained asfollows: first, the increase in the amount of retained austenite by the addition of silicon is morepronounced at higher overaging temperatures. Second, the strength of a (tempered) martensiticand bainitic matrix formed at low overaging temperatures is higher then the strength of a bainiticmatrix formed at higher overaging temperatures. This means that a partial replacement of thebainitic/martensitic matrix with retained austenite is associated with a greater loss in strength atlow than at high overaging temperatures, which can be explained applying the rule of mixture intro-duced in Section 5.2.4. Finally, the strength decrease as a result of polygonal ferrite in the matrixis more effective in steels that were held at lower overaging temperatures. In the 1180 grade, tensilestrength remains unchanged despite changes in silicon content, since changes in microstructure andthe amount of retained austenite are smaller (Figure 4.6a).
The changes in yield strength caused by the addition of silicon are mainly driven by the amountof retained austenite. Yield strength decreases from lowest to next higher silicon content in the980 grade for the low overaging temperature of 350 C (Figure 4.3a). This can be explained by thefact that the amount of retained austenite increases, while tensile strength decreases. A higheramount of retained austenite with comparable stability is expected to result in higher strain-hardening potential, thus, a higher difference between yield and tensile strength. In addition,higher amounts of retained austenite increase the amount of softer phase fraction in the harderbainitic/(tempered) martensitic matrix resulting in a higher fraction of grain boundaries with en-hanced hardness difference between the adjacent phases. Therefore, the decrease in yield strength iseven more pronounced than that in tensile strength. In the 1180 grade, yield strength is rather un-affected by silicon additions. This behaviour can be explained by the quite similar microstructuresand amounts of retained austenite of the different silicon variants in analogy to tensile strength,which also remain at the same level regardless of changes in silicon content (Figure 4.6a).
An increase in the amount of retained austenite is usually accompanied by an increase in uniformelongation (e.g. Section 4.1.1). Since silicon reduces carbide precipitation in particular in the980 grade and thereby stabilizes the remaining austenite, elevated uniform elongation is expectedfor higher silicon content. Interestingly, uniform elongation increases in a more pronounced mannerwith increasing silicon content at high overaging temperatures than at low overaging temperatures(Figure 4.3a). The effect of a higher amount of retained austenite presumably superposes withthat of the presence of polygonal ferrite, which both contribute to elevated uniform elongation. Inthe 1180 grade, uniform elongations of the different silicon contents mutually fall into their scatterbands, which is in good agreement with the amount of retained austenite and tensile strength, whichconsistently remain at the same level unaffected by silicon additions in the investigated range.
Figure 5.7 contains valuable insights into the relationship between the amount of retained austen-ite and uniform elongation. Higher overaging temperatures as well as higher silicon contents resultin higher amounts of retained austenite and higher uniform elongation, as discussed in the pre-vious paragraph. The gain in uniform elongation achieved by the additional amount of retainedaustenite is comparable for the four selected overaging temperatures. However, the increase of both
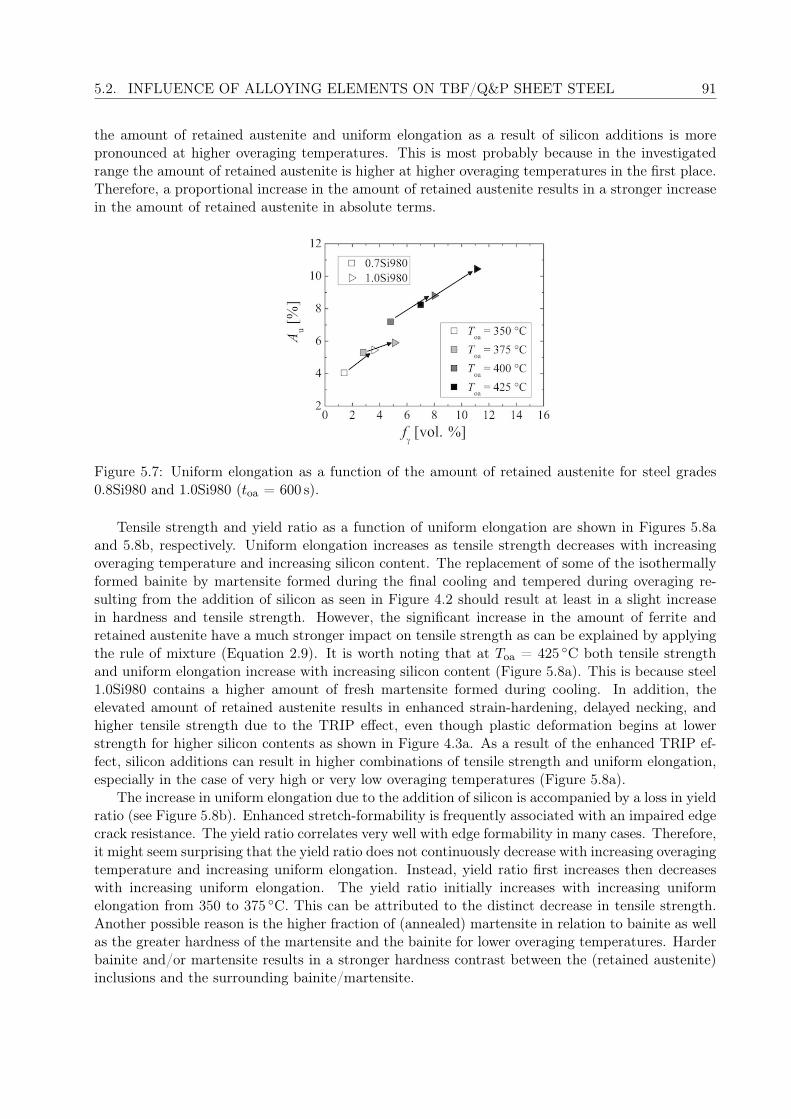
5.2. INFLUENCE OF ALLOYING ELEMENTS ON TBF/Q&P SHEET STEEL 91
the amount of retained austenite and uniform elongation as a result of silicon additions is morepronounced at higher overaging temperatures. This is most probably because in the investigatedrange the amount of retained austenite is higher at higher overaging temperatures in the first place.Therefore, a proportional increase in the amount of retained austenite results in a stronger increasein the amount of retained austenite in absolute terms.
Figure 5.7: Uniform elongation as a function of the amount of retained austenite for steel grades0.8Si980 and 1.0Si980 (toa = 600 s).
Tensile strength and yield ratio as a function of uniform elongation are shown in Figures 5.8aand 5.8b, respectively. Uniform elongation increases as tensile strength decreases with increasingoveraging temperature and increasing silicon content. The replacement of some of the isothermallyformed bainite by martensite formed during the final cooling and tempered during overaging re-sulting from the addition of silicon as seen in Figure 4.2 should result at least in a slight increasein hardness and tensile strength. However, the significant increase in the amount of ferrite andretained austenite have a much stronger impact on tensile strength as can be explained by applyingthe rule of mixture (Equation 2.9). It is worth noting that at Toa = 425 C both tensile strengthand uniform elongation increase with increasing silicon content (Figure 5.8a). This is because steel1.0Si980 contains a higher amount of fresh martensite formed during cooling. In addition, theelevated amount of retained austenite results in enhanced strain-hardening, delayed necking, andhigher tensile strength due to the TRIP effect, even though plastic deformation begins at lowerstrength for higher silicon contents as shown in Figure 4.3a. As a result of the enhanced TRIP ef-fect, silicon additions can result in higher combinations of tensile strength and uniform elongation,especially in the case of very high or very low overaging temperatures (Figure 5.8a).
The increase in uniform elongation due to the addition of silicon is accompanied by a loss in yieldratio (see Figure 5.8b). Enhanced stretch-formability is frequently associated with an impaired edgecrack resistance. The yield ratio correlates very well with edge formability in many cases. Therefore,it might seem surprising that the yield ratio does not continuously decrease with increasing overagingtemperature and increasing uniform elongation. Instead, yield ratio first increases then decreaseswith increasing uniform elongation. The yield ratio initially increases with increasing uniformelongation from 350 to 375 C. This can be attributed to the distinct decrease in tensile strength.Another possible reason is the higher fraction of (annealed) martensite in relation to bainite as wellas the greater hardness of the martensite and the bainite for lower overaging temperatures. Harderbainite and/or martensite results in a stronger hardness contrast between the (retained austenite)inclusions and the surrounding bainite/martensite.

92 CHAPTER 5. DISCUSSION
2 4 6 8 10 120.65
0.70
0.75
0.80
0.85 Toa
= 350 °CT
oa = 375 °C
Toa
= 400 °CT
oa = 425 °C
0.7Si9801.0Si980
R p0.2 / R m
[-]
Au [%]
a) b)
Figure 5.8: a) Tensile strength and b) yield ratio as a function of uniform elongation for steel grades0.8Si980 and 1.0Si980 (toa = 600 s).
5.2.2 Manganese
In this section, the influence of manganese on phase transformation behaviour, microstructure, andmechanical properties of TBF and Q&P steels is discussed. Relatively small changes in manganesecontent of 0.2mass% result in significant changes in phase transformation kinetics, microstructure,and mechanical properties. The following paragraphs will show, that the impact of manganese onphase transformations, microstructures, and mechanical properties is even more pronounced in the1180 grade compared to the 980 grade, in particular at high overaging temperatures.
As demonstrated in the Sections 4.1.3 and 4.1.4, manganese strongly decelerates both phasetransformations during continuous cooling as well as the bainite transformation during overaging.Figure 5.9 confirms that the deceleration of bainite formation during overaging is more pronouncedin the 1180 than in the 980 grade. It further shows, that the final transformed phase fraction after1200 s of overaging is lower for higher manganese contents. The slight slope in the curve at the endof the overaging step indicates that bainite transformation does not stop within the first 1200 s ofoveraging (Figure 5.9).
255075100
0 50 100 150 200 250 115012000255075
2.2Mn980 2.4Mn980 2.6Mn980
Mn
Mn
2.2Mn1180 2.4Mn1180 2.6Mn1180
l norm
[%]
toa
[s]
Figure 5.9: Normalized sample length of both 980 and 1180 grade manganese variants duringoveraging at Toa = 400 C (Tan = 900 C, T ≈ 70K/s).

5.2. INFLUENCE OF ALLOYING ELEMENTS ON TBF/Q&P SHEET STEEL 93
The deceleration of phase transformations is in good agreement with the changes in the mi-crostructure. Polygonal ferrite is observed in the 980 variant with the lowest manganese content(Figure 4.8a and 4.8d), 2.2Mn980, the formation of which is significantly reduced by higher man-ganese contents. Only very few small polygonal ferrite grains are present in steel 2.4Mn980 and nopolygonal ferrite can be found in grade 2.5Mn980 (Figure 4.8b, c, e, and f). The polygonal ferriteseems to alter the morphology of the bainite that forms during overaging. As a result, the matrixis much more globular and there are no laths visible in steel 2.2Mn980 as opposed to 2.4Mn980 and2.5Mn980 (Figure 4.8).
In both the 980 and 1180 grades, the size of the retained austenite grains for low overaging tem-peratures and the size of the retained austenite/martensite islands at high overaging temperatures islarger for higher manganese contents, which is a result of the decelerated phase transformation dueto manganese additions. It is worth noting, that the amount of retained austenite of steel 2.2Mn980decreases for longer overaging times of 300 and 600 s at the high overaging temperature of 425 C,whereas it remains at the same level for the grades with higher manganese content (Figure 4.9).This is most probably a consequence of the change in bainite morphology resulting from the polyg-onal ferrite in the matrix. The change in morphology of the phases constituting the matrix affectsthe shape as well as the carbon content and distribution of the retained austenite. A replacement ofthin film type austenite embedded in a lath-like matrix by globular austenite islands most probablyreduces its stability and therefore the amount that is stable at room temperature.
To gain a deeper understanding of the changes in bainite morphology of the matrix caused bymanganese additions, it is useful to take a closer look at the transformation kinetics. The growthmechanism of bainite is unclear to this date. In fact, the nature of bainite transformation hasbeen subject of controversial discussion ever since the discovery of bainite [179]. The shape andmorphology of bainite is similar to that of martensite. Both bainite and martensite do not growacross former austenite grain boundaries, and both martensite and bainite transformation stop priorto equilibrium [180]. However, there are fundamental differences between bainite and martensitesuch as different habit planes depending on transformation temperature and the limited size of lessthan that of the austenite grain that bainite plates grow to. There are indicators for purely diffusion-controlled, also termed reconstructive, and displacive transformation, also referred to as displace,martensitic, or military. The actual type of the transformation could possibly be a mixture of both.Since the driving force for transformation depends on the underlying transformation mechanism,there is no consistent description for it either.
Displacive transformations cause internal strains. To initiate displacive phase transformation,the applied energy must at least overcome the elastic energy caused by the additional lattice dis-tortion and the stored energy caused by the newly generated grain boundaries and surfaces. Thehighest share of the stored energy in bainite arises from the invariant-plane shape deformation,whereas the interfacial energy is negligible [46]. The chemical driving force plays a crucial role inovercoming the mentioned energy barriers of displacive transformations. It can be described asF = kB
Ω (T − Te) · ce ln ce, where kB is the Boltzmann constant, Ω is the atomic volume, T is theoveraging temperature, Te is the equilibrium temperature, and ce is the equilibrium concentrationof the alloying element. Due to their low diffusion velocities at overaging temperatures, which aretypical for TBF and Q&P steels, the partitioning of substitutional elements during the bainite re-action is very limited. However, they strongly affect the relative thermodynamic stabilities of theaustenite and ferrite phases [46]. A tendency is deducible when different empirical equations fortransformation temperature are compared throughout the8 literature: The higher the difference inGibbs free energy ∆Gm,chem = Gm,bcc − Gm,fcc between the bcc and the fcc phase, the lower alltransformation temperatures, that is A3 for eutectoid transformations in equilibrium, T0 for bainitetransformations and Ms for purely martensitic transformations.
Figure 5.10 shows ∆Gm,chem as a function of temperature for the three investigated manganese

94 CHAPTER 5. DISCUSSION
contents of the 1180 grade obtained from Thermo-Calc c© TCFE6 [165] calculations. ∆Gm,chem
decreases with increasing manganese content. This means that the bcc phase is energetically lessfavourable compared to the fcc phase for higher manganese content. As expected from literatureand the present experimental observations, manganese thermodynamically stabilizes the austenite.However, it is interesting to note that rather small changes in molar Gibbs free energy due tomanganese additions result in remarkable changes in phase transformations, microstructures, andmechanical properties. The lower driving force for ferrite formation from the austenite throughhigher manganese contents explains the observed deceleration of reconstructive phase transforma-tions during continuous cooling and overaging. This deceleration is in good agreement with liter-ature [22, 53, 73]. As a result, the size of the retained austenite/martensite islands increases withincreasing manganese content and is even larger in the 1180 grade (Figure 4.8). Furthermore, themanganese content of the 2.2Mn980 grade is insufficient to suppress ferrite formation during coolingto overaging temperature in the 980 grade, as seen in Figure 4.8a.
200 300 400 500 600 700 800 900 1000-3000
-2500
-2000
-1500
-1000
-500
0
500
Gm
, che
m [J
/mol
e]
T [°C]
2.2Mn1180 2.4Mn1180 2.6Mn1180
350 400 450
-1800
-1500
-1200
Figure 5.10: Thermo-Calc c© calculations: Difference in molar Gibbs free energy of fcc and bcc phase∆Gm,chem as a function of temperature.
If bainite transformation itself or the nucleation required to initiate bainite transformation isconsidered as a diffusion-controlled growth process, it follows a sigmoid function of transformedfraction over time. This transformation behaviour can be described by the Johnson-Mehl-Avrami-Kolmogorov equation [110, 181]:
ftrans =∑i
xi [1− exp (−ki · tηi)] . (5.1)
Here, ftrans corresponds to the transformed fraction, k is the reaction rate, and η is the Avramiexponent of the transformed phase i. The reaction rate is a function of temperature T and activationenergy Q and can be described by the Arrhenius relation:
k = k0 exp (−Q/RT ) , (5.2)
with k0 being a constant and R the universal gas constant. To determine the values of k and η, itis convenient to linearize Equation 5.1 [110]:
ln (− ln [1− ftrans]) = ln k + η ln t (5.3)

5.2. INFLUENCE OF ALLOYING ELEMENTS ON TBF/Q&P SHEET STEEL 95
Figure 5.11 shows this approach applied to the dilatometer data of the manganese variants ofthe 980 and 1180 grade presented in this section. This plot enables to draw conclusions aboutthe nature of nucleation and growth kinetics of the bainitic reaction. In fact, the plot does notshow straight lines, but a slight decrease in the slope of the curves with increasing time. Thus,the character of the bainite reaction changes over time or is superposed by another reaction suchas cementite precipitation. The Avrami exponent η equals the slope of the curve and depends onshape, nucleation, and growth rate. Since nucleation and growth rate are not necessarily constant,η may be time dependent as it obviously is in this case. The higher the manganese content thesteeper the slope, thus, according to Equation 5.3 the higher the Avrami exponent η in both the980 and 1180 grades. A higher Avrami exponent is associated with a higher volume to surface ratio.Therefore, with increasing η the shape of the bainite crystals can change from needle, to plate, tospherical growth. This explains why the bainite morphology slightly changes from more lath-like torather globular with increasing manganese content (Figure 4.11). The variable k is the activationenergy for nucleation, as seen in Equation 5.2. It can be determined by exponentiating the axisof ordinate, ln k in Equations 5.3, where ln t = 0. The higher ln k the lower the activation energy.The ln k is lower for higher manganese contents in both the 980 and the 1180 grade. Thus, themore manganese the more sluggish nucleation. Just as manganese slows down both nucleation andgrowth, so do the additional carbon and silicon in grade 1180 as compared to grade 980.
2 3 4 5 6
-4
-2
0
2
2.2Mn980 2.4Mn980 2.6Mn980 2.2Mn1180 2.4Mn1180 2.6Mn1180
ln(-ln
(1-f tra
ns))
ln(t)
Figure 5.11: Phase transformation kinetics for the manganese variants of both 980 and 1180 gradesexpressed by the Johnson-Mehl-Avrami-Kolmogorov approach given in Equation 5.3 applied ondilatometer results depicted in Figure 5.9b (Toa = 400 C).
As mentioned in Section 2.2.3, manganese strongly segregates and thereby causes banding. Fig-ure 5.12 illustrates the extent to which manganese segregates in the present steels, calculated usingthe Scheil module of Thermo-Calc c© TCFE6 [165]. The manganese content in the liquid and thesolid phases grow exponentially with the mass fraction of the solid, and the solid phase containsapproximately two thirds as much dissolved manganese as the liquid phase during solidification.Thus, manganese strongly segregates with a tendency to remain in the liquid phase. The inhomo-geneous manganese distribution results in inhomogeneous size distribution of the retained austen-ite inclusions. While the retained austenite grains look fine and disperse in the grade 2.2Mn980and 2.4Mn980, large retained austenite inclusions appear in the grade 2.5Mn980 (Figure 4.8a-c).Manganese segregation is even more detrimental in the 1180 grade, where large retained austen-ite/martensite islands appear already in the grade with the lowest manganese content of 2.2Mn1180,

96 CHAPTER 5. DISCUSSION
and the grade 2.6Mn1180 clearly shows bands of retained austenite/martensite islands (Figure 4.8dand 4.8f). Inhomogeneous manganese distribution does not only impair the desired fine dispersionof the retained austenite grains, however, as demonstrated above, a change in manganese con-tent affects growth kinetics, thus, the morphology of the primarily bainitic matrix (Figure 5.11).Therefore, some regions in the microstructure appear more granular and others more needle-like orplate-like. For instance, in the immediate vicinity of the large retained austenite/martensite islands,the bainite is carbon-depleted and is thus carbide-free.
Figure 5.12: Manganese dissolved in liquid and solid phase as a function of mass fraction of solidof the grade 2.4Mn980 according to the Scheil module of Thermo-Calc c©.
The mechanical properties resulting from the phase transformation behaviour, the amount ofretained austenite and the microstructure will be analyzed in more detail in order to gain furtherunderstanding of the influence of manganese on TBF and Q&P steels. As explained in the previousparagraphs of this section, an increase in the amount of retained austenite is usually accompaniedby a decrease in yield strength, which is also the case for the 980 grade manganese variants. Asthe amount of retained austenite and/or martensite fraction increases, yield strength decreases withincreasing manganese content in particular for higher overaging temperatures.
Tensile strength increases with increasing manganese content in particular at high overagingtemperatures. This is a result of the higher amount of retained austenite and/or fresh martensite.Furthermore, the deceleration of bainite formation could result in a harder bainitic matrix as aresult of a shorter tempering time, as discussed above.
Uniform elongation is independent of manganese additions at low overaging temperatures andincrease with increasing manganese content for high overaging temperatures in the 980 grade aswell as for all overaging temperatures in the 1180 grade (Figure 4.9 and 4.12). The increase inuniform elongation with increasing manganese content correlates very well with the amount ofretained austenite. Since this increase is not as pronounced for a low overaging temperature inthe 980 grade, it shows no relevant effect in these steels. Further, uniform elongation slightlydecreases for prolonged overaging times in both the 980 as well as the 1180 grade for high overagingtemperatures, as the amount of retained austenite also slightly decreases most probably due tocarbide precipitation as overaging progresses.
Most remarkable about the amount of retained austenite and mechanical properties as a functionof overaging temperature is the (parallel) shift of the curves towards lower overaging temperatures(Figure 4.12b). This trend is in excellent agreement with the deceleration of phase transformations,

5.2. INFLUENCE OF ALLOYING ELEMENTS ON TBF/Q&P SHEET STEEL 97
which results in lower amounts of transformed phase fraction during continuous cooling as well asoveraging (Figure 4.10).
It is important to note that the changes in amount of retained austenite and mechanical proper-ties caused by the same amount of manganese additions are much greater in the 1180 grade with thehigher carbon and slightly higher silicon content compared to the 980 grade. The drop in yield andtensile strength as well as the increase in the amount of retained austenite and uniform elongationat low overaging temperatures and roughly vice versa at high overaging temperatures are muchmore pronounced in the 1180 grade than in the 980 grade.
Yield ratio and the difference between tensile strength and fracture stress as a function ofoveraging temperature in the 980 and the 1180 manganese variants are shown in Figures 5.13aand 5.13b, respectively. Similar to yield strength, yield ratio decreases with increasing overagingtemperature and slightly increases above Toa = 425 C. In a certain overaging temperature range,which includes higher overaging temperatures for the 980 grade compared to the 1180 grade, asignificant drop in yield ratio with increasing manganese content is visible (Figure 5.13a). Thisbehaviour can be explained as follows: Both the significant decrease in yield strength as well as theincrease in tensile strength with increasing manganese content contribute to significantly lower yieldratio in the mentioned overaging temperature window. Both effects are a result of the austenitestabilizing effect of manganese. As mentioned above, yield strength decreases due to the increasingsize and presumably also increasing number of retained austenite islands. If quenched to verylow temperatures before overaging, most carbon precipitates and very low amounts of retainedaustenite are stabilized to room temperature. The less carbon precipitates before overaging, whichis the case for increasing overaging temperature, the higher the additional amount of austenitethrough the austenite stabilizing effect of manganese. Tensile strength primarily increases withincreasing amount of martensite due to manganese additions. This is only relevant for overagingtemperatures of above 400 C for the 1180 grade. However, there is a lower limit in yield ratio,which indicates that a further increase in the amount of fresh martensite at the cost of retainedaustenite and bainite does not result in further decrease in yield strength. This means that thedamage mechanism presumably switches from void formation at inclusion/matrix boundaries todecohesion within or between martensitic areas.
The difference between tensile strength and fracture stress Rm − Rb decreases with increasingoveraging temperature in a similar but less pronounced sigmoidal manner compared to yield strengthand yield ratio (Figure 5.13b). The decrease slows down, however, the difference between tensilestrength and fracture stress does not begin to increase with increasing overaging temperature likeyield strength and yield ratio. While the different manganese contents of the 980 grade show verysimilar values amongst each other, the difference in tensile strength and fracture stress is slightlylower for higher manganese contents in the 1180 grade to the same extent for all investigated overag-ing temperatures. The key finding of these tendencies is, that the changes in the difference betweentensile strength and fracture stress caused by manganese additions are much less pronounced andvery similar for different overaging temperatures as compared to the changes in yield ratio due tothe addition of manganese. That is, significant changes in the mechanical behaviour of TBF andQ&P steels at strains below uniform elongation, which mainly arise from an increasing amountof retained austenite for increasing manganese content, have a minor effect on the post-uniformstrength decrease and fracture strength.
Figure 5.14 shows the engineering stress-strain curves of the 980 and the 1180 grades. Thegraphs demonstrate the significant TRIP potential of both grades and how the TRIP effect acts inboth grades at an overaging temperature of 400 C. In the 980 grade, engineering stress significantlyincreases as a result of manganese additions, while uniform and total elongation remain almostunchanged. As mentioned above, manganese reduces the formation of polygonal ferrite, whichitself is a softer matrix constituent than bainite. The polygonal ferrite, furthermore, serves as a
98 CHAPTER 5. DISCUSSION
0.50.60.70.8
2.2Mn980 2.4Mn980 2.6Mn980
R p0.2/R
m [-
]
350 375 400 425 450 4750.50.60.70.8
Toa
[°C]
2.2Mn1180 2.4Mn1180 2.6Mn1180
100
200
300 2.2Mn980 2.4Mn980 2.6Mn980
R m-R
b [MPa
]
350 375 400 425 450 475
100
200
300 2.2Mn1180 2.4Mn1180 2.6Mn1180
Toa
[°C]
a) b)
Figure 5.13: a) Yield ratio and b) difference between tensile strength and fracture stress Rm − Rb
as a function of overaging temperature of both 980 and 1180 manganese variants (toa = 600 s).
nucleation site, presumably causing the more globular bainitic matrix for lower manganese contents.In addition, manganese only slightly increases the amount of retained austenite in the 980 grade,in particular compared to the significantly more pronounced increase in the amount of retainedaustenite as a consequence of manganese additions to the 1180 grade. Therefore, it can be concludedthat the deceleration of diffusional phase transformations results in a significantly higher hardnessof the matrix through manganese additions in the 980 grade. In addition to the strength increase,uniform elongation also slightly increases with manganese content, which can be attributed to theslightly higher amount of retained austenite (Figure 4.12b).
Grade 1180, in contrast, shows significant increase in total elongation with increasing manganesecontent, while tensile strength remains almost at the same level. Since the difference between totaland uniform elongation is negligible in this grade, the gain in total elongation can exclusively beattributed to superior pre-uniform strain-hardening behaviour, which significantly promotes uniformelongation. This gain in uniform elongation correlates very well with the significant increase in theamount of retained austenite with increasing manganese content shown in Figure 4.12b. Therefore,it can be concluded that most of the retained austenite transforms until uniform elongation isreached. In addition, the amount of microstructure components and their morphology, in particularbainite morphology, are fairly similar amongst the different manganese variants of the 1180 gradeas opposed to the 980 grade. Thus, an increase in the amount of retained austenite does not resultin higher tensile strength in the 1180 grade, even though it causes quite a significant increase inuniform elongation.

5.2. INFLUENCE OF ALLOYING ELEMENTS ON TBF/Q&P SHEET STEEL 99
0 2 4 6 8 10 12 14 16 18 20600
700
800
900
1000
1100
1200
2.2Mn980 2.4Mn980 2.6Mn980
[MPa
]
[%]0 2 4 6 8 10 12 14 16 18 20
600
700
800
900
1000
1100
1200
2.2Mn1180 2.4Mn1180 2.6Mn1180
[MPa
]
[%]a) b)
Figure 5.14: Engineering stress-strain curves of a) the 980 and b) the 1180 grade manganese variantsfor an overaging temperature of 400 C and an overaging time of 600 s.
5.2.3 Chromium
The influence of chromium on phase transformations, microstructures, and mechanical propertiesshows some similarities to the influence of manganese described in the previous section. Chromiumalso significantly decelerates all diffusion-controlled phase transformations during continuous coolingand overaging, except for pearlite formation in both the 980 and 1180 grades (Figures 4.13 and 4.16).While the deceleration is similar for different temperatures during continuous cooling, chromiumdecelerates isothermal phase transformations in a more pronounced manner at higher overagingtemperatures, in contrast to manganese, where phase transformations are only slightly slower athigher overaging temperatures. Similar to the manganese variants, the isothermal TTT curve ofthe 1180 grade is shifted to lower overaging times and lower overaging temperatures as comparedto the 980 grade. At an overaging temperature of 600 C, chromium accelerates the isothermalphase transformation in the 1180 grade, which is an indicator for pearlite formation (Figure 4.16).The observed acceleration at high overaging temperatures and a deceleration as well as a shift tolower temperatures of the isothermal phase transformation through chromium additions for loweroveraging temperatures has previously been reported to cause a "bay" between these transformationsof different microstructure components such as pearlite and (upper) bainite [92].
Chromium additions result in a significant increase of the size of the retained austenite/martensiteislands as a result of austenite stabilization. The effect of chromium additions on the size of the re-tained austenite/martensite islands is much greater when compared to manganese. Steel 0.01Cr980comprises small but considerable amounts of polygonal ferrite, as seen in Figure 4.14. The additionalchromium suppresses the formation of polygonal ferrite during cooling to overaging temperaturemainly in the 980 but also in the 1180 grade (Figure 4.14 and 4.18). Finally, the bainitic matrix isalso more globular in the presence of large polygonal ferrite grains, particularly in steel 0.01Cr980(Figure 4.14a).
In addition to the strong deceleration of continuous and isothermal phase transformations, asignificant decrease in the amount of cementite has been observed (Figure 4.18-4.19). These twofindings are connected with each other, since the unprecipitated carbon is available for partitioningand the stabilization of the austenite. The isothermal transformation, furthermore, saturates in theevent of lower amounts of bainite with higher chromium content.
Since the temperature T0 is unaffected by chromium variants in the investigated range (Fig-

100 CHAPTER 5. DISCUSSION
ure 4.17b), the reduced amount of bainite can be explained as follows: The diffusion of substi-tutional elements in para-equilibrium is negligibly small compared to interstitial elements such ascarbon. The difference between the amount of austenite which is stable at room temperature, i.e.retained austenite, and the transformed fraction at overaging temperature transforms to martensiteupon final cooling. Chromium promotes the austenite stability in para-equilibrium during overag-ing. Above a certain threshold in overaging temperature, part of the austenite that is stabilized bychromium additions at overaging temperature, transforms to martensite during the final cooling.The fraction of austenite which transforms to martensite upon final cooling depends on the size,the shape, and the composition of the retained austenite islands, as explained in Section 2.3.2.As a consequence of its austenite stabilizing effect, the addition of chromium results in higheramounts of retained austenite below the mentioned threshold temperature (between Toa = 350 Cand Toa = 425 C) and reduced amounts of retained austenite above this temperature.
The influence of chromium on mechanical properties correlates very well with its influence onphase transformations, microstructures, and amount of retained austenite. Mechanical propertiesof the 980 grade and the 1180 grade react differently to chromium additions (Figure 4.15). Yieldand tensile strength of the 980 grade both increase with increasing chromium content at low over-aging temperatures. This increase in yield and tensile strength as well as the slight decrease inuniform elongation can be explained by the suppression of polygonal ferrite and the change to-wards a more lath-like matrix. At high overaging temperatures, yield and tensile strength alsoincrease with increasing chromium content in the 980 grade because the harder matrix is comprisedof less pre-isothermal transformation product and because of the larger size of the retained austen-ite/martensite islands. In addition, the increase in the amount of retained austenite results in higheruniform elongation.
The additional carbon, manganese, and silicon in the 1180 grade result in a higher amountof retained austenite and less pre-isothermal transformation product to begin with. Therefore,the amount of retained austenite increases with increasing chromium content at low overagingtemperatures (Figure 4.20). This results in a decrease of yield strength above 180 s of overagingas well as an increase in uniform elongation. At high overaging temperatures, the larger size ofthe retained austenite/martensite islands results in a lower amount of retained austenite for higherchromium contents, similar to manganese additions. Since the much larger martensite fractionscause an increase in yield strength and significantly higher tensile strength, uniform elongationsignificantly decreases at high overaging temperatures due to chromium additions.
The tendencies of retained austenite and mechanical properties, in particular yield strength,are shifted to lower overaging temperatures by chromium additions to the 1180 grade as observedfor phase transformation kinetics (Figure 4.20b). A similar tendency has been observed for theeffect of manganese on phase transformations and mechanical properties. However, chromium ismore effective in stabilizing the austenite, in particular at high overaging temperatures, which leadsto larger areas of fresh martensite formed upon the final cooling. This strongly increases bothyield and tensile strength for high overaging temperatures, while uniform elongation is only slightlydeteriorated.
To gain further understanding about the effect of chromium additions on edge formability, themechanical properties and amount of retained austenite discussed above were compared to yieldratio and hole expansion strain, as shown in Figure 5.15. The effect of chromium on yield ratiois negligible, whereas hole expansion is slightly enhanced by higher chromium contents for the lowoveraging temperature of 350 C. Interestingly, hole expansion strain does not correlate with yieldratio for neither overaging temperature (Figure 5.15a). This demonstrates that it is crucial tomeasure hole expansion strain to gain clear insight into edge formability. It is important to notethat chromium additions improve uniform and total elongation as well as hole expansion strain atthe same time for low overaging temperatures (Figure 5.15a). In contrast, the amount of retained

5.2. INFLUENCE OF ALLOYING ELEMENTS ON TBF/Q&P SHEET STEEL 101
0.4Cr1180 0.2Cr11800.01Cr1180
10
30
0.4
1200
800
2
[%]
0.6
20
20
10
8
4
20 10400
0.8
f [vol. %]
A25 [%]
Au [%] Rm [MPa]
Rp0.2/Rm [-]
a) Toa = 350 C
10
30
0.4
1200
800
2
[%]
0.6
20
20
10
8
4
20 10400
0.8
f [vol. %]
A25 [%]
Au [%] Rm [MPa]
Rp0.2/Rm [-]
0.4Cr1180 0.2Cr11800.01Cr1180
b) Toa = 425 C
Figure 5.15: Tensile strength Rm, yield ratio Rp0.2/Rm, hole expansion strain λ, amount of retainedaustenite fγ , uniform elongation Au, and total elongation A25 of grades 0.01Cr1180, 0.2Cr1180 and0.4Cr1180 for overaging temperatures of a) Toa = 350 C and b) Toa = 425 C (toa = 600 s).

102 CHAPTER 5. DISCUSSION
austenite, uniform and total elongation as well as hole expansion strain are significantly compromisedby the addition of chromium at high overaging temperatures (Figure 5.15b). This can be attributedto the significant increase in the fraction of fresh martensite.
5.2.4 Niobium
Niobium in the 980 grade
In terms of their size, the two populations of NbC particles that have been found in the niobiumalloyed grades (Table 4.2) indicate two distinct formation situations [173]. The Thermo-Calc c©TCFE6 [165] based thermodynamic calculation (Figure 5.16) reveals that NbC particles are notcompletely dissolved during reheating at 1180 C in grades 0.045Nb980 and 0.09Nb980. Thus, itcan be concluded that the population of large particles in these grades results from precipitatesformed during casting which undergo an additional Ostwald ripening during reheating and furtherprocessing. This seems to be in contradiction to grade 0.025Nb980, for which a complete dissolutionof NbC particles is predicted. However, it is well known that segregation takes place during casting,and conventional thermomechanical processing does not reduce this segregation.
Figure 5.16: Calculated amount of NbC in thermodynamic equilibrium as a function of temperaturefor the grades 0.025Nb980, 0.045Nb980, and 0.09Nb980 predicted by Thermo-Calc c©, Trh: reheatingtemperature prior to hot rolling.
In order to prove segregation as a potential cause for the population of large precipitates in thegrade 0.025Nb980, Scheil-Guliver calculations were carried out using the Scheil module of Thermo-Calc c© TCFE6 [165] [173]. The mass fraction of niobium in the liquid and solid phase as a functionof the mass fraction of solid is shown in Figure 5.17. The niobium content in the liquid and thesolid phase grows exponentially with the mass fraction of solid, and the liquid phase contains morethan four times as much niobium than the solid phase throughout solidification. Thus, niobiumstrongly segregates with a tendency to remain in the liquid phase. Segregation is not significantlyreduced during reheating, so it must be expected that NbC is not dissolved in the inter-dendriticregions during reheating, even with the high niobium content in grade 0.025Nb980.
The fine particles observed in all grades are a result of precipitation during hot rolling andthe slow cooling from the coiling temperature. The almost unchanged fraction of precipitates(Figure 4.25) during the annealing of the cold-rolled material is in agreement with an expected

5.2. INFLUENCE OF ALLOYING ELEMENTS ON TBF/Q&P SHEET STEEL 103
Figure 5.17: Niobium dissolved in the liquid and solid phase as a function of mass fraction of solidof the grade 0.025Nb980 according to the Scheil module of Thermo-Calc c© allowing interstitialback-diffusion, i.e. interstitial atoms are allowed to redistribute in the solid phase according tothermodynamic equilibrium [173].
minor Ostwald ripening due to the low niobium content in solid solution and the low diffusivity ofniobium at the low annealing temperature and short time interval.
Niobium generally refines the microstructure [173, 182, 183] (Table 4.1). There is no significantfurther grain refinement for the steel grades containing more than 0.025mass% Nb. As can beconcluded from Table 4.2, the addition of more than 0.025mass% niobium does not result inthe formation of a larger amount of finer precipitates (Table 4.1), which would contribute to afurther grain refinement and possible precipitation strengthening. Instead, a further increase inniobium content leads to higher amounts of large precipitates, which do not change the surroundingmicrostructure.
As a result of grain refinement through niobium, more nucleation sites (preferably triple pointsof primary austenite grains) are available and lead to the accelerated pro-eutectoid ferrite andupper bainite formation of the niobium grades as opposed to the reference material (Figure 4.26a).This effect has been reported previously for microalloyed DP and conventional TRIP steels byPichler et al. [107]. The quite similar transformation behaviour of niobium variants during cooling(Figure 4.26a) and overaging (Figure 4.26b) is most likely related to their similar prior austenitegrain size as opposed to the niobium-free reference material.
Furthermore, the final bainitic matrix mainly comprises globular bainite as opposed to the lath-like bainite of the reference material [173] (Figure 4.22 and 4.23). This finding was confirmed bymeans of scanning low energy electron microscopy and electron backscatter diffraction [182, 183].A similar observation for an addition of 0.02-0.05mass% Nb to a 0.2% C-1.5% Si-1.5% Mn TRIP-assisted bainitic steel was reported by Sugimoto et al. [26]. One possible explanation for theobserved change in bainite morphology due to niobium addition from lath-like to globular bainitecan be attributed to the pre-isothermal transformation products. Formation of ferrite and upperbainite upon cooling to IBT can cause differences in carbon distribution within the remainingaustenite grains. This locally increased carbon content may influence both the bainite formationand morphology during the IBT. To clarify the validity of this explanation, counterpart experimentswere conducted with the reference material without ferrite and the niobium alloyed material withpro-eutectoid ferrite. For this purpose, the reference material was cooled to overaging temperature

104 CHAPTER 5. DISCUSSION
with a cooling rate of 30K/s, forcing the formation of ferrite, and the niobium alloyed grade wasquenched to overaging temperature with a cooling rate of 80K/s, preventing ferrite formation. Thebainite and retained austenite morphology are the same, regardless of ferrite formation. Therefore,the change in bainite and retained austenite morphology is a consequence of grain refinement, NbCprecipitation or niobium in solid solution. In a work reported by Bleck et al. [168], it is arguedthat NbC preferably precipitates at the austenite grain boundaries, which influences the nucleationkinetics of bainite formation. In turn, bainite morphology can be affected by the change in nucleationkinetics.
The influence of niobium addition on bainite formation is accompanied by a markedly reducedcementite formation. This in turn results in a remarkably increased retained austenite fraction(Figure 4.27). The exact reason for these morphology changes and the decrease in the amountof precipitated cementite triggered by niobium addition remains unclear at present and requiresfurther investigation.
The tensile strength of multiphase steel grades can be estimated by applying the rule of mixturegiven in Equation 2.9. Based on this relationship, the decreasing tensile strength with increasingoveraging time (Figure 4.28) can be explained by the increasing fraction of bainite and the de-creasing amount of martensite formed during final cooling to room temperature. Furthermore, thealmost constant values for the tensile strength for overaging times larger than 200 s are in excellentagreement with the dilatometer measurements (Figure 4.26b), which show that the bainite forma-tion saturates. The same argument holds true for the decreasing yield strength at short overagingtimes. For longer overaging times, a distinctive increase of the yield strength is observed. Thisbehaviour is typical for conventional TRIP steel grades [184] and can be explained as follows: Inparticular for DP steel grades with hard martensite as an inclusion in a soft ferritic matrix, a lowyield ratio as a result of high local stress at ferrite/martensite phase boundaries is well known. Forthe material in the present investigation, short overaging times result in a considerable amount ofmartensite formed during final cooling and therefore the observation of low yield strength is reason-able. Increasing overaging time increases the stability of the austenite and decreases the amount ofmartensite formed during final cooling. This in turn decreases the impact of the local stresses andtherefore an increase in yield strength is observed. Moreover, an increase in the amount of bainiteduring overaging also contributes to the increase in yield strength.
The addition of niobium and the subsequent NbC precipitation are well known for enhancing thetensile strength resulting from precipitation strengthening and grain refinement [87, 106, 107, 168–170]. This is in apparent contradiction to the present results which clearly show a decrease instrength resulting from the addition of niobium (Figure 4.28a). For the present material, an increasein strength resulting from precipitation hardening and a lower grain size is also expected. However,the replacement of harder fine lath-like bainite by softer pro-eutectoid ferrite/upper bainite andthe more globular bainitic matrix as a consequence of the niobium addition result in a decrease ofstrength.
Prolonged overaging times lead to an increase in the bainite fraction and therefore to enhancedcarbon partitioning and austenite stabilization (Figure 4.27a). However, in particular at temper-atures of 450 C and higher, carbon intended for partitioning begins to precipitate after certainoveraging times, thus resulting in a strong decrease in the amount of retained austenite. In thiscase, time and temperature are interchangeable, which results in accelerated partitioning and pre-cipitation at higher temperatures (Figure 4.30). The increase in uniform and total elongation withprolonged overaging times (Figure 4.28b) can likewise be attributed to the stabilization of retainedaustenite due to carbon enrichment as the bainite transformation proceeds. The reduced strain-induced martensite formation at low strain levels results equivalently to conventional TRIP steels inan increasing work hardening at high strain levels (Figure 4.29) and thereby in increasing elongationvalues (Figure 4.28b).
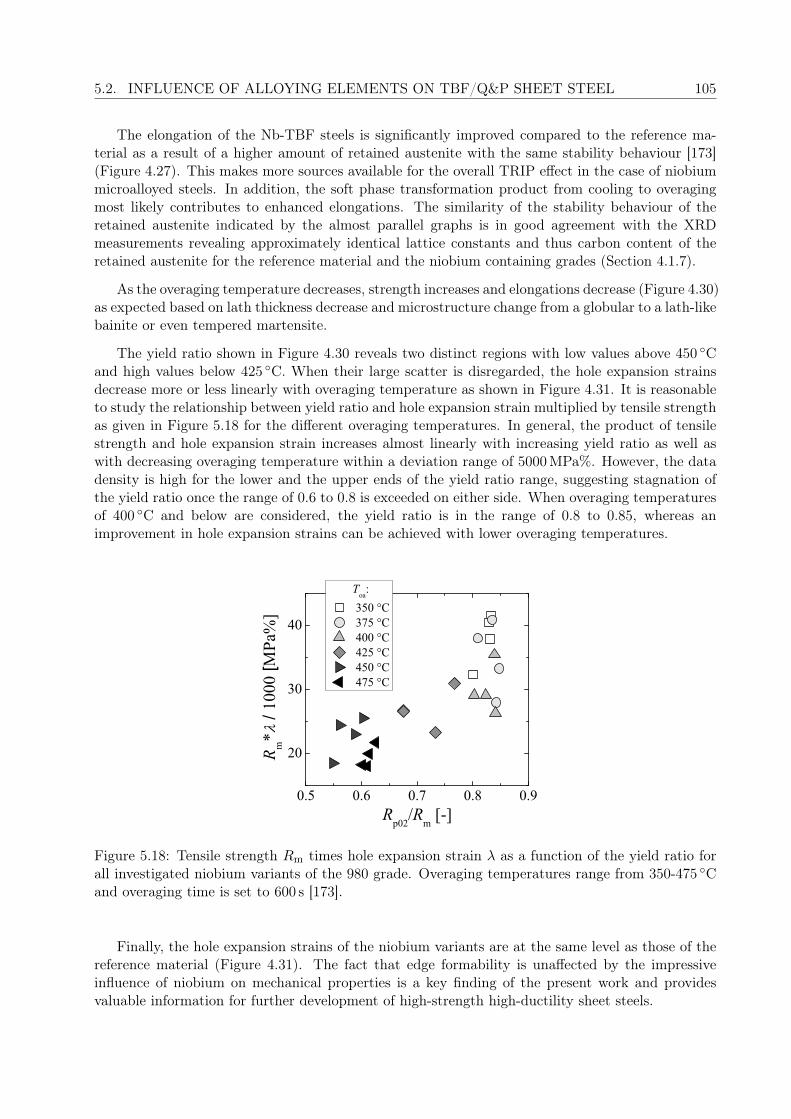
5.2. INFLUENCE OF ALLOYING ELEMENTS ON TBF/Q&P SHEET STEEL 105
The elongation of the Nb-TBF steels is significantly improved compared to the reference ma-terial as a result of a higher amount of retained austenite with the same stability behaviour [173](Figure 4.27). This makes more sources available for the overall TRIP effect in the case of niobiummicroalloyed steels. In addition, the soft phase transformation product from cooling to overagingmost likely contributes to enhanced elongations. The similarity of the stability behaviour of theretained austenite indicated by the almost parallel graphs is in good agreement with the XRDmeasurements revealing approximately identical lattice constants and thus carbon content of theretained austenite for the reference material and the niobium containing grades (Section 4.1.7).
As the overaging temperature decreases, strength increases and elongations decrease (Figure 4.30)as expected based on lath thickness decrease and microstructure change from a globular to a lath-likebainite or even tempered martensite.
The yield ratio shown in Figure 4.30 reveals two distinct regions with low values above 450 Cand high values below 425 C. When their large scatter is disregarded, the hole expansion strainsdecrease more or less linearly with overaging temperature as shown in Figure 4.31. It is reasonableto study the relationship between yield ratio and hole expansion strain multiplied by tensile strengthas given in Figure 5.18 for the different overaging temperatures. In general, the product of tensilestrength and hole expansion strain increases almost linearly with increasing yield ratio as well aswith decreasing overaging temperature within a deviation range of 5000MPa%. However, the datadensity is high for the lower and the upper ends of the yield ratio range, suggesting stagnation ofthe yield ratio once the range of 0.6 to 0.8 is exceeded on either side. When overaging temperaturesof 400 C and below are considered, the yield ratio is in the range of 0.8 to 0.85, whereas animprovement in hole expansion strains can be achieved with lower overaging temperatures.
0.5 0.6 0.7 0.8 0.9
20
30
40
Toa
: 350 °C 375 °C 400 °C 425 °C 450 °C 475 °C
R m*
/ 10
00 [M
Pa%
]
Rp02
/Rm [-]
Figure 5.18: Tensile strength Rm times hole expansion strain λ as a function of the yield ratio forall investigated niobium variants of the 980 grade. Overaging temperatures range from 350-475 Cand overaging time is set to 600 s [173].
Finally, the hole expansion strains of the niobium variants are at the same level as those of thereference material (Figure 4.31). The fact that edge formability is unaffected by the impressiveinfluence of niobium on mechanical properties is a key finding of the present work and providesvaluable information for further development of high-strength high-ductility sheet steels.

106 CHAPTER 5. DISCUSSION
Niobium in the 1180 grade
In contrast to the 980 grade, the response of the 1180 grade to niobium additions is in good agree-ment with literature [87, 100, 106, 107, 168–170]. The tensile strength of the 980 grade decreaseswhen soft phases such as ferrite and (upper) bainite are introduced because the grain refinementcaused by niobium additions leads to significant acceleration during continuous cooling to the over-aging step (Figure 4.26a). The additional carbon, manganese, and silicon in the 1180 grade, on theother hand, suffice to prevent this transformation acceleration (Figure 4.32a), so that the additionof niobium to the 1180 grade base composition does not result in the formation of pro-eutectoidferrite and (upper) bainite during cooling as opposed to the 980 grade. Therefore, the microstruc-tures of the niobium variants as well as the reference material of the 1180 grade is composed ofisothermal transformation product, i.e. bainite, and retained austenite (Figure 4.33). This resultsin higher tensile strength of the niobium variants compared to the niobium-free reference materialof the 1180 grade. Since the niobium grain refinement results in a more globular microstructure,irrespective of the base composition, the drop in tensile strength in the 980 grade caused by nio-bium additions must be related to the introduction of the softer phases during cooling to overagingtemperature.
Within a range of 0.02-0.09mass% niobium, the exact amount of niobium plays a minor role inboth the 980 and 1180 grade when compared to the presence of niobium as part of the compositionin the first place. When the mechanical properties and the amount of retained austenite of the1180 grade are compared at different overaging temperatures (Figure 4.34b), the yield strength anduniform elongation of the niobium variants and the reference material show similar behaviour formost overaging time and temperature combinations, whereas the tensile strength of all niobiumvariants persistently lies above the tensile strength of the reference material. Thus, the influence ofniobium additions on mechanical properties is independent of overaging temperature.
Consequently, the 1180 grade benefits from a significant increase in tensile strength causedby precipitation strengthening and grain refinement and without changing other properties of thesteel. The product of tensile strength and total elongation as a function of yield ratio as givenin Figure 5.19 assesses the steels potential with respect to strength, elongations, and yielding. Atlow overaging temperatures the product of tensile strength and total elongation of the 1180 gradeis particularly sensitive to niobium additions. It decreases, while the yield ratio increases withincreasing niobium content. It is important to note, that on average the yield ratio decreases withan increase in the product of tensile strength and total elongation. At 475 C the yield ratio isdrastically impaired by the addition of niobium for comparable values of tensile strength multipliedby total elongation. Overaging temperatures in this range, however, are not considered for industrialproduction because very low hole expansion values arising from a large fraction of fresh martensitein the microstructure are expected, as the low yield ratios suggest. The fact that an increase inthe product of tensile strength multiplied by total elongation correlates with a decrease in yieldratio demonstrates that a material with higher combinations of strength and elongations has to becarefully evaluated, especially if a yield strength requirement has to be met. This finding is mostlikely a result of additional inhomogeneities in the hardness of the microstructure components ofthe matrix presumably introduced by changes in the amount of retained austenite. In addition, holeexpansion strain can be negatively affected by a lower yield strength for the same tensile strengthlevel. While higher amounts of retained austenite can increase the product of tensile strengthand total elongation, they introduce greater hardness differences between the softer untransformedretained austenite and the harder bainitic and/or martensitic matrix. This can decrease yieldstrength and hole expansion strain.
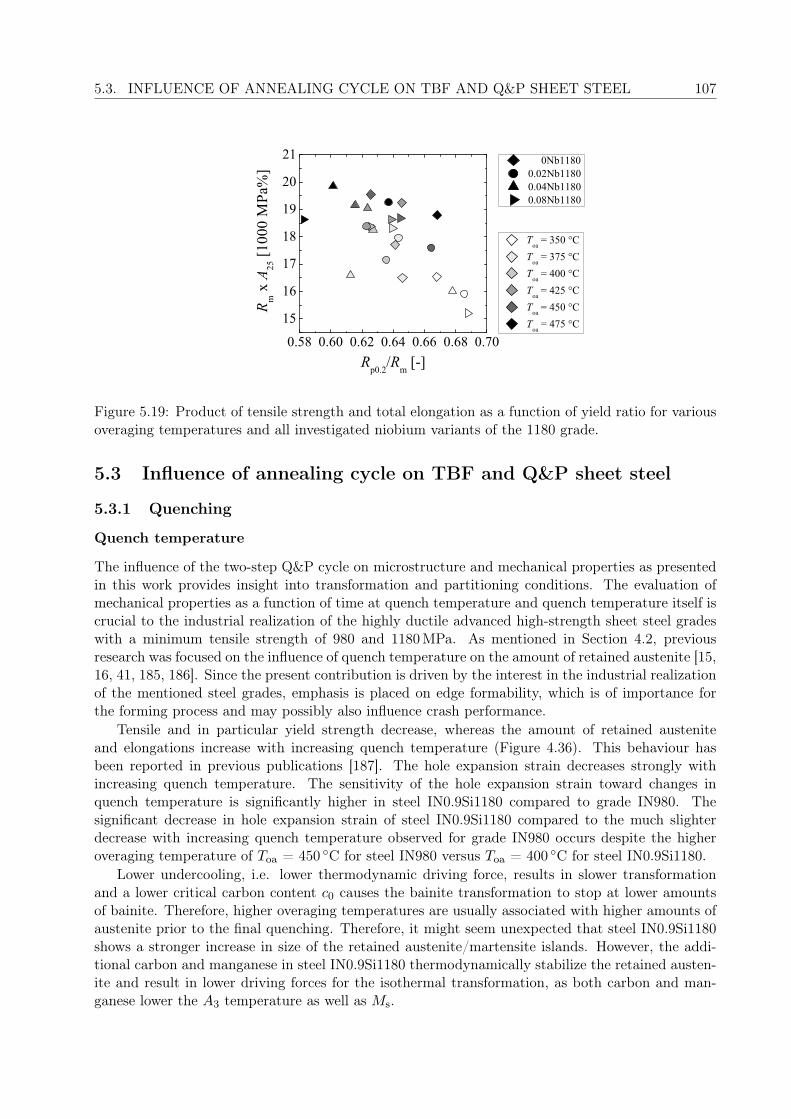
5.3. INFLUENCE OF ANNEALING CYCLE ON TBF AND Q&P SHEET STEEL 107
0.58 0.60 0.62 0.64 0.66 0.68 0.70
15
16
17
18
19
20
21
Toa
= 350 °C T
oa = 375 °C
Toa
= 400 °C T
oa = 425 °C
Toa
= 450 °C T
oa = 475 °C
0Nb1180 0.02Nb1180 0.04Nb1180 0.08Nb1180
R m x
A25
[100
0 M
Pa%
]
Rp0.2/Rm [-]
Figure 5.19: Product of tensile strength and total elongation as a function of yield ratio for variousoveraging temperatures and all investigated niobium variants of the 1180 grade.
5.3 Influence of annealing cycle on TBF and Q&P sheet steel
5.3.1 Quenching
Quench temperature
The influence of the two-step Q&P cycle on microstructure and mechanical properties as presentedin this work provides insight into transformation and partitioning conditions. The evaluation ofmechanical properties as a function of time at quench temperature and quench temperature itself iscrucial to the industrial realization of the highly ductile advanced high-strength sheet steel gradeswith a minimum tensile strength of 980 and 1180MPa. As mentioned in Section 4.2, previousresearch was focused on the influence of quench temperature on the amount of retained austenite [15,16, 41, 185, 186]. Since the present contribution is driven by the interest in the industrial realizationof the mentioned steel grades, emphasis is placed on edge formability, which is of importance forthe forming process and may possibly also influence crash performance.
Tensile and in particular yield strength decrease, whereas the amount of retained austeniteand elongations increase with increasing quench temperature (Figure 4.36). This behaviour hasbeen reported in previous publications [187]. The hole expansion strain decreases strongly withincreasing quench temperature. The sensitivity of the hole expansion strain toward changes inquench temperature is significantly higher in steel IN0.9Si1180 compared to grade IN980. Thesignificant decrease in hole expansion strain of steel IN0.9Si1180 compared to the much slighterdecrease with increasing quench temperature observed for grade IN980 occurs despite the higheroveraging temperature of Toa = 450 C for steel IN980 versus Toa = 400 C for steel IN0.9Si1180.
Lower undercooling, i.e. lower thermodynamic driving force, results in slower transformationand a lower critical carbon content c0 causes the bainite transformation to stop at lower amountsof bainite. Therefore, higher overaging temperatures are usually associated with higher amounts ofaustenite prior to the final quenching. Therefore, it might seem unexpected that steel IN0.9Si1180shows a stronger increase in size of the retained austenite/martensite islands. However, the addi-tional carbon and manganese in steel IN0.9Si1180 thermodynamically stabilize the retained austen-ite and result in lower driving forces for the isothermal transformation, as both carbon and man-ganese lower the A3 temperature as well as Ms.

108 CHAPTER 5. DISCUSSION
Since the retained austenite/martensite islands are larger in steel IN0.9Si1180 and the amountof retained austenite is approximately the same in both steel grades, steel IN0.9Si1180 comprisesa higher amount of fresh martensite as opposed to grade IN980. The higher strength level of thematrix of steel IN0.9Si1180 compared to grade IN980 is expected to decrease the hardness differencebetween matrix and inclusions. Nonetheless, the additional fresh martensite might be the cause ofthe deteriorated hole expansion properties for higher quench temperatures in grade IN0.9Si1180,since it can promote decohesion between inclusions and matrix.
In contrast to the significant changes in hole expansion strain in particular of steel IN0.9Si1180,tensile strength and elongations show very low sensitivity to quench temperature variations in therange of Tq = 280 C to Tq = 340 C. This behaviour is in good agreement with the similar matrixof the microstructures for the different quench temperatures (Figure 4.35). A possible reason forthe low differences in tensile strength and elongations is the enhanced tempering resistance as aresult of the chromium additions of 0.3mass% is present in both steel grades.
The extraordinarily high hole expansion strain of steel IN0.9Si1180 for a quench temperature ofTq = 280 C is in good agreement with the strain-hardening behaviour of CP steel, when comparedto a quench temperature of Tq = 340 C and grade IN980 at both quench temperatures (Figure 4.36,4.37, and 4.38). The high yield strength, the low strain-hardening rates in particular at higherstrains, and a low plateau of the differential n-value for the quench temperature of Tq = 280 Cis characteristic for a CP-type strain-hardening behaviour. The microstructure of this grade iscomprised of small round finely dispersed retained austenite islands embedded in a network of par-ticularly fine and short laths (Figure 4.35d). Contrastingly, the DP-like strain-hardening behaviourof steel IN0.9Si1180 at a quench temperature of Tq = 340 C and grade IN980 at quench temper-atures of Tq = 280 C and Tq = 340 C is characterized by higher strain-hardening rates at higherstrains, lower initial strain-hardening rates, and in particular high differential n-values at higherstrains.
The difference between fracture strength and tensile strength correlates with the degree of neck-ing and provides a rough estimate of a sheet steel’s toughness. In principle, the greater the dropin strength from tensile to fracture strength, the higher the degree of necking and the greater theresistance against microcrack propagation. Steel IN0.9Si1180 and in particular steel IN980 bothexhibit a higher difference between tensile strength and fracture strength for the lower quench tem-perature of Tq = 280 C compared to the higher quench temperature of Tq = 340 C (Figure 4.37).The lower quench temperature is expected to promote resistance against microcrack propagation inboth steels.
Time at quench temperature
A slight increase in tensile strength, a significant increase in yield strength as well as hole expansionstrain with increasing time at quench temperature was observed in steel IN980 (Figure 4.40). Thelower the quench temperature, the higher the amount of transformed fraction during quenching.If quenched at a rate above the critical cooling rate, only martensite forms before the quenchtemperature is reached. This martensite can serve as a nucleation site for bainite formation atquench and overaging temperature. A higher amount of transformed fraction during quenching alsoresults in less fresh martensite formation during the final cooling.
As time at quench temperature proceeds, bainite transformation progresses and more carbonprecipitates within and between the bainite laths in the form of finely dispersed cementite particles(Figure 4.39). Interstitial carbon increases the strength of the matrix through enhanced distortionof the bainitic or martensitic matrix. Therefore, the loss in solid solution strengthening through thereduced amount of interstitial carbon as a consequence of annealing should result in lower yield andtensile strength. In addition, finely dispersed precipitates contribute to precipitation strengthening.
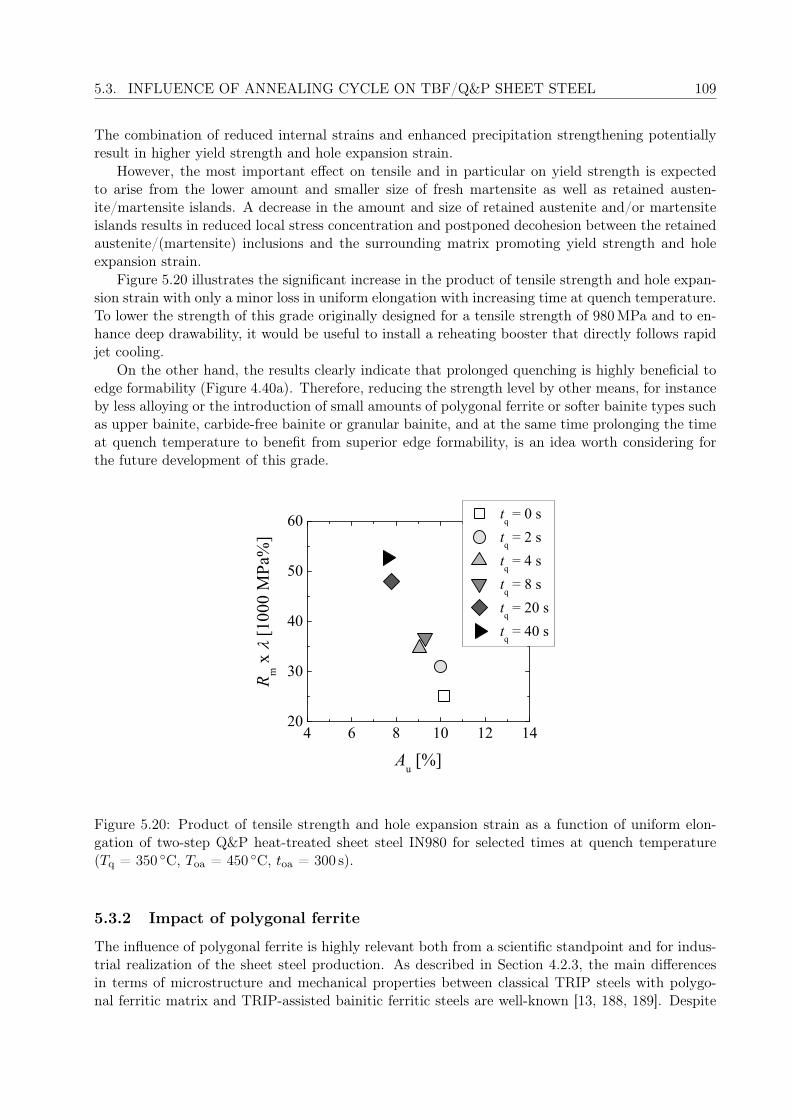
5.3. INFLUENCE OF ANNEALING CYCLE ON TBF/Q&P SHEET STEEL 109
The combination of reduced internal strains and enhanced precipitation strengthening potentiallyresult in higher yield strength and hole expansion strain.
However, the most important effect on tensile and in particular on yield strength is expectedto arise from the lower amount and smaller size of fresh martensite as well as retained austen-ite/martensite islands. A decrease in the amount and size of retained austenite and/or martensiteislands results in reduced local stress concentration and postponed decohesion between the retainedaustenite/(martensite) inclusions and the surrounding matrix promoting yield strength and holeexpansion strain.
Figure 5.20 illustrates the significant increase in the product of tensile strength and hole expan-sion strain with only a minor loss in uniform elongation with increasing time at quench temperature.To lower the strength of this grade originally designed for a tensile strength of 980MPa and to en-hance deep drawability, it would be useful to install a reheating booster that directly follows rapidjet cooling.
On the other hand, the results clearly indicate that prolonged quenching is highly beneficial toedge formability (Figure 4.40a). Therefore, reducing the strength level by other means, for instanceby less alloying or the introduction of small amounts of polygonal ferrite or softer bainite types suchas upper bainite, carbide-free bainite or granular bainite, and at the same time prolonging the timeat quench temperature to benefit from superior edge formability, is an idea worth considering forthe future development of this grade.
4 6 8 10 12 1420
30
40
50
60
R m x
[1
000
MPa
%]
Au [%]
tq = 0 s
tq = 2 s
tq = 4 s
tq = 8 s
tq = 20 s
tq = 40 s
Figure 5.20: Product of tensile strength and hole expansion strain as a function of uniform elon-gation of two-step Q&P heat-treated sheet steel IN980 for selected times at quench temperature(Tq = 350 C, Toa = 450 C, toa = 300 s).
5.3.2 Impact of polygonal ferrite
The influence of polygonal ferrite is highly relevant both from a scientific standpoint and for indus-trial realization of the sheet steel production. As described in Section 4.2.3, the main differencesin terms of microstructure and mechanical properties between classical TRIP steels with polygo-nal ferritic matrix and TRIP-assisted bainitic ferritic steels are well-known [13, 188, 189]. Despite

110 CHAPTER 5. DISCUSSION
its importance, the influence of small amounts of polygonal ferrite in the microstructure has notbeen documented in the literature to date. The results of this section help to estimate how devia-tions from the annealing cycle such as changes in cooling rate or annealing temperature affect theperformance of the sheet steel.
The results presented in Section 4.2.3 suggest that the effect of polygonal ferrite depends on thespecific shape and location of the ferrite. A key conclusion of the present investigation, therefore,is that the influence of polygonal ferrite on hole expansion strain depends on the way the ferrite isproduced. If polygonal ferrite is induced via an additional intermediate holding step, small holdingtimes will result in the formation of small amounts of polygonal ferrite and a considerable dropin hole expansion strain, e.g. 10% of polygonal ferrite are accompanied by a relative drop in holeexpansion strain of 20% (Figure 4.41 and 4.42).
Higher intermediate holding temperatures are even more detrimental to hole expansion strain.This is most probably due to the fact that the higher intermediate holding temperature of 625 Cresults in faster diffusion, in particular carbon diffusion, outranging the lower thermodynamic driv-ing force compared to lower overaging temperatures. However, since not much more polygonalferrite appears in the microstructures of Tf = 625 C compared to Tf = 575 C, the reason for higherhole expansion strain at the lower holding temperature is most likely related to the fact that thehardness difference between the ferrite formed at lower holding temperatures and the rest of themicrostructure is lower as compared to higher overaging temperatures.
In contrast to intermediate holding, small amounts of ferrite induced by means of intercriticalannealing do not result in reduced hole expansion strains (Figure 4.43 and 4.44). Down to anannealing temperature of Tan = 810 C, which is clearly below austenitizing temperature A3, yieldand tensile strength decrease with annealing temperature to the same extent, so that hole expan-sion strain remains unaffected, even though considerable amounts of polygonal ferrite are clearlypresent (Figure 4.43d and 4.43e). This is an important finding, since it is now possible to lower theannealing temperature even slightly below A3 without compromising edge crack resistance. It evenenables to lower the tensile strength and increase elongations, thereby enhancing formability, whilstmaintaining highly favourable edge formability. This is particularly valuable for the 980 grade, as itshows rather high tensile strength. In addition, production economy benefits from lower annealingtemperatures, contributing to higher cost efficiency.
Below Tan = 810 C the hole expansion strongly decreases in a sigmoidal manner with decreas-ing annealing temperature just like it does with increasing intermediate holding time. The onsetof decreasing hole expansion strain might be related to the formation of polygonal ferritic bands,presumably in combination with larger retained austenite/martensite islands embedded in largeregions of pure polygonal ferrite. Carbide banding is already present at higher annealing temper-atures such as Tan = 820 C and Tan = 810 C and also slightly in the fully austenitized referencematerial of Tan = 900 C. However, the mixture of the polygonal ferritic and the bainitic matrixis fairly homogeneous until polygonal ferrite bands form at an annealing temperature of 800 Cand below. These ferrite bands also contain larger retained austenite/martensite islands than the(bainitic) ferritic matrix of higher annealing temperatures.
5.4 Failure mechanisms
Figure 4.45 suggests that the void density up to uniform elongation is negligible compared to the voiddensity found in the post-uniform strained sample area. Based on the approach of geometricallynecessary dislocations, the local stress on a particle interface increases with the square root ofdecreasing particle radius (Equation 2.23). Hence, the required applied strain for void nucleation ishigher for particles with larger particle radius. However, Figure 4.45 shows that void nucleation in
5.4. FAILURE MECHANISMS 111
all investigated steels occurs at approximately the same thickness strain of around 25%. Thus, theeffect of changes in the particle radius described by Equation 2.23 is negligible. Void formation in thissteel can be described more precisely by the approach of continuum mechanics formulated by Argonet al., since in their model the maximum stress at the inclusion/matrix interface is independent ofthe particle radius [128, 145, 190, 191]. A possible explanation of the radius independent nucleationbehaviour is the equivalent nucleation of voids in all investigated steels due to impurity inclusionssuch as oxides. Large and/or brittle inclusions can break during cold rolling or exhibit very low orno adhesion forces between particle and matrix.
Subsequent to the observed simultaneous initial void nucleation, the void densities are signifi-cantly higher for steels that were held at higher overaging temperatures. This is in good agreementwith the expected enhanced void nucleation in the steels with more pronounced hardness differencebetween matrix and inclusions.
Equation 2.27 suggests that the void radius increases exponentially with applied strain. Fig-ure 4.46 shows, however, that the average equivalent circle diameter increases approximately linearlywith increasing strain. In addition, the void sizes of the various steels are very similar. These ob-servations can both be attributed to the diverging void populations within the different steels. Thehigher void nucleation rate of the steels held at higher overaging temperatures appear to balance outthe larger size of the initial voids. Maire et al. observed quasi-stagnation of the average equivalentcavity diameter in DP steels and developed a model which accounts for this behaviour [192]. Thequasi-stagnation of the average equivalent cavity diameter in DP steels was shown to be due to thecompetition between the growth of existing cavities and the nucleation of smaller new ones [192].
The pronounced difference in void density versus the similar average void sizes confirms thatvoid nucleation is strongly dependent on the microstructure, while the character of void growthwithin different microstructures is very similar with respect to growth velocity. The fact that thevoid density increases exponentially with decreasing distance to the fracture surface or increasingapplied strain (Figure 4.45), furthermore, results in an exponentially increasing volume fraction ofvoids with applied strain. Thus, given the critical condition for void coalescence of Equation 2.28,the factor of the mean stress for the initiation of internal necking decays exponentially with linearlyincreasing applied stress.
The observation of the fracture surface of tensile tested samples confirms the results of thequantitative void formation (Figure 4.48). When the fracture surface of the tensile tested steels iscompared with different base composition exposed to the same heat treatment, the dimples of the1180 grade with 0.2mass% carbon and 0.8mass% silicon are more distorted and flatter than thoseof the 980 grade with 0.17mass% carbon and 0.7mass% silicon. This indicates that higher localstresses and in particular higher shear stresses were present before void coalescence in the 1180 gradewith the higher carbon content compared to the 980 grade. This is in good agreement with thegreater strain-hardening potential of the 1180 grade indicated by the significantly higher differencebetween yield and tensile strength resulting in higher tensile strength as well as elongation.
Steel 2.6Mn1180, held at a lower overaging temperature of 400 C, clearly shows a high amountof dimples and only one population of the dimple sizes in the form of a log-normal distribution (Fig-ure 4.48). In contrast, the lower overaging temperature of 350 C results in numerous particularlysmall dimples arising from voids formed at low tensile strains and a second population of very largedimples originating from voids formed at the early stages of the plastic deformation process. Thus,it can be concluded that the nucleation of the first voids, which grow to large dimples on the fracturesurface, occurs at a similar strain level. Therefore, the first voids form most likely independently ofthe microstructure as a result of brittle impurity inclusions such as oxides. The second populationof dimples of the steel that was held at the lower overaging temperature of 350 C exhibits a smallersize compared to the average dimple size of the steel held at 400 C. Assuming a similar void growthrate in both steels, this indicates that the nucleation of the smaller voids occurred at higher strains.

112 CHAPTER 5. DISCUSSION
Thus, the nucleation of voids as a result of the microstructure is postponed in the steel with amatrix of higher strength and therefore lower hardness difference between matrix and inclusion.
5.5 Industrial trials on 1180 MPa Q&P sheet steel
The microstructure of steel IN1.5Si1180 comprises significant amounts of polygonal ferrite (Sec-tion 4.4). As seen in Figure 4.50, for a cooling rate of 30K/s no transformation takes place priorto Ms in IN1.5Si1180, if the steel was fully austenitized at 900 C (Figure 4.50b). The actualcooling rate used for the industrial trials was even faster than that, i.e. 40K/s. In addition, theAc3 temperature of IN1.5Si1180 is even greater than 900 C for the investigated heating rate of25K/s (Figure 4.50a). Therefore, it can be concluded that the applied annealing temperature ofTan = 850 C results in intercritical annealing rather than full austenitization for IN1.5Si1180 as op-posed to IN0.9Si1180. Thus, the polygonal ferrite found in IN1.5Si1180 is predominantly a result ofintercritical annealing. In addition, the intercritically formed polygonal ferrite may serve as nucle-ation site for the formation of pro-eutectoid ferrite during cooling between annealing and overagingtemperature. Therefore, the presence of small amounts of pro-eutectoid ferrite in IN1.5Si1180 isalso possible.
Transformation kinetics during overaging shown in Figure 4.51 suggests that the indirect austen-ite stabilizing effect through the prevention of carbon precipitation by additional silicon in IN1.5Si1180is more pronounced than the austenite stabilization through the higher chromium content of IN0.9Si1180.This is especially interesting when considering the deceleration of isothermal phase transformationsby chromium additions, which leads to a lower final amount of isothermal transformation productin particular for higher overaging temperatures, as demonstrated in Figure 4.13 and 4.16.
In the investigated range of process parameters, i.e. Tan = 850 C, Toa = 380 C, and toa ≈ 460 s,IN1.5Si1180 appears slightly more DP-like due to its higher total elongation compared to IN0.9Si1180(Figure 4.52, Figure 4.53, and Figure 5.21). It is, therefore, the preferable grade for applica-tions requiring high deep drawability. Interestingly, the advantage of 1% total elongation ofIN0.9Si1180 in combination with hardly any difference in uniform elongation at the top end com-pared to IN1.5Si1180 indicates that post-uniform deformation of IN0.9Si1180 is superior to that ofIN1.5Si1180 (Figure 4.52). The enhanced elongations are, on one hand, most probably a consequenceof the strong austenite stabilizing effect of the high silicon in IN1.5Si1180 (Figure 4.51). On the otherhand, the polygonal ferrite found in the this grade (Figure 4.49) presumably largely contributes toa softening of the matrix. It appears small enough and well embedded in the bainitic/(tempered)martensitic surrounding microstructure to circumvent negative impact on edge crack resistance.This is in good agreement with the positive effects of small amounts of ferrite on the product oftensile strength and elongation in combination with little loss in hole expansion strain, in particularif they arise from intercritical annealing, as described in Section 4.2.3.
By contrast, higher hole expansion strains of well above 50% are achieved with IN0.9Si1180than with IN1.5Si1180, indicating improved edge formability preferable for car components withhigh forming radii and enhanced crash performance. The fact that, for an overaging temperatureof Toa = 380 C the decrease in hole expansion strain with increasing total elongation is not verypronounced, is evidence for highly favourable combinations of deep drawability and edge crackresistance of IN0.9Si1180. However, Figure 4.52 suggests that IN1.5Si1180 may possibly enable thesame or even higher hole expansion strains if lower quench temperatures were applied.
Figure 5.21 shows hole expansion strain as a function of total elongation, each multiplied bytensile strength. This figure clearly illustrates that the high hole expansion strains of IN0.9Si1180are accompanied by high tensile strength levels, which exceed the requirement of 1180MPa by 50to 100MPa (Figure 4.53). It could be interesting for future developments to reduce the strength
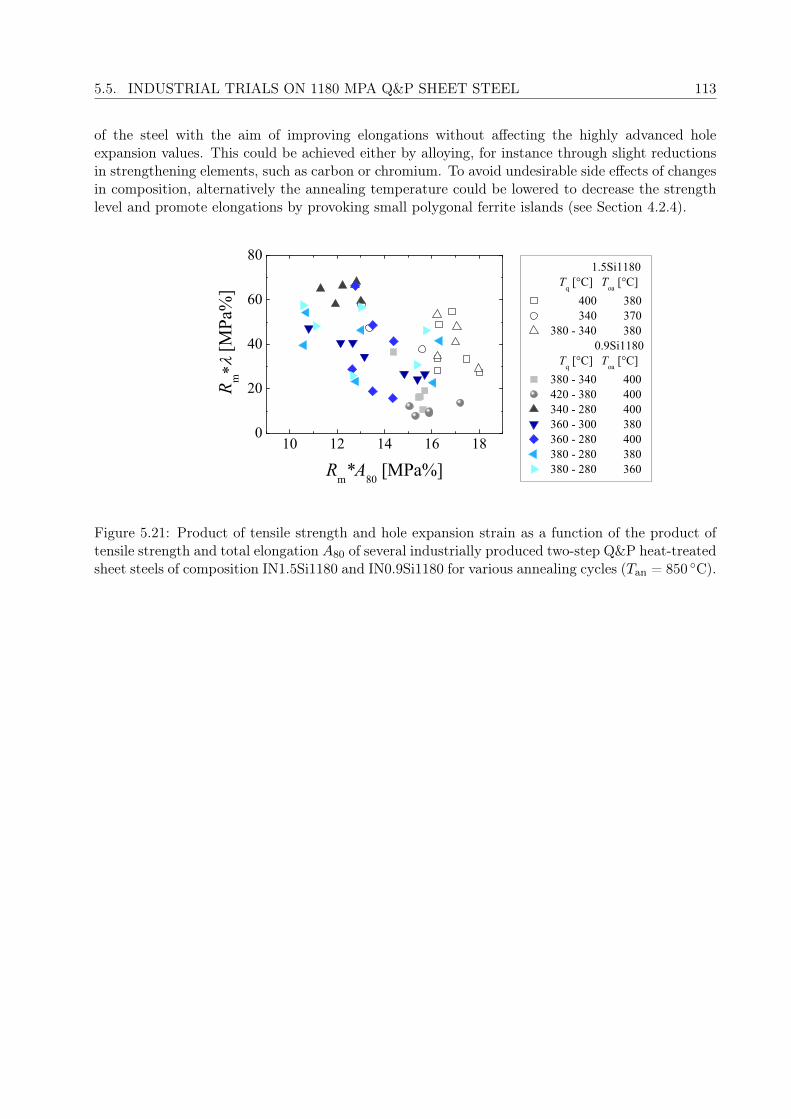
5.5. INDUSTRIAL TRIALS ON 1180 MPA Q&P SHEET STEEL 113
of the steel with the aim of improving elongations without affecting the highly advanced holeexpansion values. This could be achieved either by alloying, for instance through slight reductionsin strengthening elements, such as carbon or chromium. To avoid undesirable side effects of changesin composition, alternatively the annealing temperature could be lowered to decrease the strengthlevel and promote elongations by provoking small polygonal ferrite islands (see Section 4.2.4).
10 12 14 16 180
20
40
60
80 1.5Si1180 T
q [°C] T
oa [°C]
400 380 340 370 380 - 340 380
0.9Si1180 T
q [°C] T
oa [°C]
380 - 340 400 420 - 380 400 340 - 280 400 360 - 300 380 360 - 280 400 380 - 280 380 380 - 280 360
R m
[MPa
%]
Rm*A80 [MPa%]
Figure 5.21: Product of tensile strength and hole expansion strain as a function of the product oftensile strength and total elongation A80 of several industrially produced two-step Q&P heat-treatedsheet steels of composition IN1.5Si1180 and IN0.9Si1180 for various annealing cycles (Tan = 850 C).

114 CHAPTER 5. DISCUSSION

Chapter 6
Summary
In the present work, TBF and Q&P steels designed for a tensile strength above 980 and 1180MPawere investigated. The influence of silicon, manganese, chromium, and niobium on phase transfor-mations, microstructure and mechanical properties of these two types of third-generation advancedhigh-strength steels was studied in detail. The reaction of TBF, one-step Q&P, and two-step Q&Psteels to variations in heat treatment was tested regarding annealing, quenching, and overaging.A newly designed 1180 grade with reduced silicon content and its predecessor were produced onthe industrial production line. The following summarizes the results and conclusions gained by theconducted investigations on TBF and Q&P sheet steel.
Silicon suppresses carbide formation, promotes the amount of retained austenite, and increasesthe elongation. Due to the higher carbon content and the significantly higher chromium content,these changes in silicon content are much less pronounced in the 1180 grade than in the 980 grade.A loss in yield and tensile strength with increasing silicon content is observed in the 980 grade andis caused by an acceleration of ferrite and bainite formation upon cooling to overaging temperature.
An analysis of transformation kinetics during overaging applying the Johnson-Mehl-Avrami-Kolmogorov approach revealed a deceleration of nucleation and growth of isothermal phase trans-formation products as a consequence of manganese additions. The bainite morphology changesfrom lath-like to slightly more globular as a result of the decelerated bainite formation. In partic-ular, the deceleration of transformation kinetics and the thermodynamic stabilization of austeniteby manganese additions increase amount of retained austenite and elongation at low overagingtemperatures, while they increase fresh martensite fraction and tensile strength at high overagingtemperatures.
According to Thermo-Calc c© calculations, chromium increases the A1 temperature, while at thesame time slightly decreasing the A3 temperature. Thus, the temperature window in which bothferrite and austenite are present in equilibrium is smaller for higher chromium contents. Chromiumsignificantly shifts the isothermal phase transformation to longer holding times resulting in larger-sized and higher amounts of retained austenite/(tempered) martensite islands. As a consequence,edge crack resistance is significantly reduced at high overaging temperatures. However, chromiumcontributes to a reduction of carbide precipitation and promotes tempering resistance. As a con-sequence of the harder matrix, edge formability can be promoted by chromium additions at lowoveraging temperatures.
The addition of niobium results in considerable grain refinement. The much smaller grain size ac-celerates diffusion-controlled phase transformations, which leads to the formation of pre-isothermaltransformation products in the 980 grade. The soft microstructure components significantly reducestrength and increase elongation. The niobium variants, furthermore, show higher amounts of re-tained austenite. The strongly reduced amount of cementite that is found in the bainite of the
115

116 CHAPTER 6. SUMMARY
niobium variants results in more carbon available for the stabilization of retained austenite. Thisleads to higher amounts of retained austenite with the same carbon content in the niobium-bearingalloys as compared to the reference material, resulting in significantly improved uniform and totalelongation. A significant change in bainite morphology from lath-like to globular induced by the ad-dition of niobium was observed. TEM analysis revealed that higher niobium contents only increasethe size of the niobium carbides, while the number of carbides remains similar. Therefore, grain size,microstructure, bainite morphology and mechanical properties remain consistent through differentniobium concentrations. As opposed to the 980 grade, strength increases with increasing niobiumcontent in the 1180 grade as a result of both grain refinement, as described by the Hall-Petch re-lation, as well as precipitation hardening arising from the niobium additions. This is because, incontrast to the 980 grade, the higher carbon and manganese content of the 1180 grade suppress theformation of soft phases upon cooling to overaging temperature.
In annealing cycle trials at quench temperatures well below Ms temperature, low sensitivityof elongation and tensile strength to variations in quench temperature was found in industriallyproduced 980 and 1180 sheet steel. On the other hand, significantly higher hole expansion strainscan be achieved with lower quench temperatures in particular for high overaging temperatures. Mostprobably the higher martensite fraction for a lower quench temperature helps to prevent large-sizedretained austenite/(tempered) martensite islands.
Prolonged holding at quench temperature of two-step Q&P sheet steel results in enhancedprecipitation of interstitial carbon, which decreases internal strains. Furthermore, higher amountsof bainite form at quench temperature and the austenite is enriched with carbon in case of longertimes of quench temperature. This leads to reduced amounts of fresh martensite formed during thefinal cooling. The present work shows that longer times at quench temperature significantly increaseyield strength, tensile strength, and in particular the hole expansion strain of Q&P steel with minorlosses in amount of retained austenite and elongation. These observations on mechanical propertiesare in agreement with the mentioned changes in phase transformations and microstructure.
The introduction of small amounts of polygonal ferrite into the matrix was investigated bymeans of intercritical annealing and intermediate holding. Lower annealing temperatures as well asprolonged holding at elevated temperatures allow to achieve significantly higher amounts of retainedaustenite as well as uniform and total elongation. Small amounts of polygonal ferrite below 10 vol.%reduce yield and tensile strength, while the effect on hole expansion strain is negligible.
Quantitative void analysis on tensile sample cross sections of TBF/Q&P sheet steel revealedan exponential increase of the void density with increasing strain in the thickness direction. Thevoid density, furthermore, increases with increasing overaging temperature. The average void size,by contrast, is independent of overaging temperature and shows an approximately linear increasewith increasing strain in the thickness direction. Investigations on size, distribution, and shape ofthe dimples on the fracture surface indicated bimodal dimple population for low overaging tem-peratures below Ms temperature, whereas the surface of the same steel held at higher overagingtemperatures showed a continuous transition between different dimple sizes of the same population.The harder matrix obtained by lower overaging temperatures possibly postpones void initiationwith the exception of small hard inclusions.
Two 1180 grades, the standard grade comprising 1.5mass% silicon and a new 1180 grade witha silicon content below 1.0mass% and significant chromium additions, were produced on the indus-trial production line. At the highest industrially feasible annealing temperature, the standard gradeshowed small amounts of polygonal ferrite arising from intercritical annealing, while the newly de-signed steel was fully austenitized. Despite comparable amounts of retained austenite before plasticdeformation, elongation is higher on average for the 1.5 Si grade for comparable tensile strengthsand hole expansion strains. While chromium significantly decelerates continuous and isothermalphase transformations, higher amounts of the additional austenite at the end of the overaging step

117
transform to martensite upon the final cooling. Furthermore, the reduced carbon mobility throughchromium additions results in enhanced tempering resistance, less carbon enrichment of the austen-ite during overaging, and lower stability of the retained austenite.
In 2013, a Japanese automobile manufacturer launched a new car production series that employsa third-generation 1180 MPa AHSS [193]. European car companies are about to adopt refined 980and 1180 TBF and Q&P sheet steels to structural car components.

118 CHAPTER 6. SUMMARY

Bibliography
[1] D. K. Matlock, J. G. Speer, Third Generation of AHSS: Microstructure Design Concepts,Springer (2009).
[2] G. Speich, V. Demarest, R. Miller, “Formation of austenite during intercritical annealing ofdual-phase steels”, Metall. Trans. A 12, 1419–1428 (1981).
[3] J. O. Sperle, H. Lundh, “Strength and crash resistance of structural members in high-strengthdual-phase steel sheet”, Scand. J. Metall. 13, 343–351 (1984).
[4] V. F. Zackay, E. R. Parker, D. Fahr, R. Busch, “The enhancement of ductility in high-strengthsteels”, Trans. Am. Soc. Met. 60, 252–259 (1967).
[5] R. G. Davies, “Edge cracking in high-strength steels”, J. Appl. Metalwork. 2, 293–299 (1983).
[6] A. A. Konieczny, “On the formability behavior of advanced high strength steels”, Steel Res.Int. 79, 47–54 (2008).
[7] T. Labudde, W. Bleck, “Formability characterisation of press hardened steels”, in: M. Olden-burg, K. Steinhoff, B. Prakash, eds., Proceedings of hot sheet metal forming of high perfor-mance steel, 127–135, Luelå, Sweden (2009).
[8] P. Larour, H. Pauli, T. Kurz, T. Hebesberger, “Influence of post uniform tensile and bendingproperties on the crash behaviour of AHSS and press-hardening steel grades”, in: IDDRG, ed.,Tools and technologies or the processing of ultrahigh strength steels, Graz, Austria (2010).
[9] J. G. Speer, E. De Moor, K. O. Findley, D. K. Matlock, B. C. De Cooman, D. V. Edmonds,“Analysis of microstructure evolution in quenching and partitioning automotive sheet steel”,Metall. Mater. Trans. A 42, 3591–3601 (2011).
[10] G. Frommeyer, U. Bruex, “Microstructures and mechanical properties of high-strength Fe-Mn-Al-C light-weight TRIPLEX steels”, Steel Res. Int. 77, 627–633 (2006).
[11] L. Bracke, K. Verbeken, L. Kestens, J. Penning, “Microstructure and texture evolution duringcold rolling and annealing of a high Mn TWIP steel”, Acta Mater. 57, 1512–1524 (2009).
[12] C. Herrera, D. Ponge, D. Raabe, “Design of a novel Mn-based 1GPa duplex stainless TRIPsteel with 60% ductility by a reduction of austenite stability”, Acta Mater. 59, 4653–4664(2011).
[13] K.-I. Sugimoto, J. Sakaguchi, T. Iida, T. Kashima, “Stretch-flangeability of a high-strengthTRIP type bainitic sheet steel”, ISIJ Int. 40, 920–926 (2000).
119

120 BIBLIOGRAPHY
[14] K.-I. Sugimoto, S. Hashimoto, Y. Mukai, “Advanced formable high and ultra high strengthTRIP-aided sheet steels”, in: TMS, ed., Int. Symp.on Niobium Microalloyed Sheet Steel forAutomotive Applications, 285–302, Araxa, Brazil (2005).
[15] E. De Moor, S. Lacroix, A. J. Clarke, J. Penning, J. G. Speer, “Effect of retained austenitestabilized via quench and partitioning on the strain hardening of martensitic steels”, Metall.Mater. Trans. A 39, 2586–2595 (2008).
[16] A. J. Clarke, J. G. Speer, M. K. Miller, R. E. Hackenberg, D. V. Edmonds, D. K. Matlock,F. C. Rizzo, K. D. Clarke, E. De Moor, “Carbon partitioning to austenite from martensite orbainite during the quench and partition (Q&P) process: A critical assessment”, Acta Mater.56, 16–22 (2008).
[17] M. Mukherjee, O. N. Mohanty, S. Hashimoto, T. Hojo, K.-I. Sugimoto, “Strain-induced trans-formation behaviour of retained austenite and tensile properties of TRIP-aided steels withdifferent matrix microstructure”, ISIJ Int. 46, 316–324 (2006).
[18] J. Kobayashi, D. Ina, N. Yoshikawa, K.-I. Sugimoto, “Effects of the addition of Cr, Mo and Nion the microstructure and retained austenite characteristics of 0.2% C–Si–Mn–Nb ultrahigh-strength TRIP-aided bainitic ferrite steels”, ISIJ Int. 52, 1894–1901 (2012).
[19] S.-J. Kim, J. G. Speer, H. S. Kim, B. C. De Cooman, “Kinetics of phase transformation duringQ&P processing”, in: AIST, ed., Int. Conf. on New Developments in AHSS, Orlando, FL, USA(2008).
[20] G. A. Thomas, J. G. Speer, D. K. Matlock, “Considerations in the application of the quenchingand partitioning concept to hot-rolled AHSS production”, Iron Steel Tech. 5, 209–217 (2008).
[21] E. De Moor, J. G. Speer, D. K. Matlock, J.-H. Kwak, S.-B. Lee, “Quenching and partitioningof CMnSi steels containing elevated manganese levels”, Steel Res. Int. 83, 322–327 (2012).
[22] K. Oi, C. Lux, G. R. Purdy, “A study of the influence of Mn and Ni on the kinetics of theproeutectoid ferrite reaction in steels”, Acta Mater. 48, 2147–2155 (2000).
[23] E. De Moor, D. K. Matlock, J. G. Speer, M. J. Merwin, “Austenite stabilization throughmanganese enrichment”, Scr. Mater. 64, 185–188 (2011).
[24] S.-J. Kim, C. G. Lee, I. Choi, S. Lee, “Effects of heat treatment and alloying elements onthe microstructures and mechanical properties of 0.15 wt. pct. C transformation-inducedplasticity-aided cold-rolled steel sheets”, Metall. Mater. Trans. A 32, 505–514 (2001).
[25] J. Pacyna, A. Jedrzejewska-Strach, M. Strach, “The effect of manganese and silicon on the ki-netics of phase transformations during tempering - Continuous heating transformation (CHT)curves”, J. Mater. Proc. Technol. 64, 311–318 (1997).
[26] K.-I. Sugimoto, T. Muramatsu, S.-I. Hashimoto, Y. Mukai, “Formability of Nb bearing ultrahigh-strength TRIP-aided sheet steels”, J. Mat. Proc. Tech. 177, 390–395 (2006).
[27] K.-I. Sugimoto, M. Murata, S. Song, “Formability of Al–Nb bearing ultra high-strength TRIP-aided sheet steels with bainitic ferrite and/or martensite matrix”, ISIJ Int. 50, 162–168 (2010).
[28] D. V. Edmonds, K. He, F. C. Rizzo, B. C. De Cooman, D. K. Matlock, J. G. Speer, “Quenchingand partitioning martensite - a novel steel heat treatment”, Mater. Sci. Engng. A 438, 25–34(2006).

BIBLIOGRAPHY 121
[29] O. Matsumura, Y. Sakuma, H. Takechi, “Enhancement of elongation by retained austenitein intercritical annealed 0.4 C-1.5 Si-0.8 Mn steel”, Trans. Iron Steel Inst. Jpn. 27, 570–579(1987).
[30] B. C. De Cooman, L. Barbe, J. Mahieu, D. Krizan, L. Samek, M. D. Meyer, “Mechanicalproperties of low alloy intercritically annealed cold-rolled TRIP sheet steel containing retainedaustenite”, Can. Metall. Quart. 43, 13–24 (2004).
[31] T. Kobayashi, N. Wakai, W. Yagi, T. Kazino, Y. Ueda, “Effects of manganese and nickelincrease on mechanical properties of TRIP steel”, Tetsu to Hagane 71, 1178–1185 (1985).
[32] M. De Meyer, D. Vanderschueren, B. C. De Cooman, “The influence of the substitution of Siby Al on the properties of cold-rolled C-Mn-Si TRIP steels”, ISIJ Int. 39, 813–822 (1999).
[33] A. Pichler, P. Stiaszny, “TRIP steel with reduced silicon content”, Steel Res. 70, 459–465(1999).
[34] K.-I. Sugimoto, A. Nagasaka, M. Kobayashi, S. Hashimoto, “Effects of retained austeniteparameters on warm stretch-flangeability in TRIP-aided dual-phase sheet steels”, ISIJ Int.39, 56–63 (1999).
[35] K.-I. Sugimoto, T. Iida, J. Sakaguchi, T. Kashima, “Retained austenite characteristics andtensile properties in a TRIP type bainitic sheet steel”, ISIJ Int. 40, 902–908 (2000).
[36] A. T. Davenport, The crystallography of upper bainite, Steel Research Rep. on Project 12051(1974).
[37] J. G. Speer, A. M. Streicher, D. K. Matlock, F. Rizzo, G. Krauss, “Quenching and partitioning:a fundamentally new process to create high-strength TRIP sheet microstructures”, in: Symp.on the Thermodynamics, Kinetics, Characterization and Modeling of: Austenite Formationand Decomposition, 505–522, Chicago, IL, USA (2003).
[38] J. G. Speer, D. K. Matlock, B. C. De Cooman, J. G. Schroth, “Carbon partitioning intoaustenite after martensite transformation”, Acta Mater. 51, 2611–2622 (2003).
[39] J. G. Speer, D. V. Edmonds, F. C. Rizzo, D. K. Matlock, “Partitioning of carbon fromsupersaturated plates of ferrite, with application to steel processing and fundamentals of thebainite transformation”, Curr. Opin. Solid State Mater. Sci. 8, 219–237 (2004).
[40] J. G. Speer, F. C. R. Assunção, D. K. Matlock, D. V. Edmonds, “The quenching and parti-tioning process: Background and recent progress”, J. Mater. Res. 8, 417–423 (2005).
[41] A. M. Streicher, J. G. Speer, D. K. Matlock, B. C. De Cooman, J. G. Speer, “Quenching andpartitioning response of a Si-added TRIP sheet steel”, in: AIST, ed., Proceedings of the Intl.Conf. on AHSS for Automotive Applications, 51–62, Warrendale, PA, USA (2004).
[42] E. De Moor, J. G. Speer, D. K. Matlock, J.-H. Kwak, S.-B. Lee, “Effect of carbon andmanganese on the quenching and partitioning response of CMnSi steels”, ISIJ Int. 51, 137–144 (2011).
[43] G. A. Thomas, J. G. Speer, D. K. Matlock, “Quenched and partitioned microstructures pro-duced via gleeble simulations of hot-strip mill cooling practices”, Metall. Mater. Trans. A 42,3652–3659 (2011).

122 BIBLIOGRAPHY
[44] R. A. Grange, H. M. Stewart, “The temperature range of martensite formation”, Trans. Am.Inst. Min. Metall. Engrs. 167, 467–494 (1945).
[45] R. Grange, R. Baughman, “Hardness of tempered martensite in carbon and low-alloy steels”,Trans. Am. Soc. Met. 48, 165–197 (1956).
[46] H. K. D. H. Bhadeshia, Bainite in steels, Inst. of Metals (1992).
[47] P. Jacques, F. Delannay, J. Ladrière, “On the influence of interactions between phases onthe mechanical stability of retained austenite in transformation-induced plasticity multiphasesteels”, Metall. Mater. Trans. A 32, 2759–2768 (2001).
[48] A. G. Allten, P. Payson, “The effect of silicon on the tempering of martensite”, Trans. Am.Soc. Met. 45, 498–532 (1953).
[49] W. S. Owen, “The effect of silicon on the kinetics of tempering”, Trans. Am. Soc. Met. 45,812–829 (1954).
[50] R. M. Hobbs, G. W. Lorimer, N. Ridley, “Effect of Si on the microstructure of quenched andtempered medium-C steels”, J. Iron Steel Inst. 210, 757–764 (1972).
[51] G. Miyamoto, J. C. Oh, K. Hono, T. Furuhara, T. Maki, “Effect of partitioning of Mn andSi on the growth kinetics of cementite in tempered Fe-0.6mass% C martensite”, Acta Mater.55, 5027–5038 (2007).
[52] E. Kozeschnik, H. K. D. H. Bhadeshia, “Influence of silicon on cementite precipitation insteels”, Mater. Sci. Technol. 24, 343–347 (2008).
[53] J. Wang, P. J. Van Der Wolk, S. Van Der Zwaag, “On the influence of alloying elements on thebainite reaction in low-alloy steels during continuous cooling”, J. Mater. Sci. 35, 4393–4404(2000).
[54] H. K. D. H. Bhadeshia, J. Christian, “Bainite in steels”, Metall. Mater. Trans. A 21, 767–797(1990).
[55] S. M. C. van Bohemen, M. J. Santofimia, J. Sietsma, “Experimental evidence for bainiteformation below Ms in Fe-0.66C”, Scr. Mater. 58, 488–491 (2008).
[56] I. Yakubtsov, G. Purdy, “Analyses of transformation kinetics of carbide-free bainite above andbelow the athermal martensite start temperature”, Metallurgical and Materials TransactionsA 43, 437–446 (2012).
[57] C. García-Mateo, F. G. Caballero, H. K. D. H. Bhadeshia, “Development of hard bainite”,ISIJ Int. 43, 1238–1243 (2003).
[58] C. García-Mateo, F. G. Caballero, H. K. D. H. Bhadeshia, “Low temperature bainite”, J.Phys. IV 112, 285–288 (2003).
[59] E. De Moor, P. J. Gibbs, J. G. Speer, D. K. Matlock, J. G. Schroth, “Strategies for third-generation advanced high-strength steel development”, AIST Trans. Iron Steel Technol. 7, 132(2010).
[60] Y. Sakuma, O. Matsumura, H. Takechi, “Mechanical properties and retained austenite in inter-critically heat-treated bainite-transformed steel and their variation with Si and Mn additions”,Metall. Mater. Trans. A 22, 489–498 (1991).
BIBLIOGRAPHY 123
[61] K.-I. Sugimoto, B. YU, Y. Mukai, S. Ikeda, “Microstructure and formability of aluminumbearing TRIP-aided steels with annealed martensite matrix”, ISIJ Int. 45, 1194–1200 (2005).
[62] A. Nagasaka, K.-I. S. Sugimoto, A. Mio, T. Hojo, K. Makii, M. Kawajiri, M. Kitayama,“Effect of yag laser cutting on stretch-flangeability of ultra high strength TRIP sheet steelwith bainitic ferrite matrix”, ISIJ Int. 50, 1441–1446 (2010).
[63] E. C. Bain, Functions of the alloying elements in steel, Am. Soc. Met. (1939).
[64] P. Jacques, E. Girault, T. Catlin, N. Geerlofs, T. Kop, S. van der Zwaag, F. Delannay,“Bainite transformation of low-carbon Mn-Si TRIP-assisted multiphase steels: influence ofsilicon content on cementite precipitation and austenite retention”, Mater. Sci. Engng. A273, 475–479 (1999).
[65] F. B. Pickering, Constitution and properties of steels, VCH (1992).
[66] A. Hultgren, K. Kuo, “La transformation isotherme de l ’austénite et le partage des élémentsspéciaux dans les aciers faiblement alliés.”, Rev. Metall 50, 847–856 (1953).
[67] T. Sato, T. Nishizawa, Y. Honda, “Study on carbides in practical steels by electrolytic isola-tion”, Tetsu-to-Hagané 41, 1188–1192 (1955).
[68] J. Wang, S. Zwaag, “Stabilization mechanisms of retained austenite in transformation-inducedplasticity steel”, Metall. Mater. Trans. A 32, 1527–1539 (2001).
[69] K. Han, G. D. W. Smith, D. V. Edmonds, “Pearlite phase transformation in Si and V steel”,Metall. Mater. Trans. A 26, 1617–1631 (1995).
[70] J. Mahieu, Contribution to the Physical Metallurgy of Crash-resistant galvanized TRIP-assisted Steel for Automotive Structures, Ph.D. thesis, Ghent University, Ghent, Belgium(2004).
[71] J. Mahieu, B. C. De Cooman, S. Claessens, “Galvanizability of high-strength steels for auto-motive applications”, Metall. Mater. Trans. A 32, 2905–2908 (2001).
[72] G. Lagerberg, “Carbon damping in manganese-alloyed ferrite”, Acta Metall. 7, 137–139 (1959).
[73] G. R. Purdy, Y. J. M. Brechet, “A solute drag treatment of the effects of alloying elements onthe rate of the proeutectoid ferrite transformation in steels”, Acta Metall. Mater. 43, 3763–3774 (1995).
[74] G. Airey, T. Hughes, R. Mehl, “The growth of cementite particles in ferrite”, Trans. Am. Inst.Min. Metall. Engrs. 242 (1968).
[75] T. Mukherjee, W. Stumpf, C. Sellars, W. Tegart, “Kinetics of coarsening of carbides inchromium steels at 700 C”, J. Iron Steel Inst. 207, 621–631 (1969).
[76] T. Sakuma, N. Watanabe, T. Nishizawa, “The effect of alloying element on the coarseningbehavior of cementite particles in ferrite”, Trans. JIM 21 (1980).
[77] M. Ko, T. Sakuma, T. Nishizawa, “Effect of magnetism on the partition of alloying elementsbetween cementite and ferrite”, J. Jpn. Inst. Met. 40, 593–601 (1976).
[78] S. Al-Salman, G. Lorimer, N. Ridley, “Pearlite growth kinetics and partitioning in a Cr- Mneutectoid steel”, Metall. Mater. Trans. A 10, 1703–1709 (1979).

124 BIBLIOGRAPHY
[79] S. Babu, K. Hono, T. Sakurai, “APFIM studies on martensite tempering of Fe-C-Si-Mn lowalloy steel”, Appl. Surf. Sci. 67, 321–327 (1993).
[80] M. Umemoto, Z. G. Liu, K. Masuyama, K. Tsuchiya, “Influence of alloy additions on produc-tion and properties of bulk cementite”, Scr. Mater. 45, 391–398 (2001).
[81] C. Zhu, X. Y. Xiong, A. Cerezo, R. Hardwicke, G. Krauss, G. D. W. Smith, “Three-dimensionalatom probe characterization of alloy element partitioning in cementite during tempering ofalloy steel”, Ultramicroscopy 107, 808–812 (2007).
[82] A. Pichler, S. Traint, T. Hebesberger, P. Stiaszny, E. A. Werner, “Processing of thin sheetmultiphase steel grades”, Steel Res. Int. 78, 216–223 (2007).
[83] M. J. Merwin, “Low-carbon manganese TRIP steels”, in: Trans. Tech. Publ., ed., Mater. Sci.Forum, 4327–4332 (2007).
[84] B. Wietbrock, M. Bambach, S. Seuren, G. Hirt, “Homogenization strategy and material char-acterization of high-manganese TRIP and TWIP steels”, in: Mater. Sci. Forum, 3134–3139,Trans. Tech. Publ. (2010).
[85] W. Xu, P. Rivera-Diaz-del Castillo, S. Van Der Zwaag, “Ferrite/pearlite band prevention indual phase and TRIP steels: Model developmentf”, ISIJ Int. 45, 380–387 (2005).
[86] B. De Cooman, “Structure-properties relationship in TRIP steels containing carbide-free bai-nite”, Curr. Opin. Solid State Mater. Sci. 8, 285–303 (2004).
[87] S. Traint, A. Pichler, P. Stiaszny, M. Blaimschein, B. Röthler, C. Krempaszky, E. Werner,“Alloy design, processing and properties of TRIP-steels: A critical comparison”, in: AIST,ed., Int. Conf. on Advanced High-Strength Sheet Steel for Automotive Applications, 79–98,Winter Park, CO, USA (2004).
[88] K.-I. Sugimoto, M. Murata, T. Muramatsu, Y. Mukai, “Formability of C–Si–Mn–Al–Nb–Moultra high-strength TRIP-aided sheet steels”, ISIJ Int. 47, 1357–1362 (2007).
[89] D. Kim, J. Speer, H. Kim, B. De Cooman, “Observation of an isothermal transformation duringquenching and partitioning processing”, Metall. Mater. Trans. A 40, 2048–2060 (2009).
[90] K. M. Wu, M. Kagayama, M. Enomoto, “Kinetics of ferrite transformation in an Fe-0.28mass% C-3mass% Mo alloy”, Mater. Sci. Engng. A 343, 143–150 (2003).
[91] H. Aaronson, W. Reynolds Jr, G. Purdy, “Coupled-solute drag effects on ferrite formation inFe-CX systems”, Metallurgical and Materials Transactions A 35, 1187–1210 (2004).
[92] A. Samoilov, Y. Titovets, N. Zolotorevsky, G. Hribernig, A. Pichler, “Cr influence on steelmicrostructure and kinetics of austenite decomposition at near-bay temperatures”, 311–320(2005).
[93] N. A. Razik, G. W. Lorimer, N. Ridley, “Chromium partitioning during the austenite-pearlitetransformation”, Metall. Trans. A 7, 209–214 (1976).
[94] J. Chance, N. Ridley, “Chromium partitioning during isothermal transformation of a eutectoidsteel”, Metall. Trans. A 12, 1205–1213 (1981).
[95] N. Ridley, M. Malik, G. Lorimer, “Partitioning and pearlite growth kinetics in an Ni–Creutectoid steel”, Mater. Charact. 25, 125–141 (1990).

BIBLIOGRAPHY 125
[96] D. E. Parsons, T. F. Malis, J. D. Boyd, “Microalloying and precipitation in Cr-V rail steels”,J. Heat Treat. 3, 213–219 (1984).
[97] R. Thomson, M. K. Miller, “Carbide precipitation in martensite during the early stages oftempering Cr- and Mo-containing low alloy steels”, Acta Mater. 46, 2203–2213 (1998).
[98] J. Takahashi, K. Kawakami, M. Sugiyama, T. Tarui, “Quantitative composition analysis ofspherical cementite by three-dimensional atom probe”, Tetsu-to-Hagané 93, 145–149 (2007).
[99] S. Paul, Entwicklung neuer Legierungskonzepte für höchstfeste TRIP-Stähle mit nicht-ferritischer Matrix und reduziertem Siliziumgehalt, Ph.D. thesis, Technische UniversitätMünchen (2012).
[100] A. J. DeArdo, “Niobium in modern steels”, Int. Mater. Rev. 48, 371–402 (2003).
[101] E. Orowan, “Metals and alloys”, in: Inst. Met., ed., Symp. on Internal Stresses, London,England (1948).
[102] E. O. Hall, “The deformation and ageing of mild steel: III discussion of results”, Proc. Phys.Soc. B 64, 747–753 (1951).
[103] N. J. Petch, “The cleavage strength of polycrystals”, J. Iron Steel Inst. 174, 25–28 (1953).
[104] W. Bleck, K. Hulka, K. Papamentellos, “Effect of niobium on the mechanical properties ofTRIP steels”, in: Trans. Tech. Publ., ed., Mater. Sci. Forum, 327–334 (1998).
[105] K. Hulka, W. Bleck, K. Papamantellos, “Relationships between heat treatment conditions,microstructure and properties of niobium microalloyed TRIP steel”, in: Iron Steel Soc., ed.,41 st Mechanical Working and Steel Processing Conference, 67–77, Baltimore, MD, USA(1999).
[106] D. Krizan, B. C. De Cooman, J. Antonissen, “Retained austenite stability in the cold-rolledCMnAlSiP micro-alloyed TRIP steels”, in: AIST, ed., Int. Conf. on Advanced High StrengthSheet Steel for Automotive Applications, 205–215, Winter Park, CO, USA (2004).
[107] A. Pichler, T. Hebesberger, S. Traint, E. Tragl, T. Kurz, C. Krempaszky, P. Tsipouridis,E. Werner, “Advanced high strength thin sheet grades: Improvement of properties by mi-croalloying assisted microstructure control”, in: TMS, ed., Int. Symp. of Niobium MicroalloyedSheet Steel for Automotive Application, 245–273 (2006).
[108] C. Zener, “Kinetics of the decomposition of austenite”, Trans. Am. Inst. Min. Metall. Engrs.167, 550–595 (1946).
[109] T. Gladman, The physical metallurgy of microalloyed steels, Maney Pub. (1997).
[110] M. Avrami, “Kinetics of phase change. I General theory”, J. Chem. Phys. 7, 1103–1112 (1939).
[111] A. C. Kneissl, C. I. Garcia, A. J. DeArdo, G. Tither, Z. Shouhua, “HSLA Steels: Processing,Properties and Applications”, 99–105, Warrendale, PA, USA (1992).
[112] H. Tamehiro, M. Murata, R. Habu, M. Nagumo, “Optimum microalloying of niobium andboron in HSLA steel for thermomechanical processing”, Trans. Iron Steel Inst. Jpn. 27, 120–129 (1987).
[113] T. Gladman, “Precipitation hardening in metals”, Mater. Sci. Technol. 15, 30–36 (1999).

126 BIBLIOGRAPHY
[114] J. Irvine, T. Baker, “Effect of rolling deformation on niobium carbide particle size distributionin low-carbon steel”, Met. Sci. 13, 228–237 (1979).
[115] H. Watanabe, Y. Smith, R. Pehlke, “Precipitation kinetics of niobium carbonitride in austeniteof high-strength low-alloy steels”, 140–168, New York, NY, USA (1977).
[116] G. Gottstein, Physikalische Grundlagen der Materialkunde, Springer-Lehrbuch, Springer-Verlag Berlin Heidelberg (2007).
[117] G. E. Dieter, Mechanical Metallurgy, 3rd ed., McGraw-Hill Book Company (1986).
[118] R. L. Fleischer, “Substitutional solution hardening”, Acta Metall. 11, 203–209 (1963).
[119] R. Labusch, “A statistical theory of solid solution hardening”, Physica Status Solidi B 41,659–669 (1970).
[120] A. Suzuki, “Synthetic studies via the cross-coupling reaction of organoboron derivatives withorganic halides”, Pure Appl. Chem. 63, 419–422 (1991).
[121] A. Kelly, M. Fine, “The strength of an alloy-containing zones”, Acta Metall. 5, 365–367 (1957).
[122] A. Ghosh, “Tensile instability and necking in materials with strain hardening and strain-ratehardening”, Acta Metall. 25, 1413–1424 (1977).
[123] P. Ludwik, Elemente der technologischen Mechanik, J. Springer (1909).
[124] M. F. Ashby, “The deformation of plastically non-homogeneous materials”, Philos. Mag. 21,399–424 (1970).
[125] N. Fleck, G. Muller, M. Ashby, J. Hutchinson, “Strain gradient plasticity: theory and experi-ment”, Acta Metall. Mater. 42, 475–487 (1994).
[126] B. Karlsson, G. Linden, “Plastic deformation of ferrite-pearlite structures in steel”, Mater.Sci. Engng. A 17, 209–219 (1975).
[127] H. Fischmeister, J. O. Hjälmered, B. Karlsson, G. Linden, B. Sundström;, “Strength of metals& alloys (9th edn.)”, in: Inst. of Metals & Iron and Steel, ed., Proc. 3rd Int. Conf. Strengthof Metals and Alloys, Camebridge, England (1973).
[128] H. Fischmeister, B. Karlsson, “Plastizitätseigenschaften grob-zweiphasiger Werkstoffe”, Z.Metallkd. 68, 311–327 (1977).
[129] D. C. Drucker, “Thoughts on the present and future interrelation of theoretical and experi-mental mechanics”, Exp. Mech. 8, 97–106 (1968).
[130] I. Tamura, Y. Tomota, H. Ozawa, in: Inst. of Metals & Iron and Steel, ed., Proc. 3rd Int.Conf. Strength of Metals and Alloys, 611, Camebridge, England (1973).
[131] G. Reisner, E. Werner, F. Fischer, “Micromechanical modeling of martensitic transformationin random microstructures”, Int. J. Solids Struct. 35, 2457–2473 (1998).
[132] F. Fischer, G. Reisner, E. Werner, K. Tanaka, G. Cailletaud, T. Antretter, “A new view ontransformation induced plasticity (TRIP)”, Int. J. Plast. 16, 723–748 (2000).

BIBLIOGRAPHY 127
[133] N. Van Dijk, A. Butt, L. Zhao, J. Sietsma, S. Offerman, J. Wright, S. Van der Zwaag, “Thermalstability of retained austenite in TRIP steels studied by synchrotron X-ray diffraction duringcooling”, Acta Mater. 53, 5439–5447 (2005).
[134] E. Jimenez-Melero, N. Van Dijk, L. Zhao, J. Sietsma, S. Offerman, J. Wright, S. Van derZwaag, “Characterization of individual retained austenite grains and their stability in low-alloyed TRIP steels”, Acta Mater. 55, 6713–6723 (2007).
[135] P. Jacques, “Transformation-induced plasticity for high-strength formable steels”, Curr. Opin.Solid State Mater. Sci. 8, 259–265 (2004).
[136] S. Chatterjee, H.-S. Wang, J. R. Yang, H. K. D. H. Bhadeshia, “Mechanical stabilisation ofaustenite”, Mater. Sci. Technol. 22, 641–644 (2006).
[137] H. K. D. H. Bhadeshia, R. W. K. Honeycombe, Steels: Microstructure and Properties,Butterworth-Heinemann (2011).
[138] A. F. L. Mark, Microstructural effects on the stability of retained austenite in transformationinduced plasticity steels, Ph.D. thesis, Queen’s University (2008).
[139] K.-I. Sugimoto, A. Kanda, R. Kikuchi, S. Hashimoto, T. Kashima, S. Ikeda, “Ductility andformability of newly developed high strength low alloy TRIP-aided sheet steels with annealedmartensite matrix”, ISIJ Int. 42, 910–915 (2002).
[140] P. F. Thomason, Ductile fracture of metals, Pergamon Press Oxford (1990).
[141] A. Pichler, E. Tragl, T. Kurz, E. Werner, P. Tsipouridis, A. Haglund, J. Zajac, J. M. Artimez,J. A. G. Ferreno, DP grades with improved formability, Research Fund for Coal & Steel (2009).
[142] L. Ryde, D. Lindell, A. Pichler, J. A. G. Ferreno, Y. V. Granbom, E. Werner, A. Fillafer,R. Wesenjak, P. Tsipouridis, Micro-scale damage, tolerance of AHSS steels as function ofmicrostructure and stress/strain state, Research Fund for Coal & Steel (2013).
[143] L. Brown, W. Stobbs, “The work-hardening of copper-silica V. Equilibrium plastic relaxationby secondary dislocations”, Philosophical Magazine 34, 351–372 (1976).
[144] S. Goods, L. Brown, “Overview no. 1: The nucleation of cavities by plastic deformation”, ActaMetall. 27, 1–15 (1979).
[145] A. Argon, J. Im, R. Safoglu, “Cavity formation from inclusions in ductile fracture”, Metall.Trans. A 6, 825–837 (1975).
[146] J. Gurland, J. Plateau, “The mechanism of ductile rupture of metals containing inclusions”,Trans. Am. Soc. Met. 442–454 (1963).
[147] R. v. Mises, “Mechanik der festen Körper im plastisch-deformablen Zustand”, Nachrichtenvon der Gesellschaft der Wissenschaften zu Göttingen, Mathematisch-Physikalische Klasse582–592 (1913).
[148] C. Krempaszky, J. Ocenasek, V. Espinoza, E. Werner, T. Hebesberger, A. Pichler, “Microme-chanical modeling of the formability of dual-phase steels”, in: Proceedings MS&T, 31–42,Detroit, MI, USA (2007).

128 BIBLIOGRAPHY
[149] A. Bhattacharyya, G. Weng, “Theoretical calculation of the stress-strain behavior of dual-phase metals with randomly-oriented spheroidal inclusions”, Metall. Mater. Trans. A 27,2359–2365 (1996).
[150] P. Tsipouridis, Mechanical Properties of Dual Phase Steels, Ph.D. thesis, Technische Univer-sität München (2006).
[151] C. Krempaszky, J. Ocenasek, V. Espinoza, P. Tsipouridis, E. Werner, T. Hebesberger, A. Pich-ler, “Micromechanical modeling of the formability of advanced high strength steels”, in: AIST,ed., Int. Conf. on New Developments in AHSS, 305–313, Orlando, FL, USA (2008).
[152] A. Hiramatsu, T. Yamada, “Prediction of stress-strain curves in ferrite single structure steels”,ISIJ Int. 263–268 (1994).
[153] M. Considère, Memoire sur l’emploi du fer et de l’acier dans les constructions, Dunod (1885).
[154] J. Gurland, The measurement of grain contiguity in two-phase alloys, Division of Engineering,Brown University (1957).
[155] J. R. Rice, D. M. Tracey, “On the ductile enlargement of voids in triaxial stress fields”, J.Mech. Phys. Solids 17, 201–217 (1969).
[156] G. Le Roy, J. Embury, G. Edwards, M. Ashby, “A model of ductile fracture based on thenucleation and growth of voids”, Acta Metall. 29, 1509–1522 (1981).
[157] R. Hill, “Discontinuity relations in mechanics of solids”, Progress Solid Mechanics 2, 245–276(1961).
[158] P. F. Thomason, “A theory for ductile fracture by internal necking of cavities”, J. Inst. Metals.96, 360–365 (1968).
[159] F. LePera, “Improved etching technique for the determination of percent martensite in high-strength dual-phase steels”, Metallography 12, 263–268 (1979).
[160] W. S. Rasband, ImageJ, US and National Institutes of Health and others, Bethesda, MD,USA (2009).
[161] E. Wirthl, R. Angerer, K. Hauzenberger, “Determination of the volume amount of retainedaustenite in small specimens by magnetic measurements”, in: 2000 AISE Annual Conventionand Exposition (2000).
[162] E. Wirthl, A. Pichler, R. Angerer, P. Stiaszny, K. Hauzenberger, Y. F. Titovets, M. Hackl,“Determination of the volume fraction of retained austenite in small specimens by magneticmeasurements”, in: Int. Conf. on TRIP-Aided High Strength Ferrous Alloys, 61–64, Ghent,Belgium (2002).
[163] H. M. Rietveld, “Line profiles of neutron powder diffraction peaks for structure refinement”,Acta Crystallogr. 22, 151–152 (1967).
[164] H. M. Rietveld, “A profile refinement method for nuclear and magnetic structures”, J. Appl.Cryst. 2, 65–71 (1969).
[165] Thermo-Calc Software TCFE6 Steels Fe-alloys database version 6 (2010).

BIBLIOGRAPHY 129
[166] K. Hausmann, D. Krizan, A. Pichler, E. Werner, “TRIP-aided bainitic-ferritic sheet steel:A critical assessment of alloy design and heat treatment”, in: MS&T, ed., Advanced SteelMetallurgy: Design, Processing, and Technological Exploitation, 209–219, Montreal, Canada(2013).
[167] K. Hausmann, “Cementite in ferrite from first-principles: Influence of substitutional impuritieson thermodynamic stability”, Diploma Thesis, RWTH Aachen University (2011).
[168] W. Bleck, A. Frehn, J. Ohlert, “Niobium in dual phase and TRIP steels”, in: TMS, ed., Int.Symp. Niobium, 727–752, Orlando, FL, USA (2001).
[169] D. Krizan, B. C. De Cooman, “Analysis of the strain-induced martensitic transformation ofretained austenite in cold-rolled micro-alloyed TRIP steel”, Steel Res. Int. 79, 513–522 (2008).
[170] S. Traint, A. Pichler, R. Sierlinger, H. Pauli, E. Werner, “Low-alloyed TRIP steels withoptimized strength, forming and welding properties”, Steel Res. Int. 77, 641–649 (2006).
[171] E. Pereloma, I. Timokhina, P. Hodgson, “Transformation behaviour in thermomechanicallyprocessed C-Mn-Si TRIP steels with and without Nb”, Mater. Sci. Engng. A 273, 448–452(1999).
[172] D. Krizan, Structure-Property Relationships in 1 GPa Micro-Alloyed TRIP Steel, Ph.D. thesis,Universiteit Gent (2006).
[173] K. Hausmann, D. Krizan, K. Spiradek-Hahn, A. Pichler, E. Werner, “The influence of Nbon transformation behavior and mechanical properties of TRIP-assisted bainitic-ferritic sheetsteels”, Mater. Sci. Engng. A 588, 142–150 (2013).
[174] S. Bechet, L. Beaujard, “Nouveau réactif pour la mise en évidence micrographique du grainausténitique des aciers trempés ou trempés-revenus”, Rev. Met. 52, 830–836 (1955).
[175] D. Dyson, B. Holmes, “Effect of alloying additions on the lattice parameter of austenite”, J.Iron Steel Inst. 208, 469–474 (1970).
[176] D. Koistinen, R. Marburger, “A general equation prescribing the extent of the austenite-martensite transformation in pure iron-carbon alloys and plain carbon steels”, Acta Metall. 7,59–60 (1959).
[177] M. Oka, H. Okamoto, “Swing back in kinetics near martensite start temperature in hypereu-tectoid steels”, Metall. Mater. Trans. A 19, 447–452 (1988).
[178] L.-J. Zhu, D. Wu, X.-M. Zhao, “Effect of silicon content on thermodynamics of austenitedecomposition in C-Si-Mn TRIP steels”, J. Iron Steel Res. Int. 13, 57–73 (2006).
[179] E. S. Davenport, E. C. Bain, “Transformation of austenite at constant subcritical tempera-tures”, Trans. Am. Inst. Min. Metall. Engrs. Iron Steel Div. 90, 117 (1930).
[180] J. R. Vilella, G. E. Guellich, E. C. Bain, “On naming the aggregate constituents in steel”,Trans. Am. Soc. Met. 24, 225–261 (1936).
[181] H. K. D. H. Bhadeshia, “Bainite: Overall transformation kinetics”, J. Phys. Colloq. 43, 4(1982).

130 BIBLIOGRAPHY
[182] Š. Mikmeková, K. Hausmann, D. Krizan, “The potentials of ultra-high vacuum scanning low-energy electron microscopy for study of multiphase steel”, in: The 2nd International Confer-ence on Engineering and Applied Science, Tokyo, Japan (2013).
[183] Š. Mikmeková, K. Hausmann, D. Krizan, “Microstructure characterization of AHSS by un-conventional microscopy techniques”, in: 1st East-Asia Microscopy Conference, Chongqing,China (2013).
[184] P. Jacques, F. Delannay, X. Cornet, P. Harlet, J. Ladriere, “Enhancement of the mechanicalproperties of a low-carbon, low-silicon steel by formation of a multiphased microstructurecontaining retained austenite”, J. Metall. Mater. Trans. A 29, 2383–2393 (1998).
[185] A. J. Clarke, J. G. Speer, D. K. Matlock, F. C. Rizzo, D. V. Edmonds, M. J. Santofimia,“Influence of carbon partitioning kinetics on final austenite fraction during quenching andpartitioning”, Scr. Mater. 61, 149–152 (2009).
[186] A. Clarke, Carbon partitioning into austenite from martensite in a silicon-containing high-strength sheet steel, Ph.D. thesis, Colorado School of Mines, Golden, CO (2006).
[187] A. Bachmaier, K. Hausmann, D. Krizan, A. Pichler, “Development of TBF steels with 980MPa tensile strength for automotive applications: Microstructure and mechanical properties”,in: Int. Symp. on New Developments in AHSS, 131–139, Vail, CO (2013).
[188] K.-I. Sugimoto, M. Murata, Y. Mukai, “Stretch-flangeability of C-Mn-Si-Al-Nb ultra high-strength TRIP-aided cold-rolled sheet steel”, in: AIST, ed., Int. Conf. on New Developmentsin AHSS, 57–67, Orlando, FL, USA (2008).
[189] F. G. Caballero, S. Allain, J. Cornide, J. D. Puerta Velásquez, C. Garcia-Mateo, M. K. Miller,“Design of cold-rolled and continuous-annealed carbide-free bainitic steels for automotive ap-plication”, Materials & Design 49, 667–680 (2013).
[190] A. Argon, J. Im, “Separation of second phase particles in spheroidized 1045 steel, Cu-0.6 pctCr alloy, and maraging steel in plastic straining”, Metall. Trans. A 6, 839–851 (1975).
[191] E. Hornbogen, G. Eggeler, E. Werner, Werkstoffe. Aufbau und Eigenschaften von Keramik-,Metall-, Polymer-und Verbundwerkstoffen, Springer (2012).
[192] E. Maire, O. Bouaziz, M. D. Michiel, C. Verdu, “Initiation and growth of damage in a dual-phase steel observed by X-ray microtomography”, Acta Mater. 56, 4954 – 4964 (2008).
[193] M. Katsukura, “First use of 1180 MPa advanced high-strength steel with high formabilityin the new Infinity Q50”, in: Materials in Car Body Engineering, Bad Nauheim, Germany(2014).