trisha conti, ph.d. december 7, 2016 - vermontghsp.vermont.gov/sites/ghsp/files/documents/vt...
TRANSCRIPT
DUI and DUID in Vermont
Trisha Conti, Ph.D.
December 7, 2016

VFL Toxicology Section
Senior Forensic Chemist / Section Supervisor
Amanda Bolduc
Forensic Chemists
Jeff Dukette
David Patlak
DMT Technician
Rob Driscoll
Information Technician
Marcella Giammanco

VFL Toxicology Section
Oversee evidentiary breath alcohol testing program
Calibration/certification
Maintenance/repair
Record collection
Officer training
Blood testing program
Distribute evidential blood kits
Receive evidence from hospitals/agencies
Test blood for presence/quantity of ethanol
Coordinate shipment of DUI drug samples to NMS Labs
Alcohol Physiology, Pharmacology, Testing, and Impairment Expert Testimony
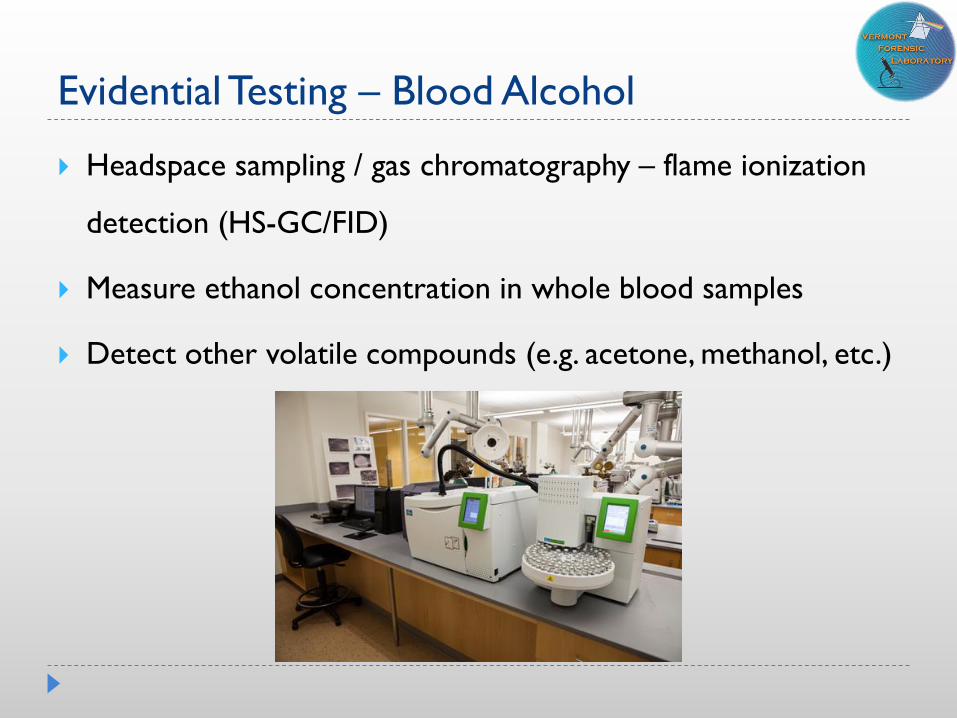
Evidential Testing – Blood Alcohol
Headspace sampling / gas chromatography – flame ionization
detection (HS-GC/FID)
Measure ethanol concentration in whole blood samples
Detect other volatile compounds (e.g. acetone, methanol, etc.)

Evidential Testing – Breath Alcohol
Infrared spectrometry
Measure ethanol vapor concentration in breath samples
Instrument performs self-checks to ensure reliability

Breath vs. Blood
Breath preferred in Vermont
Minimally invasive
More accessible, less time lapse
Blood can be taken if:
Major crash; subject is in hospital
Subject can not provide an adequate breath sample
Breath test instrument is not reasonably available
Subject is under the influence of drug other than alcohol
Impaired Driving Data
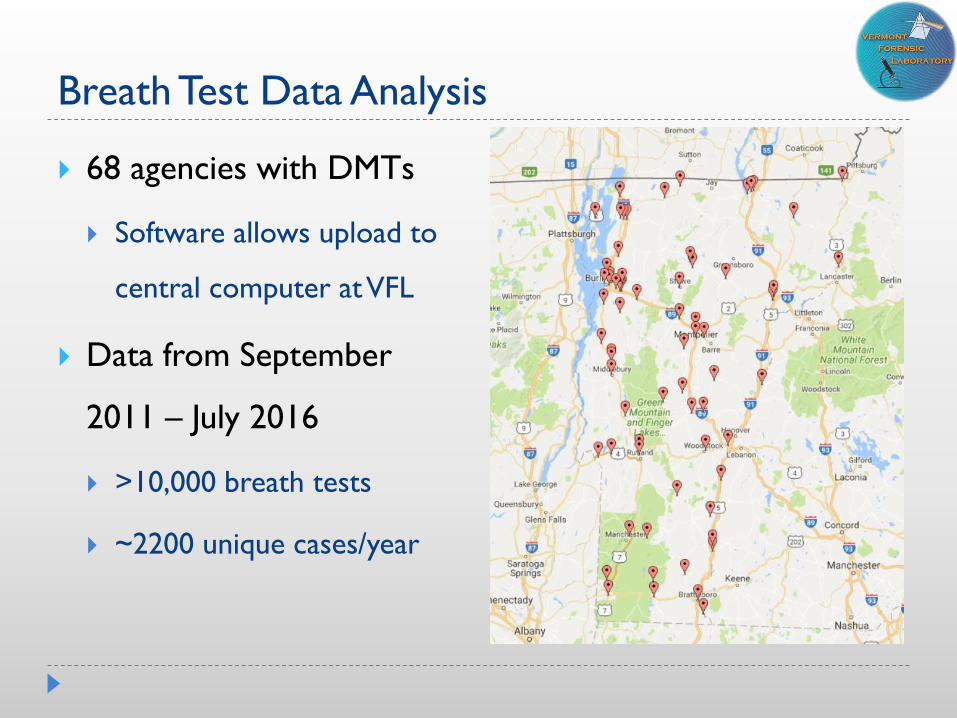
Breath Test Data Analysis
68 agencies with DMTs
Software allows upload to
central computer at VFL
Data from September
2011 – July 2016
>10,000 breath tests
~2200 unique cases/year
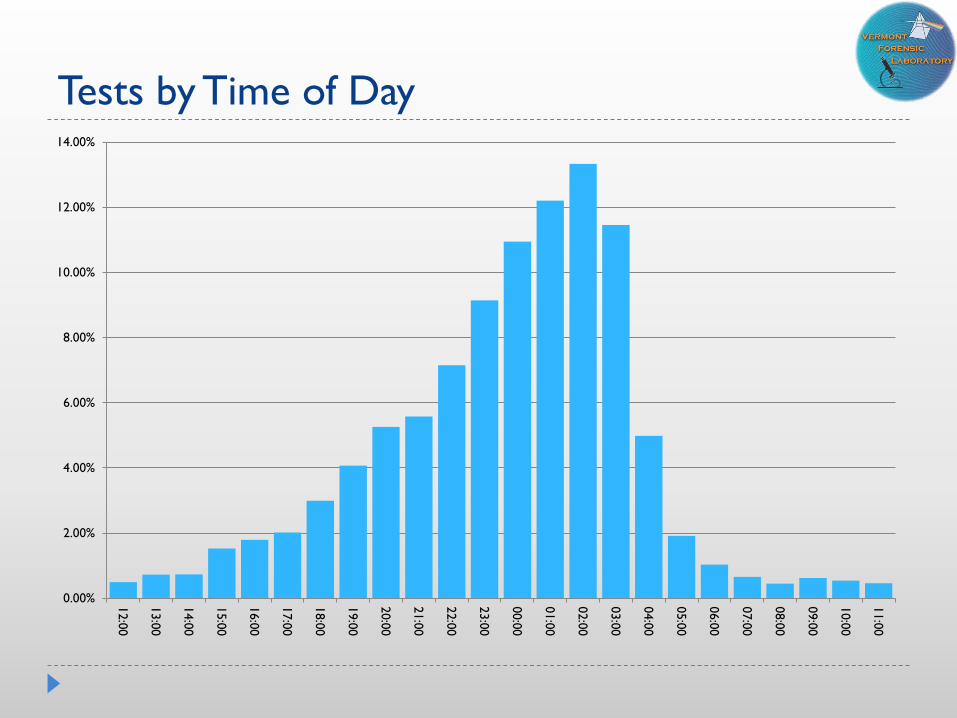
Tests by Time of Day
0.00%
2.00%
4.00%
6.00%
8.00%
10.00%
12.00%
14.00%
12:0
0
13:0
0
14:0
0
15:0
0
16:0
0
17:0
0
18:0
0
19:0
0
20:0
0
21:0
0
22:0
0
23:0
0
00:0
0
01:0
0
02:0
0
03:0
0
04:0
0
05:0
0
06:0
0
07:0
0
08:0
0
09:0
0
10:0
0
11:0
0
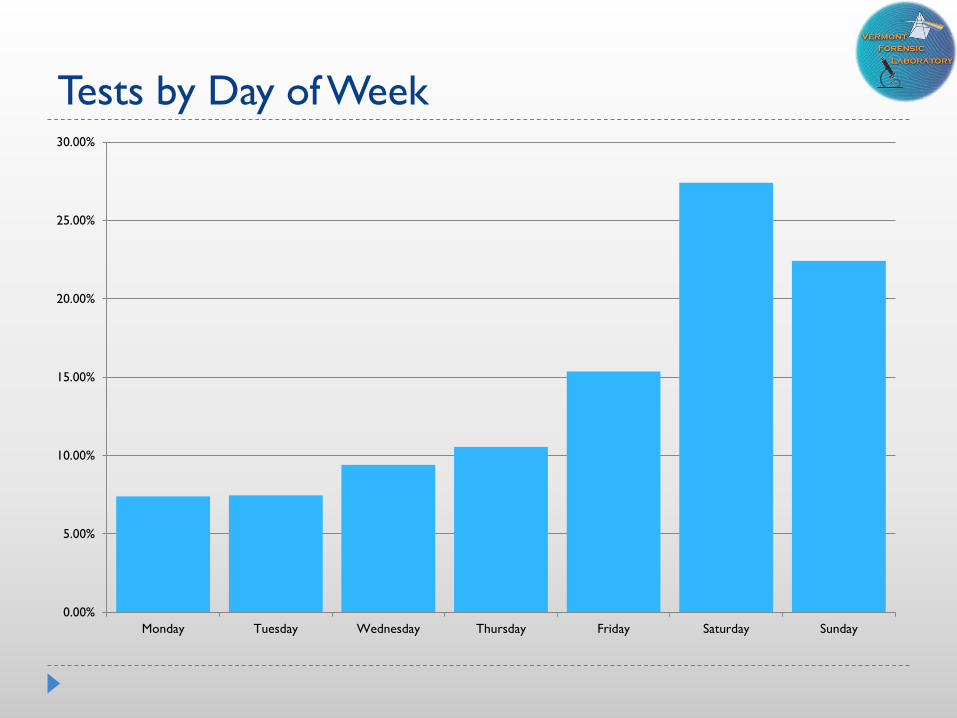
Tests by Day of Week
0.00%
5.00%
10.00%
15.00%
20.00%
25.00%
30.00%
Monday Tuesday Wednesday Thursday Friday Saturday Sunday

Tests by Month
0.00%
2.00%
4.00%
6.00%
8.00%
10.00%
12.00%
Jan Feb Mar Apr May Jun Jul Aug Sep Oct Nov Dec
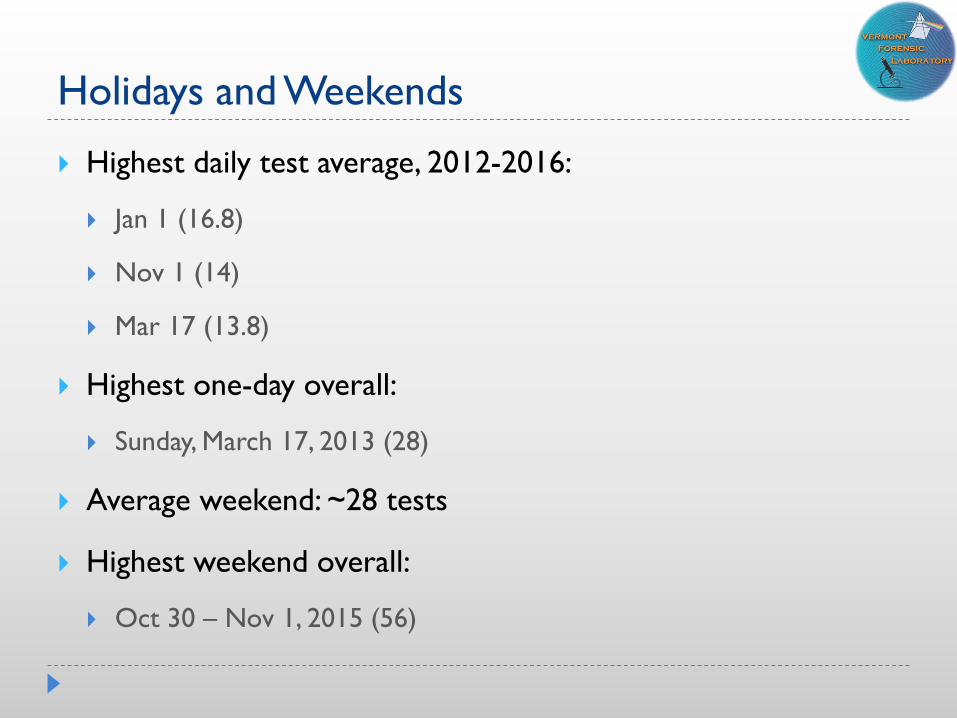
Holidays and Weekends
Highest daily test average, 2012-2016:
Jan 1 (16.8)
Nov 1 (14)
Mar 17 (13.8)
Highest one-day overall:
Sunday, March 17, 2013 (28)
Average weekend: ~28 tests
Highest weekend overall:
Oct 30 – Nov 1, 2015 (56)
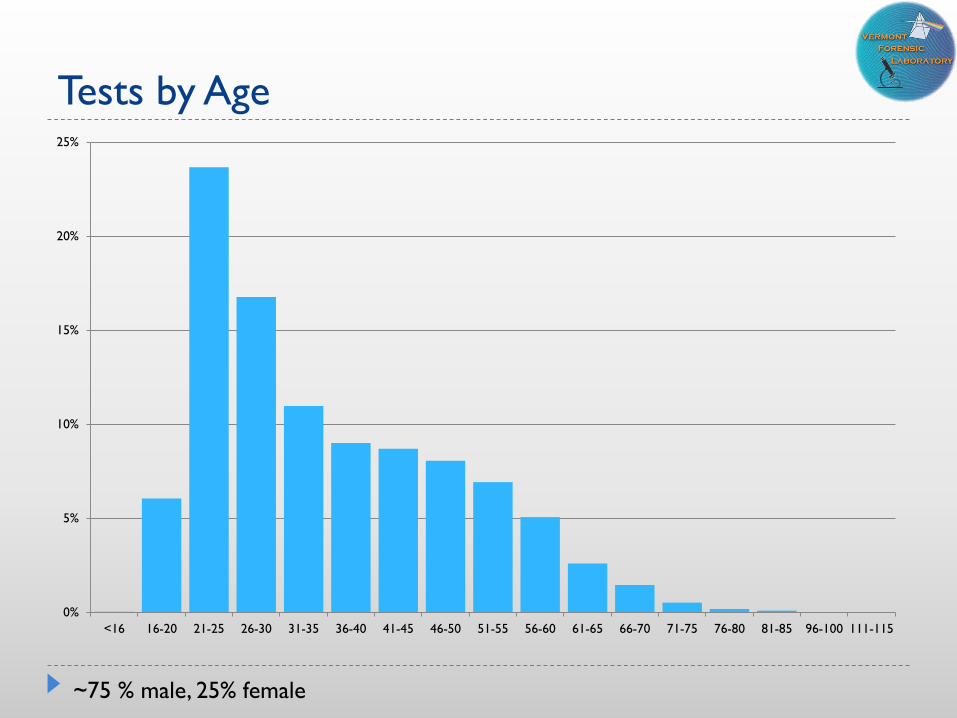
Tests by Age
0%
5%
10%
15%
20%
25%
<16 16-20 21-25 26-30 31-35 36-40 41-45 46-50 51-55 56-60 61-65 66-70 71-75 76-80 81-85 96-100 111-115
~75 % male, 25% female
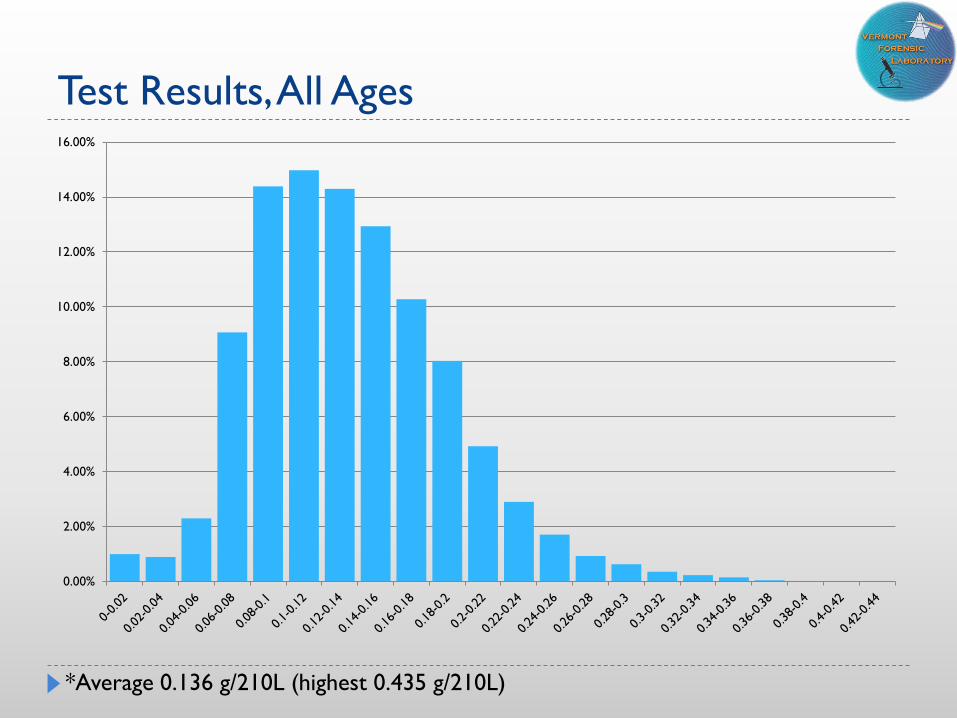
Test Results, All Ages
0.00%
2.00%
4.00%
6.00%
8.00%
10.00%
12.00%
14.00%
16.00%
*Average 0.136 g/210L (highest 0.435 g/210L)

Test Results, Ages 14-20
0.00%
2.00%
4.00%
6.00%
8.00%
10.00%
12.00%
14.00%
16.00%
18.00%
20.00%

High Test Results (>0.20 g/210 L)
0.00%
2.00%
4.00%
6.00%
8.00%
10.00%
12.00%
14.00%
16.00%
18.00%
15-19 20-24 25-29 30-34 35-39 40-44 45-49 50-54 55-59 60-64 65-69 70-74 75-79
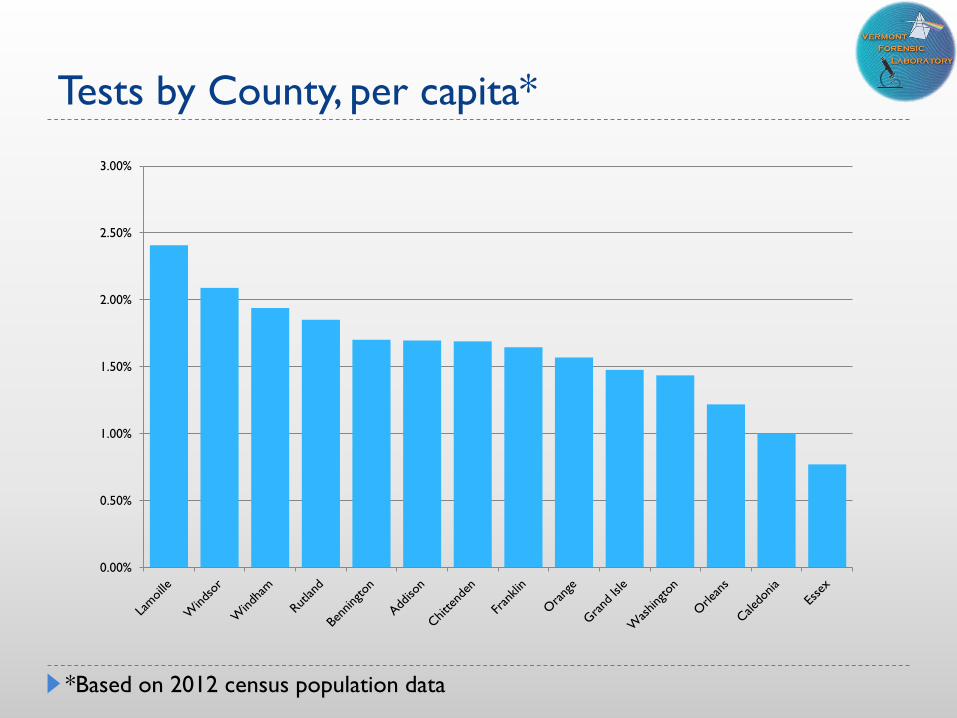
Tests by County, per capita*
0.00%
0.50%
1.00%
1.50%
2.00%
2.50%
3.00%
*Based on 2012 census population data
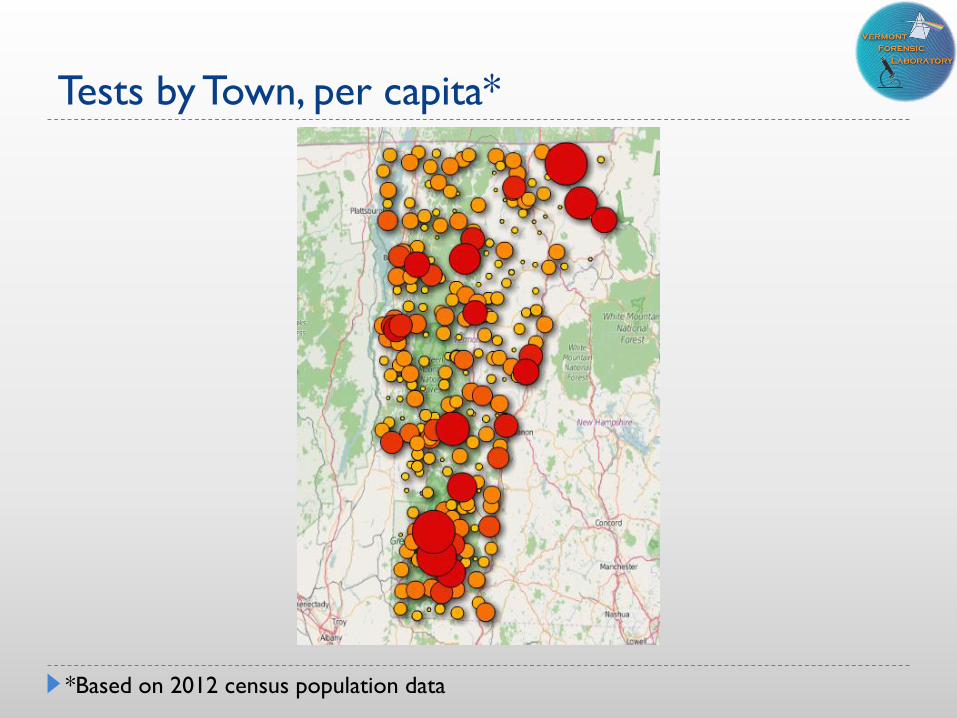
Tests by Town, per capita*
*Based on 2012 census population data
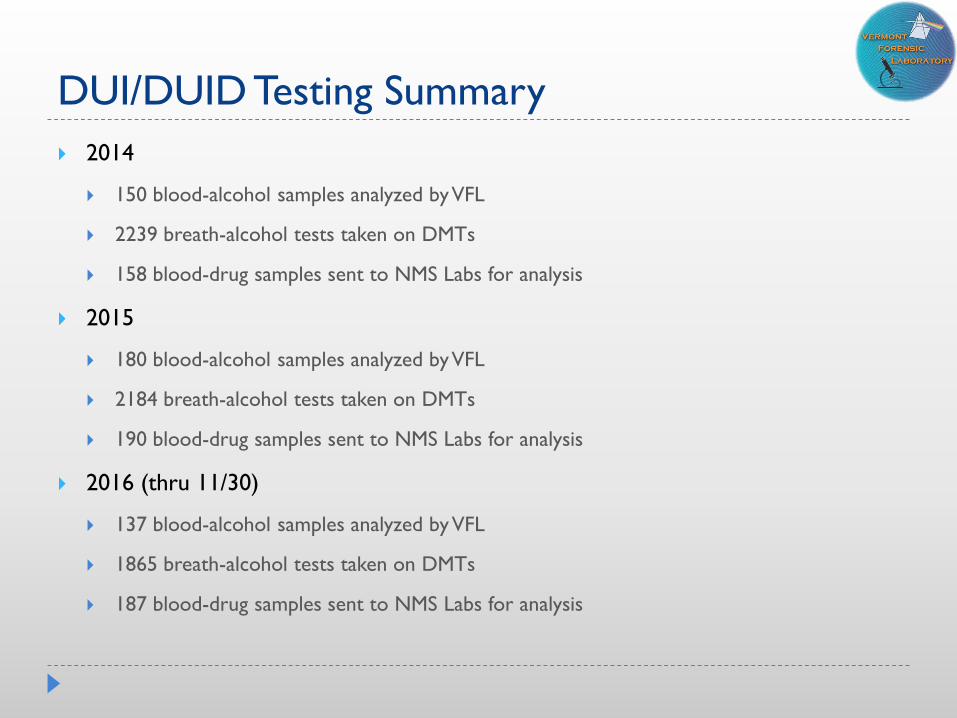
DUI/DUID Testing Summary
2014
150 blood-alcohol samples analyzed by VFL
2239 breath-alcohol tests taken on DMTs
158 blood-drug samples sent to NMS Labs for analysis
2015
180 blood-alcohol samples analyzed by VFL
2184 breath-alcohol tests taken on DMTs
190 blood-drug samples sent to NMS Labs for analysis
2016 (thru 11/30)
137 blood-alcohol samples analyzed by VFL
1865 breath-alcohol tests taken on DMTs
187 blood-drug samples sent to NMS Labs for analysis

Prevalent Drug Classes
Cannabis
Opiates
Synthetic NarcoticsBenzodiazepines
Anti-Depressants
Cocaine
2016
Cannabis
Opiates
Synthetic NarcoticsBenzodiazepines
Anti-Depressants
Non-barbiturates
Cocaine
AmphetaminesOther
2015
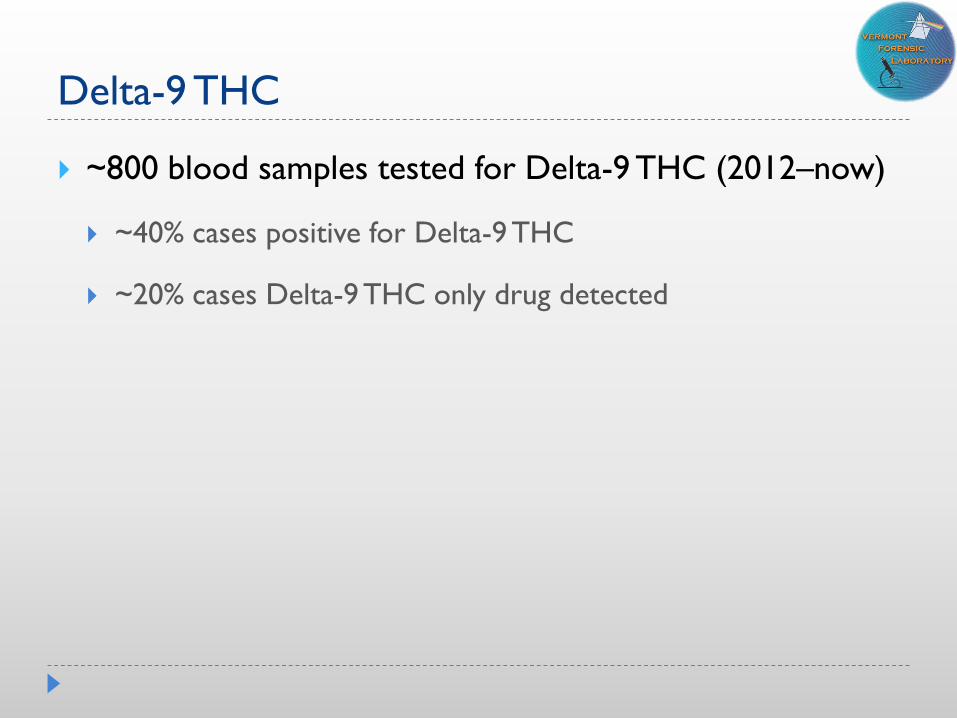
Delta-9 THC
~800 blood samples tested for Delta-9 THC (2012–now)
~40% cases positive for Delta-9 THC
~20% cases Delta-9 THC only drug detected
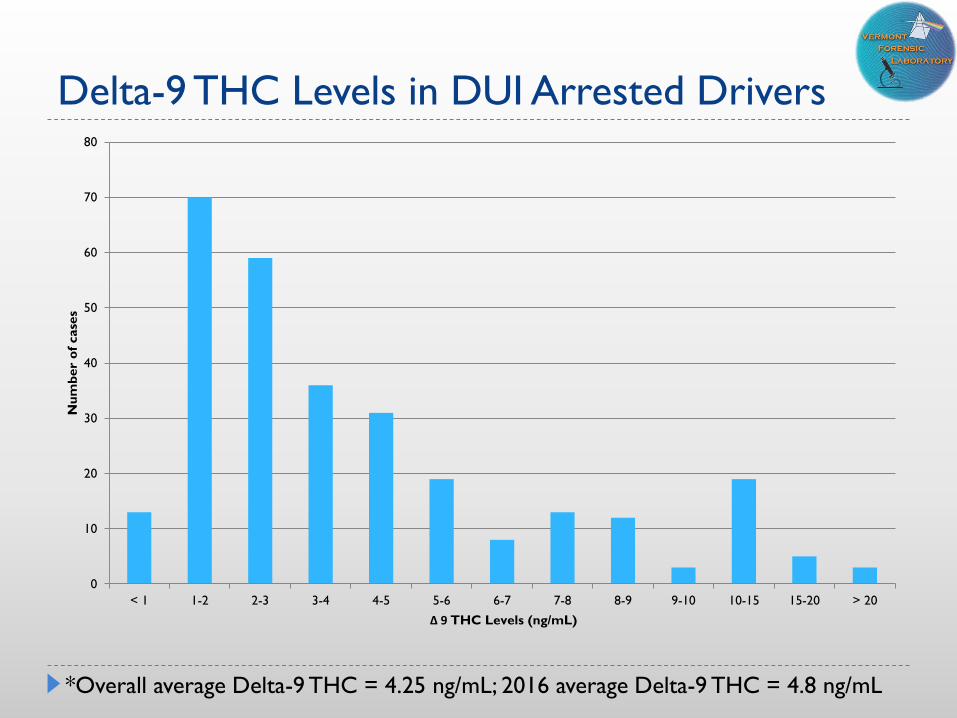
Delta-9 THC Levels in DUI Arrested Drivers
0
10
20
30
40
50
60
70
80
< 1 1-2 2-3 3-4 4-5 5-6 6-7 7-8 8-9 9-10 10-15 15-20 > 20
Nu
mb
er
of
case
s
Δ 9 THC Levels (ng/mL)
*Overall average Delta-9 THC = 4.25 ng/mL; 2016 average Delta-9 THC = 4.8 ng/mL
Poly-Drug Use
Multiple drugs found in a sample
Combined or synergistic effects of substances greatly
increase impairment
60% of 2015/2016 DUI drugs cases contained 2+
substances (does not include ethanol)
Future Directions
Bring blood-drug testing in-house at VFL (2017-2018)
Evaluate additional matrices for use
Oral fluid
Potential roadside drug screening capability (oral fluids)
Further analysis of DMT data
Time of stop (proportion of tests within 2 hours of stop)
