trophic interactions and community structure in the upwelling
TRANSCRIPT
312 (2004) 349–366
www.elsevier.com/locate/jembe
Trophic interactions and community structure in the
upwelling system off Central Chile (33–398S)
Sergio Neira*, Hugo Arancibia
Seccion Pesquerıas, Departamento de Oceanografıa, Universidad de Concepcion,
PO Box 160-C, Concepcion, Chile
Received 1 November 2003; received in revised form 19 July 2004; accepted 28 July 2004
Abstract
Trophic interactions and community structure in the upwelling system off Central Chile (USCCh)
(33–398S) are analyzed using biological and ecological data concerning the main trophic groups and
the Ecopath with Ecosim software version 5.0 (EwE). The model encompasses the fisheries,
cetaceans, sea lion, marine birds, cephalopods, large-sized pelagic fish (sword fish), medium-sized
pelagic fish (horse mackerel, hoki), small-sized pelagic fish (anchovy, common sardine), demersal
fish (e.g. Chilean hake, black conger-eel), benthic invertebrates (red squat lobster, yellow squat
lobster) and other groups such as zooplankton, phytoplankton and detritus. Input data was gathered
from published and unpublished reports and our own estimates. Trophic interactions, system
indicators and food web attributes are calculated using network analysis routines included in EwE.
Results indicate that trophic groups are aligned around four trophic levels (TL) with phytoplankton
and detritus at the TL=1, while large-sized pelagic fish and cetaceans are top predators (TLN4.0). The
fishery is located at an intermediate to low trophic level (TL=2.97), removing about 15% of the
calculated system primary production. The pelagic realm dominates the system, with medium-sized
pelagic fish as the main fish component in biomass, while small-sized pelagic fish dominate total
landings. Chilean hake is by far the main demersal fish component in both, biomass and yield.
Predators consume the greater part of the production of the most important fishery resources,
particularly juvenile stages of Chilean hake. Consequently, mortality by predation is an important
component of total mortality. However, fishery also removes a large fraction of common sardine,
anchovy, horse mackerel, and Chilean hake. The analysis of direct and indirect trophic impacts
reveals that Chilean hake is a highly cannibalistic species. Chilean hake is also an important predator
0022-0981/$ -
doi:10.1016/j.
* Corresp
E-mail add
Journal of Experimental Marine Biology and Ecology
see front matter D 2004 Elsevier B.V. All rights reserved.
jembe.2004.07.011
onding author. Tel.: +56 41 203532, +56 41 204382; fax: +56 41 256571.
ress: [email protected] (S. Neira).
S. Neira, H. Arancibia / J. Exp. Mar. Biol. Ecol. 312 (2004) 349–366350
on anchovy, common sardine, benthic invertebrates, and demersal fish. The fisheries heavily impact
on Chilean hake, common sardine, anchovy, and horse mackerel. Total system biomass (B=476 t
km�2 year�1) and throughput (T=89454 t km�2 year�1) estimated in the USCCh model are in
accordance with models of comparable systems. Considering system attributes derived from network
analysis, the USCCh can be characterized as an immature system, with short trophic chains and low
trophic transfer efficiency. Finally, we suggest that trophic interactions should be considered in stock
assessment and management programs in USCCh. In addition, future research programs should be
carried out in order to understand the ecosystem effects of fishing and trophic control in this highly
productive food web.
D 2004 Elsevier B.V. All rights reserved.
Keywords: Central Chile; Community structure; Ecopath with Ecosim; Ecological network analysis; Trophic
interactions; Upwelling system
1. Introduction
Ecological and economic collapses of many important fisheries in the world (Garcia
and Grainger, 1997) have led scientist and managers of natural resources to call for more
holistic approaches that place fisheries in their ecosystem context (Christensen et al.,
1996). Considering that target and non-target species are embedded in complex trophic
webs, and their population dynamic can be influenced by interspecific relationships and
changes in the physical environment (i.e. Sinclair et al., 1997), it seems obvious that
information on the ecosystem from which target species are extracted can help to reduce
the uncertainty associated to the classical monospecific stock assessment and management
(Botsford et al., 1997).
Therefore, ecosystem models are a necessary and complementary approach to the
classical mono-specific models that have guide fisheries assessment and management,
since they include both the ecological relationships between target and non-target species,
and the environmental impact on fishery resources (Botsford et al., 1997; Walters et al.,
1997).
In this context, the Ecopath with Ecosim software and model (Christensen and Pauly,
1992; Walters et al., 1997) has been widely applied to aquatic ecosystems (see
contributions in Christensen and Pauly, 1993a; www.ecopath.org), allowing quantitative
descriptions of ecosystems (Christensen and Pauly, 1993b) and generalities of marine food
webs (Pauly and Christensen, 1995), especially those in the major upwelling systems
(Jarre et al., 1989; Jarre-Teichman and Christensen, 1998).
The Humboldt Current off Central Chile (33–398S) is a typical eastern boundary
current system, or upwelling ecosystem. It is acknowledged that the high levels of
primary production reported for the upwelling system of Central Chile (USCCh), which
are one of the highest ever reported for the open ocean (Fossing et al., 1995; Daneri et
al., 2000), are influenced by the occurrence of wind-driven coastal upwelling events
(Strub et al., 1998). The primary productivity in this system sustains a remarkably high
fish biomass which, in turns, sustains one of the most productive fisheries worldwide
(FAO, 1995).
S. Neira, H. Arancibia / J. Exp. Mar. Biol. Ecol. 312 (2004) 349–366 351
Industrial and artisan fishing activities, both pelagic and demersal, have been operating
off Central Chile since mid-1950s, reaching a historical landing of about 4.5 million
tonnes in 1994. However, total fishery landings in Central Chile have shown a decreasing
trend in last years, explained by the situation of the main fishery resources, which are
either in their maximum exploitable level, heavily overexploited or recovering from
previous overexploitation (Cubillos et al., 1998; SSP, 2003).
Unfortunately, the most of the ecological research conducted in the USCCh have been
directed to asses individual stock size and diet composition of fishery resources such as
anchovy (Engraulis ringens), common sardine (Strangomera bentincki), horse mackerel
(Trachurus symmetricus) and Chilean hake (Merluccius gayi). Consequently, multispecific
approaches have been only applied to the trophic structure of commercial fish species
(Neira et al., 2004).
The available information indicates that target species could play important ecological
roles as prey and/or predators in USCCh (Arancibia, 1987a, 1991, 1992; Arancibia and
Fuentealba, 1993; Quinones et al., 1997; Miranda et al., 1998; Neira et al., 2004).
However, since this information has not been systematized and summarized in quantitative
ecosystem models, trophic interactions among target and non-target species, matter flows,
community structure, and the ecosystem effects of fishing in this highly productive food
web are still poorly understood.
In this paper, we present results of an ecosystem model applied to the USCCh in the
year 1992, a period in which fish stocks were healthy (not fully exploited) and no mayor
environmental changes have occurred in the system. Consequently, the model is aimed to:
(1) describe community structure, quantifying biomass distribution and energy flows, and
(2) quantify trophic relationships among 22 functional groups.
2. Materials and methods
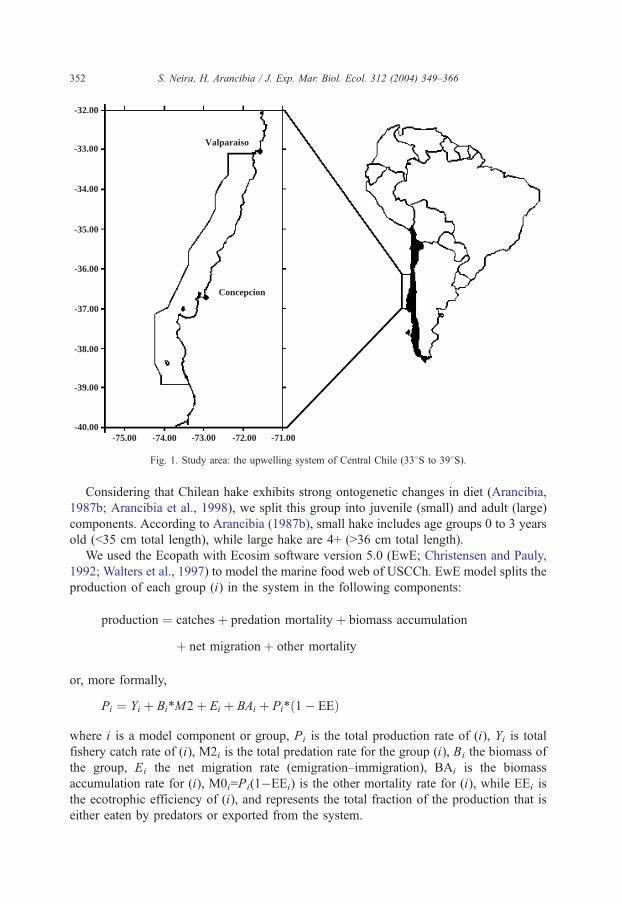
The study area corresponds to the marine zone off Central Chile (33–398S), and
extends up to 30 nautical miles offshore, covering a total area of 50 042 km2 (Fig. 1). The
defined area is the main fishing ground of both, the purse seine and the trawling industrial
fishing fleets. Our analysis covers a 1-year period, 1992.
The model encompasses 22 functional groups, including the main trophic components
of the system with emphasis on fish species, both target and non-target species. The
functional groups are: phytoplankton, zooplankton I (microzooplankton), zooplankton II
(mesozooplankton, represented by copepods), zooplankton III (macrozooplankton,
represented by euphausiids), jellies (salps and jellyfishes), macrobenthos (represented
by red squat lobster Pleuroncodes monodon; yellow squat lobster Cervimunida johni),
anchovy (E. ringens), common sardine (S. bentincki), mesopelagic fish, horse mackerel (T.
symmetricus), hake (M. gayi), pelagic fish I (medium-sized pelagic fish represented by
hoki Macrouronus magellanicus), demersal fish I (benthic feeders species), demersal fish
II (pelagic feeders species), condrichthyans (mainly skates), pelagic fish II (large-sized
pelagic fish represented by swordfish Xiphias gladius), cephalopods (squid Loligo gahi),
sea lion (Otaria flavescens), sea birds (penguins, pelicans, cormorants), cetaceans (killer
whale and dolphins), and detritus.
-32.00
-33.00
-34.00
-35.00
-36.00
-37.00
-38.00
-39.00
-40.00-75.00 -74.00 -73.00 -72.00 -71.00
Valparaiso
Concepcion
Fig. 1. Study area: the upwelling system of Central Chile (338S to 398S).
S. Neira, H. Arancibia / J. Exp. Mar. Biol. Ecol. 312 (2004) 349–366352
Considering that Chilean hake exhibits strong ontogenetic changes in diet (Arancibia,
1987b; Arancibia et al., 1998), we split this group into juvenile (small) and adult (large)
components. According to Arancibia (1987b), small hake includes age groups 0 to 3 years
old (b35 cm total length), while large hake are 4+ (N36 cm total length).
We used the Ecopath with Ecosim software version 5.0 (EwE; Christensen and Pauly,
1992; Walters et al., 1997) to model the marine food web of USCCh. EwE model splits the
production of each group (i) in the system in the following components:
production ¼ catchesþ predation mortality þ biomass accumulation
þ net migrationþ other mortality
or, more formally,
Pi ¼ Yi þ BiTM2þ Ei þ BAi þ PiT 1� EEð Þ
where i is a model component or group, Pi is the total production rate of (i), Yi is total
fishery catch rate of (i), M2i is the total predation rate for the group (i), Bi the biomass of
the group, Ei the net migration rate (emigration–immigration), BAi is the biomass
accumulation rate for (i), M0i=Pi(1�EEi) is the other mortality rate for (i), while EEi is
the ecotrophic efficiency of (i), and represents the total fraction of the production that is
either eaten by predators or exported from the system.
S. Neira, H. Arancibia / J. Exp. Mar. Biol. Ecol. 312 (2004) 349–366 353
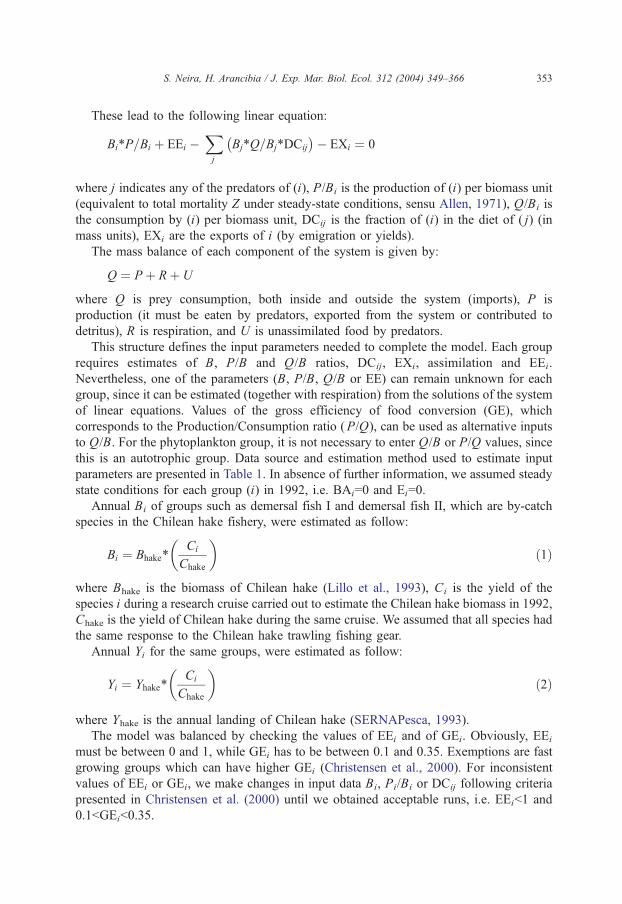
These lead to the following linear equation:
BiTP=Bi þ EEi �Xj
BjTQ=BjTDCij
� �� EXi ¼ 0
where j indicates any of the predators of (i), P/Bi is the production of (i) per biomass unit
(equivalent to total mortality Z under steady-state conditions, sensu Allen, 1971), Q/Bi is
the consumption by (i) per biomass unit, DCij is the fraction of (i) in the diet of ( j) (in
mass units), EXi are the exports of i (by emigration or yields).
The mass balance of each component of the system is given by:
Q ¼ P þ Rþ U
where Q is prey consumption, both inside and outside the system (imports), P is
production (it must be eaten by predators, exported from the system or contributed to
detritus), R is respiration, and U is unassimilated food by predators.
This structure defines the input parameters needed to complete the model. Each group
requires estimates of B, P/B and Q/B ratios, DCij, EXi, assimilation and EEi.
Nevertheless, one of the parameters (B, P/B, Q/B or EE) can remain unknown for each
group, since it can be estimated (together with respiration) from the solutions of the system
of linear equations. Values of the gross efficiency of food conversion (GE), which
corresponds to the Production/Consumption ratio (P/Q), can be used as alternative inputs
to Q/B. For the phytoplankton group, it is not necessary to enter Q/B or P/Q values, since
this is an autotrophic group. Data source and estimation method used to estimate input
parameters are presented in Table 1. In absence of further information, we assumed steady
state conditions for each group (i) in 1992, i.e. BAi=0 and Ei=0.
Annual Bi of groups such as demersal fish I and demersal fish II, which are by-catch
species in the Chilean hake fishery, were estimated as follow:
Bi ¼ BhakeTCi
Chake
� �ð1Þ
where Bhake is the biomass of Chilean hake (Lillo et al., 1993), Ci is the yield of the
species i during a research cruise carried out to estimate the Chilean hake biomass in 1992,
Chake is the yield of Chilean hake during the same cruise. We assumed that all species had
the same response to the Chilean hake trawling fishing gear.
Annual Yi for the same groups, were estimated as follow:
Yi ¼ YhakeTCi
Chake
� �ð2Þ
where Yhake is the annual landing of Chilean hake (SERNAPesca, 1993).
The model was balanced by checking the values of EEi and of GEi. Obviously, EEi
must be between 0 and 1, while GEi has to be between 0.1 and 0.35. Exemptions are fast
growing groups which can have higher GEi (Christensen et al., 2000). For inconsistent
values of EEi or GEi, we make changes in input data Bi, Pi/Bi or DCij following criteria
presented in Christensen et al. (2000) until we obtained acceptable runs, i.e. EEib1 and
0.1bGEib0.35.
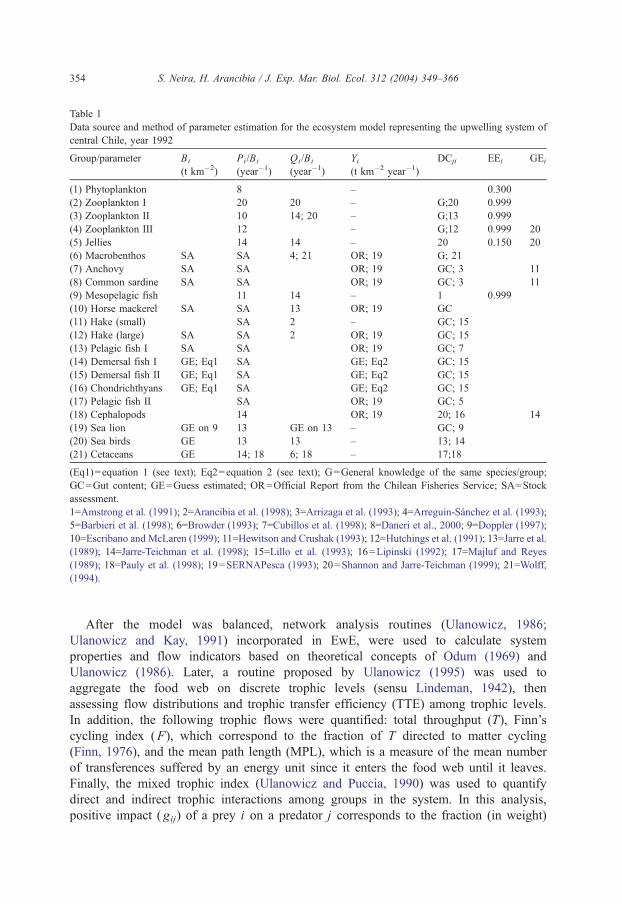
Table 1
Data source and method of parameter estimation for the ecosystem model representing the upwelling system of
central Chile, year 1992
Group/parameter Bi
(t km�2)
Pi/Bi
(year�1)
Qi/Bi
(year�1)
Yi(t km�2 year�1)
DCji EEi GEi
(1) Phytoplankton 8 – 0.300
(2) Zooplankton I 20 20 – G;20 0.999
(3) Zooplankton II 10 14; 20 – G;13 0.999
(4) Zooplankton III 12 – G;12 0.999 20
(5) Jellies 14 14 – 20 0.150 20
(6) Macrobenthos SA SA 4; 21 OR; 19 G; 21
(7) Anchovy SA SA OR; 19 GC; 3 11
(8) Common sardine SA SA OR; 19 GC; 3 11
(9) Mesopelagic fish 11 14 – 1 0.999
(10) Horse mackerel SA SA 13 OR; 19 GC
(11) Hake (small) SA 2 – GC; 15
(12) Hake (large) SA SA 2 OR; 19 GC; 15
(13) Pelagic fish I SA SA OR; 19 GC; 7
(14) Demersal fish I GE; Eq1 SA GE; Eq2 GC; 15
(15) Demersal fish II GE; Eq1 SA GE; Eq2 GC; 15
(16) Chondrichthyans GE; Eq1 SA GE; Eq2 GC; 15
(17) Pelagic fish II SA OR; 19 GC; 5
(18) Cephalopods 14 OR; 19 20; 16 14
(19) Sea lion GE on 9 13 GE on 13 – GC; 9
(20) Sea birds GE 13 13 – 13; 14
(21) Cetaceans GE 14; 18 6; 18 – 17;18
(Eq1)=equation 1 (see text); Eq2=equation 2 (see text); G=General knowledge of the same species/group;
GC=Gut content; GE=Guess estimated; OR=Official Report from the Chilean Fisheries Service; SA=Stock
assessment.
1=Amstrong et al. (1991); 2=Arancibia et al. (1998); 3=Arrizaga et al. (1993); 4=Arreguin-Sanchez et al. (1993);
5=Barbieri et al. (1998); 6=Browder (1993); 7=Cubillos et al. (1998); 8=Daneri et al., 2000; 9=Doppler (1997);
10=Escribano and McLaren (1999); 11=Hewitson and Crushak (1993); 12=Hutchings et al. (1991); 13=Jarre et al.
(1989); 14=Jarre-Teichman et al. (1998); 15=Lillo et al. (1993); 16=Lipinski (1992); 17=Majluf and Reyes
(1989); 18=Pauly et al. (1998); 19=SERNAPesca (1993); 20=Shannon and Jarre-Teichman (1999); 21=Wolff,
(1994).
S. Neira, H. Arancibia / J. Exp. Mar. Biol. Ecol. 312 (2004) 349–366354
After the model was balanced, network analysis routines (Ulanowicz, 1986;
Ulanowicz and Kay, 1991) incorporated in EwE, were used to calculate system
properties and flow indicators based on theoretical concepts of Odum (1969) and
Ulanowicz (1986). Later, a routine proposed by Ulanowicz (1995) was used to
aggregate the food web on discrete trophic levels (sensu Lindeman, 1942), then
assessing flow distributions and trophic transfer efficiency (TTE) among trophic levels.
In addition, the following trophic flows were quantified: total throughput (T), Finn’s
cycling index (F), which correspond to the fraction of T directed to matter cycling
(Finn, 1976), and the mean path length (MPL), which is a measure of the mean number
of transferences suffered by an energy unit since it enters the food web until it leaves.
Finally, the mixed trophic index (Ulanowicz and Puccia, 1990) was used to quantify
direct and indirect trophic interactions among groups in the system. In this analysis,
positive impact ( gij) of a prey i on a predator j corresponds to the fraction (in weight)

S. Neira, H. Arancibia / J. Exp. Mar. Biol. Ecol. 312 (2004) 349–366 355
of each prey i in the stomach content of predator j, while negative impact ( fij) of a
predator j on its prey i corresponds to the fraction of predation caused by predator j on
total predation on prey i.
3. Results
Table 2 summarizes input parameters and some results obtained from the final balanced
run of the USCCh model in 1992. Table 3 shows the diet matrix for predators for the same
run.
The flow diagram for the USCCh model is shown in Fig. 2. Trophic groups are aligned
according with their trophic level (TL), which are not necessarily discrete (sensu
Lindeman, 1942) but fractional (Odum and Heald, 1975; Levine, 1980; Christensen and
Pauly, 1992). Phytoplankton and detritus are located at the base of the food web (TL=1)
while cetaceans and large pelagic fish represent top predators (Table 2, Fig. 2). The system
is dominated by the pelagic domain, which comprises over 90% of the system biomass
(excluding detritus) and the main energy flows (i.e. input flows), as reported for other
upwelling ecosystems (Jarre-Teichman, 1998). Plankton invertebrates (copepods and
euphausiids) are the main consumers in the system. Among fishes, medium-sized fish
(horse mackerel and hoki) are the main component in terms of biomass; these species are
also the main consumers of zooplankton (Table 3, Fig. 2). In turns, small-sized pelagic fish
(common sardine and anchovy) dominates total landings. In the demersal domain, Chilean
hake is by far the dominant group in terms of biomass, consumption, production and
landing (Table 2, Fig. 2).
A comparative analysis of fishing and predatory impacts reveals that predation
mortality (M2) is an important component of total mortality (Z) on Chilean hake (small),
macrobenthos, anchovy, common sardine and cephalopods. Fishing mortality (F) is by far
the main cause of Z in horse mackerel, demersal fish I, and chondrichthyans. Some groups
are heavily impacted by fishing and predation, this is the case of Chilean hake (large)
(Table 2).
Although seven discrete trophic levels resulted from the trophic aggregation routine
(Table 4), the magnitude of flows and biomasses in trophic levels higher than TL III is
practically insignificant when compared with those of TLs I and II, and flows associated to
top predators represented only a small fraction of T (Table 4). In fact, 90% of total system
biomass (BT) is located in TLs I, II and III, while 97% of T is reached at TL II.
Consequently, TTE in USCCh is rather low in higher trophic levels (Table 4), which seems
to be a general rule in marine trophic food webs (Pauly and Christensen, 1995), especially
in upwelling ecosystems (Jarre-Teichman, 1998; Jarre-Teichman and Christensen, 1998).
BT (excluding detritus) corresponded to 476 t km�2, while T corresponded to 89,454 t km2
year�1, then locating USCCh in an intermediate position in terms of flows per area unit
when compared with data presented by Christensen and Pauly (1993b) and Jarre-Teichman
(1998).
Table 5 summarizes global attributes of USCCh. The low Primary Production/
Respiration ratio (PP/R=2.559) allows to characterize USCCh as an immature ecosystem
(sensu Odum, 1969), where more energy is fixed than respired. Accordingly, Primary
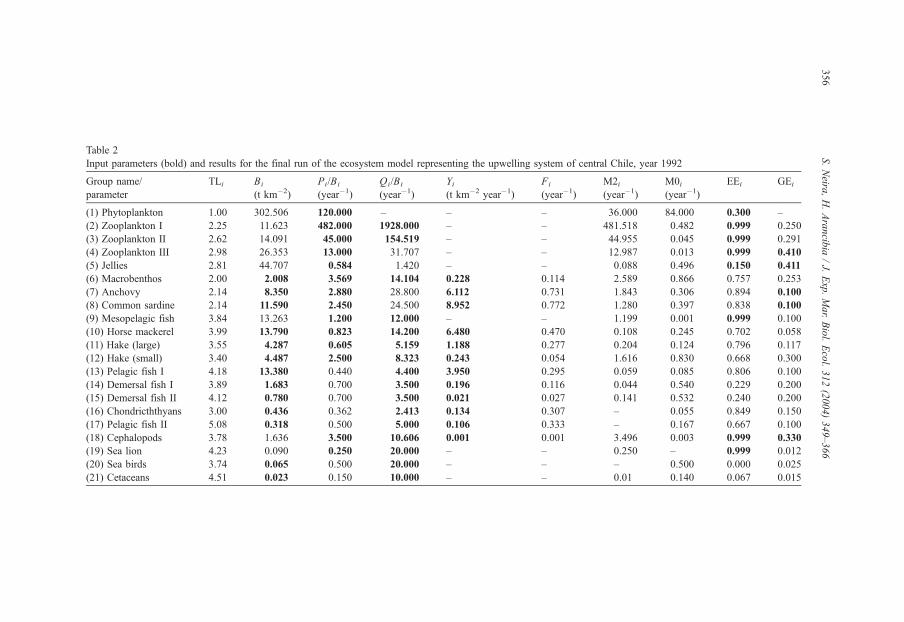
Table 2
Input parameters (bold) and results for the final run of the ecosystem model representing the upwelling system of central Chile, year 1992
Group name/
parameter
TLi Bi
(t km�2)
Pi/Bi
(year�1)
Qi/Bi
(year�1)
Yi(t km�2 year�1)
Fi
(year�1)
M2i(year�1)
M0i(year�1)
EEi GEi
(1) Phytoplankton 1.00 302.506 120.000 – – – 36.000 84.000 0.300 –
(2) Zooplankton I 2.25 11.623 482.000 1928.000 – – 481.518 0.482 0.999 0.250
(3) Zooplankton II 2.62 14.091 45.000 154.519 – – 44.955 0.045 0.999 0.291
(4) Zooplankton III 2.98 26.353 13.000 31.707 – – 12.987 0.013 0.999 0.410
(5) Jellies 2.81 44.707 0.584 1.420 – – 0.088 0.496 0.150 0.411
(6) Macrobenthos 2.00 2.008 3.569 14.104 0.228 0.114 2.589 0.866 0.757 0.253
(7) Anchovy 2.14 8.350 2.880 28.800 6.112 0.731 1.843 0.306 0.894 0.100
(8) Common sardine 2.14 11.590 2.450 24.500 8.952 0.772 1.280 0.397 0.838 0.100
(9) Mesopelagic fish 3.84 13.263 1.200 12.000 – – 1.199 0.001 0.999 0.100
(10) Horse mackerel 3.99 13.790 0.823 14.200 6.480 0.470 0.108 0.245 0.702 0.058
(11) Hake (large) 3.55 4.287 0.605 5.159 1.188 0.277 0.204 0.124 0.796 0.117
(12) Hake (small) 3.40 4.487 2.500 8.323 0.243 0.054 1.616 0.830 0.668 0.300
(13) Pelagic fish I 4.18 13.380 0.440 4.400 3.950 0.295 0.059 0.085 0.806 0.100
(14) Demersal fish I 3.89 1.683 0.700 3.500 0.196 0.116 0.044 0.540 0.229 0.200
(15) Demersal fish II 4.12 0.780 0.700 3.500 0.021 0.027 0.141 0.532 0.240 0.200
(16) Chondricththyans 3.00 0.436 0.362 2.413 0.134 0.307 – 0.055 0.849 0.150
(17) Pelagic fish II 5.08 0.318 0.500 5.000 0.106 0.333 – 0.167 0.667 0.100
(18) Cephalopods 3.78 1.636 3.500 10.606 0.001 0.001 3.496 0.003 0.999 0.330
(19) Sea lion 4.23 0.090 0.250 20.000 – – 0.250 – 0.999 0.012
(20) Sea birds 3.74 0.065 0.500 20.000 – – – 0.500 0.000 0.025
(21) Cetaceans 4.51 0.023 0.150 10.000 – – 0.01 0.140 0.067 0.015
S.Neira
,H.Arancib
ia/J.
Exp.Mar.Biol.Ecol.312(2004)349–366
356
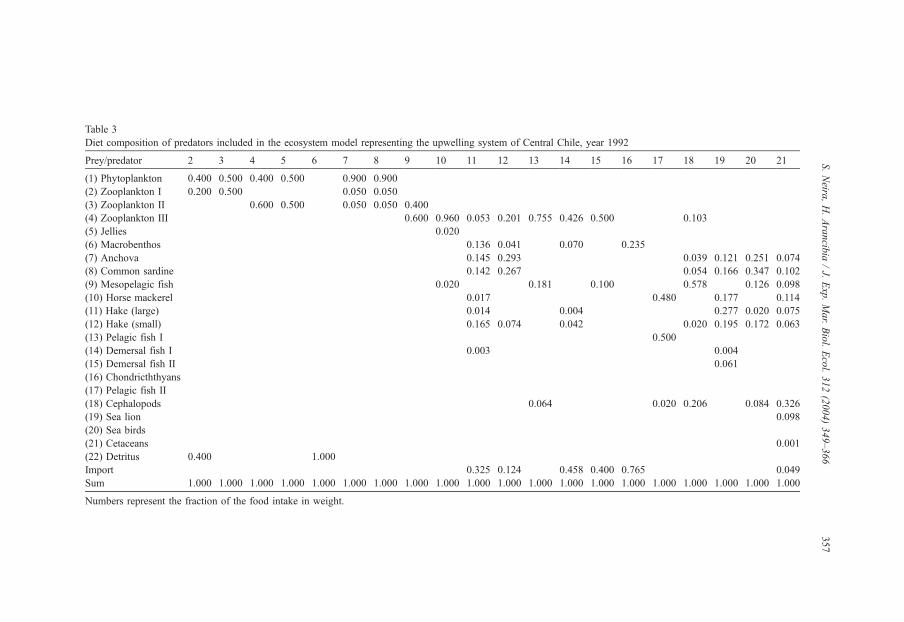
Table 3
Diet composition of predators included in the ecosystem model representing the upwelling system of Central Chile, year 1992
Prey/predator 2 3 4 5 6 7 8 9 10 11 12 13 14 15 16 17 18 19 20 21
(1) Phytoplankton 0.400 0.500 0.400 0.500 0.900 0.900
(2) Zooplankton I 0.200 0.500 0.050 0.050
(3) Zooplankton II 0.600 0.500 0.050 0.050 0.400
(4) Zooplankton III 0.600 0.960 0.053 0.201 0.755 0.426 0.500 0.103
(5) Jellies 0.020
(6) Macrobenthos 0.136 0.041 0.070 0.235
(7) Anchova 0.145 0.293 0.039 0.121 0.251 0.074
(8) Common sardine 0.142 0.267 0.054 0.166 0.347 0.102
(9) Mesopelagic fish 0.020 0.181 0.100 0.578 0.126 0.098
(10) Horse mackerel 0.017 0.480 0.177 0.114
(11) Hake (large) 0.014 0.004 0.277 0.020 0.075
(12) Hake (small) 0.165 0.074 0.042 0.020 0.195 0.172 0.063
(13) Pelagic fish I 0.500
(14) Demersal fish I 0.003 0.004
(15) Demersal fish II 0.061
(16) Chondricththyans
(17) Pelagic fish II
(18) Cephalopods 0.064 0.020 0.206 0.084 0.326
(19) Sea lion 0.098
(20) Sea birds
(21) Cetaceans 0.001
(22) Detritus 0.400 1.000
Import 0.325 0.124 0.458 0.400 0.765 0.049
Sum 1.000 1.000 1.000 1.000 1.000 1.000 1.000 1.000 1.000 1.000 1.000 1.000 1.000 1.000 1.000 1.000 1.000 1.000 1.000 1.000
Numbers represent the fraction of the food intake in weight.
S.Neira
,H.Arancib
ia/J.
Exp.Mar.Biol.Ecol.312(2004)349–366
357
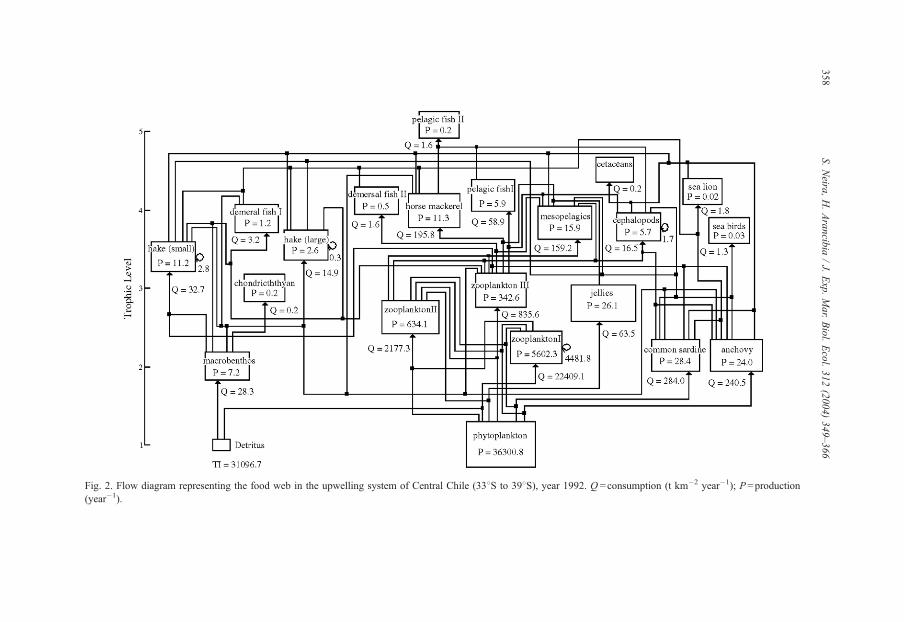
Fig. 2. Flow diagram representing the food web in the upwelling system of Central Chile (338S to 398S), year 1992. Q =consumption (t km�2 year�1); P=production
(year�1).
S.Neira
,H.Arancib
ia/J.
Exp.Mar.Biol.Ecol.312(2004)349–366
358
Table 4
Summary of total biomass (B), throughput (T ) and trophic transfer efficiency (TTE) among discrete trophic levels
in the ecosystem model representing the upwelling system of Central Chile, year 1992
TL B (t km�2 year�1) B (%) T (t km�2 year�1) T (%) TTE
VII 0.017 3.6�10�5 0.092 5�10�4 6.0
VI 0.826 0.2 4.538 5�10�3 7.4
V 12.468 3 115.582 0.13 6.7
IV 36.542 8 439.867 0.5 26.8
III 51.590 11 1614.490 1.8 27.4
II 71.517 15 19882.180 22 8.1
I 302.506 64 67397.500 75
Total 475.466 89454.240
In addition, biomass and throughput per discrete trophic level are expressed as percentage of total system biomass
and total system throughput.
S. Neira, H. Arancibia / J. Exp. Mar. Biol. Ecol. 312 (2004) 349–366 359
Production/Biomass ratio (PP/B=76.348) is also high. FCI=8.97%, which implies a low
value for system maturity, is in accordance with data presented by Christensen and Pauly
(1993b) for upwelling ecosystems.
The MPL is low in USCCh (MPL=2.56) which is also a characteristic feature of
upwelling ecosystems (Jarre-Teichman and Christensen, 1998). The above results also
suggest an immature ecosystem with low conectance index (0.17), where energy seems
to be inefficiently retained. Finally, mean TTE (18%) suggest an intermediate to low
energy transfer efficiency, which is characteristic of immature ecosystems (Christensen
Table 5
Ecosystem indicators describing the upwelling system of Central Chile (33–398S), year 1992
Indicator Value Units
Sum of all consumption 26,543.420 t km�2 year�1
Sum of all respiration flows 14,185.680 t km�2 year�1
Sum of all flows to detritus 31,096.740 t km�2 year�1
Sum of all production 43,020.000 t km�2 year�1
Trophic level of fishery 2.97
Calculated total net primary production (TPP) 36,300.760 t km�2 year�1
Total primary production/total respiration 2.559
Net system production 22,115.080 t km�2 year�1
Primary production/total biomass 76.348
Total biomass/total throughput 0.005
Primary production required to sustain
fishery landing (PPR)
2385.500 t km�2 year�1
PPR as percentage of TPP 15.210
Finn’s cycling index 8.97 % of T
Finn’s mean path length 2.587
Conectance index 0.170
System omnivory index 0.337
Mean energy transfer efficiency among
discrete trophic levels
18.000
Total catches 27.601 t km�2 year�1
S. Neira, H. Arancibia / J. Exp. Mar. Biol. Ecol. 312 (2004) 349–366360
and Pauly, 1993b). The fishery had a trophic role equivalent to a predator with TL=2.97,
and the primary production required to sustain fishery landing (PPR) in USCCh, in
1992, was estimated in 2386 t km�2 year�1, or 15.2% of total primary production
calculated (Table 5).
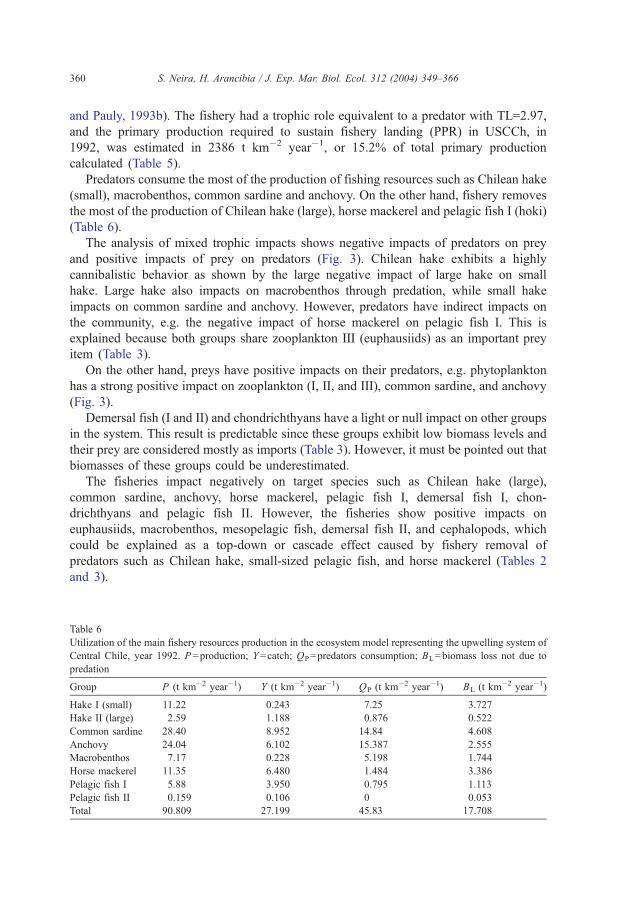
Predators consume the most of the production of fishing resources such as Chilean hake
(small), macrobenthos, common sardine and anchovy. On the other hand, fishery removes
the most of the production of Chilean hake (large), horse mackerel and pelagic fish I (hoki)
(Table 6).
The analysis of mixed trophic impacts shows negative impacts of predators on prey
and positive impacts of prey on predators (Fig. 3). Chilean hake exhibits a highly
cannibalistic behavior as shown by the large negative impact of large hake on small
hake. Large hake also impacts on macrobenthos through predation, while small hake
impacts on common sardine and anchovy. However, predators have indirect impacts on
the community, e.g. the negative impact of horse mackerel on pelagic fish I. This is
explained because both groups share zooplankton III (euphausiids) as an important prey
item (Table 3).
On the other hand, preys have positive impacts on their predators, e.g. phytoplankton
has a strong positive impact on zooplankton (I, II, and III), common sardine, and anchovy
(Fig. 3).
Demersal fish (I and II) and chondrichthyans have a light or null impact on other groups
in the system. This result is predictable since these groups exhibit low biomass levels and
their prey are considered mostly as imports (Table 3). However, it must be pointed out that
biomasses of these groups could be underestimated.
The fisheries impact negatively on target species such as Chilean hake (large),
common sardine, anchovy, horse mackerel, pelagic fish I, demersal fish I, chon-
drichthyans and pelagic fish II. However, the fisheries show positive impacts on
euphausiids, macrobenthos, mesopelagic fish, demersal fish II, and cephalopods, which
could be explained as a top-down or cascade effect caused by fishery removal of
predators such as Chilean hake, small-sized pelagic fish, and horse mackerel (Tables 2
and 3).
Table 6
Utilization of the main fishery resources production in the ecosystem model representing the upwelling system of
Central Chile, year 1992. P=production; Y=catch; QP=predators consumption; BL=biomass loss not due to
predation
Group P (t km�2 year�1) Y (t km�2 year�1) QP (t km�2 year�1) BL (t km�2 year�1)
Hake I (small) 11.22 0.243 7.25 3.727
Hake II (large) 2.59 1.188 0.876 0.522
Common sardine 28.40 8.952 14.84 4.608
Anchovy 24.04 6.102 15.387 2.555
Macrobenthos 7.17 0.228 5.198 1.744
Horse mackerel 11.35 6.480 1.484 3.386
Pelagic fish I 5.88 3.950 0.795 1.113
Pelagic fish II 0.159 0.106 0 0.053
Total 90.809 27.199 45.83 17.708
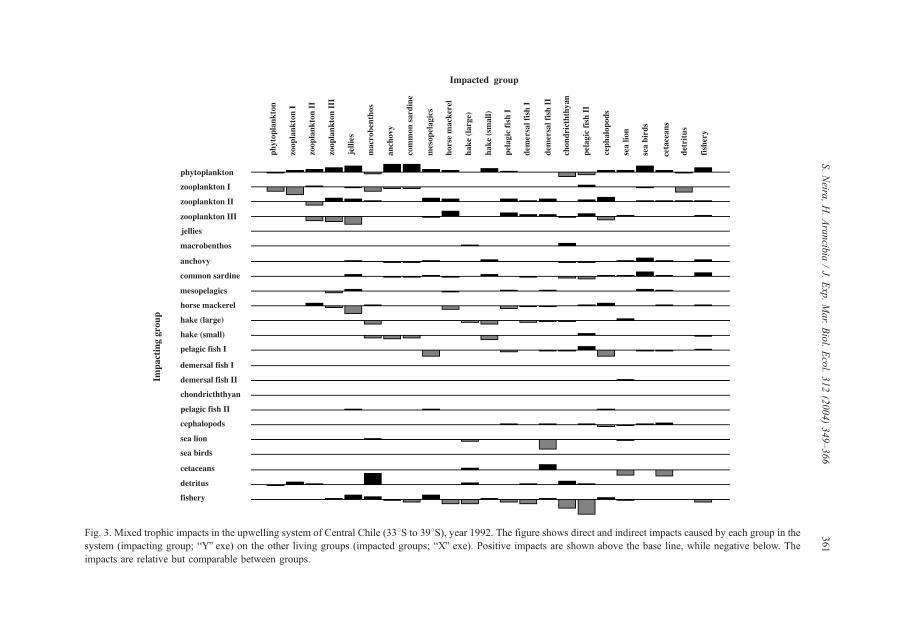
Fig. 3. Mixed trophic impacts in the upwelling system of Central Chile (338S to 398S), year 1992. The figure shows direct and indirect impacts caused by each group in the
system (impacting group; bYQ exe) on the other living groups (impacted groups; bXQ exe). Positive impacts are shown above the base line, while negative below. The
impacts are relative but comparable between groups.
S.Neira
,H.Arancib
ia/J.
Exp.Mar.Biol.Ecol.312(2004)349–366
361
S. Neira, H. Arancibia / J. Exp. Mar. Biol. Ecol. 312 (2004) 349–366362
4. Discussion
Although recent reports have analyzed trophic relationships of commercial fish species
in Central Chile (Neira et al., 2004), this is the first ecosystem model applied to the
USCCh. In this model, we assumed steady-state and mass-balance conditions for the
system during 1992. In this respect, we consider that a 1-year period is as a proper time
scale, i.e. it is long enough to collect all the necessary data input, and short enough to
avoid the impacts of mayor environmental changes in the system, as those related to
regimen shift and/or El Nino Southern Oscillation events (Yanez et al., 1992; Gutierrez et
al., 2001; Arcos et al., 2001). However, intra-annual variability in the system (Strub et al.,
1998) was not included in the modeling due to monthly and/or seasonal estimates for the
required input data are lacking. Therefore, resulting rates and flows must be analyzed
under the above restriction.
The USCCh can be characterized as an immature system, in terms of structure and
flows (sensu Odum, 1969), with low trophic transfer efficiency, short food chains and low
matter cycling (Table 5), which is consistent with previous reports for upwelling
ecosystems (Jarre-Teichman and Christensen, 1998). In this analysis we assumed that, in
the USCCh, energy is predominantly trespassed through the classic food web. It means,
short food chains where big-sized phytoplankton cells are efficiently grazed by
zooplankton, which, in terms, is predated by fishes. However, recent evidence indicates
that an important fraction of primary production in USCCh could be deviated to the
microbial food web (Pacheco and Troncoso, 1998). Therefore, future research effort
should be directed to incorporate this important group into the modeling of matter and
energy flows in USCCh.
In upwelling ecosystems, both euphausiids and small-sized pelagic fish play
important roles as biological components, distributing primary production towards
intermediate and high trophic levels, where carnivorous fish, birds, mammals and the
fisheries are located (Pillar et al., 1992; Cury et al., 2000). In the USCCh, an important
fraction of the primary production is transferred through common sardine, anchovy and
euphausiids toward higher trophic levels to predators such as Chilean hake and horse
mackerel, which are important fishery resources (Fig. 2; Table 2). Although the biomass
of mesopelagic fish and jellies was estimated by the model, it is likely that those groups
exhibit high biomass levels in the system. Unfortunately, basic knowledge on these
groups and their role in this food web is poorly understood in USCCh, and it should be
studied further.
In marine ecosystems, it is expected that changes in fish biomass regulate, by cascade
effect, both production and consumption on lower trophic levels (Carpenter and Kitchell,
1988). According to Cury et al. (2000), in upwelling systems there is a negative
relationship between zooplankton abundance (prey) and small-sized pelagic fish
(predators). However, in the USCCh this kind of top-down control has not been proved
and it is unlikely to occur due to common sardine and anchovy seem to feed almost
exclusively on phytoplankton (Arrizaga, 1983; Arrizaga et al., 1993).
However, predation of horse mackerel on zooplankton can be considered an example of
top-down control in the USCCh (Cury et al., 2000). In fact, Quinones et al. (1997)
reported a strong local impact of horse mackerel associations on euphausiids abundance.

S. Neira, H. Arancibia / J. Exp. Mar. Biol. Ecol. 312 (2004) 349–366 363
Another indirect evidence of top-down control in the USCCh could be the positive impacts
of fishery on zooplankton, macrobenthos, mesopelagic fish, demersal fish II, and
cephalopods, due to fishing removal of predators such as Chilean hake and horse
mackerel (Tables 2 and 3).
Although this is the first ecosystem model constructed for the USCCh, this kind of
analysis have been widely applied to upwelling ecosystems, allowing to local descriptions
(Jarre et al., 1991; Jarre-Teichman et al., 1998) and general patterns (Jarre-Teichman,
1998; Jarre-Teichman and Christensen, 1998). Unlike previously analyzed upwelling
ecosystems characteristically dominated by one species of clupeids (Jarre-Teichman and
Christensen, 1998; Cury et al., 2000), the USCCh is dominated by medium sized pelagic
fish (horse mackerel and hoki) in terms of biomass. The importance of horse mackerel and
hoki in the USCCh in 1992, was reflected in the fact that they supported 6% of BT
(without including detritus) and 38% of total landing.
Predation is the main component of total mortality in the USCCh (Table 2). In marine
ecosystems, predatory mortality is higher than fishing mortality, even in heavily
exploited ecosystems such as the Peruvian upwelling ecosystem (Jarre et al., 1991), and
also the upwelling ecosystems of Namibia, California, Norwest Africa (Jarre-Teichman,
1998), and the North Sea (Bax, 1991). In the USCCh, fishing resources are heavily
affected by predation. This is not the case of horse mackerel, for which the purse-seine
fleet seems to be the main predator, as pointed out by Quinones et al. (1997) and Neira
et al. (2004).
According with our results, the fishery removes a large fraction of the production
of target and non-target species (Table 2), which correspond to 15% of total primary
production in USCCh. These results are in agreement with previous reports for
comparable ecosystems (Jarre-Teichman, 1998). However, PPR in USCCh in 1992
was lower than the global estimated inferred by Pauly and Christensen (1995) for
upwelling ecosystems (25%). This result could be explained by the high levels of
primary production informed for the study area, some of them representing the
highest values informed for the open ocean (Fossing et al., 1995; Daneri et al.,
2000).
Finally, we suggest that trophic interactions should be considered in stock assessment
and management programs in USCCh, since predation could modulate population
dynamic of the most important fishery resources. In addition, future research programs
should be carried out in order to understand the ecosystem effects of fishing and trophic
control in this highly productive food web.
Acknowledgements
We are grateful to the EU INCO-DC project bPlacing fisheries in their ecosystem
contextQ and a grant from IRD IDYLE project, through which funding was provided for a
workshop in Brazil (December 1998) and South Africa (November 2002), where authors
were able to improve the model, and interpret results. We also thank Dr. Villy Christensen,
Dr. Francisco Arreguın-Sanchez and an anonymous referee for their valuable comments on
an earlier version of this paper. [RW]
S. Neira, H. Arancibia / J. Exp. Mar. Biol. Ecol. 312 (2004) 349–366364
References
Allen, K.R., 1971. Relation between production and biomass. J. Fish. Res. Board Can. 28, 1573–1581.
Amstrong, M.J., James, A.G., Valdes Szeinfeld, S., 1991. Estimates of annual consumption of food by anchovy
and other pelagic fish species off South Africa during the period 1984–1998. S. Afr. J. Mar. Sci. 11, 251–266.
Arancibia, H., 1987. Alimentacion de peces co-ocurrentes en la pesquerıa de Pleuroncodes monodon Milne
Edwards. Investig. Pesq. (Chile) 34, 113–128.
Arancibia, H., 1987b. On the application of multivariate analysis in the determination of bontogenetic trophics
unitsQ in the Chilean hake, Merluccius gayi (Guichenot, 1848). ICES Demersal Fish Committee, Ref.
Statistics Committee, C.M. 1987/G:6.
Arancibia, H., 1991. Analisis ecologico-pesquero del recurso langostino colorado (Pleuroncodes monodon) y su
interaccion con merluza comun (Merluccius gayi) y lenguado de ojos grandes (Hipoglossina macrops). Biol.
Pesq. (Chile) 20, 37–48.
Arancibia, H., 1992. Distribution patterns of the demersal fish assemblage off Central Chile. Biol. Pesq. (Chile)
21, 43–53.
Arancibia, H., Catrilao, M., Farıas, B., 1998. Evaluacion de la demanda de alimento en merluza comun y analisis
de su impacto en pre-reclutas. Informe Final Proyecto FIP, vol. 95-17. Universidad de Concepcion. 98 pp.
Arancibia, H., Fuentealba, M., 1993. Analisis de la alimentacion de Merluccius gayi gayi (Guichenot, 1848) de
Chile central, en el largo plazo. Biol. Pesq. (Chile) 22, 5–11.
Arcos, D.F., Cubillos, L.A., Nunez, S.P., 2001. The jack mackerel fishery and El Nino 1997–98 effects off Chile.
Prog. Oceanogr. 49 (1–4), 597–617.
Arreguın-Sanchez, F., Seijo, J.C., Valero-Pacheco, E., 1993. An application of Ecopath to the Continental Shelf
ecosystem of Yucatan, Mexico. In: Christensen, V., Pauly, D. (Eds.), Trophic Models of Aquatic Ecosystems,
ICLARM Conf. Prod. 26, Manila, pp. 269–278.
Arrizaga, M.A., 1983. Seasonal food variation in the common sardine Clupea (Strangomera bentincki) Norman,
1936 (Pisces, Clupeidae) in Bio-Bio Region, Chile. Bol. Soc. Biol. Concepcion (Chile) 54, 7–26.
Arrizaga, A., Fuentealba, M., Espinoza, C., Chong, J., Oyarzun, C., 1993. Trophic habits of two pelagic fish
species: Strangomera bentincki (Norman, 1936) and Engraulis ringens (Jenyns, 1842), in the littoral of the
Biobio Region, Chile. Bol. Soc. Biol. Concepcion (Chile) 64, 27–35.
Barbieri, M.A., Canales, C., Correa, V., Donoso, M., Gonzalez, A., Leiva, B., Montiel, A., Yanez, E., 1998.
Development and present State of the Swordfish,Xiphias gladius, fishery in Chile. In: Barret, I., Sosa-Nishizaki,
O., Bartoo, N. (Eds.), Biology and Fisheries of Swordfish, Xiphias gladius. Papers from the International
Symposium on Pacific Swordfish, U.S. Department of Commerce, Seattle, Washington, pp. 1–10.
Bax, N.J., 1991. A comparison of the fish biomass flow to fish, fisheries, and marine mammals in six marine
ecosystems. ICES Mar. Sci. Symp. 193, 217–224.
Botsford, L., Castilla, J.C., Peterson, C.H., 1997. The management of fisheries and marine ecosystems. Science
277, 509–515.
Browder, J.A., 1993. A pilot model of the Gulf of Mexico Continental Shelf. In: Christensen, V., Pauly, D. (Eds.),
Trophic Models of Aquatic Ecosystems, ICLARM Conf. Prod. 26, Manila, pp. 279–284.
Carpenter, S.R., Kitchell, J.F., 1988. Strong manipulations and complex interactions: consumer control of lake
productivity. BioScience 38, 764–769.
Christensen, V., Pauly, D., 1992. ECOPATH II. A software for balancing steady state ecosystem models and
calculating network characteristics. Ecol. Model. 61, 169–185.
Christensen, V., Pauly, D., (Eds.) 1993a. Trophic Models of Aquatic Ecosystems. ICLARM Conf. Prod. 26,
Manila. 390 pp.
Christensen, V., Pauly, D., 1993b. Flow characteristics of aquatic ecosystems. In: Christensen, V., Pauly, D.
(Eds.), Trophic Models of Aquatic Ecosystems. ICLARM Conf. Prod. 26, Manila, pp. 338–352.
Christensen, N.L., Bartuska, A.M., Brown, J.M., Carpenter, S., D’Antonio, C., Francis, R., Franklin, J.F.,
MacMahon, J.A., Noss, R.F., Parsons, D.J., Peterson, C.H., Turner, M.G., Woodmansee, R.G., 1996. The
report of the Ecological Society of America Committee on the Scientific Basis for Ecosystem Management.
Ecol. Appl. 6 (3), 665–691.
Christensen, V., Walters, C.J., Pauly, D., 2000. Ecopath with Ecosim: A user’s guide. Fisheries Centre, University
of British Columbia, Vancouver, Canada and ICLARM, Penang, Malaysia. 130 pp.
S. Neira, H. Arancibia / J. Exp. Mar. Biol. Ecol. 312 (2004) 349–366 365
Cubillos, L., Hernandez, A., Vilugron, L., Miranda, L., Alarcon, R., Pino, C., Sepulveda, A., Vasquez, G., 1998.
Estudio Biologico pesquero de merluza de cola en el area de distribucion de la pesquerıa pelagica centro-sur.
Informe Final Proyecto FIP N8, vol. 96-19. 158 pp.
Cury, P., Bakun, A., Crawford, R.J.M., Jarre, A., Quinones, R., Shannon, L.J., Verheye, H.M., 2000. Small
pelagics in upwelling systems: patterns of interaction and structural changes in bwasp-waistQ ecosystems.
ICES J. Mar. Sci. 57, 145–155.
Daneri, G., Dellarossa, V., Quinones, R., Jacob, B., Montero, P., Ulloa, O., 2000. Primary production and
community respiration in the Humboldt Current System off Chile and associated oceanic areas. Mar. Ecol.,
Prog. Ser. 197, 41–49.
Doppler, 1997. Censo poblacional del lobo marino comun en el litoral de la V a IX Regiones. Informe Final
Proyecto FIP-IT/96-51. 218 pp.
Escribano, R., McLaren, I., 1999. Production of Calanus chilensis in the upwelling area of Antofagasta, northern
Chile. Mar. Ecol., Prog. Ser. 177, 147–156.
FAO, 1995. World fishery production. Supplement of the FAO Yearbook of Fishery Statistics, vol. 76. 35 pp.
Finn, J.T., 1976. Measures of ecosystem structure and function derived from analysis of flows. J. Theor. Biol. 56,
363–380.
Fossing, H., Gallardo, V.A., Jbrgensen, B.B., Hqttel, M., Nielsen, L.P., Schulz, H., Canfield, D.E., Forster,
S., Glud, R.N., Gundersen, J.K., Kqver, J., Ramsing, N.B., Teske, A., Thamdrup, B., Ulloa, O., 1995.
Concentration and transport of nitrate by the mat-forming sulphur bacterium Thioploca. Nature 374,
713–715.
Garcia, S.M., Grainger, R., 1997. Fisheries management and sustainability: a new perspective of an old
problem? In: Hancock, D.A., Smith, D.C., Grant, A., Beumer, J.P. (Eds.), Developing and Sustaining World
Fisheries Resources. The State of Science and Management. 2nd World Fisheries Congress. CSIRO,
Australia, pp. 631–654.
Gutierrez, D., Gallardo, V.A., Mayor, S., Neira, C., Vasquez, C., Sellanes, J., Rivas, M., Soto, A., Carrasco, F.,
Baltasar, D., 2001. Effects of dissolved oxygen and fresh inorganic matter on the bioturbation potential of
macrofauna in sublittoral sediments off Central Chile during the 1997/1998 El Nino. Mar. Ecol., Prog. Ser.
202, 81–99.
Hewitson, J., Crushak, R.A., 1993. Production and consumption by planktivorous fish in the northern Benguela
ecosystem in the 1980s. S. Afr. J. Mar. Sci. 13, 1031–1050.
Hutchings, L., Pillar, S.C., Verheye, H., 1991. Estimates of standing stock, production and consumption of meso-
and macrozooplankton in the Benguela ecosystem. S. Afr. J. Mar. Sci. 11, 499–512.
Jarre, A., Muck, P., Pauly, D., 1989. Interactions between fish stocks in the Peruvian upwelling ecosystem. ICES
Mar. Sci. Symp. (Paper No. 27, ICLARM Contribution No. 563, 23 pp.).
Jarre, A., Muck, P., Pauly, D., 1991. Two approaches for modeling fish stock interactions in the Peruvian
upwelling ecosystem. ICES J. Mar. Sci. 193, 171–184.
Jarre-Teichman, A., 1998. The potential role of mass balance models for the management of upwelling
ecosystems. Ecol. Appl. 8 (1), 93–103.
Jarre-Teichman, A., Christensen, V., 1998. Comparative modelling of trophic flows in four large upwelling
ecosystems: global versus local effects. In: Durand, M., Cury, P., Mendelson, R., Roy, C., Bakun, A., Pauly,
D. (Eds.), Global Versus Local Changes in Upwelling Systems. Edition de L’Orstom, pp. 423–443.
Jarre-Teichman, A., Shannon, L., Moloney, C., 1998. Comparing trophic flows in the Southern Benguela to those
in other upwelling ecosystems. In: Pillar, S.C., Moloney, C.L., Payne, A.I.L., Shillington, F.A. (Eds.),
Benguela Dynamics, S. Afr. J. Mar. Sci., vol. 19, pp. 391–414.
Levine, S., 1980. Several measures of trophic structure applicable to complex food webs. J. Theor. Biol. 83,
195–207.
Lillo, S., Giakoni, I., Paillaman, A., Paya, I., Mora, S., Cerda, C., Blanco, J., Arancibia, H., 1993. Evaluacion
directa del stock de merluza comun en la zona centro-sur. Informe Final del Proyecto FIP 93/12. Instituto de
Fomento Pesquero/Instituto de Investigacion Pesquera. 122 pp.+62 figs.
Lindeman, R.L., 1942. The trophic–dynamic aspect of ecology. Ecology 23, 399–418.
Lipinski, M.R., 1992. Cephalopods and the Benguela ecosystem: trophic relationships and impact. 791–802. In:
Payne, A.J.L., Brink, K.H., Mann, K.H., Hilborn, R. (Eds.), Benguela Trophic Functioning. S. Afr. J. Mar.
Sci., vol. 12, pp. 791–802.
S. Neira, H. Arancibia / J. Exp. Mar. Biol. Ecol. 312 (2004) 349–366366
Majluf, P., Reyes, J., 1989. The marine mammals of Peru: a review. 344–363. In: Pauly, D., Muck, P., Mendo, J.,
Tsukayama, I. (Eds.), The Peruvian Upwelling Ecosystem: Dynamics And Interactions. ICLARM Conference
Proceedings, vol. 18. 483 pp.
Miranda, L., Hernandez, A., Sepulveda, A., Landaeta, M., 1998. Alimentacion de jurel y analisis de la
selectividad en la zona centro-sur de Chile. In: Arcos, D. (Ed.), Biologıa y Ecologıa del Jurel en Aguas
Chilenas. Instituto de Investigacion Pesquera, Talcahuano-Chile, pp. 173–187.
Neira, S., Arancibia, H., Cubillos, L., 2004. Comparative analysis of trophic structure of commercial fishery
species off Central Chile in 1992 and 1998. Ecol. Model. 172, 233–248.
Odum, E.P., 1969. The strategy of ecosystem development. Science 104, 262–270.
Odum, W.E., Heald, E.J., 1975. The detritus-based food web of an estuarine mangrove community. In: Cronin,
L.E. (Ed.), Estuarine Research, vol. 1. Academic Press, New York, USA, pp. 265–286.
Pacheco, A., Troncoso, V.A., 1998. Tamano celular, abundancia y productividad del bacterioplancton en la Bahıa
Concepcion, Chile: Un enfoque Lagrangiano. Gayana Oceanol. 6 (1–2), 35–48.
Pauly, D., Christensen, V., 1995. Primary production required to sustain global fisheries. Nature 374, 255–257.
Pauly, D., Trites, A.W., Capuli, E., Christensen, V., 1998. Diet composition and trophic levels of marine
mammals. ICES J. Mar. Sci. 55, 467–481.
Pillar, S.C., Stuart, V., Barange, M., Gibbons, M.J., 1992. Community structure and trophic ecology of
euphausiids in the Benguela ecosystem. In: Payne, A.I.L., Brink, K.H., Mann, K.H., Hilborn, R. (Eds.),
Benguela Trophic Functioning. S. Afr. J. Mar. Sci., pp. 393–409.
Quinones, R., Serra, R., Nunez, S., Arancibia, H., Cordova, J., Bustos, F., 1997. Relacion espacial entre el jurel
(Trachurus symmetrichus murphyi) y sus presas en la zona centro-sur de Chile. In: Tarifeno, E. (Ed.), Gestion
de sistemas oceanograficos del Pacıfico Oriental, Comision Oceanografica Intergubernamental de la
UNESCO, IOC/INF, pp. 187–201.
SERNAPesca, 1993. Anuario Estadıstico de Pesca 1992. Departamento de Informacion y Estadıstica Pesquera.
Ministerio de Economıa, Fomento y Reconstruccion, Chile. 214 pp.
Shannon, L.J., Jarre-Teichmann, A., 1999. A model of trophic flows in the Benguela Upwelling System during
the 1980s. S. Afr. J. Mar. Sci. 21, 349–366.
Sinclair, M., O’Boyle, R., Burke, D.L., Peacock, G., 1997. Why do some fisheries survive and others
collapse? In: Hancock, D.A., Smith, D.C., Grant, A., Beumer, J.P. (Eds.), Developing and sustaining
world fisheries resources. The state of science and management. 2nd World Fisheries Congress. CSIRO,
Australia, pp. 23–35.
SSP, 2003. Informe sectorial pesquero y acuıcola 2003. Subsecretarıa de pesca. Departamento de analisis
sectorial, Gobierno de Chile. 21 pp.
Strub, P.T., Mesıas, J., Montecino, V., Ruttland, J., Salinas, S., 1998. Coastal ocean circulation off western South
America. In: Robinson, A.R., Brink, K.H. (Eds.), The Sea. John Wiley & Sons, pp. 273–312.
Ulanowicz, R.E., 1986. Growth and Development: Ecosystem Phenomenology. Springer-Verlag, New York.
203 pp.
Ulanowicz, R.E., 1995. The part–whole relationship in ecosystems. In: Pattern, B.C., Jfrgensen, S.E. (Eds.),Complex Ecology. Prentice-Hall, Englewood Cliffs, New Jersey, pp. 549–560.
Ulanowicz, R.E., Kay, J.J., 1991. A computer package for the analysis of ecosystem flow networks. Environ.
Softw. 6, 131–142.
Ulanowicz, R., Puccia, C., 1990. Mixed trophic impacts in ecosystems. Coenoses 5, 7–16.
Walters, C., Christensen, V., Pauly, D., 1997. Structuring dynamic models of exploited ecosystems from trophic
mass-balance assessments. Rev. Fish Biol. Fish. 7, 139–172.
Wolff, M., 1994. A trophic model for Tongoy Bay. A system exposed to suspend scallop culture (Northern Chile).
J. Exp. Mar. Biol. Ecol. 182, 149–168.
Yanez, E., Barbieri, M.A., Santillan, L., 1992. Long-term environmental variability and pelagic fisheries in
Talcahuano, Chile. S. Afr. J. Mar. Sci. 12, 175–188.