trophic interactions modify the temperature dependence of
TRANSCRIPT

RESEARCH ARTICLE
Trophic interactions modify the temperature
dependence of community biomass and
ecosystem function
Jessica Garzke1,2, Stephanie J. Connor3, Ulrich Sommer1, Mary I. O’ConnorID4*
1 Geomar Helmholtz Centre for Ocean Research Kiel, Department of Experimental Ecology – Food Webs,
Germany, 2 Institute of the Oceans and Fisheries, University of British Columbia, Vancouver, Canada,
3 Canadian Rivers Institute, Department of Biology, University of New Brunswick, Fredericton, Canada,
4 Department of Zoology and Biodiversity Research Centre, University of British Columbia, Vancouver,
Canada
Abstract
Aquatic ecosystems worldwide continue to experience unprecedented warming and eco-
logical change. Warming increases metabolic rates of animals, plants, and microbes, accel-
erating their use of energy and materials, their population growth, and interaction rates. At a
much larger biological scale, warming accelerates ecosystem-level processes, elevating
fluxes of carbon and oxygen between biota and the atmosphere. Although these general
effects of temperature at finer and broader biological scales are widely observed, they can
lead to contradictory predictions for how warming affects the structure and function of eco-
logical communities at the intermediate scale of biological organization. We experimentally
tested the hypothesis that the presence of predators and their associated species interac-
tions modify the temperature dependence of net ecosystem oxygen production and respira-
tion. We tracked a series of independent freshwater ecosystems (370 L) over 9 weeks, and
we found that at higher temperatures, cascading effects of predators on zooplankton prey
and algae were stronger than at lower temperatures. When grazing was weak or absent,
standing phytoplankton biomass declined by 85%–95% (<1-fold) over the temperature gra-
dient (19–30 ˚C), and by 3-fold when grazers were present and lacked predators. These
temperature-dependent species interactions and consequent community biomass shifts
occurred without signs of species loss or community collapse, and only modestly affected
the temperature dependence of net ecosystem oxygen fluxes. The exponential increases in
net ecosystem oxygen production and consumption were relatively insensitive to differences
in trophic interactions among ecosystems. Furthermore, monotonic declines in phytoplank-
ton standing stock suggested no threshold effects of warming across systems. We conclude
that local changes in community structure, including temperature-dependent trophic cas-
cades, may be compatible with prevailing and predictable effects of temperature on ecosys-
tem functions related to fundamental effects of temperature on metabolism.
PLOS Biology | https://doi.org/10.1371/journal.pbio.2006806 June 10, 2019 1 / 27
a1111111111
a1111111111
a1111111111
a1111111111
a1111111111
OPEN ACCESS
Citation: Garzke J, Connor SJ, Sommer U,
O’Connor MI (2019) Trophic interactions modify
the temperature dependence of community
biomass and ecosystem function. PLoS Biol 17(6):
e2006806. https://doi.org/10.1371/journal.
pbio.2006806
Academic Editor: Simon Levin
Received: May 29, 2018
Accepted: May 22, 2019
Published: June 10, 2019
Copyright: © 2019 Garzke et al. This is an open
access article distributed under the terms of the
Creative Commons Attribution License, which
permits unrestricted use, distribution, and
reproduction in any medium, provided the original
author and source are credited.
Data Availability Statement: All .csv files are
available from the Temp_Trophic_Cascade
database (DOI: http://doi.org/10.5281/zenodo.
2648063).
Funding: University of British Columbia (grant
number Mobility Funds). to JG. The funder had no
role in study design, data collection and analysis,
decision to publish, or preparation of the
manuscript. National Sciences and Engineering
Research Council of Canada http://www.nserc-
crsng.gc.ca/index_eng.asp (grant number
Discovery Grant). to MIO. The funder had no role in

Introduction
Temperature affects metabolic rates of all organisms, thereby affecting ecological patterns
and processes across scales of organization—from individuals to ecosystems. Increasing tem-
perature accelerates major metabolic processes that drive net ecosystem production (NEP)
and ecosystem respiration (ER) in aquatic and terrestrial ecosystems [1–4]. Highly conserved
metabolic processes—photosynthesis and aerobic respiration [5]—power somatic growth,
maintenance, and activity in aerobic organisms. As a result, the effects of temperature on
cellular photosynthesis and respiration have accurately described the exponential increases
in ecosystem-scale ecosystem productivity (NEP) and respiration (ER) in aquatic systems
across macroecological thermal gradients, after accounting for body size, nutrient content,
and light availability [4,6,7]. The ecological importance of temperature-dependent per capita
metabolic rates has supported the use of metabolic models to understand and predict eco-
logical change from local to global scales [3,4,8]. This has been a general theme in the meta-
bolic theory of ecology (MTE). Models that associate change in ecosystem-scale metabolism
(e.g., oxygen or carbon flux) with individual-level oxygen production and respiration, but
bypass the complexity of population and community dynamics at intermediate biological
scales, provide much-needed predictability for how climate change affects ecosystem func-
tions when ecosystems are compared across broad spatial or temporal thermal gradients
[2,4,9].
Reconciling the high explanatory power of general temperature-dependent metabolic scal-
ing models at macroecological scales with the well-documented contingencies of how temper-
ature affects community-level outcomes of population dynamics and species interactions at
intermediate scales has been challenging [10–17]. Whether at macroecological or community
(e.g., single-site) scales, ecosystem-level functions (ER, NEP) or standing stock is simply the
sum of per capita function (respiration, net photosynthesis) and biomass. Metabolic theory
models applied at macroecological scales assume that the relationship between temperature
and community-level distributions of body sizes and traits is constant in time, or that commu-
nities are at a stable state so that descriptions of community structure apply to future states of
the community under the same abiotic conditions [10–12]. Yet, at local scales, species interac-
tions can influence biomass of primary producers, and the strength and outcomes of species
interactions reflect dynamical processes that are often sensitive to temperature [13–15]. For
example, the presence of fish in experimental aquatic ponds reversed a negative effect of tem-
perature on algal biomass to a positive effect, mediated by trophic interactions between fish,
zooplankton, and phytoplankton [16], under otherwise constant consistent abiotic conditions
across ponds. Understanding how temperature-dependent species interactions affect biomass,
size distributions, and traits remains a challenge. For example, why do temperature-dependent
species interactions influence the effects of temperature on community properties such as bio-
mass, abundance, and body size but have little or no apparent effect on the variation in ecosys-
tem functions (NEP, ER) over macroecological scales? This challenge is central to efforts to
apply general models of metabolic temperature dependence to communities [17,18]. This par-
adox between macroecological patterns—which can be consistent with direct scaling of per
capita thermal responses—and results of smaller-scale, short-term experiments that allow pop-
ulation dynamics to play out over intermediate timescales, leads to the suggestion that general
metabolic scaling models that do not consider the complexities associated with species interac-
tions do not apply at the local scales [19]. Reconciling these apparently divergent patterns is
critical to improving understanding and projections of how shifting global thermal regimes
affect ecological patterns and processes across scales and achieving a more unified understand-
ing of ecology across scales.
Ecological effects of temperature
PLOS Biology | https://doi.org/10.1371/journal.pbio.2006806 June 10, 2019 2 / 27
study design, data collection and analysis, decision
to publish, or preparation of the manuscript.
Competing interests: The authors have declared
that no competing interests exist.
Abbreviations: A, algae only; AG, algae and
grazers; AGP, algae, grazers, and predators; DO,
dissolved oxygen; ER, ecosystem respiration;
LMM, linear mixed effects model; MTE, metabolic
theory of ecology; NEP, net ecosystem production;
TPC, thermal performance curve.

One way to reconcile the apparent context dependence of empirical results under controlled
conditions with the generality of temperature dependence of ecosystem function at broader
scales is to consider how the direct and indirect effects of temperature on population dynamics
interact. Direct effects of temperature on per capita metabolic rates cause organismal photosyn-
thesis and respiration rates to increase exponentially when temperatures increase, as long as
resources are not limiting in algae and animals, up to an optimal temperature. This relationship
between temperature and fundamental metabolic rates (photosynthesis and respiration) is
referred to as general metabolic scaling [1]. For any single phenotype, performance above some
optimal temperature declines due to stress responses and metabolic scaling no longer explains
the effects of temperature on performance. However, in multispecies communities, the signal of
metabolic scaling is likely to dominate over a broad range of temperatures if species with distinct
thermal phenotypes can compensate for each other along the thermal gradient [10,20]. Warming
is also associated with other biological changes that affect species interactions, such as reductions
in body size (the temperature size rule [21–23]), fecundity, and attack rates (Fig 1) [24–27], and
these changes can feed back to influence community-level biomass and productivity [28–30].
The temperature dependence of consumer-resource interactions—mediated by dynamics
of two or more populations—has received substantial attention in this context, because these
trophic interactions can influence many aspects of community structure and ecosystem func-
tion, including biomass, abundance, species composition, and stability [10,12,31,32,34]. Tro-
phic species interactions appear to strengthen with warming [16,29,31]. Series of trophic
interactions, called trophic cascades (Fig 1), link predator populations to the abundance, bio-
mass, and ecosystem functions of primary producers [32,33]. The strength of trophic cascades
depends on predator and prey body sizes and primary production [34]. Considering the preva-
lence of consumer-resource interactions and trophic cascades in aquatic systems [35] begs the
question, how is it that population-level responses to temperature [28,36] do not appear to
cause major variation or context dependence in macroecological relationships between subcel-
lular metabolic processes (photosynthesis, respiration) and ecosystem processes (NEP, ER)?
Here, we aimed to resolve the paradox between apparent direct effects of temperature on
ecosystem functions (NEP, ER) that emerge when comparing communities across larger gradi-
ents and the potentially more complex effects of temperature at the population and commu-
nity scales. We experimentally tested the hypothesis that temperature-dependent trophic
interactions in a trophic cascade alter the effect of temperature on community properties such
as biomass, abundance, and body size, but have little or no effect on the variation in ecosystem
functions (NEP, ER) over a temperature gradient. In freshwater plankton communities, we
compared the effects of temperature on community properties typically measured in warming
experiments (e.g., biomass, density, body size) with the effects of temperature typically mea-
sured in macroecological studies (e.g., NEP, ER). We controlled variation in biotic and abiotic
conditions other than temperature and trophic structure (presence of grazers and predators)
(Fig 1). We quantified ecosystem function (NEP, ER) and community structure (biomass,
abundance) in ecosystems with algae only (A), algae and grazers (AG), or algae, grazers, and
predators (AGP) across an experimental temperature gradient of 10 ˚C. We found that expo-
nential effects of temperature on algal biomass were greater than effects of temperature on
NEP and ER, suggesting that even large changes in community structure do not necessarily
lead to large changes in how temperature affects NEP and ER.
Hypotheses
We drew on the MTE to frame our hypotheses and predictions for how temperature affects
NEP and ER via per capita metabolic temperature dependence and indirect effects of
Ecological effects of temperature
PLOS Biology | https://doi.org/10.1371/journal.pbio.2006806 June 10, 2019 3 / 27

temperature at the community scale. We first briefly outline the framework and then express
our specific hypotheses. MTE relates whole-organism metabolic rates (bi, gO2/hour) and
related biological functions for organism i to body size (mi, g) and body temperature (T, in
Kelvin) [1,37,38]:
bi ¼ b0e� Ea=kTma
i ð1Þ
in which activation energy (Ea, in eV) captures the exponential effect of temperature on per
capita metabolic rate, k is the Boltzmann constant (eV/K), and b0 is a normalization constant
independent of body size and temperature that includes the effects of temperature-indepen-
dent traits on metabolic rate (gO2/gα/hour). The allometric scaling factor α relates metabolic
rate to body size.
The effects of temperature on ecosystem metabolic rates (BR), such as NEP or ER (gO2/
hour), reflect the sum of all per capita photosynthesis rates by autotrophs and respiration rates
Fig 1. (A) Temperature and predation directly and indirectly affect population density and metabolic rates in aquatic
communities. In our experimental communities, predation directly (solid lines) affects the abundance, size, and species
composition of prey, and predation by notonectids on grazers leads to an indirect effect (dashed line) called a trophic
cascade on algal abundance. Temperature directly affects per capita metabolic rates (solid lines) and indirectly affects
algal abundance (dashed lines) by increasing grazing rates, and may have stronger effects on heterotrophic metabolic
rates relative to algal metabolic rates (thicker lines represent a stronger direct effect of temperature). Other indirect
effects of temperature are possible. (B) Experimental communities varied in their trophic structure. Ten communities
included algae only (A), 10 comprised algae + grazers (AG), and 10 included algae + grazers + predators (AGP). We
sampled net ecosystem oxygen production (NEP), ecosystem respiration (ER), and total phytoplankton biomass (MB)
weekly for 8 weeks. AG, algae + grazers; AGP, algae + grazers + predators; ER, ecosystem respiration; MB, total
phytoplankton biomass; NEP, net ecosystem oxygen production.
https://doi.org/10.1371/journal.pbio.2006806.g001
Ecological effects of temperature
PLOS Biology | https://doi.org/10.1371/journal.pbio.2006806 June 10, 2019 4 / 27

by autotrophs and heterotrophs, as well as shifts in abundance, body size, and acclimation.
These models implicitly assume an ample and constant supply of resources. Note that NEP
and ER can be quantified in this way as positive numbers, and we do this—using their absolute
values—in our analyses. Following Barneche and colleagues [10], we capture direct and indi-
rect effects of temperature on ecosystem-scale metabolic rates in the following equation (see
Barneche and colleagues [10] for derivation):
BR ¼ b0ðTCÞe� ER�
1=kT �1=kTC
�
MBhma� 1
B i: ð2Þ
The term e� ER�
1=kT �1=kTC
�
captures the temperature dependence ER (eV) of ecosystem-level
metabolic rate BR. Eq 2 represents a “first-order metabolic scaling” prediction that ecosystem-
scale mass-normalized metabolic rates (e.g., NEP) vary proportionally with the temperature
dependence of the underlying metabolic processes (e.g., photosynthesis). Observed tempera-
tures, T, are related to an arbitrarily chosen reference temperature, Tc. This centering causes
the normalization constant b0(TC) to be for metabolic performance at temperature Tc.When considering the indirect effects of temperature on ecosystem oxygen production and
respiration, we can consider how each term in Eq 2 may vary with temperature. To account
for changes in total biomass, body size, or relative abundance of phenotypes (traits) associated
with temperature, we use the termMBhma� 1i iB. The total biomass,MB (g), in ecosystem volume
V, equals the sum of massmi for all individuals i to J ðMB ¼1
V
PJi¼1miÞ. The term hma� 1
i i is the
average of all individual metabolic biomasses, hma� 1i i ¼ ð
PJi¼1mai Þ=ð
PJi¼1miÞ, corrected for
the greater contribution to total mass-specific metabolic biomass by small individuals resulting
from the allometric scaling (α)of oxygen production and consumption with body size [2,10].
This “mass correction” is necessary, because if community biomass is comprised of one large
individual, that biomass will [produce and] consume less oxygen per gram biomass in a given
time period than if the same total biomass were comprised of many small individuals; in other
words,MBhma� 1B i increases withmi. If thermal traits acclimate or species composition shifts
with temperature, this term would capture that change. Therefore, Eq 2 can capture direct
effects of temperature on community metabolism via changes in per capita metabolic rate (ER)
and via changes in biomass, size distribution, and phenotypes.
Hypothesis 1: The relationship between algal biomass and temperature is
modified by the number of trophic levels
Via strong trophic interactions, predators can change the standing biomass of primary pro-
ducers in communities. Total algal biomass (MB) can be expressed in terms of temperature,
traits, and size distributions:
MB ¼BRe
ER
�1=kT �
1=kTC
�
b0ðTCÞhma� 1B i
: ð3Þ
If we assume that BR�ðb0ðTCÞ�hma� 1B iÞ
� 1is independent of temperature, we predict that
algal biomassMB declines with temperature by ER; in this case, ER = −ENEP. This prediction
has been supported empirically in a single species algae system [39], and in that system the pre-
dicted decline in total biomass was robust to changes in cell size. However, it is unlikely that
grazers and temperature would not alter the abundance and size of algae, altering hma� 1B i
among trophic treatments [40] and also the traits of algae, and thereby modifying b0 (TC)
among trophic treatments [41]. A fuller integration of how temperature and trophic treatment
Ecological effects of temperature
PLOS Biology | https://doi.org/10.1371/journal.pbio.2006806 June 10, 2019 5 / 27

affect these terms for multispecies assemblages would require theoretical development that is
beyond the scope of this paper, but we use the equation here to highlight why we expect tro-
phic structure and temperature to affect algal biomass. To test this hypothesis and the alterna-
tive, that BR�ðb0ðTCÞ�hma� 1B iÞ
� 1is independent of temperature, we linearized Eq 3 for analysis
by log transforming (Methods, Eq 8), and then we compared ln(MB) trends with temperature
across ecosystems with and without a trophic cascade (AGP versus AG ecosystems).
Hypothesis 2: Increasing temperature strengthens the trophic cascade
We estimated the strength of the trophic cascade as the log ratio of primary producer biomass
in the presence of predators (AGP) versus in predator-free environments (AG) [42]. We pre-
dicted that predators would reduce the abundance of zooplankton through predation and shift
zooplankton composition to smaller sizes and less edible species, typical of classic freshwater
trophic cascades [43]. We also predicted that these trophic interactions would strengthen with
higher temperatures due to the effect of temperature on per capita zooplankton grazing rates.
We can relate algal biomass among treatments using Eq 3 for primary producer biomass in the
presence of predators (AGP) and grazers only (AG), simplifying and taking the natural log to
yield (see Methods, Eqs 8–11, for details)
lnMB:AGP
MB:AG
� �
¼lnðb0ðTCÞAGÞ þ ln hm
a� 1B iAG
� ��
Eb:ag � Em:agkT
lnðb0ðTCÞAGPÞ þ ln hma� 1B iAGP
� ��
Eb:agp � Em:agpkT
ð4Þ
Numerous experiments have demonstrated that the strength of the trophic cascade (logMB:AGPMB:AG
) increases with an increase in temperature of a few degrees [29,44,45], and theoretical
work suggests that strengthening of this interaction under warming is expected for a greater
range of consumer-resource parameter values than would predict declines in the trophic cas-
cade [15]. We therefore predict the trophic cascade strength will increase with temperature in
our experiment. But as shown in Eq 4, because trophic interactions could affect the realized
temperature dependence via several possible mechanisms—shifts in body size, traits, etc.—it is
not possible to predict a priori the temperature dependence of the trophic cascade, in terms of
the differences and ratios of the temperature dependence terms in Eq 4 (see Methods: Model
and hypothesis development). A “first-order” metabolic scaling prediction would be no change
in trophic cascade strength, because the model would assume that the temperature depen-
dences of mass and the normalization constant (Eb.ag, Eb.agp, Em.ag, and Em.agp) all equal 0. We
expected the indirect effects of predators on algae to be mediated by changes in zooplankton
density and/or body size. Zooplankton attributes are not explicitly modeled in Eq 4 but could
contribute to temperature dependence of algal cell size and trait distributions. Reduced zoo-
plankton size or density in the presence of predators could lead to different indirect effects of
temperature on algal cell size and traits in the presence versus absence of predators. We tested
the prediction that temperature dependence of zooplankton size and density are different
from zero (Methods: Statistical analysis).
Hypothesis 3: Temperature dependence of NEP and respiration depends on
the strength of the trophic cascade
We test this by using Eq 2 to model ecosystem-scale NEP and ER, but we allow bo(TC) to vary
not only with temperature but with trophic structure (Zj). We expect that trophic structure
will influence the number and size of individuals, and thereby affectMBhma� 1B i. Alternatively,
trophic structure may not modify the relationship between temperature and BR, if bo(TC) and
hma� 1B i are independent of temperature. We can test these alternate predictions by comparing
Ecological effects of temperature
PLOS Biology | https://doi.org/10.1371/journal.pbio.2006806 June 10, 2019 6 / 27
models with and without bo(TC) and hma� 1B i terms that depend on ecosystem temperature and
trophic structure.
For each hypothesis, we used linear mixed effects models (LMMs) to test “first-order” meta-
bolic scaling models for the appropriate model (Eqs 2, 3, or 4) that included bo(TC) as indepen-
dent of the ecosystem’s temperature or trophic structure (Methods: Statistical analyses). We
tested alternate models that allowed bo(TC) to vary with ecosystem temperature and/or trophic
structure. If the simpler, first-order models are best supported, we would infer that indirect
effects of temperature do not overwhelm the signals of direct metabolic scaling effects on eco-
system functions, consistent with inferences drawn in macroecological studies. To estimate
intercepts and temperature dependence terms (e.g., ER), we summed coefficient values and
estimated uncertainties in these aggregated parameters from best models (Methods: Statistical
analysis). For each hypothesis, we tested two measures of ecosystem temperature: mean tem-
perature over the 9-week experiment, which captures differences among systems, or weekly
mean temperature, which captures differences within ecosystems over time. Our data do not
permit testing specific predictions about size distributions or trait shifts, but support for mod-
els with variation in bo(TC) and hma� 1B i among treatments would suggest these mechanisms as
likely explanations.
Results
Hypothesis 1
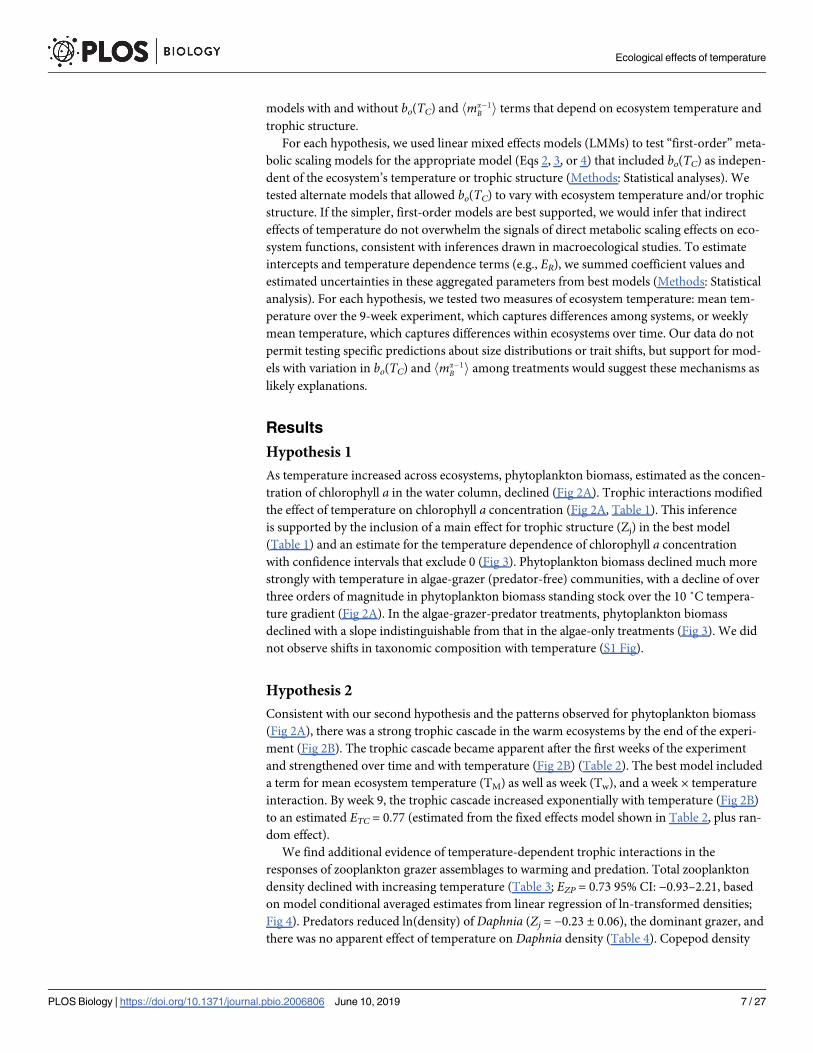
As temperature increased across ecosystems, phytoplankton biomass, estimated as the concen-
tration of chlorophyll a in the water column, declined (Fig 2A). Trophic interactions modified
the effect of temperature on chlorophyll a concentration (Fig 2A, Table 1). This inference
is supported by the inclusion of a main effect for trophic structure (Zj) in the best model
(Table 1) and an estimate for the temperature dependence of chlorophyll a concentration
with confidence intervals that exclude 0 (Fig 3). Phytoplankton biomass declined much more
strongly with temperature in algae-grazer (predator-free) communities, with a decline of over
three orders of magnitude in phytoplankton biomass standing stock over the 10 ˚C tempera-
ture gradient (Fig 2A). In the algae-grazer-predator treatments, phytoplankton biomass
declined with a slope indistinguishable from that in the algae-only treatments (Fig 3). We did
not observe shifts in taxonomic composition with temperature (S1 Fig).
Hypothesis 2
Consistent with our second hypothesis and the patterns observed for phytoplankton biomass
(Fig 2A), there was a strong trophic cascade in the warm ecosystems by the end of the experi-
ment (Fig 2B). The trophic cascade became apparent after the first weeks of the experiment
and strengthened over time and with temperature (Fig 2B) (Table 2). The best model included
a term for mean ecosystem temperature (TM) as well as week (Tw), and a week × temperature
interaction. By week 9, the trophic cascade increased exponentially with temperature (Fig 2B)
to an estimated ETC = 0.77 (estimated from the fixed effects model shown in Table 2, plus ran-
dom effect).
We find additional evidence of temperature-dependent trophic interactions in the
responses of zooplankton grazer assemblages to warming and predation. Total zooplankton
density declined with increasing temperature (Table 3; EZP = 0.73 95% CI: −0.93–2.21, based
on model conditional averaged estimates from linear regression of ln-transformed densities;
Fig 4). Predators reduced ln(density) of Daphnia (Zj = −0.23 ± 0.06), the dominant grazer, and
there was no apparent effect of temperature on Daphnia density (Table 4). Copepod density
Ecological effects of temperature
PLOS Biology | https://doi.org/10.1371/journal.pbio.2006806 June 10, 2019 7 / 27
declined with temperature (EC = 1.21 95% CI: −1.07 to −1.41) and not in response to predation
(the best model did not include a predation term, Table 5). We measured the zooplankton
standard length for 641 individuals of all ages. Mean length was 0.72 cm, and sizes ranged
from 0.34 to 1.94 cm. We did not observe a decline in body size with temperature (the best
model did not include a temperature term, S2 Table), as would be expected by a hypothesis
based on the temperature size rule. Predation reduced total zooplankton body size, driven by
size shifts in Daphnia (S2 Table).
Fig 2. (A) Estimated phytoplankton biomass (chlorophyll a concentration) declined with increasing temperature and
varied with trophic structure (A, AG, AGP). Lines are estimated effects of temperature on phytoplankton biomass
based on LMMs (Eq 12) for Eq 3, with temperature dependence in model terms for the intercept and slope (Table 1).
From the best model, the intercept and slope of each line were estimated by pooling terms for the intercept and
temperature dependence in Eq 12 (see Methods, Eq 14). All observations for phytoplankton biomass are shown in Fig
6. (B) Strength of the trophic cascade at a given temperature was estimated by taking the log ratio of algal biomass
(estimated as chlorophyll a concentration) in the presence of predators and grazers (AGP) versus the algal abundance
in the presence of grazers only (AG) (Eq 4, Table 2). Lines represent fixed effects of temperature from the full model
(Table 2), centered on the grand mean of all recorded ecosystem temperatures (Eq 13). Gray shading and symbols
indicate the week, from week 2 (July 10) to week 9 (August 28), 2012. Data for these figures may be found at https://
doi.org/10.5281/zenodo.2652579 in GarzkeAllwks.csv. A, algae only; AG, algae and grazers; AGP, algae, grazers, and
predators; Chla, chlorophyll a; LMM, linear mixed effects model.
https://doi.org/10.1371/journal.pbio.2006806.g002
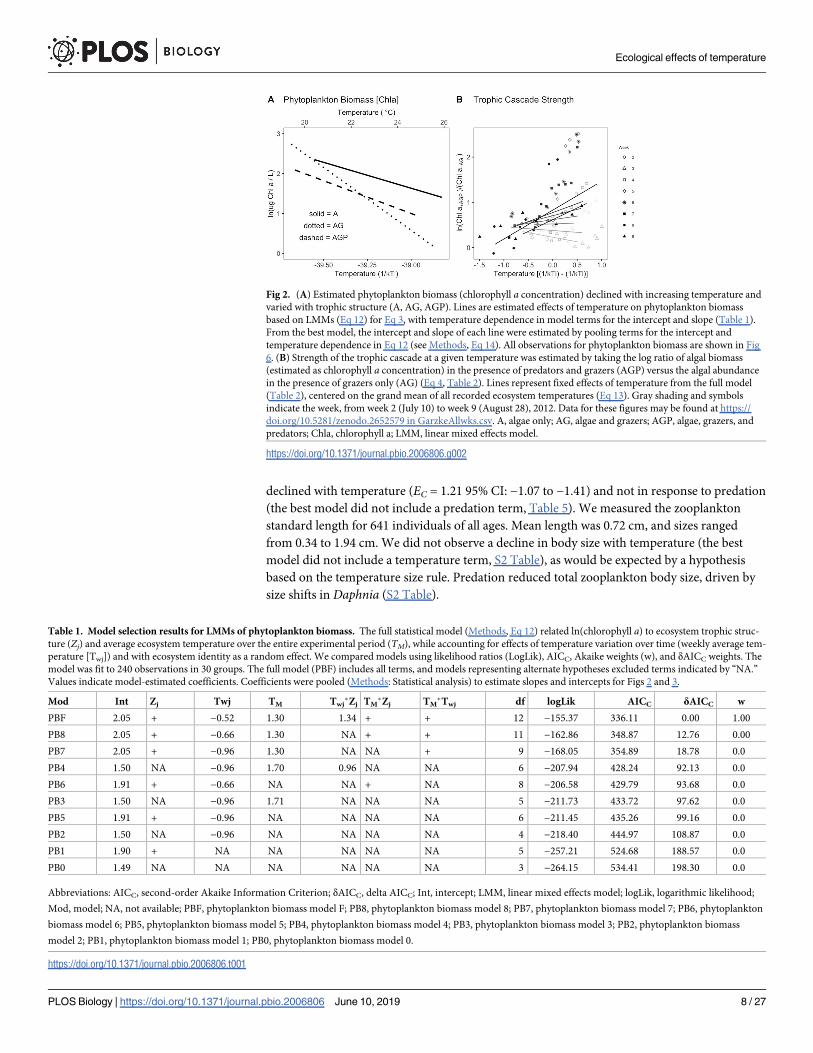
Table 1. Model selection results for LMMs of phytoplankton biomass. The full statistical model (Methods, Eq 12) related ln(chlorophyll a) to ecosystem trophic struc-
ture (Zj) and average ecosystem temperature over the entire experimental period (TM), while accounting for effects of temperature variation over time (weekly average tem-
perature [Twj]) and with ecosystem identity as a random effect. We compared models using likelihood ratios (LogLik), AICC, Akaike weights (w), and δAICC weights. The
model was fit to 240 observations in 30 groups. The full model (PBF) includes all terms, and models representing alternate hypotheses excluded terms indicated by “NA.”
Values indicate model-estimated coefficients. Coefficients were pooled (Methods: Statistical analysis) to estimate slopes and intercepts for Figs 2 and 3.
Mod Int Zj Twj TM Twj�Zj TM
�Zj TM�Twj df logLik AICC δAICC w
PBF 2.05 + −0.52 1.30 1.34 + + 12 −155.37 336.11 0.00 1.00
PB8 2.05 + −0.66 1.30 NA + + 11 −162.86 348.87 12.76 0.00
PB7 2.05 + −0.96 1.30 NA NA + 9 −168.05 354.89 18.78 0.0
PB4 1.50 NA −0.96 1.70 0.96 NA NA 6 −207.94 428.24 92.13 0.0
PB6 1.91 + −0.66 NA NA + NA 8 −206.58 429.79 93.68 0.0
PB3 1.50 NA −0.96 1.71 NA NA NA 5 −211.73 433.72 97.62 0.0
PB5 1.91 + −0.96 NA NA NA NA 6 −211.45 435.26 99.16 0.0
PB2 1.50 NA −0.96 NA NA NA NA 4 −218.40 444.97 108.87 0.0
PB1 1.90 + NA NA NA NA NA 5 −257.21 524.68 188.57 0.0
PB0 1.49 NA NA NA NA NA NA 3 −264.15 534.41 198.30 0.0
Abbreviations: AICC, second-order Akaike Information Criterion; δAICC, delta AICC; Int, intercept; LMM, linear mixed effects model; logLik, logarithmic likelihood;
Mod, model; NA, not available; PBF, phytoplankton biomass model F; PB8, phytoplankton biomass model 8; PB7, phytoplankton biomass model 7; PB6, phytoplankton
biomass model 6; PB5, phytoplankton biomass model 5; PB4, phytoplankton biomass model 4; PB3, phytoplankton biomass model 3; PB2, phytoplankton biomass
model 2; PB1, phytoplankton biomass model 1; PB0, phytoplankton biomass model 0.
https://doi.org/10.1371/journal.pbio.2006806.t001
Ecological effects of temperature
PLOS Biology | https://doi.org/10.1371/journal.pbio.2006806 June 10, 2019 8 / 27

Hypothesis 3
Across ecosystems, higher temperatures increased NEP and ER (Tables 6 and 7; Fig 5). The
LMM for NEP (Table 6) suggests that ecosystem temperature and trophic structure interact
to influence ecosystem oxygen fluxes, yet their estimated temperature dependences did not
appear to differ when confidence intervals were compared (Fig 3). The estimated across-sys-
tem temperature dependence of NEP was the strongest in algae-only communities (Fig 5), and
Fig 3. Comparison of estimated temperature dependences of phytoplankton biomass (MB), NEP, and ER for
communities with algae only (A), algae and grazers (AG), and algae, grazers, and predators (AGP). Composite
estimates of temperature dependences are as shown in Figs 2A and 5 (following Methods, Eq 14). No temperature
dependence is indicated by the dashed line, and the vertical gray dotted lines indicate 0.65 and 0.32 eV, expected
temperature dependences of algal photosynthesis and respiration, and −0.65 and −0.32 as expectations for the
temperature dependence of phytoplankton total biomass. Data for these figures may be found at https://doi.org/10.
5281/zenodo.2652579 in GarzkeAllwks.csv. A, algae only; AG, algae and grazers; AGP, algae, grazers, and predators;
ER, ecosystem respiration; NEP, net ecosystem production.
https://doi.org/10.1371/journal.pbio.2006806.g003
Table 2. Model selection results for trophic cascade analysis. We used LMMs with terms for average temperature for ecosystem j in week w (Twj), weeks 2–9 (Wk), and
their interaction. We treated the power level (e.g., 100 W, 200 W, etc.), our temperature treatment, as a random effect to account for repeated measures on ecosystems over
time. We compared models using likelihood ratios (LogLik), AICC, Akaike weights (w), and δAICC weights. The model was fit to 79 observations in 10 groups. The full
model (TCFull) includes all terms, and models representing alternate hypotheses excluded terms indicated by “NA.” Coefficients were pooled (Methods: Statistical analy-
sis) to estimate slopes and intercepts for Fig 2.
Mod Int Twj Wk Twj�Wk df logLik AICC δAICC w
TCFull 0.19 −0.01 0.12 0.11 6 −60.78 134.73 0.00 0.77
TCmC 0.02 −0.74 0.14 NA 5 −63.26 137.33 2.60 0.21
TCmE 0.56 NA 0.04 NA 4 −67.36 143.27 8.54 0.01
TCmF 0.79 NA NA NA 3 −68.80 143.92 9.19 0.01
TCmD 0.79 −0.05 NA NA 4 −68.76 146.07 11.34 0.00
Abbreviations: AICC, second-order Akaike Information Criterion; δAICC, delta AICC; Int, intercept; LMM, linear mixed effects model; logLik, logarithmic likelihood;
Mod, model; NA, not available; TCmC, Trophic Cascade Model C; TCmD, Trophic Cascade Model D; TCmE, Trophic Cascade Model E; TCmF, Trophic Cascade
Model F.
https://doi.org/10.1371/journal.pbio.2006806.t002
Ecological effects of temperature
PLOS Biology | https://doi.org/10.1371/journal.pbio.2006806 June 10, 2019 9 / 27

confidence intervals for the temperature dependence term include 0 for the systems with pred-
ators (Fig 3). ER increased with temperature across ecosystems (Fig 5), and this effect did
depend on trophic structure (Table 7). The estimated temperature dependence on NEP and
ER was strongest in the algae-only systems and weakest in systems with predators (Fig 3). See
Fig 6 for all data.
In addition to the variation among ecosystems in temperature that was the main focus of
our hypotheses, the biotic and abiotic conditions in experimental ecosystems varied over time.
Temperature varied within experimental ecosystems over time (S2 Fig). Overall, temperatures
declined between the beginning and the end of the experiment, with some variation among
weeks reflecting weather conditions. Phytoplankton community composition shifted over
time (S1 Fig), but visual inspection of the species at each time point indicated no specific taxa
driving the changes, and there was no association between phytoplankton species composition
and temperature (S3 Fig). Chlorophyll a concentration declined over time in all treatments (S4
Fig). An LMM indicated that this decline was weakest in the algae-only treatments (S1 Table).
Visual inspection of trends (S4 Fig) suggests that this decline over time was driven by the
decline in all tanks in weeks 8 and 9, following a major rain event and drop in all tank tempera-
tures (S2 Fig). When we reanalyzed the temporal trend for just weeks 2−7, excluding weeks 8
−9, the trend in chlorophyll a over time approached 0 in A and AGP treatments, but still per-
sisted in AG treatments (S1 Table).
Effects of temporal temperature variation on phytoplankton biomass within ecosystems dif-
fered starkly from effects of temperature among ecosystems (Fig 6). Within ecosystems, higher
temperatures were associated with higher phytoplankton standing stocks (Fig 6A), opposite to
the trend with temperature among ecosystems. NEP and ER varied with temperature within
ecosystems, and there is some evidence that this temperature effect interacted with both the
trophic structure treatments (Table 6, model NEP8; Table 7, model ER8).
Discussion
Temperature affects the metabolic rates of all organisms, and per capita responses to tempera-
ture of many co-occurring individuals add up to nothing less than the biological component of
ecosystem-scale carbon and oxygen flux. Understanding biological responses to temperature
change across scales of organization (cells to the biosphere) is a major challenge in ecological
research. Meeting this challenge requires joining theoretical frameworks and synthesizing
empirical evidence of temperature effects across scales and systems. Despite much progress,
there remains a gap between patterns that emerge in community-level experiments and the
Table 3. Zooplankton density. Results of model selection for zooplankton abundance in ecosystems with grazers (AG) and with grazers and predators (AGP). We used
linear regressions (Methods: Statistical analysis). Models included terms for weekly average temperature (Twj), ecosystem trophic treatment (Zj) and their interaction, and
a random effect for ecosystem identity. We modeled 120 observations in 20 groups (ecosystems). We compared models using likelihood ratios (LogLik), AICC, Akaike
weights (w), and δAICC weights. NA indicates that the term was not included in the model.
Mod Int Twj Zj Twj� Zj df logLik AICC δAICC w
Z1c 1.56 NA NA NA 3 −218.17 442.56 0.00 0.22
Z1 1.82 0.78 + + 6 −214.92 442.58 0.02 0.22
Z1b 1.56 0.66 NA NA 4 −217.17 442.69 0.14 0.20
Z1d 1.82 0.74 + NA 5 −216.18 442.89 0.34 0.18
Z1a 1.81 NA + NA 4 −217.30 442.96 0.40 0.28
Abbreviations: AG, algae and grazers; AGP, algae, grazers, and predators; AICC, second-order Akaike Information Criterion; δAICC, delta AICC; Int, intercept; logLik,
logarithmic likelihood; Mod, model; NA, not available; Z1, zooplankton abundance model 1; Z1a, zooplankton abundance model a; Z1b, zooplankton abundance model
b; Z1c, zooplankton abundance model c; Z1d, zooplankton abundance model d.
https://doi.org/10.1371/journal.pbio.2006806.t003
Ecological effects of temperature
PLOS Biology | https://doi.org/10.1371/journal.pbio.2006806 June 10, 2019 10 / 27

Fig 4. (A) Total zooplankton density (ln(ind)/10 L), comprising Daphnia and copepod taxa, declined with increasing
temperature but not with predator presence. (B) Daphnia density (ind/L) declined with predators (gray dashed line,
versus black line indicating trend with no predators) (Table 4), and (C) copepod spp. density (ln(ind)/10 L) declined
with temperature but not predators (Table 5). Lines are regressions, with ecosystem as a random effect for ecosystems
with predators (gray lines) and without predators (black solid line). Each data point is an observed total zooplankton
Ecological effects of temperature
PLOS Biology | https://doi.org/10.1371/journal.pbio.2006806 June 10, 2019 11 / 27

multiscale theoretical framework (MTE) that links temperature-dependent metabolism to
larger-scale patterns for temperature dependence. Here, we aimed to test the hypothesis that
the effects of temperature on ecosystem processes that reflect metabolic temperature depen-
dence are not highly sensitive to local differences in the trophic structure of a community (e.g.,
presence or absence of a predator). This question draws upon ideas supported by the MTE and
community ecology theory predicting that species interactions modify the effects of tempera-
ture on community structure and function. We found that in aquatic ecosystems characterized
by the presence or absence of predator–prey species interactions, temperature-dependent
trophic cascades only modestly altered the effects of temperature on net ecosystem oxygen
production and consumption (NEP and ER). We found that higher average temperatures
increased NEP and ER while total phytoplankton biomass declined, and all ecosystem-level
temperature responses were stronger than expected for per capita temperature-dependent oxy-
gen production or consumption.
Our first hypothesis was based on the expectation that our experimental systems would
include top-down predator effects that altered phytoplankton standing stock, and possibly
interacted with temperature to influence algal size distributions or other traits. We found that
trophic structure did modify the effect of temperature on phytoplankton biomass, failing to
reject our first hypothesis. The decline in phytoplankton standing stocks that we observed with
warming across ecosystems is consistent with theoretical expectations that in closed systems
with limited resources, increases in per capita metabolic rates with temperature could lead to
declines in standing stocks [15,18,39,46]. Phytoplankton standing stocks responded most
strongly to temperature in the communities with grazers but no predators, suggesting that
temperature-dependent grazing can exacerbate the temperature dependence of algal standing
stocks. Overall, the temperature dependence of phytoplankton standing stocks greatly
exceeded expectations based on temperature dependence of per capita photosynthesis or respi-
ration rates (Fig 3). Our hypothesis (Eq 3) allowed for changes in phytoplankton standing
stocks to be explained by direct effects of temperature on per capita metabolism, as well as
effects of temperature on thermal traits, density, or body size distributions. We suggest that
change in per capita metabolic response and density were the primary components of this
change. We did not observe clear shifts in the species composition of the phytoplankton
density for crustacean taxa (Daphnia and copepods) in each ecosystem on a sampling date. Data for these figures may
be found at https://doi.org/10.5281/zenodo.2652579 in GarzkeAllwks.csv. ind, individuals.
https://doi.org/10.1371/journal.pbio.2006806.g004
Table 4. Daphnia density: Results of model selection for Daphnia abundance in ecosystems with grazers and with grazers and predators. We used linear regressions
(Methods: Statistical analysis). Models included terms for weekly average temperature (Twj), ecosystem trophic treatment (Zj) and their interaction, and a random effect
for ecosystem identity. We compared models using likelihood ratios (LogLik), AICC, Akaike weights (w), and δAICC weights. We modeled 120 observations in 20 groups
(10 AGP ecosystems with predators, and 10 AG ecosystems without predators). NA indicates that the term was not included in the model.
Mod Int Twj Zj Twj� Zj df logLik AICC δAICC w
D1a 0.40 NA + NA 4 −75.77 159.9 0.00 0.41
D1c 0.28 NA NA NA 3 −76.88 160.0 0.07 0.39
D1d 0.40 0.15 + NA 5 −76.20 162.9 3.02 0.09
D1b 0.28 0.11 NA NA 4 −77.35 163.0 3.15 0.08
D1 0.40 0.20 + + 6 −76.12 165.0 5.10 0.03
Abbreviations: AG, algae and grazers; AGP, algae, grazers, and predators; AICC, second-order Akaike Information Criterion; δAICC, delta AICC; D1, Daphniaabundance model; D1a, Daphnia abundance model a; D1b, Daphnia abundance model b, D1c, Daphnia abundance model c; D1d, Daphnia abundance model d; Int,
intercept; logLik, logarithmic likelihood; Mod, model; NA, not available.
https://doi.org/10.1371/journal.pbio.2006806.t004
Ecological effects of temperature
PLOS Biology | https://doi.org/10.1371/journal.pbio.2006806 June 10, 2019 12 / 27

assemblage with temperature; still, we do not have high-resolution data on phytoplankton cell
size or traits, so we cannot reject these mechanisms as contributors to the patterns we observe.
Our second hypothesis, based on recent experimental results in other freshwater and
grassland systems, was that the trophic cascade would get stronger as ecosystem temperatures
warmed. We found support for this hypothesis in our system, providing the first evidence that
trophic cascade strength increases continuously with temperature. Prior to our study, evidence
of stronger trophic cascades with warming were from experiments that test two temperature
levels, an ambient and a simulated future scenario of approximately +3 ˚C [29,47,48]. We
show here that this pattern continues over a thermal range of 10 ˚C. The indirect effects of
predators on phytoplankton biomass appear to have been mediated by predation on the domi-
nant grazer, Daphnia. Predators reduced Daphnia density and thereby shifted grazer assem-
blages toward the less effective copepod grazers at all temperatures. This trophic cascade,
mediated by shifts in grazer composition as well as total density, is a classic food web motif in
freshwater systems [43]. Interestingly, at warmer temperatures grazer density was lowest, yet
Table 5. Copepod density: Results of model selection for copepod spp. abundance in ecosystems with grazers and with grazers and predators. We used linear regres-
sions (Methods: Statistical analysis). Models included terms for weekly average temperature (Twj), ecosystem trophic treatment (Zj) and their interaction, and a random
effect for ecosystem identity. We compared models using likelihood ratios (LogLik), AICC, Akaike weights (w), and δAICC weights. We modeled 120 observations in 20
groups (10 AGP ecosystems with predators, and 10 AG ecosystems without predators). NA indicates that the term was not included in the model.
Mod Int Twj Zj Twj� Zj df logLik AICC δAICC w
C1b 1.159 1.20 NA NA 4 −199.71 407.8 0.00 0.55
C1 1.189 1.32 + + 6 −198.88 410.5 2.74 0.14
C1d 1.187 1.21 + NA 5 −200.01 410.5 2.77 0.14
C1c 1.159 NA NA NA 3 −202.17 410.5 2.78 0.14
C1a 1.163 NA + NA 4 −202.40 413.2 5.39 0.04
Abbreviations: AG, algae and grazers; AGP, algae, grazers, and predators; AICC, second-order Akaike Information Criterion; δAICC, delta AICC; C1, copepod
abundance model; C1a, copepod abundance model a; C1b, copepod abundance model b; C1c, copepod abundance model c; C1d, copepod abundance model d; Int,
intercept; logLik, logarithmic likelihood; Mod, model; NA, not available.
https://doi.org/10.1371/journal.pbio.2006806.t005
Table 6. Results of model comparisons for effects of temperature and time on NEP based on AIC weight (w) and δAICC values. Nested versions of the full model
(Methods, Eq 12). Response variables are modeled as functions of temperature Twj for each tank j on week w relative to the mean temperature TM for tank j over all weeks
(T in Kelvin), and trophic structure (Zj). Models included a random effect for the experimental unit—tanks with and without predators received the same power inputs.
See Methods for additional details on modeling. The model was fit to 219 observations in 30 groups. The full model (NEPF) includes all terms, and models representing
alternate hypotheses excluded terms indicated by “NA.” Values indicate model-estimated coefficients. Coefficients were pooled (Methods: Statistical analysis) to estimate
slopes and intercepts for Figs 3 and 5.
Mod Int Zj Twj TM Twj�Zj TM
�Zj Twj�TM df logLik AICC δAICC w
NEP8 −6.42 + 0.29 −1.40 NA + + 11 −266.47 556.21 0.00 0.39
NEPF −6.42 + 0.37 −1.42 0.84 + + 12 −265.54 556.60 0.39 0.32
NEP7 −6.41 + 0.03 −1.39 NA NA + 9 −269.68 558.22 2.01 0.14
NEP3 −6.15 NA 0.02 −0.96 NA NA NA 5 −274.36 559.01 2.80 0.10
NEP4 −6.15 NA 0.02 −0.96 0.61 NA NA 6 −273.86 560.12 3.91 0.05
NEP0 −6.15 NA NA NA NA NA NA 3 −283.15 572.41 16.20 0.00
NEP2 −6.15 NA 0.03 NA NA NA NA 4 −283.13 574.44 18.23 0.00
NEP1 −6.26 + NA NA NA NA NA 5 −282.25 574.78 18.57 0.00
NEP6 −6.26 + 0.27 NA NA + NA 8 −279.83 576.34 20.13 0.00
NEP5 −6.26 + 0.03 NA NA NA NA 6 −282.23 576.85 20.64 0.00
Abbreviations: AICC, second-order Akaike Information Criterion; δAICC, delta AICC; NEPF, NEP full model; NEP0, NEP model 0; NE01, NE0 model 1; NEP2, NEP
model 2; NEP3, NEP model 3; NEP4, NEP model 4; NEP5, NEP model 5; NEP6, NEP model 6; NEP7, NEP model 7; NEP8, NEP model 8; Int, intercept; logLik,
logarithmic likelihood; Mod, model; NA, not available. NEP, net ecosystem production.
https://doi.org/10.1371/journal.pbio.2006806.t006
Ecological effects of temperature
PLOS Biology | https://doi.org/10.1371/journal.pbio.2006806 June 10, 2019 13 / 27

we still observed declines in biomass of phytoplankton. This pattern could reflect higher per
capita grazing by the remaining grazer individuals. Algal productivity rates are an important
element of trophic cascade strength [15,34], and higher NEP at warmer temperatures would
contribute to a stronger trophic cascade, even as grazer density declines. As with hypothesis
1, we infer that the effect of temperature on the trophic cascade strength reflects not only the
effect of temperature on per capita metabolic rate but also shifts in algal traits or body sizes, or
both.
We tested a third hypothesis, that the effects of temperature on biomass and trophic cascade
strength would lead to distinct relationships between temperature and NEP and ER for each
Table 7. Results of model comparison for effects of temperature and time on ER based on AIC weight (w) and δAICC values. Nested versions of the full model (Meth-
ods, Eq 12). Response variables are modeled as functions of temperature Twj for each tank j on week w relative to the mean temperature TM for tank j over all weeks (T in
Kelvin), and trophic structure (Zj). Models included a random effect for the experimental unit—tanks with and without predators received the same power inputs. The
model was fit to 240 observations in 30 groups. See “Methods: Statistical analyses” for additional details on modeling.
Mod Int Zj Twj TM Twj�Zj TM
�Zj Twj�TM df logLik AICC δAICC w
ER7 −6.09 + 0.11 −1.32 NA + NA 9 −185.88 390.54 0.00 0.60
ER8 −6.09 + 0.02 −1.32 + + NA 11 −184.58 392.31 1.77 0.25
ERF −6.09 + 0.06 −1.32 + + 0.42 12 −183.97 393.31 2.77 0.15
ER3 −5.79 NA 0.11 −0.67 NA NA NA 5 −201.37 413.00 22.46 0.00
ER4 −5.79 NA 0.11 −0.68 NA NA 0.50 6 −200.45 413.27 22.73 0.00
ER1 −5.94 + NA NA NA NA NA 5 −202.46 415.18 24.64 0.00
ER5 −5.94 + 0.11 NA NA NA NA 6 −201.75 415.85 25.31 0.00
ER6 −5.94 + 0.02 NA + NA NA 8 −200.49 417.60 27.06 0.00
ER0 −5.79 NA NA NA NA NA NA 3 −207.04 420.17 29.63 0.00
ER2 −5.79 NA 0.11 NA NA NA NA 4 −206.32 420.82 30.28 0.00
Abbreviations: AIC, second-order Akaike Information Criterion; δAICC, delta second-order Akaike Information Criterion; ER, ecosystem respiration; ERF, ER full
model; ER0, ER model 0; ER1, ER model 1; ER2, ER model 2; ER3, ER model 3; ER4, ER model 4; ER5, ER model 5; ER6, ER model 6; ER7, ER model 7; ER8, ER model
8; Int, intercept; logLik, logarithmic likelihood; Mod, model; NA, not available.
https://doi.org/10.1371/journal.pbio.2006806.t007
Fig 5. The effect of mean ecosystem temperature on (A) NEP and (B) net ER for three community types that
varied in their trophic interactions: (i) algae-only (A), (ii) algae + grazers (AG), and (iii) algae + grazers
+ notonectid predators (AGP). Black lines indicate the among-ecosystem effects of temperature, modeled by Eq 5
using hierarchical regressions fit to among-ecosystem variation in temperature, after taking into account within-group
variation temperature effects (light lines) (Tables 1, 6 and 7). Temperature dependences within and among tanks were
estimated by best model or best model set (Tables 1, 6 and 7, Methods: Statistical analyses). Temperature in Celsius is
shown for comparison only; models were fit to inverse temperature. All measured data points to which models were
fitted are shown in Fig 6. Temperatures within tanks declined over time (S2 Fig). Data for these figures may be found
at https://doi.org/10.5281/zenodo.2652579 in GarzkeAllwks.csv. A, algae only; AG, algae and grazers; AGP, algae,
grazers, and predators; ER, ecosystem respiration; NEP, net ecosystem production.
https://doi.org/10.1371/journal.pbio.2006806.g005
Ecological effects of temperature
PLOS Biology | https://doi.org/10.1371/journal.pbio.2006806 June 10, 2019 14 / 27

trophic treatment type (e.g., with versus without predators). We found that the effect of tem-
perature on phytoplankton standing stock was much greater than the effects of temperature
on NEP or ER. For NEP and ER, there was support for a model with an interaction between
trophic structure and mean temperature, but for NEP a model without the interaction was
ranked highly (Table 6), and confidence intervals for the pooled estimated temperature
Fig 6. The effect of ecosystem temperature (Twj) on (A) phytoplankton biomass, (B) NEP, and (C) net ER for three community
types that varied in their trophic interactions: (i) algae-only (A), (ii) algae + grazers (AG), and (iii) algae + grazers + notonectid
predators (AGP). There were 10 ecosystems (j) in each trophic treatment, and each ecosystem was sampled 8 times (once per week
from weeks 2 to 9). Each week is indicated by a symbol shape, and ecosystem identities within weeks are distinguished by shades of
gray. In a single model (Eq 13), we considered effects of temperature within ecosystems over time, as well as among-ecosystem
variation in mean temperature (Figs 2 and 5). Blue lines are fit to the 8 observations (points) from each ecosystem (one from each
week), and their slope indicates within-ecosystem temperature effects estimated from best models in Tables 2, 6 and 7. Black lines
indicate the modeled among-ecosystem effects of temperature (Tables 1, 6 and 7; Figs 2A and 5). Temperature in Celsius is shown for
comparison only; models were fit to inverse temperature. Temperatures within tanks declined over time (S2 Fig). Data for these
figures may be found at https://doi.org/10.5281/zenodo.2652579 in GarzkeAllwks.csv. A, algae only; AG, algae and grazers; AGP,
algae, grazers, and predators; ER, ecosystem respiration; NEP, net ecosystem production.
https://doi.org/10.1371/journal.pbio.2006806.g006
Ecological effects of temperature
PLOS Biology | https://doi.org/10.1371/journal.pbio.2006806 June 10, 2019 15 / 27

dependence do not indicate differences in temperature dependences among trophic treat-
ments. Therefore, the strong effects of temperature on community structure (biomass, trophic
cascade strength) did not translate directly to temperature effects on net ecosystem flux rates.
The estimated temperature dependences of NEP and ER were greater than expected based
on temperature-dependent per capita, mass-normalized respiration, and photosynthesis
metabolic rates. It is well established that temperature dependence of aerobic respiration is
approximately ER = 0.65 eV, and that this value explains the temperature dependence of mass-
normalized ecosystem metabolism at the ecosystem scale [2–4]. The temperature dependence
of photosynthesis at suboptimal temperatures appears to be EPS = 0.32 eV for algal systems
(although EPS values of 0.65 eV are also observed), and this can emerge at population [39] and
ecosystem scales [4] in aquatic systems, suggesting ENEP = 0.32–0.65 eV [10,20,49]. Across our
experimental temperature gradient, we observed values of ER> 0.65 eV for both NEP and ER,
although confidence intervals for ER did include this value (Fig 3) for algae-only ecosystems.
These results led us to reject the “first-order metabolic theory” hypotheses that temperature
dependence of ecosystem functions scales directly with general temperature dependence of
metabolism. Our results further suggest that changes in species interactions within communi-
ties, such as loss or gain of a predator species, could alter the responses of net ecosystem fluxes
to temperature changes.
Temperature had a stronger effect on phytoplankton standing stock than on NEP. This dif-
ference in phytoplankton biomass and oxygen-flux responses to temperature could reflect sev-
eral processes operating at different scales of organization. First, we expect that per capita rates
of oxygen flux increase with warming, so that a given biomass of phytoplankton can be more
productive at warmer temperatures if resources are not limiting [4,46,50]. Patterns at the eco-
system scale could deviate from expectations based on direct metabolic scaling of per capita
metabolism if size distributions shift toward smaller cells, as is common with warming, as
described by the temperature size rule [23,51]. The allometric scaling of metabolic rate with
body size (Eq 2) predicts greater oxygen flux for a given total biomass comprised of small indi-
viduals. The distribution of thermal tolerance phenotypes may have shifted within the phyto-
plankton communities. Three months may be sufficient time for evolutionary change [52]. We
did not see clear evidence of shifts in species composition with temperature, and it is likely
that the species we collected to inoculate our ecosystems were able to tolerate our experimental
conditions because we collected them from a shallow lake in Vancouver in which the water
temperature likely tracks summertime air temperatures, therefore experiencing temperatures
between 19 and 30 ˚C. Our experimental ecosystems likely did not expose zooplankton to tem-
peratures outside what they would have experienced in a natural system, and we therefore
assume they were adapted to these conditions.
In addition to the effects of temperature on per capita metabolism and size structure, at the
ecosystem scale, effective resource supply may have changed with temperature, violating an
implicit assumption of Eqs 1–4. Even though these were closed ecosystems with regard to
external influxes of nutrients, and they experienced the same light conditions, internal nutrient
processes could have varied with temperature in ways that made nutrients more available in
warmer ecosystems. For example, our ecosystems did not include a benthic habitat that can
store nutrients and organic material and slow down nutrient cycling. Heterotrophic microbial
processes responsible for rapid nutrient turnover would be accelerated by temperature, per-
haps making nutrients available in warmer systems more than in colder systems. Another
potential, and speculative, explanation for higher productivity than expected in warmer eco-
systems is that some algae species are capable of biological nitrogen fixation [53], and this
activity is more feasible at higher temperatures. These two biological processes that are them-
selves temperature dependent could create a resource gradient in parallel with the temperature
Ecological effects of temperature
PLOS Biology | https://doi.org/10.1371/journal.pbio.2006806 June 10, 2019 16 / 27

gradient [15,50], leading to higher than expected NEP at warmer temperatures relative to the
same ecosystem at cooler temperatures.
Although there was no benthic sediment in our ecosystems, algae likely colonized the sides
and bottom of the tanks. Benthic algae may also have contributed to NEP and ER estimates in
our systems [54]. We did not observe notable amounts of accumulated benthic algae, but even
small amounts could have contributed to total ecosystem fluxes and led to covariation in total
biomass with temperature. If the ratio of phytoplankton to benthic algae was temperature-
dependent [54], our primary producer biomass estimates may have increasingly underrepre-
sented total algal biomass at higher temperatures. To be conservative, we did not present
mass-normalized NEP estimates because we could not normalize to any benthic algal meta-
bolic biomass. Covariation between biomass and temperature is common across geographic
variation in temperature [12,20,53] and therefore present in other estimates of NEP across
broad spatial scales when biomass cannot be estimated well.
Across mean ecosystem temperatures of 19–30 ˚C, we observed no sign of ecosystem col-
lapse or threshold responses to warming. Changes in community structure and the increase in
trophic control along the temperature gradient appear to be exponential and monotonic over
the 10 ˚C gradient (Eq 2), suggesting that linear (or additive) models of temperature effects in
most warming experiments, which only test two or three temperatures, may underestimate
warming effects over broader thermal gradients. We observed little evidence of abrupt transi-
tions that might be expected if thermal stress responses by individual phenotypes drove ecosys-
tem-scale responses. We did observe declines in grazer density with warming even in the
absence of predators, suggesting there were direct or indirect negative effects of temperature
on grazers. But we did not see clear shifts in algal species composition among treatments, sug-
gesting that no species group was exposed to temperatures above its critical thermal maximum.
Another challenging aspect of warming experiments at the population and community scales
is interpreting patterns in the context of transient dynamics. Our ecosystems certainly did not
reach long-term states, because varying weather conditions and multi-week generation times
of zooplankton would have precluded that. Still, we did not observe signs of transient dynam-
ics in these communities over time, such as population cycles or abrupt changes.
In our systems, algal biomass and zooplankton abundance in food webs were more resistant
to temperature in the presence of longer food chains. Predators reduced zooplankton density
and caused a clear trophic cascade. Trophic control, and therefore any mitigating effects of
predators on biomass change, was weak at low temperatures and increasingly strong at higher
temperatures (A versus AG treatment, Fig 3). This pattern is consistent with previous findings
that ecosystem functions in systems with two (or even numbers of) trophic levels tend to be
more sensitive to warming than systems with odd numbers, due to cascading effects of preda-
tion on primary producers [48]. Additionally, in our experiment, predators were not dynami-
cally responsive; they did not have time to reproduce during the experiment. Consequently,
they represent mortality for zooplankton that may have varied with temperature effects on per
capita predation rates by predators, but not a dynamic demographic response that could lead
to different outcomes for prey [55]. In many systems, predators are subsidized by other habi-
tats and food sources, and their populations are not dynamically coupled to prey [56]. In fact,
this decoupling has been shown to be important in thermally stratified lakes [57]. Inferences
drawn based on this experiment about how species interactions affect community and ecosys-
tem responses are restricted to systems with dynamics in the primary producers and primary
consumers, with predation-related mortality imposed by a third trophic level through per cap-
ita consumption effects but not population dynamics of the predators.
The growing literature of experimental tests of how warming affects interacting species
aims to reduce uncertainty in projected ecological changes associated with climate change.
Ecological effects of temperature
PLOS Biology | https://doi.org/10.1371/journal.pbio.2006806 June 10, 2019 17 / 27

Warming experiments have shown a wide variety of consequences for species interactions,
from shifts in community composition, strengthening top-down control, and shifts in body
size [16,18,54]. We have shown that these shifts do alter the effects on the temperature depen-
dence of net ecosystem oxygen production and consumption as modeled by the MTE, but that
these models may be extended to consider community-level changes. By measuring commu-
nity and ecosystem responses over a broad thermal gradient under controlled conditions, we
have provided empirical evidence that large effects of temperature on community biomass can
occur in the context of less strong effects of temperature on net ecosystem function. This is a
step toward closing the gap between patterns observed across ecosystems that appear to reflect
effects of temperature on metabolic rates, and observations at intermediate scales that temper-
ature can have large effects on the abundance of species. Taken together, these results suggest
our efforts to predict community change with warming may benefit from the general meta-
bolic scaling theory framework to understand even local-scale effects of temperature change at
the community level.
Methods
Experimental design and setup
We assembled freshwater food webs in 30 outdoor mesocosms (370-L tanks) at the University
of British Columbia, Vancouver, Canada (49˚14’52” N, 132˚13’57” W). Mesocosms were filled
with municipal water on June 26, 2012, heaters were added, and filled tanks were left for 1
week to allow chlorine to evaporate before organisms were introduced. We experimentally
manipulated temperature (10 levels) and trophic structures (algae-only [A], algae + grazer
[AG], and algae + grazer + predator [AGP], Fig 1). There was one tank per temperature per
trophic treatment; statistical power was derived from the regression design rather than replica-
tion within treatment levels (see Methods: Statistical analysis). We monitored temperature
continuously and sampled biotic variables once per week for 9 weeks. Tanks were arranged
randomly in space with regard to treatment. The spatially randomized assignment of tempera-
ture and trophic treatments eliminated systematic variation in negligible allochthonous carbon
inputs.
On July 2, 2012, mesocosms were inoculated with pond water (1 L) from the UBC Pond
Facility containing living algae, collected and filtered through a 64-μm sieve to remove zoo-
plankton and larvae. Three days later, we collected zooplankton at Trout Lake, Vancouver, BC
(49˚15’23” N, 123˚03’44” W), with a vertical tow net (64-μm mesh). Zooplankton were mixed
in buckets to homogenize species composition, were introduced to mesocosm temperatures
over a 12-hour gradual acclimation period to avoid stress associated with an abrupt tempera-
ture change, and dead organisms were removed. Initial experimental communities consisted
of 25 phytoplankton taxa (S2 Table), and those with zooplankton included predominantly two
zooplankton taxa (cladocerans Daphnia sp. and calanoid copepod Eurytemora sp.) and, rarely,
cyclopoid copepods. To ensure colonization of grazing zooplankton, in addition to the ran-
dom aliquot of zooplankton added to each zooplankton ecosystem (all algae-grazer and algae-
grazer-predator ecosystems), we added two individuals of Daphnia sp. and ten Eurytemora sp.
Thus, each zooplankton community began with at least 12 grazing zooplankton individuals.
We introduced two individual notonectid predators (Notonecta undulata), collected from
ponds at the UBC Pond Facility, on July 4, 2012 to 10 algae-grazer-predator tanks. Notonectids
generate trophic cascades by suppressing zooplankton [58]. Notonectids did not reproduce
during the experiment, and we replaced dead notonectids during the experiment with similar-
sized individuals from the same source population.
Ecological effects of temperature
PLOS Biology | https://doi.org/10.1371/journal.pbio.2006806 June 10, 2019 18 / 27

We added 160 μg NaNO3 L−1 and 10 μg KH2PO4 L−1 to each tank (16:1 N:P) on July 3,
2012. These quantities of nutrients represent typical deposition inputs to similar lakes [59].
Water was heated with submersible aquarium heaters (50-, 100-, 150-, 200-, 250-, 300-, 350-,
400-, and 450-watt) to increase temperature above ambient daily temperature. Temperatures
were recorded hourly using Thermochron iButton data loggers. Data loggers were suspended
in the middle of the tanks, approximately halfway between the surface and the bottom. Tem-
perature differences among tanks were consistent throughout the course of the experiment (S2
Fig). Heaters were placed at the bottom of the mesocosms. Mesocosms were covered with two
layers of window screen to minimize colonization by other invertebrates. Water levels were
maintained by natural precipitation and weekly additions to maintain volume.
Plankton sampling and analysis
We sampled phytoplankton, chlorophyll a, zooplankton, and oxygen concentrations weekly
until August 28, 2012. We sampled algal assemblages in 100-mL water samples collected from
approximately 40 cm below the surface. We counted and identified cells using the Utermohl
sedimentation method [60] and identified algae species or taxon level by inverted microscopy.
We estimated chlorophyll a concentration using a Trilogy fluorometer (Turner Designs).
Chlorophyll a concentration can be used as a proxy for biomass, and although the ratio
between chlorophyll a and total biomass can itself vary with temperature, size, and species
composition [61,62], the chlorophyll a concentration represents biomass allocated to photo-
synthesis and NEP, our measure of ecosystem function. We measured oxygen concentrations
in situ using YSI-85 oxygen sensor (Yellow Springs Instruments, Yellow Springs, OH).
We collected zooplankton samples using a “depth integrated zooplankton sampler.” The
device is a cylinder 4 cm in diameter and 60 cm in length with a cap at one end. We mixed
mesocosm water gently, then submerged the sampler vertically, sealed it, removed it, and
dumped water into a bucket. We repeated until we had removed 10 L of water, which was then
filtered through a 64-μm mesh to collect zooplankton, and then the filtered water was returned
to mesocosms. Plankton was fixed with Lugol’s iodine solution (5%). Under 10× magnifica-
tion, we counted and identified zooplankton to genus level and measured the standard length
for all development stages in weeks 4−8.
Estimation of biomass and oxygen fluxes
We estimated whole ecosystem oxygen fluxes using the dissolved oxygen (DO) change tech-
nique [63]. Oxygen production during the daytime is the product of photosynthesis minus res-
piration (NEP), and oxygen depletion during the night is the result of respiration (ER). We
compared DO concentrations measured over 24 hours (dawn, dusk, and the following dawn).
Comparison of oxygen concentrations at dawn, dusk, and dawn of the following day (Eq 5)
can indicate not only the cumulative biotic NEP and ER fluxes during that time interval but
also differences in water temperature that affect oxygen concentrations in water. At standard
pressure, which is appropriate for our experiment near sea level, oxygen saturation can change
by approximately 1 mg/L with a change in temperature of 5 ˚C, described by
½O2�E ¼ eð½O2 �water � ½O2 �sat�lnðTþ45:93ÞÞ; ð5Þ
where [O2]water is the O2 concentration of water, [O2]sat is the concentration the water would
have if it were at equilibrium with the atmosphere (390 μatm), and T is temperature of the
observation (˚C) [64]. For the differences in temperature we observed, corrections were on
the order of mean 0.0002 ± SD 0.0008 μmol O2/L/hour for NPP, and mean 0.0008 ± SD
0.0003 μmol O2/L/hour for ER. Because these values are within 25% of our total observed
Ecological effects of temperature
PLOS Biology | https://doi.org/10.1371/journal.pbio.2006806 June 10, 2019 19 / 27

changes in oxygen during those periods (mean 0.003 ± SD 0.001 μmol O2/L/hour for NEP and
mean 0.003 ± SD 0.002 μmol O2/L/hour for ER), we included the correction in our analyses.
Overall, the conclusions based on model selection did not depend strongly on the use of the
correction.
We estimated NEP and ER by converting changes in observed O2 (mg L−1) between day-
time observation times (tdawn, tdusk) and overnight observations (tdusk, tdawn2) to micromolar
concentration (z = 31.25 μmol/1 mg), and correcting for changes in estimated equilibrium
oxygen concentration ([O2]E) (Eq 5) due to changes in saturation state with temperature at
each time:
NEP ¼ð½O2�dusk� ½O2�dawnÞ � ð½O2�Edusk � ½O2�EdawnÞ
z�ðtdusk � tdawn1
� �
ð6Þ
ER ¼ð½O2�dawn2
� ½O2�duskÞ � ð½O2�Edawn2� ½O2�EduskÞ
z�ðtdawn2 � tduskÞ
� �
: ð7Þ
Model and hypothesis development
The expression of temperature effects on a per capita metabolic rate bi—in our case, oxygen
production via photosynthesis or consumption via respiration—in this model is a special case
of a more complex equation that allows each species to follow a thermal performance curve
(TPC), often described by a modified Sharpe-Schoolfield equation [10,20,65], in which an
individual’s or population’s performance declines at high temperatures above some optimal
temperature. We do not use this TPC model here for two reasons: we do not expect photosyn-
thesis or respiration to exceed optimal operating temperatures in our system for most taxa,
based on the fact that we collected them locally from a lake and habitat type (shallow pond)
near the experimental site. We model our system using equations based on Eq 2. We believe
this simpler exponential model is a suitable hypothesis for cross-system comparison in which
community phenotypes or taxonomic composition may turn over along the thermal gradient
[17,23]. We do not have thermal performance data for the many species in our communities
that would allow fitting of TPCs within communities to test an alternate approach.
We modeled MB (Eq 3) by including a term for trophic treatment (Zj) in the intercept term
(Eq 3 rearranged and log transformed):
lnðMBÞ ¼ lnBR
Zj�b0ðTCÞhma� 1B i
!
þ EMB1=kTj �
1=kTC
� �ð8Þ
We derived the expression for the trophic cascade by relating algal biomass in the AGP and
AG treatments:
MB:AGP
MB:AG¼
BR:AGP eER
�1=kT �
1=kTC
�
ðb0ðTCÞÞAGPhma� 1B iAGP
BR:AG eER
�1=kT �
1=kTC
�
ðb0ðTCÞÞAGhma� 1B iAG
ð9Þ
We then simplified and added temperature dependence of mass (Em) and normalization
constants (Eb). In the absence of additional information about their functional forms, we used
general Arrhenius functions, but we note that other functions could be used if appropriate.
Consequently, the ratio ofMB with and without predators may vary with temperature
Ecological effects of temperature
PLOS Biology | https://doi.org/10.1371/journal.pbio.2006806 June 10, 2019 20 / 27

according to the relative temperature dependences of thermal traits and size distributions:
MB:AGP
MB:AG/
b0ðTCÞAGe� Eb:ag=kThma� 1
B iAGe� Em:ag=kT
b0ðTCÞAGPe� Eb:agp=kThma� 1
B iAGPe� Em:agp=kT
ð10Þ
and the strength of the trophic cascade may therefore be expected to decline with a tempera-
ture dependence that reflects the temperature dependences of mass and normalized perfor-
mance for each trophic treatment:
lnMB:AGP
MB:AG
� �
/lnðb0ðTCÞAGÞ þ ln hm
a� 1B iAG
� ��
Eb:ag � Em:agkT
lnðb0ðTCÞAGPÞ þ ln hma� 1B iAGP
� ��
Eb:agp � Em:agpkT
ð11Þ
We modeled zooplankton density (N/L) as a function of mean weekly ecosystem tempera-
ture Twj and ecosystem trophic structure Zj, with ecosystem identity as a random effect.
Statistical analysis
We tested our hypotheses about whether the effects of temperature on metabolism are modified
at the ecosystem level by species interactions using a regression experimental design involving 30
independent ecosystems (Fig 1). We maintained ecosystems at distinct temperatures in a regres-
sion design, with mean ecosystem temperatures Twj ranging from 19.7 (±3.15) ˚C to 26.1 (±3.59)
˚C (S2 Fig). The regression design allowed us to estimate slopes (e.g., ER, Eq 2) of response vari-
ables along a continuous temperature gradient for different trophic structures (A, AG, AGP) by
log transforming Eq 2 and fitting linear models to log-transformed response variables along the
continuous temperature gradient. We chose the regression design, although unreplicated within
temperature levels, because it allowed us to compare activation energies (ER, Eq 2) fitted over a
broad range of temperatures; an important test of thermal responses that is not possible with
designs with only two or even three temperature levels. Regression designs, even without replica-
tion within levels, gain statistical power from the range of x-levels tested [66,67].
We used a mixed effects model (lme function in the nlme package of R) to examine the
main and interactive effects of temperature (a continuous fixed factor) and trophic structure
(a categorical fixed factor) on net ecosystem oxygen production (NEP), net ecosystem oxygen
consumption (ER), and chlorophyll a concentration, with a random intercept for individual
ecosystems. We used a within-subject mean centering approach to distinguish temperature
effects into those associated with an ecosystem’s average temperature (Tj) over the entire
experimental period (a “between-ecosystem” effect) from effects variation in temperature over
time (Twj) (a within-ecosystem temperature” effect) [68]. The response variable (Y) for each
ecosystem j in week w was modeled as a continuous response to variation in inverted ecosys-
tem temperature (1/kTwj) and trophic treatment (Zj):
lnðYwjÞ ¼ b0:jðwÞ þ b11=kTwj �
1=k�T j
� �þ b2
1=k�T j
� �þ b3
1=kTwj �1=k�T j
� �1=k�T j
� �þ b4Zj
þ b5Zj1=k�T j
� �þ b6Zj
1=k�T j� 1=k�T j
� �þ uj þ ewj ð12Þ
where β0.j(i) represents an intercept allowed to vary randomly among ecosystems. The terms in
the full model (Eq 12) are the between-ecosystem effect of temperature (β2), estimated as the
slope of ln(Ywj) on the mean temperature over all weeks for ecosystem j, expressed as inverse
temperature 1=k�T j
� �; the within-ecosystem (β1) effect of temperature variation over time, esti-
mated as the slope of ln(Ywj) versus centered weekly temperature 1=k�Twj
� �� 1=k�T j
� �; interac-
tion (β3) between within-ecosystem temporal variation in temperature and the experimental
Ecological effects of temperature
PLOS Biology | https://doi.org/10.1371/journal.pbio.2006806 June 10, 2019 21 / 27

temperature treatment; trophic species interactions (β4); and interactions between species
interactions and overall mean (β5) and weekly temperature (β6).To test our hypothesis that species interactions modify the temperature dependence (ER,
Eq 2) of response variables (Y), we compared models with and without trophic-level terms
(β4) and interactions between Zj and temperature (β5, β6). We also tested models without
temperature terms for within-system variation (β4). In total, the model set included nine
models (Table 1). Response variables were ln transformed prior to analyses to achieve nor-
mal distributions, to linearize temperature effects for analysis, and to fit ER values from Eq 2.
When modeling, we centered temperature treatment (1/kTj) on the grand mean of all tem-
peratures observations �T (not shown in Eq 12) to reduce correlations between slope and
intercept terms [69].
To test the effect of temperature on trophic cascade strength, we used the following statisti-
cal model:
lnðTCijÞ ¼ b0:pðwÞ þ b1 �1=kTwp �
1=k�Tp
� �þ b2 � wþ b3 �
1=kTwp �1=k�Tp
� �� wþ up þ ewp; ð13Þ
in which the effect of temperature on trophic cascade strength in each temperature treatment jwas modeled for each week w and for the temperature of the tanks, with random effects ujassigned for each power treatment (p).
We ranked models using Akaike’s Information Criterion weights (using the MuMin pack-
age in R), adjusted for small sample sizes (AICC). When two or more models were considered
comparable or equivalent (δAICC < 2), we reported all models meeting this criterion and
report averaged coefficients. We estimated the realized temperature dependence of our
response variables (slopes) and intercepts for among-ecosystem responses to temperatures by
first rearranging Eq 13 to group coefficients by temperature term.
lnðYjwÞ ¼ b0:jðwÞ þ b1 þ b3 �1=k�T j
� �þ b6 � Zj
� �1=kTwj �
1=k�T j
� �þ b2 þ b5 � Zj� �
� 1=k�T j
� �
þ b4 � Zj þ uj þ ewj: ð14Þ
The pooled coefficients (β2 + β5� Zj) include the temperature dependence of ecosystem
responses plus any variation with trophic structure, and give the slope of lines plotted in Figs
2A and 5. The intercept is set by β0.j(w) + β4� Zj, and the remaining coefficient gives within-
tank variation as plotted in Fig 6. We estimated confidence intervals for composite terms
following [70]. We used R statistical software (R v. 3.5.0 R Developmental Core Team). Our
models controlled for the effect of temperature variation over time on ecosystem fluxes and
biomass within systems.
We determined the effects of temperature and predator presence on zooplankton abun-
dance data using LMMs with tank as a random effect. We ln transformed data and added 1 to
analyze observations of 0 observed zooplankton. In many tanks in which we observed 0 zoo-
plankton in one week, we later observed zooplankton in the same tank. We infer that our
observed 0s are most likely failure to observe zooplankton that were in fact present in low den-
sities, so for this reason, we analyzed 0s as ln(1).
Supporting information
S1 Table. Chlorophyll concentration (ln[Chla]) declined over time and varied with trophic
treatment. There was a significant temperature � week interaction when we included all the
data, from weeks 2−9 (Table S1A). When we used a smaller data set including observations
from only weeks 2 to 7, we found evidence for a slight increase in chlorophyll concentration
Ecological effects of temperature
PLOS Biology | https://doi.org/10.1371/journal.pbio.2006806 June 10, 2019 22 / 27

over time (Table S1B). Together, these results suggest that the negative trend in chlorophyll
concentration is driven by the drop in week 8 across all treatments. This is concurrent with a
cooling event and a large storm.
(DOCX)
S2 Table. (A) Zooplankton average body size model selection results. We measured sizes of
641 individual zooplankton. We modeled log(length) of zooplankton in terms of ecosystem
weekly temperature (Twj), taxon (copepod or Daphnia), trophic treatment (AG, AGP), and
their interactions. NA indicates that the term was not included in the model. (B) Estimated
lengths of Daphnia and copepods in treatments with and without predators, from model m2g
(Table S2A). AG, algae and grazers; AGP, algae, grazers, and predators; NA, not available.
(DOCX)
S3 Table. Phytoplankton species composition and sampling methods. Weekly, we sampled
algal assemblages in 100-mL water samples collected from approximately 40 cm below the sur-
face. We used 10-mL subsamples for the identification and counting from each mesocosm.
Subsamples were placed in settling chambers and allowed to settle for 24 hours. We counted
and identified cells to taxon level using an inverted microscope and the Utermohl sedimenta-
tion method [35]. Phytoplankton density was corrected for volume in each sample using
#cells/L = avg cells/field � (F/chamber volume). Cell sizes of phytoplankton taxa were not mea-
sured directly; we assigned average cell sizes to each taxon from literature data using the data-
bases www.algaebase.org and www.diatom.org. A water sample 100–300 mL in volume from
each mesocosm was filtered onto a 0.2-μm GF/F filter; the water volume varied with the chlo-
rophyll a content. Chlorophyll a was extracted from the filters in 90% acetone. Chlorophyll aconcentration, measured in μg/L, was determined fluorometrically using a Trilogy fluorometer
(Turner Designs) following Wetzel and Liken (2000).
(DOCX)
S1 Fig. Algal community composition in experimental ecosystems shifted over time. Non-
metric multidimensional scaling plot (NMDS) of temporal phytoplankton taxonomic compo-
sition for all temperature treatments and trophic levels (Taxa listed in S3 Table). Taxonomic
abundances are square root transformed. Each point represents one ecosystem observed at
one time, and hotter colors are communities at higher temperatures. NMDS is an iterative
search for positions of species, time, temperature, and food chain length on few dimensions
(axes) that minimizes departure from monotonicity in the association between distance (dis-
similarity) in the original data and ordination space. See S3 Fig for comparisons of phyto-
plankton taxonomic composition versus temperature. NMDS, nonmetric multidimensional
scaling plot.
(JPG)
S2 Fig. Temperatures from data loggers in ecosystems illustrate a cooling trend over the
course of the experiment, and variable temperatures from day to day. Differences among
ecosystems were maintained by heaters of different power (watts). Red colors indicate warmer
ecosystems at higher wattage and blue colors indicate cooler ecosystems.
(JPG)
S3 Fig. Temperature did not clearly shift algal community composition in experimental
ecosystems. Nonmetric multidimensional scaling plot (NMDS) of temporal phytoplankton
taxonomic composition for all temperature treatments and trophic levels (taxa listed in S1
Table). Taxonomic abundances are square root transformed. Each point represents one eco-
system observed at one time, and lighter colors are communities at higher temperatures.
Ecological effects of temperature
PLOS Biology | https://doi.org/10.1371/journal.pbio.2006806 June 10, 2019 23 / 27

NMDS is an iterative search for positions of species, time, temperature, and food chain length
on few dimensions (axes) that minimizes departure from monotonicity in the association
between distance (dissimilarity) in the original data and ordination space. See S2 Fig for com-
parisons of phytoplankton taxonomic composition versus week. NMDS, nonmetric multidi-
mensional scaling plot.
(JPG)
S4 Fig. Phytoplankton abundance, estimated as ln[chlorophyll a], for each observation
date over the course of the experiment. Lines connect observations from the same ecosystem.
Trophic treatments are separated: A, algae only; AG, algae + grazers; and AGP, algae + grazers
+ predators.
(JPG)
Acknowledgments
We thank S. Pawar and his lab group, J. Bernhardt, R. Elahi, and P. Thompson for comments
and feedback that improved this manuscript; W. Cheung and F. Ratcliffe for sampling assis-
tance; and D. Song for assistance during zooplankton identification.
Author Contributions
Conceptualization: Jessica Garzke, Mary I. O’Connor.
Data curation: Mary I. O’Connor.
Formal analysis: Jessica Garzke, Stephanie J. Connor, Mary I. O’Connor.
Funding acquisition: Jessica Garzke, Ulrich Sommer, Mary I. O’Connor.
Investigation: Jessica Garzke, Stephanie J. Connor, Mary I. O’Connor.
Methodology: Jessica Garzke, Stephanie J. Connor, Ulrich Sommer, Mary I. O’Connor.
Resources: Ulrich Sommer, Mary I. O’Connor.
Supervision: Mary I. O’Connor.
Visualization: Jessica Garzke, Mary I. O’Connor.
Writing – original draft: Jessica Garzke.
Writing – review & editing: Jessica Garzke, Stephanie J. Connor, Ulrich Sommer, Mary I.
O’Connor.
References1. Gillooly JF, Enquist BJ, Brown JH, West GB, Savage V, Charnov EL. Effects of Size and Temperature
on Metabolic Rate. Science. 2001; 293: 2248–2251. https://doi.org/10.1126/science.1061967 PMID:
11567137
2. Allen AP, Gillooly JF, Brown JH. Linking the global carbon cycle to individual metabolism. Funct Ecol.
2005; 19: 202–213.
3. Yvon–Durocher G, Caffrey JM, Cescatti A, Dossena M, del Giorgio P, Gasol JM, et al. Reconciling the
temperature dependence of respiration across timescales and ecosystem types. Nature. 2012; 487:
472–476. https://doi.org/10.1038/nature11205 PMID: 22722862
4. Lopez–Urrutia A. Scaling the metabolic balance of the oceans. Proc Natl Acad Sci USA. 2006; 103: 22:
1–6.
5. Louca S, Polz MF, Mazel F, Albright MBN, Huber JA, O’Connor MI, et al. Function and functional redun-
dancy in microbial systems. Nat Ecol Evol. 2018; 2: 936–943. https://doi.org/10.1038/s41559-018-
0519-1 PMID: 29662222
Ecological effects of temperature
PLOS Biology | https://doi.org/10.1371/journal.pbio.2006806 June 10, 2019 24 / 27

6. Yvon–Durocher G, Dossena M, Trimmer M, Woodward G, Allen AP. Temperature and the biogeogra-
phy of algal stoichiometry. Global Ecol Biogeogr. 2015; 24: 562–570.
7. Lopez–Urrutia A. The metabolic theory of ecology and algal bloom formation. Limnol Oceanogr. 2008;
53: 2046–2047.
8. Cheung WWL, Watson R, Pauly D. Signature of ocean warming in global fisheries catch. Nature. 2013;
497: 365–368. https://doi.org/10.1038/nature12156 PMID: 23676754
9. Anderson–Teixeira KJ, Vitousek PM, Brown JH. Amplified temperature dependence in ecosystems
developing on the lava flows of Mauna Loa, Hawai’i. Proc Natl Acad Sci USA. 2008; 105: 228–233.
https://doi.org/10.1073/pnas.0710214104 PMID: 18156366
10. Barneche DR, Kulbicki M, Floeter SR, Friedlander AM, Maina J, Allen AP. Scaling metabolism from indi-
viduals to reef–fish communities at broad spatial scales. Ecol Lett. 2014; 17: 1067–1076. https://doi.org/
10.1111/ele.12309 PMID: 24943721
11. Kerkhoff AJ, Enquist BJ, Elser JJ, Fagan WF. Plant allometry, stoichiometry and the temperature–
dependence of primary productivity. Global Ecol Biogeogr. 2005; 14: 585–598.
12. Michaletz ST, Cheng D, Kerkhoff AJ, Enquist BJ. Convergence of terrestrial plant production across
global climate gradients. Nature. 2014; 39: 1–13.
13. Uszko W, Diehl S, Englund G, Amarasekare P. Effects of warming on predator–prey interactions—a
resource–based approach and a theoretical synthesis. Ecol Lett. 2017; 20: 513–523. https://doi.org/10.
1111/ele.12755 PMID: 28266168
14. Rall BC, Vucic–Pestic O, Ehnes RB, Emmerson M, Brose U. Temperature, predator–prey interaction
strength and population stability. Glob Change Biol. 2010; 16: 2145–2157.
15. Gilbert B, Tunney TD, McCann KS, DeLong JP, Vasseur DA, Savage V, et al. A bioenergetic framework
for the temperature dependence of trophic interactions. Ecol Lett. 2014; 17: 902–914. https://doi.org/10.
1111/ele.12307 PMID: 24894409
16. Shurin JB, Clasen JL, Greig HS, Kratina P, Thompson PL. Warming shifts top–down and bottom–up
control of pond food web structure and function. Philos Trans R Soc B, 2012; 367: 3008–3017.
17. O’Connor MI, Piehler MF, Leech DM, Anton A, Bruno JF. Warming and Resource Availability Shift Food
Web Structure and Metabolism. PLoS Biol. 2009; 7: e1000178. https://doi.org/10.1371/journal.pbio.
1000178 PMID: 19707271
18. O’Gorman EJ, Zhao L, Pichler DE, Adams G, Friberg N, Rall BC, et al. Unexpected changes in commu-
nity size structure in a natural warming experiment. Nat Clim Chang. 2017; 7: 659–663.
19. Brauer VS, de Jonge VN, Buma AGJ, Weissing FJ. Does universal temperature dependence apply to
communities? An experimental test using natural marine plankton assemblages. Oikos. 2009; 118:
1102–1108.
20. Padfield D, Lowe C, Buckling A, Ffrench–Constant R, Student Research Team, Jennings S, et al. Meta-
bolic compensation constrains the temperature dependence of gross primary production. Ecol Lett.
2017; 20: 1250–1260. https://doi.org/10.1111/ele.12820 PMID: 28853241
21. Atkinson D. Temperature and Organism Size − A Biological Law for Ectotherms? Adv Ecol Res. 1994;
25: 1–58.
22. DeLong JP. Experimental demonstration of a “rate–size” trade–off governing body size optimization.
Evol Ecol Res. 2012; 14: 343–352.
23. Forster J, Hirst AG, Atkinson D. Warming–induced reductions in body size are greater in aquatic than
terrestrial species. Proc Natl Acad Sci USA. 2012; 109: 19310–19314. https://doi.org/10.1073/pnas.
1210460109 PMID: 23129645
24. Englund G, Ohlund G, Hein CL, Diehl S. Temperature dependence of the functional response. Ecol
Lett. 2011; 14: 914–921. https://doi.org/10.1111/j.1461-0248.2011.01661.x PMID: 21752171
25. Siegle MR, Taylor EB, O’Connor MI. Prior heat accumulation reduces survival during subsequent
experimental heat waves. J Exp Mar Biol Ecol. 2018; 501: 109–117.
26. Dell AI, Pawar S, Savage VM. Systematic Variation in the Temperature Dependence of Physiological
and Ecological Traits. Proc Natl Acad Sci USA. 2011; 108: 10591–10596. https://doi.org/10.1073/pnas.
1015178108 PMID: 21606358
27. Sentis A, Ramon–Portugal F, Brodeur J, Hemptinne J–L. The smell of change: warming affects species
interactions mediated by chemical information. Glob Change Biol. 2015; 21: 3586–3594.
28. Sentis A, Binzer A, Boukal DS. Temperature–size responses alter food chain persistence across envi-
ronmental gradients. Ecol Lett. 2017; 20: 852–862. https://doi.org/10.1111/ele.12779 PMID: 28544190
29. Kratina P, Greig HS, Thompson PL, Carvalho–Pereira TSA, Shurin JB. Warming modifies trophic cas-
cades and eutrophication in experimental freshwater communities. Ecology. 2012; 93: 1421–1430.
PMID: 22834382
Ecological effects of temperature
PLOS Biology | https://doi.org/10.1371/journal.pbio.2006806 June 10, 2019 25 / 27

30. Atwood TB, Hammill E, Greig HS, Kratina P, Shurin JB, Srivastava DS, et al. Predator–induced reduc-
tion of freshwater carbon dioxide emissions. Nat Geosci. 2013; 6: 191–194.
31. Barton BT, Beckerman AP, Schmitz OJ. Climate warming strengthens indirect interactions in an old-
field food web. Ecology. 2009; 90: 2346–2351. PMID: 19769112
32. Schindler DE, Carpenter SR, Cole JJ, Kitchell JF, Pace ML. Influence of food web structure on carbon
exchange between lakes and the atmosphere. Science. 1997; 277: 248–251.
33. Polis GA, Sears ALW, Huxel GR, Strong DR, Maron J. When is a trophic cascade a trophic cascade?
Trends Ecol Evol. 2000; 15: 473–475. PMID: 11050351
34. DeLong JP, Gilbert B, Shurin JB, Savage VM, Barton BT, Clements CF, et al. The Body Size Depen-
dence of Trophic Cascades. Am Nat. 2015; 185: 354–366. https://doi.org/10.1086/679735 PMID:
25674690
35. Estes JA, Terborgh J, Brashares JS, Power ME, Berger J, Bond WJ, et al. Trophic Downgrading
of Planet Earth. Science. 2011; 333: 301–306. https://doi.org/10.1126/science.1205106 PMID:
21764740
36. Atwood TB, Hammill E, Kratina P, Greig HS, Shurin JB, Richardson JS. Warming alters food web–
driven changes in the CO2 flux of experimental pond ecosystems. Biol Lett. 2015; 11.
37. Brown JH, Gillooly JF, Allen AP, Savage VM, West GB. Toward a Metabolic Theory of Ecology. Ecol-
ogy. 2004; 85: 1771–1789.
38. Price CA, Weitz JS, Savage VM, Stegen J, Clarke A, Coomes DA, et al. Testing the metabolic theory of
ecology. Ecol Lett. 2012; 15: 1465–1474. https://doi.org/10.1111/j.1461-0248.2012.01860.x PMID:
22931542
39. Bernhardt JR, Sunday JM, O’Connor MI. Metabolic Theory and the Temperature–Size Rule Explain the
Temperature Dependence of Population Carrying Capacity. Am Nat. 2018; 192: 687–697. https://doi.
org/10.1086/700114 PMID: 30444656
40. Katechakis A, Stibor H, Sommer U, Hansen T. Changes in the phytoplankton community and microbial
food web of Blanes Bay (Catalan Sea, NW Mediterranean) under prolonged grazing pressure by dolio-
lids (Tunicata), cladocerans or copepods (Crustacea). Mar Ecol Prog Ser. 2002; 234: 55–69.
41. Osmond MM, Barbour MA, Bernhardt JR, Pennell MW, Sunday JM, O’Connor MI. Warming–Induced
Changes to Body Size Stabilize Consumer–Resource Dynamics. Am Nat. 2017; 189: 718–725. https://
doi.org/10.1086/691387 PMID: 28514639
42. Shurin JB, Borer E, Seabloom E, Anderson K, Blanchette C, Broitman B, et al. A cross–ecosystem com-
parison of trophic cascades. Ecol Lett. 2002; 5: 785–791.
43. Brooks JL, Dodson SI. Predation, body size, and composition of plankton. Science. 1965; 150: 28–35.
https://doi.org/10.1126/science.150.3692.28 PMID: 17829740
44. Barton BT, Beckerman AP, Schmitz OJ. Climate warming strengthens indirect interactions in an old–
field food web. Ecology. 2009; 90: 2346–2351. PMID: 19769112
45. Svensson F, Karlsson E, Gårdmark A, Olsson J, Adill A, Zie J, et al. In situ warming strengthens trophic
cascades in a coastal food web. Oikos. 2017; 126: 1150–1161.
46. O’Connor MI, Gilbert B, Brown CJ. Theoretical Predictions for How Temperature Affects the Dynamics
of Interacting Herbivores and Plants. Am Nat. 2011; 178: 626–638. https://doi.org/10.1086/662171
PMID: 22030732
47. Mckee D, Hatton K, Eaton JW, Atkinson D, Atherton A, Harvey I, et al. Effects of simulated climate
warming on macrophytes in freshwater microcosm communities. Aquat Bot. 2002; 74: 71–83.
48. Hansson L–A, Nicolle A, Graneli W, Hallgren P, Kritzberg E, Persson A, et al. Food–chain length alters
community responses to global change in aquatic systems. 2013; 3: 228–233.
49. Sal S, Garcia–Carreras B, Sheppard R, Rizzuto M, Etard A, Yvon–Durocher G, et al. Metabolic mis-
matches and compensation in the thermal dependence of daily carbon flux in plants. 2017: 1–12.
50. Cross WF, Hood JM, Benstead JP, Huryn AD, Nelson D. Interactions between temperature and nutri-
ents across levels of ecological organization. Glob Change Biol. 2015; 21: 1025–1040.
51. Garzke J, Hansen T, Ismar S, Sommer U. Combined Effects of Ocean Warming and Acidification on
Copepod Abundance, Body Size and Fatty Acid Content. PLoS ONE. 2016; 11: e0155952. https://doi.
org/10.1371/journal.pone.0155952 PMID: 27224476
52. Padfield D, Yvon–Durocher G, Buckling A, Jennings S, Yvon–Durocher G. Rapid evolution of metabolic
traits explains thermal adaptation in phytoplankton. Ecol Lett. 2015; 19: 133–142. https://doi.org/10.
1111/ele.12545 PMID: 26610058
53. Welter JR, Benstead JP, Cross WF, Hood JM, Huryn AD, Johnson PW, et al. Does N2 fixation
amplify the temperature dependence of ecosystem metabolism? Ecology. 2015; 96: 603–610. PMID:
26236857
Ecological effects of temperature
PLOS Biology | https://doi.org/10.1371/journal.pbio.2006806 June 10, 2019 26 / 27

54. Dossena M, Yvon–Durocher G, Grey J, Montoya JM, Perkins DM, Trimmer M, et al. Warming alters
community size structure and ecosystem functioning. Proc R Soc B. 2012; 279: 3011–3019. https://doi.
org/10.1098/rspb.2012.0394 PMID: 22496185
55. Hastings A, Powell T. Chaos in a three–species food chain. Ecology. 1991; 72: 896–903.
56. Loreau M, Mouquet N, Gonzalez A. Biodiversity as spatial insurance in heterogeneous landscapes.
Proc Natl Acad Sci USA. 2003; 100: 12765–12770. https://doi.org/10.1073/pnas.2235465100 PMID:
14569008
57. Tunney TD, McCann KS, Lester NP, Shuter BJ. Effects of differential habitat warming on complex com-
munities. Proc Natl Acad Sci USA. 2014; 111: 1–6.
58. McArdle BH, Lawton JH. Effects of prey–size and predator–instar on the predation of Daphnia by Noto-
necta. Ecol Entomol. 1979; 4: 267–275.
59. Carpenter SR, Caraco NF, Correll DL, Howarth RW, Sharpley AN, Smith VH. Nonpoint pollution of sur-
face waters with phosphorus and nitrogen. Ecol Appl. 1998; 8: 559–568.
60. Utermohl H. Zur Vervollkommnung der quantitativen Phytoplankton–Methodik. Mitteilungen Internatio-
nale Vereiningung fuer Theoretische und Angewandte Limnologie. 1958; 9: 1–38.
61. Raven JA, Geider RJ. Temperature and algal growth. New Phytol. 1988; 110: 441–461.
62. Geider RJ, MacIntyre HL, Kana TM. Dynamic model of phytoplankton growth and acclimation:
responses. Mar Ecol Prog Ser. 1997; 148: 287–200.
63. Marzolf ER, Mulholland PJ, Steinman AD. Improvements to the Diurnal Upstream–Downstream Dis-
solved Oxygen Change Technique for Determining Whole–Stream Metabolism in Small Streams. Can
J Fish Aquat Sci. 1994; 51: 1591–1599.
64. Moore ML. NALMS management guide for lakes and reservoirs. North American Lake Management
Society. North American Lake Management Society. 1989.
65. Schoolfield RM. Non–linear regression of biological temperature–dependent rate models based on
absolute reaction–rate theory. J Theor Biol. 1981; 88: 719–731. PMID: 6790878
66. Cottingham KL, Cottingham KL, Lennon JT, Lennon JT, Brown BL, Brown BL. Knowing when to draw
the line: designing more informative ecological experiments. Front Ecol Environ. 2005; 3: 145–152.
67. Gotelli NJ, Ellison AM. Chapter 7: A Bestiary of Experimental & Sampling Designs. A Primer of Ecologi-
cal Statistics. 2nd ed. Sunderland, Massachusetts, USA: Sinauer Associates Incorporated; 2013. p.
614.
68. van de Pol M, Wright J. A simple method for distinguishing within– versus between–subject effects
using mixed models. Animal Behav. 2009; 77: 753–758.
69. O’Connor M, Bruno JF, Gaines SD, Halpern BS, Lester S, Kinlan BP, et al. Temperature control of larval
dispersal and the implications for marine ecology, evolution, and conservation. Proc Natl Acad Sci USA.
2007; 104: 1266–1271. https://doi.org/10.1073/pnas.0603422104 PMID: 17213327
70. Figueiras A, Domenech–Massons JM, Cadarso C. Regression models: calculating the confidence inter-
val of effects in the presence of interactions. Stat Med. 1998; 17: 2099–2105. PMID: 9789916
Ecological effects of temperature
PLOS Biology | https://doi.org/10.1371/journal.pbio.2006806 June 10, 2019 27 / 27