tropical aerosol in the aleutian high
TRANSCRIPT

Tropical aerosol in the Aleutian High
V. Lynn Harvey,1 Matthew H. Hitchman,2 R. Bradley Pierce,3 andT. Duncan Fairlie4
Abstract. Stratospheric aerosol profiles at high northern latitudes from the StratosphericAerosol Measurement (SAM) II experiment are used to document the aerosol maximathat occur in the major wintertime anticyclones. Fourteen years (1978–1991) of 1 mmextinction are used to calculate median values for each season in bins of 58 latitude by 308longitude by 1 km altitude. Longitude-altitude sections of estimated surface area densityshow that tropical, aerosol rich air tends to accumulate in the Aleutian High from 15 toabove 30 km, and in the North Atlantic High in the 15–25 km layer. A trajectory casestudy with winds from the European Center for Medium-Range Weather Forecasting isused to investigate the hypothesis that the observed aerosol maxima are maintained byepisodic poleward surges of high aerosol air from the tropical stratospheric reservoir.Lagrangian trajectories are initialized and run backward in time, from both a high-resolution grid and SAM II occultations, for selected days when high aerosol is found inthe Aleutian High. Results show that during the case study provided, a deep sheet ofaerosol rich air originating over Africa is advected poleward and eastward around thepolar vortex and entrained into the Aleutian High.
1. Introduction
It is well accepted that air predominantly enters the strato-sphere in the tropics [Brewer, 1949; Mote et al., 1996] anddescends back into the troposphere at high latitudes [Holton etal., 1995], notably through the winter polar vortices [Schoeberlet al., 1992; Manney et al., 1994] and in tropopause foldingevents [Danielsen, 1968; Shapiro et al., 1984; Hamill et al., 1997;Postel and Hitchman, 1998]. The hemispheric poleward anddownward Brewer-Dobson circulation in the middle and lowerstratosphere is apparent in zonal mean tracer distributionswhere isopleths are lofted in the tropics and depressed athigher latitudes [e.g., Kumer et al., 1993]. Much evidence pointsto the tropical middle stratosphere being somewhat seques-tered from the vigorous stirring processes associated with ex-tratropical waves [Murphy et al., 1993; McCormick and Veiga,1992; Trepte and Hitchman, 1992; Randel et al., 1993; Grant etal., 1996], with the steep subtropical constituent gradients sug-gesting a tropical stratospheric reservoir (TSR) [Hitchman etal., 1994]. Aerosol is observed to maximize in the TSR [Hitch-man et al., 1994]. Processes that contribute toward the tropicalaerosol maximum include preferential heteromolecular homo-geneous nucleation of sulfuric acid and water at the cold trop-ical tropopause [Hamill et al., 1997] differential vertical mo-tion, and rapid poleward and downward transport out of theextratropical lower stratosphere [Trepte et al., 1993]. The lattertwo processes, together with two-way mixing across the sub-tropics, can account for why a large volcanic eruption at nearly
any location leads to a tropical relative maximum severalmonths later [Hitchman et al., 1994]. Benefits of studying thequasi-horizontal mixing between the TSR and the midlatitudesinclude the effects of tropical chemical constituents on theextratropical ozone distribution and, conversely, the influenceof midlatitude pollutants entrained into the TSR [Stolarski etal., 1995].
Leovy et al. [1985] were perhaps the first to use global sat-ellite constituent data to depict the manner in which strato-spheric air departs the TSR: high tropical ozone surges pole-ward in synoptic scale “tongues” of air. Subsequent satelliteconstituent studies of this phenomenon include Randel et al.[1993], Manney et al. [1993], Trepte et al. [1993], Manney et al.,[1995a], Lambert et al., 1996, and Rogers et al. [1998]. Otherrecent observational work used meridional excursions of con-stant-level balloons [Rom-Kedar and Paldor, 1997]. Numericalmodel simulations [Rood et al., 1992; Chen et al., 1994; Fairlie,1995; Orsolini, 1995] and trajectory studies [Norton, 1994;Pierce et al., 1994; Waugh et al., 1994; Schoeberl and Newman,1995; Manney et al., 1995b] also provide convincing evidence ofsporadic poleward transport from the TSR, beginning in thesubtropics where large meridional tracer gradients are ob-served.
These surge events are highly variable in space and time.The magnitude of transport from the TSR to midlatitudes isgreatest in the winter hemisphere and depends on altitude[Chen et al., 1994; Hitchman et al., 1994; Langford et al., 1995;Waugh, 1996]. The vertical dependence has been described interms of a “lower transport regime” and an “upper transportregime” [Trepte and Hitchman, 1992]. In the lower transportregime (within about 5 km of the tropopause), air is readilytransported poleward in association with upwardly evanescenttropospheric disturbances. In situ tracer data indicate signifi-cant exchange between the TSR and the midlatitudes at time-scales of months and longer. Volk et al. [1996], Minschwaner etal. [1996], and Avallone and Prather [1996] estimated that 50%of air in the TSR at 21 km is of midlatitude origin. The upperstratospheric transport regime (21–28 km) is characterized by
1Science Applications International Corporation, Hampton, Vir-ginia.
2Department of Atmospheric and Oceanic Sciences, University ofWisconsin, Madison, Wisconsin.
3NASA Langley Research Center, Hampton, Virginia.4Science and Technology Corporation, Hampton, Virginia.
Copyright 1999 by the American Geophysical Union.
Paper number 1998JD200094.0148-0227/99/1998JD200094$09.00
JOURNAL OF GEOPHYSICAL RESEARCH, VOL. 104, NO. D6, PAGES 6281–6290, MARCH 27, 1999
6281

episodic poleward transport events which can be modulated bythe Quasi-Biennial Oscillation (QBO) [Trepte and Hitchman,1992; Grant et al., 1996; O’Sullivan and Dunkerton, 1997;Schoeberl et al., 1997]. This study focuses on transport in theupper regime. At higher altitudes, transport from the tropics tomidlatitudes is observed as discrete events where planetaryscale “tongues” of tropical tracers mix irreversibly poleward.These large poleward excursions in the middle to upper strato-sphere may be induced when the polar vortex is displacedequatorward [Waugh, 1993]. This can occur when the AleutianHigh (AH) is amplified, suggesting self-maintenance via vor-tex-vortex interaction [O’Neill et al., 1994; Harvey and Hitch-man, 1996]. Other studies suggest that weak inertial instabilityassociated with poleward motion of low potential vorticity andanticyclogenesis is a significant mechanism by which air beginsto surge poleward [O’Sullivan and Hitchman, 1992; Knox, 1996;Orsolini et al., 1997; Mecikalski and Tripoli, 1998].
It remains to determine where the tropical air in these surgeevents ends up, whether it tends to accumulate in specificregions or be distributed fairly uniformly throughout middlelatitudes. While it is generally agreed that mixing across theedge of the polar vortex is small in the upper and middlestratosphere [Pierce and Fairlie, 1993], mixing across the vortexedge increases in the lower stratosphere (450 K) [Dahlberg andBowman, 1994], and tropical intrusions can penetrate to thecore of the polar vortex [Plumb et al., 1994]. Aerosol that hasbeen transported from the TSR to midlatitudes has been laterobserved in the Arctic polar vortex [Rosen et al., 1992; Bor-rmann et al., 1993] where it can affect the ozone budgetthrough heterogeneous reactions [Hofmann and Oltmans,1993]. However, entrainment of tropical aerosol rich air intothe polar vortex is slow in the middle stratosphere. In addition,the size of the AH nearly always increases in the days followingpoleward surge events. Here we follow reasoning in previouswork and explore the idea that this tropical air commonly getsentrained into the AH [Waugh, 1993; Lahoz et al., 1994; O’Neillet al., 1994; Manney et al., 1995a, b; Polvani et al., 1995; Fairlie,1995]. In this paper we establish a connection between therepeated injection of tropical high aerosol air into the AH andthe climatological high aerosol observed in the AH duringnorthern winter.
This paper is organized as follows: Section 2 describes theSAM II data, the European Centre for Medium-RangeWeather Forecasting (ECMWF) analyses, and construction ofthe SAM II aerosol climatology. In section 3, longitude-altitude sections show high aerosol in the AH during the De-cember-January-February (DJF) season. The variability ofaerosol surface area density (SAD) is greater in the anticy-clones compared with that in the polar vortex. In order toidentify the origin of the high aerosol in the AH a case study ispresented in section 4 in which Lagrangian back trajectoriesare initialized from a 0.58 by 0.58 grid and from SAM II occul-tations on a day when the satellite measured high aerosol in theAH. A tropical source for the high aerosol over Africa is identi-fied. The three-dimensional structure of the aerosol rich air massis shown to be a deep sheet of tropical air (extending over 5km) which is entrained poleward and eastward around thepolar vortex and into the AH. Conclusions are given in section 5.
2. Data and AnalysisThe SAM II sensor is a Sun photometer mounted on the
Nimbus-7 spacecraft which measures attenuated sunlight at 1
mm through the atmospheric limb at each satellite sunrise andsunset. It orbits the Earth in 90 min, taking 15 limb soundingsper day near both poles, with the sampled latitude sweepingfrom ;658 to 858 in about 3 months. Each vertical soundingbegins at 30 km and extends down to the surface with 1 kmresolution, unless a cloud is encountered. The data recordextends from October 24, 1978 to December 5, 1992. Caremust be used with sunset data in the Northern Hemispheretaken after January 1990 when the instrument’s view of the Sunbecame obscured by a nearby antenna. A more detailed dis-cussion of the SAM II instrument and data is given by McCor-mick et al. [1979] and Russell et al. [1981].
A three-dimensional, SAM II aerosol climatology was cre-ated by binning 1 mm extinction values into 58 latitude, 308longitude, 1 km altitude for each season. The bin size is con-strained by the 268 longitudinal sampling frequency of theSAM II instrument. While this coarse spatial sampling doesnot capture small-scale structure such as filaments, large-scalestratospheric features are resolved by the SAM II data. Thespatial domain of the climatology is limited to high latitudes,extending from 658 to 858 in either hemisphere and from 30 kmdown to the extratropical tropopause (typically 8–9 km). Be-low 25 km the estimated extinction error is typically less than10%. Above this altitude it is common for the error to exceed50%. Therefore extinction values with estimated errors largerthan 50% were not included. There were more than 100 sam-ples per bin from 10 to 25 km and more than 200 from 13 to 21km. Above 25 km this number decreased rapidly. Seasonalmedian values of extinction were calculated for each bin andconverted to SAD using equation (5) of Thomason et al. [1997].Medians were used instead of averages to ensure that theclimatology was not skewed by sporadic observations of ele-vated extinction which occur following volcanic eruptions orwhen polar stratospheric clouds (PSC) are sampled. SAD val-ues were generally represented by a lognormal distribution.However, long tails of large SAD values were observed in somebins. In order to filter these values from the climatology weperformed five iterations on the median whereby outlyingaerosol values greater than four standard deviations away fromthe previous median were excluded. Effects of filtering in thismanner were maximized in the 15–20 km layer in the anticy-clones where the number of observations per bin decreased bymore than 30. Climatological SAD values were reduced by15% in these regions. Surprisingly, the filter had very littleeffect in the north polar vortex. No other attempt was made toclear clouds, hence care should be used in interpretation ofresults where temperatures are cold enough to form PSCs. Inthe Arctic the likelihood of encountering a PSC maximizes at10% of the time in early February, in the layer 20–22 km, from908W through the Greenwich meridian to 908E [Poole andPitts, 1994]. The zonal mean seasonal structures of SAD (notshown) are consistent with previous two-dimensional analyses[e.g., Hitchman et al., 1994; Thomason et al., 1997].
The ECMWF data used in this study are uninitialized anal-yses with 2.58 resolution in latitude and longitude. Geopoten-tial height, temperature, relative humidity, and winds wereobtained from the National Center for Atmospheric Research(NCAR) on the following 14 pressure surfaces: 1000, 850, 700,600, 500, 300, 250, 200, 150, 100, 70, 50, 30, and 10 hPa.Trenberth [1992] provides a discussion of the observation types,assimilation methods, and data quality for the ECMWF prod-ucts.
HARVEY ET AL.: TROPICAL AEROSOL IN THE ALEUTIAN HIGH6282

3. Climatological StructureFigure 1 shows the 6-year (1986–1991) average DJF geopo-
tential height at 10 hPa. The climatological polar vortex centeris displaced into the eastern hemisphere, with trough elonga-tion over eastern North America and central Asia at this level.The AH is centered near 508N and the date line. The arrowillustrates the climatological pathway where tropical air istransported poleward. From geostrophic considerations alone,air that originates near North Africa will follow geopotentialheight contours eastward around the polar vortex and pole-ward to 608N at the date line. This transport pattern is ob-served in the ECMWF analyses on a daily basis in the form ofmobile anticyclones, which originate in the vicinity of theGreenwich meridian (GM) (at 10 hPa) and propagate east-ward around the polar vortex along this pathway [Harvey, 1994;O’Neill et al., 1994]. Tropical air that follows this path could beentrained into the AH.
Figure 2 is a longitude-altitude section at 658N of the DJFaveraged geopotential height, where the zonal mean has beensubtracted. Henceforth eddy refers to deviations from thezonal mean. Positive eddy heights at the date line denote theAH. Negative eddy heights, which tilt westward with altitudefrom 1408W near 250 hPa, denote the polar vortex. The “NorthAtlantic High” (NAH) is visible as high values centered at theGM in the lower stratosphere but decays with altitude.
Figure 3 shows the corresponding longitude-altitude sectionof SAM II DJF median aerosol SAD near 658N (expressed asa % departure from the zonal mean). At this latitude, SAM IImakes continuous observations both inside the AH and in theArctic polar vortex. By comparing Figures 2 and 3 it is imme-diately apparent that above 15 km, high aerosol SAD is coin-cident with the AH and the NAH, while low aerosol SAD isfound in the polar vortex. Between 15 and 30 km an increase
in aerosol of up to 25% over the zonal mean is observed in theAH. From 10 to 25 km the NAH shows an increase of up to20%. Air in the polar vortex shows up to a 30% reduction inzonal mean SAD. Absolute SAD values can be calculated fromthe zonal mean profile given to the right of Figure 3. Horizon-tal lines show plus and minus 1 standard deviation from thezonal mean at each level. Previous aerosol observations bySAM II [Kent et al., 1985] and LIDAR [Dameris et al., 1995]also show aerosol poor air inside the Arctic polar vortex atthese altitudes. This climatological wintertime structure ofaerosol in longitude at 658N is consistent with observed longi-
Figure 1. Northern Hemisphere polar stereographic projec-tion of 1985–1991 DJF average geopotential height at 10 hPa(in kilometers). Contour interval is 200 m. The arrow followsthe 30.6 km geopotential height contour from the Greenwichmeridian (GM) to the date line.
Figure 2. Longitude-altitude section at 658N of 1985–1991DJF average eddy geopotential height (deviation from thezonal mean, in meters). Contour interval is 50 m.
Figure 3. Longitude-altitude section at 658N of 1978–1991DJF SAM II surface area density expressed as a percent devi-ation from the zonal mean. Contour interval is 5%. Zonalmean SAD profile given to the right in units of mm2 cm23.Horizontal lines show, plus and minus 1 standard deviationfrom the zonal mean at each level.
6283HARVEY ET AL.: TROPICAL AEROSOL IN THE ALEUTIAN HIGH
tudinal variations of daily water vapor, nitrous oxide, andmethane from 20 to 40 km, at latitudes where sampling occursboth inside and outside of the polar vortex [Lahoz et al., 1993;Ziemke and Stanford, 1995].
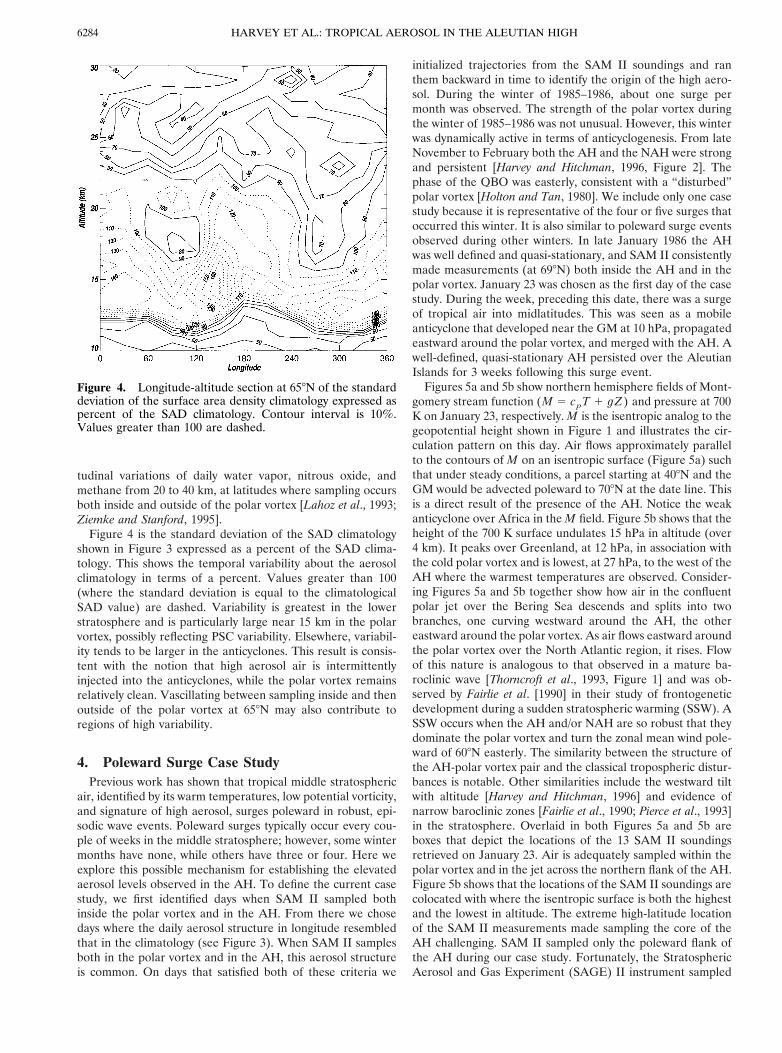
Figure 4 is the standard deviation of the SAD climatologyshown in Figure 3 expressed as a percent of the SAD clima-tology. This shows the temporal variability about the aerosolclimatology in terms of a percent. Values greater than 100(where the standard deviation is equal to the climatologicalSAD value) are dashed. Variability is greatest in the lowerstratosphere and is particularly large near 15 km in the polarvortex, possibly reflecting PSC variability. Elsewhere, variabil-ity tends to be larger in the anticyclones. This result is consis-tent with the notion that high aerosol air is intermittentlyinjected into the anticyclones, while the polar vortex remainsrelatively clean. Vascillating between sampling inside and thenoutside of the polar vortex at 658N may also contribute toregions of high variability.
4. Poleward Surge Case StudyPrevious work has shown that tropical middle stratospheric
air, identified by its warm temperatures, low potential vorticity,and signature of high aerosol, surges poleward in robust, epi-sodic wave events. Poleward surges typically occur every cou-ple of weeks in the middle stratosphere; however, some wintermonths have none, while others have three or four. Here weexplore this possible mechanism for establishing the elevatedaerosol levels observed in the AH. To define the current casestudy, we first identified days when SAM II sampled bothinside the polar vortex and in the AH. From there we chosedays where the daily aerosol structure in longitude resembledthat in the climatology (see Figure 3). When SAM II samplesboth in the polar vortex and in the AH, this aerosol structureis common. On days that satisfied both of these criteria we
initialized trajectories from the SAM II soundings and ranthem backward in time to identify the origin of the high aero-sol. During the winter of 1985–1986, about one surge permonth was observed. The strength of the polar vortex duringthe winter of 1985–1986 was not unusual. However, this winterwas dynamically active in terms of anticyclogenesis. From lateNovember to February both the AH and the NAH were strongand persistent [Harvey and Hitchman, 1996, Figure 2]. Thephase of the QBO was easterly, consistent with a “disturbed”polar vortex [Holton and Tan, 1980]. We include only one casestudy because it is representative of the four or five surges thatoccurred this winter. It is also similar to poleward surge eventsobserved during other winters. In late January 1986 the AHwas well defined and quasi-stationary, and SAM II consistentlymade measurements (at 698N) both inside the AH and in thepolar vortex. January 23 was chosen as the first day of the casestudy. During the week, preceding this date, there was a surgeof tropical air into midlatitudes. This was seen as a mobileanticyclone that developed near the GM at 10 hPa, propagatedeastward around the polar vortex, and merged with the AH. Awell-defined, quasi-stationary AH persisted over the AleutianIslands for 3 weeks following this surge event.
Figures 5a and 5b show northern hemisphere fields of Mont-gomery stream function (M 5 cpT 1 gZ) and pressure at 700K on January 23, respectively. M is the isentropic analog to thegeopotential height shown in Figure 1 and illustrates the cir-culation pattern on this day. Air flows approximately parallelto the contours of M on an isentropic surface (Figure 5a) suchthat under steady conditions, a parcel starting at 408N and theGM would be advected poleward to 708N at the date line. Thisis a direct result of the presence of the AH. Notice the weakanticyclone over Africa in the M field. Figure 5b shows that theheight of the 700 K surface undulates 15 hPa in altitude (over4 km). It peaks over Greenland, at 12 hPa, in association withthe cold polar vortex and is lowest, at 27 hPa, to the west of theAH where the warmest temperatures are observed. Consider-ing Figures 5a and 5b together show how air in the confluentpolar jet over the Bering Sea descends and splits into twobranches, one curving westward around the AH, the othereastward around the polar vortex. As air flows eastward aroundthe polar vortex over the North Atlantic region, it rises. Flowof this nature is analogous to that observed in a mature ba-roclinic wave [Thorncroft et al., 1993, Figure 1] and was ob-served by Fairlie et al. [1990] in their study of frontogeneticdevelopment during a sudden stratospheric warming (SSW). ASSW occurs when the AH and/or NAH are so robust that theydominate the polar vortex and turn the zonal mean wind pole-ward of 608N easterly. The similarity between the structure ofthe AH-polar vortex pair and the classical tropospheric distur-bances is notable. Other similarities include the westward tiltwith altitude [Harvey and Hitchman, 1996] and evidence ofnarrow baroclinic zones [Fairlie et al., 1990; Pierce et al., 1993]in the stratosphere. Overlaid in both Figures 5a and 5b areboxes that depict the locations of the 13 SAM II soundingsretrieved on January 23. Air is adequately sampled within thepolar vortex and in the jet across the northern flank of the AH.Figure 5b shows that the locations of the SAM II soundings arecolocated with where the isentropic surface is both the highestand the lowest in altitude. The extreme high-latitude locationof the SAM II measurements made sampling the core of theAH challenging. SAM II sampled only the poleward flank ofthe AH during our case study. Fortunately, the StratosphericAerosol and Gas Experiment (SAGE) II instrument sampled
Figure 4. Longitude-altitude section at 658N of the standarddeviation of the surface area density climatology expressed aspercent of the SAD climatology. Contour interval is 10%.Values greater than 100 are dashed.
HARVEY ET AL.: TROPICAL AEROSOL IN THE ALEUTIAN HIGH6284

the AH domain on January 23, 1986. Magnitudes of SAGE IISADs near the center of the AH agree with those SAM IIsampled on the poleward flank. This is expected since the AHrecirculates and mixes air within it.
Figure 6 is a longitude-altitude section at 708N on January23 of M , where the zonal mean has been subtracted. Thisshows the vertical structure of the M field at the latitude of theSAM II measurements. As in Figure 2, the “wave 1” patternabove 550 K (about 21 km), with positive eddy M over the date
line and negative over the GM, represents the AH and thepolar vortex. The blank area in the polar vortex shows wherethe 750 K surface rises above 10 hPa, the highest ECMWF datalevel. The “wave 2” pattern of M below 550 K depicts anelongated polar vortex with two surrounding anticyclones,namely the downward extension of the AH and upward exten-sion of the NAH. Figure 7 is a longitude-altitude cross sectionof SAM II SAD (% deviation from the zonal mean), at 698N onthe same day. It can be seen that the longitudinal structure inaerosol resembles that in the climatology (compare Figure 7 toFigure 3) with high aerosol in the anticyclones and low aerosolin the vortex (compare Figure 7 to Figure 6). The region
Figure 5. Northern Hemisphere polar stereographic on Jan-uary 23 at 700 K of (a) Montgomery stream function and (b)pressure. (a) Montgomery stream function has been divided by105 and the contour interval is 0.05 in the polar vortex decreas-ing to 0.01 in the anticyclones. (b) The contour interval is 2hPa. (a, b) Boxes are overlaid, showing the locations of theJanuary 23 SAM II soundings.
Figure 6. Longitude-altitude section at 708N of eddy (devia-tion from the zonal mean) Montgomery stream function onJanuary 23, 1986. Contour interval is 1000 m2 s22.
Figure 7. Longitude-altitude section of the percent deviationof SAD from the zonal mean at 698N on January 23, 1986.Contour interval is 20%. Isentropic surfaces from 400–750 Kby 50 K are dashed lines. Zonal mean SAD profile is given tothe right in units of mm2 cm23.
6285HARVEY ET AL.: TROPICAL AEROSOL IN THE ALEUTIAN HIGH

coincident with the AH shows a 20–60% increase in SAD overthe zonal mean and over 100% increase in the NAH. The polarvortex is associated with regions which realize up to a 60%decrease in zonal mean aerosol. It is not surprising to find suchan amplified pattern on daily timescales compared to the mul-tiyear climatology. Absolute SAD values can be calculatedfrom the zonal mean profile provided to the right of Figure 7.The isentropic levels from which we ran the back trajectoriesare superimposed. Henceforth analyses are described in isen-tropic coordinates.
In preparation for trajectory calculations, ECMWF windsand SAM II SADs are linearly interpolated to the followingnine potential temperature surfaces: 450, 475, 500, 525, 550,600, 650, 700, and 750 K. Trajectories are initialized on thesevertically stacked layers at the times and locations of the SAMII soundings. Isentropic trajectories are then run backward intime to identify the origin of the high aerosol sampled in theAH. We use the NASA Langley trajectory model [Pierce andFairlie, 1993; Pierce et al., 1994] with a 20-min time step and
daily 0000 UT winds that are linearly interpolated in time andspace to trajectory locations.
To more fully understand the global structure of intrudingtropical air masses, we also initialize back trajectories on thesame nine isentropic levels but on a 0.58 by 0.58 grid. On thelast day of a trajectory calculation the latitudes of the trajec-tories (now irregularly spaced) are mapped back to the originalgrid on the first day. This popular and powerful technique iscalled reverse domain filling (RDF) [Sutton et al., 1994], andwhile it does not in this case incorporate any aerosol informa-tion, it enables a high-resolution plot of latitude of origin to beconstructed for comparison with aerosol measurements.
We initialize 8-day back trajectories on a 0.58 by 0.58 gridfrom 500 to 750 K beginning on January 23 in order to identifya source for the high aerosol in the AH. Plate 1 shows the 700K latitude of origin of these trajectories on January 15. Airoriginating in the tropics is colored red, orange, and yellow.Midlatitude air is given by different shades of green, and airthat originated at high latitudes is shown in blues and purples.
Plate 1. Northern Hemisphere polar stereographic of latitude of origin of 8-day back trajectories initializedat 0.58 by 0.58 resolution at 700 K on January 23, 1986. Montgomery stream function contours are overlaid inintervals of 1000 m2 s22. Boxes are colored by their SAM II SAD values.
HARVEY ET AL.: TROPICAL AEROSOL IN THE ALEUTIAN HIGH6286

M contours, valid January 23, are overlaid to add context.Boxes represent SAM II measurements taken on January 23and are colored by their SAD value. Notice the filament oftropical air stretched around the flank of the polar vortex intothe vicinity of the AH. This low-latitude air originated overAfrica, near the mobile anticyclone, and over the course of thetrajectory was observed to surge poleward and eastwardaround the polar vortex. This filament is colocated with highSAD values, while low SAD values are found in the polarvortex. While we only show one isentropic surface, this highaerosol, low-latitude filament is visible down to 550 K, about 5km lower, and can be thought of as an intruding “sheet” of air.This sheet has the same horizontal structure as that found incontour advection of the H2SO4 component of ISAMS aerosol[Lambert et al., 1996]. In subsequent frames (not shown), partof this aerosol rich filament is advected westward and wraps upin the AH, while some continues on to be advected eastwardaround the polar vortex.
To identify the source region for the air that ends up in theAH, we initialized 515 trajectories inside the core of the AH at700 K on January 23 and ran backward 8 days. Figures 8a and8b are polar projections of M on 700 K on the first and last daysof the back trajectories, respectively. Figure 8a shows the ini-tialization of trajectories in the AH on January 23. Trajectorieswere initialized inside the 487,000 m2 s22 closed M contour.Figure 8b shows where the trajectories were 8 days earlierbefore the merger of the mobile anticyclone into the AH. Notethat the AH migrated westward during the surge/merge event,a common feature. It is interesting that many of the trajectorieswere already in the AH and remained inside the anticycloneover the entire 8-day period. Most of the trajectories thatoriginated elsewhere came from over Africa and from withinthe mobile anticyclone located north of the Persian Gulf. Inaddition, air appears to transit anticyclonically around a trop-ical disturbance over Africa and the Indian Ocean before get-ting swept poleward by the displaced polar jet (compare closedM contour over Africa in Figure 8a). During this time theAfrican sector serves as the origin for AH air from 750 K downseveral kilometers to 650 K (not shown). The transport of airduring this event represents a large influx of air into the AHfrom a discrete region, as opposed to air diffusing into the AHfrom middle latitudes. None of the trajectories originated deepinside the polar vortex.
To further explore the three-dimensional (3-D) structure ofthe intruding low-latitude air, we show the latitude of origin ina longitude-altitude section. Trajectories were initialized alonga vertical section at 698N, from 450 to 750 K and from thelocations of the SAM II soundings on January 23. Similar tothe previous high-resolution run, the trajectories were runbackward 8 days. Figure 9 shows the latitude of origin of thesetrajectories. Source latitudes for the high aerosol sampled bySAM II (shown in Figure 7) are identified. Latitudes equator-ward of 508N are dashed. There is a broad and deep region inthe AH, from 550 K to 750 K and from 1208E to 2258E, wherethe air originated equatorward of 308N. Extension of the low-latitude intrusion above 750 K is likely but cannot be repre-sented by the ECMWF data used here. Embedded within thisregion appear two cores of tropical air, at 1208E and 1208E,which originated from as far equatorward as 108N. This air is inthe polar jet and is coincident with the highest daily SADvalues. This tropical source of the high aerosol air in the AH isconsistent with previous trajectory analyses which also identifya tropical source for air in midlatitudes [Waugh, 1993; O’Neill
et al., 1994; Manney et al., 1995a, b; Polvani et al., 1995; Lambertet al., 1996]. Since these episodic poleward surges of tropicalair occur repeatedly throughout the Northern Hemispherewinter, this case study is a step toward explaining the climato-logical high aerosol observed in the AH. In order to corrobo-rate the SAM II aerosol measurements we looked for coinci-dences between the SAM II back trajectories and the in situSAGE II soundings. Using a coincidence criteria of 58 longi-tude, 58 latitude, 50 K, and 6 hours, we found 121 coincidences.
Figure 8. Northern Hemisphere polar stereographic ofMontgomery stream function at 700 K on (a) January 23 (be-ginning of back trajectory) and (b) January 15 (end of backtrajectory), 1986. Contour interval is as in Figure 5. (a) Trian-gles initialized in the AH on January 23. (b) Trajectory origins8 days earlier on January 15.
6287HARVEY ET AL.: TROPICAL AEROSOL IN THE ALEUTIAN HIGH

The corrolation coefficient between SAGE II and SAM II was0.66, where SAGE II SADs were systematically higher thanSAM II SADs. This difference is consistent with expecteddillution of SAGE II aerosol along the SAM II back trajectory.Figure 9 does not suggest a tropical source for the high aerosolsampled over the GM (in Figure 7). We are uncertain as to theorigin of the extreme values of SAD in this region. This air mayhave persisted in the mobile anticyclone or in the AH, and alonger trajectory may be needed to trace it back to the tropics.It could also be an increased signal due to PSCs. The corre-sponding longitude-altitude section of temperature on January23 indicates temperatures less than 200 K above 50 hPa (about500 K) over the GM, making PSC formation distinctly possible[Poole and Pitts, 1994].
5. ConclusionsClimatologically, high aerosol is observed in the AH. This
result led us to investigate a mechanism that may act to main-tain this structure and to identify a likely source for the clima-tological high aerosol in the AH. The trajectory analyses usedin this case study illustrate the process whereby tropical highaerosol air is entrained into the AH. Back trajectories, initial-ized from both a 0.58 by 0.58 grid and from SAM II occultationson a day in which high aerosol was sampled in the AH, identifythe air as having originated in the tropics. It was shown that theintruding aerosol rich air mass has a significant vertical range,extending from 550 K to at least 750 K (over 5 km deep).Moreover, it was found for this case study that the tropicalsource of high aerosol in the AH lies primarily in the Africansector. Diffluence in the polar jet over Canada is likely to be aprimary mechanism of mixing the tropical, high aerosol airthroughout the hemisphere. Entrainment and detrainmentalong the path out of the tropics may be quantified with thetechniques used here. Ongoing work includes quantifying mix-ing associated with poleward surges and evaluating implica-tions for extratropical air mass types and deviations of tracer-
tracer plots from compact lines. The climatological frequencyof anticyclonic surge events, such as considered here, needs tobe determined to establish their role in the maintenance of thehigh aerosol in the AH and their contribution to exchangebetween the tropics and the midlatitudes.
Acknowledgments. We are grateful to Chip Trepte for his help inacquiring the data sets and to both Chip and Megan McKay for theircode to read and manipulate the data. MHH and VLH gratefullyacknowledge support by the SAGE II Science Team under NASAgrant NAS1-96030.
ReferencesAvallone, L. M., and M. Prather, Photochemical evolution of ozone in
the lower tropical stratosphere, J. Geophys. Res., 101, 1457–1461,1996.
Borrmann, S., J. E. Dye, D. Baumgardner, J. C. Wilson, H. H. Jonsson,C. A. Brock, M. Loewenstein, J. R. Podolske, G. V. Ferry, and K. S.Barr, In-situ measurements of changes in stratospheric aerosol andthe N2O-aerosol relationship inside and outside of the polar vortex,Geophys. Res. Lett., 20, 2559–2562, 1993.
Brewer, A. W., Evidence for a world circulation provided by the mea-surements of helium and water vapour distribution in the strato-sphere, Q. J. R. Meteorol. Soc., 75, 351–363, 1949.
Chen, P., J. R. Holton, A. O’Neill, and R. Swinbank, Isentropic massexchange between the tropics and extratropics in the stratosphere, J.Atmos. Sci., 51, 3006–3018, 1994.
Dahlberg, S. P., and K. P. Bowman, Climatology of large-scale isen-tropic mixing in the Arctic winter stratosphere from analyzed winds,J. Geophys. Res., 99, 20,585–20,599, 1994.
Dameris, M., M. Wirth, W. Renger, and V. Grewe, Definition of thepolar vortex edge by LIDAR data of the stratospheric aerosol: Acomparison with values of potential vorticity, Beitr. Phys. Atmos.,68(2), 113–119, 1995.
Danielsen, E. F., Stratospheric-tropospheric exchange based upon ra-dioactivity, ozone, and potential vorticity, J. Atmos. Sci., 25, 502–518,1968.
Fairlie, T. D. A., Three-dimensional transport simulations of the dis-persal of volcanic aerosol from Mount Pinatubo, Q. J. R. Meteorol.Soc., 121, 1943–1980, 1995.
Fairlie, T. D. A., M. Fisher, and A. O’Neill, The development ofnarrow baroclinic zones and other small-scale structure in the strato-sphere during simulated major warmings, Q. J. R. Meteorol. Soc.,116, 287–315, 1990.
Grant, W. B., E. V. Browell, C. S. Long, L. L. Stowe, R. G. Granger,and A. Lambert, Use of volcanic aerosols to study the tropicalstratospheric reservoir, J. Geophys. Res., 101, 3973–3988, 1996.
Hamill, P., E. J. Jensen, P. B. Russell, and J. J. Bauman, The life cycleof stratospheric aerosol particles, Bull. Am. Meteorol. Soc., 78(7),1395–1410, 1997.
Harvey, V. L., A climatology of the Aleutian High, 118 pp., M.S. thesis,Univ. of Wisconsin, Madison, 1994.
Harvey, V. L., and M. H. Hitchman, A climatology of the AleutianHigh, J. Atmos. Sci., 53, 2088–2101, 1996.
Hitchman, M. H., M. McKay, and C. R. Trepte, A climatology ofstratospheric aerosol, J. Geophys. Res., 99, 20,689–20,700, 1994.
Hofmann, D. J., and S. J. Oltmans, Anomalous Antarctic ozone during1992: Evidence for Pinatubo volcanic aerosol effects, J. Geophys.Res., 98, 18,555–18,561, 1993.
Holton, J. R., and H.-C. Tan, The influence of the equatorial quasi-biennial oscillation on the global circulation at 50 mb, J. Atmos. Res.,37, 2200–2208, 1980.
Holton, J. R., P. H. Haynes, M. E. McIntyre, A. R. Douglass, R. R.Rood, and L. Pfister, Stratospheric-tropospheric exchange, Rev.Geophys., 33, 403–439, 1995.
Kent, G. S., C. R. Trepte, U. O. Farrukh, and M. P. McCormick,Variation in the stratospheric aerosol associated with the northcyclonic polar vortex as measured by the SAM II satellite sensor, J.Atmos. Sci., 42, 1536–1551, 1985.
Knox, J. A., A theoretical and observational study of inertial instabilityand nonlinear balance, 351 pp., Ph.D. thesis, Univ. of Wisconsin,Madison, 1996.
Kumer, J. B., J. L. Merganthaler, and A. E. Roche, CLAES CH4, N2O,
Figure 9. Longitude-altitude section at 698N of latitude oforigin of 8-day back trajectories which were initialized fromSAM II soundings on January 23, 1986. Contour interval is 108of latitude.
HARVEY ET AL.: TROPICAL AEROSOL IN THE ALEUTIAN HIGH6288

and CCL2F2 (F12) global data, Geophys. Res. Lett., 20, 1239–1242,1993.
Lahoz, W. A., et al., Northern hemisphere mid-stratosphere vortexprocesses diagnosed from H2O, N2O and potential vorticity, Geo-phys. Res. Lett., 20, 2671–2674, 1993.
Lahoz, W. A., et al., Three-dimensional evolution of water vapourdistributions in the northern hemisphere stratosphere as observedby the Microwave Limb Sounder, J. Atmos. Sci., 51, 2914–2930,1994.
Lambert, A. R. G. Grainger, H. L. Rogers, W. A. Norton, C. D.Rodgers, and F. W. Taylor, The H2SO4 component of stratosphericaerosols derived from satellite infrared extinction measurements:Application to stratospheric transport studies, Geophys. Res. Lett.,23, 2219–2222, 1996.
Langford, A. O., T. J. O’Leary, and M. H. Hitchman, Transport of thePinatubo volcanic aerosol to a northern midlatitude site, J. Geophys.Res., 100, 9007–9016, 1995.
Leovy, C. B., C.-R. Sun, M. H. Hitchman, E. E. Remsberg, J. M.Russell, L. L. Gordley, J. C. Gille, and L. V. Lyjak, Transport ofozone in the middle stratosphere: Evidence for planetary wavebreaking, J. Atmos. Sci., 42, 230–244, 1985.
Manney, G. L., L. Froidevaux, J. W. Waters, L. S. Elson, E. F. Fish-bein, R. W. Zurek, R. S. Harwood, W. A. Lahoz, The evolution ofozone observed by UARS MSL in the 1992 late winter southernpolar vortex, Geophys. Res. Lett., 20, 1279–1282, 1993.
Manney, G. L., R. W. Zurek, A. O’Neill, and R. Swinbank, On themotion of air through the stratospheric polar vortex, J. Atmos. Sci.,51, 2973–2994, 1994.
Manney, G. L., L. Froidevaux, J. W. Waters, R. W. Zurek, J. C. Gille,J. B. Kumer, J. L. Merganthaler, A. E. Roche, A. O’Neill, and R.Swinbank, Formation of low-ozone pockets in the middle strato-spheric anticyclone during winter, J. Geophys. Res., 100, 13,939–13,950, 1995a.
Manney, G. L., et al., Lagrangian transport calculations using UARSdata, I, Passive tracers, J. Atmos. Sci., 52, 3049–3068, 1995b.
McCormick, M. P., and R. E. Veiga, SAGE II measurements of earlyPinatubo aerosols, Geophys. Res. Lett., 19, 155–158, 1992.
McCormick, M. P., P. Hamil, T. J. Pepin, W. P. Chu, T. J. Swissler, andL. R. McMaster, Satellite studies of the stratospheric aerosol, Bull.Am. Meteorol. Soc., 60, 1038–1046, 1979.
Mecikalski, J. R., and G. J. Tripoli, Inertial available kinetic energyand the dynamics of tropical plume formation, Mon. Weather Rev.,126, 2200–2216, 1998.
Minschwaner, K., A. E. Dessler, J. W. Elkins, C. M. Volk, D. W.Fahey, M. Loewenstein, J. R. Podolske, A. E. Roche, and K. R.Chan, Bulk properties of isentropic mixing into the tropics in thelower stratosphere, J. Geophys. Res., 101, 9433–9439, 1996.
Mote, P. W., K. H. Rosenlof, M. E. McIntyre, E. S. Carr, J. C. Gille,J. R. Holton, J. S. Kinnersley, H. C. Pumphrey, J. M. Russell III, andJ. W. Waters, An atmospheric tape recorder: The imprint of tropicaltropopause temperatures on stratospheric water vapor, J. Geophys.Res., 101, 3989–4006, 1996.
Murphy, D. M., D. W. Fahey, and M. H. Proffitt, Reactive nitrogenand its correlation with ozone in the lower stratosphere and uppertroposphere, J. Geophys. Res., 98, 8751–8773, 1993.
Norton, W. A., Breaking Rossby waves in a model stratosphere diag-nosed by a vortex-following coordinate system and a technique foradvecting material contours, J. Atmos. Sci., 51, 654–673, 1994.
O’Neill, A., V. D. Pope, W. L. Grose, M. Bailey, H. MacLean, and R.Swinbank, Evolution of the stratosphere during northern winter1991–92 as diagnosed from UKMO analyses, J. Atmos. Sci., 51,2800–2817, 1994.
Orsolini, Y., On the formation of ozone laminae at the edge of theArctic polar vortex, Q. J. R. Meteorol. Soc., 121, 1923–1941, 1995.
Orsolini, Y. J., G. Hansen, U-P. Hoppe, G. L. Manney, and K. H.Fricke, Dynamical modelling of wintertime lidar observations in theArctic: Ozone laminae and ozone depletion, Q. J. R. Meteorol Soc.,123, 785–800, 1997.
O’Sullivan, D., and T. J. Dunkerton, The influence of the quasi-biennial oscillation on global constituent distributions, J. Geophys.Res., 102, 21,731–21,743, 1997.
O’Sullivan, D., and M. H. Hitchman, Inertial instability and Rossbywave breaking in a numerical model, J. Atmos. Sci., 49, 991–1002,1992.
Pierce, R. B., and T. D. A. Fairlie, Chaotic advection in the strato-
sphere: Implications for the dispersal of chemically perturbed airfrom the polar vortex, J. Geophys. Res., 98, 18,589–18,595, 1993.
Pierce, R.-B., W. T. Blackshear, T. D. Fairlie, W. L. Grose, and R. E.Turner, The interaction of radiative and dynamical processes duringa simulated sudden stratospheric warming, J. Atmos. Sci., 50, 3829–3851, 1993.
Pierce, R. B., T. D. A. Fairlie, W. L. Grose, R. Swinbank, and A.O’Neill, Mixing processes within the polar night jet, J. Atmos. Sci.,51, 2857–2972, 1994.
Plumb, R. A., D. W. Waugh, R. J. Atkinson, P. A. Newman, L. R. Lait,M. R. Schoeberl, E. V. Browell, A. J. Simmons, and M. Loewen-stein, Intrusions into the lower stratospheric Arctic vortex during thewinter of 1991–1992, J. Geophys. Res., 99, 1089–1105, 1994.
Polvani, L. M., D. W. Waugh, and R. A. Plumb, On the subtropicaledge of the stratospheric surf zone, J. Atmos. Sci., 52, 1288–1309,1995.
Poole, L. R., and M. C. Pitts, Polar stratospheric cloud climatologybased on Stratospheric Aerosol Measurement II observations from1978 to 1989, J. Geophys. Res., 99, 13,083–13,089, 1994.
Postel, G. A., and M. H. Hitchman, A climatology of Rossby wavebreaking along the subtropical tropopause, J. Atmos. Sci., 55, inpress, 1998.
Randel, W. J., J. C. Gille, A. E. Roche, J. B. Kumer, J. L. Mergan-thaler, J. W. Waters, E. F. Fishbein, and W. A. Lahoz, Stratospherictransport from the tropics to middle latitudes by planetary-wavemixing, Nature, 365, 533–535, 1993.
Rogers, H. L., W. A. Norton, A. Lambert, and R. G. Granger, Trans-port of Mt. Pinatubo aerosol by tropospheric synoptic-scale waves,Q. J. R. Meteorol. Soc., 124, 193–209, 1998.
Rom-Kedar, V., and N. Paldor, From the tropics to the poles in fortydays, Bull. Am. Meteorol. Soc., 78, 2779–2784, 1997.
Rood, R., A. Douglass, and C. Weaver, Tracer exchange betweentropics and middle latitudes, Geophys. Res. Lett., 19, 805–808, 1992.
Rosen, J. M., N. T. Kjome, and H. Fast, Penetration of Mt. Pinatuboaerosols into the north polar vortex, Geophys. Res. Lett., 19, 1751–1754, 1992.
Russell, P. B., et al., Satellite and correlative measurements of thestratospheric aerosol, II, Comparison of measurements made bySAM II, dustsondes and an airborne lidar, J. Atmos. Sci., 38, 1295–1312, 1981.
Schoeberl, M. R., and P. A. Newman, A multiple-level trajectoryanalysis of vortex filaments, J. Geophys. Res., 100, 25,801–25,815,1995.
Schoeberl, M. R., L. R. Lait, P. A. Newman, and J. E. Rosenfield, Thestructure of the polar vortex, J. Geophys. Res., 97, 7859–7882, 1992.
Schoeberl, M. R., A. E. Roche, J. M. Russell III, D. Ortland, P. B.Hays, and J. W. Waters, An estimation of the dynamical isolation ofthe tropical lower stratosphere using UARS wind and trace gasobservations of the quasi-biennial oscillation, Geophys. Res. Lett., 24,53–56, 1997.
Shapiro, M. A., R. C. Schnell, F. P. Parungo, S. J. Oltmans, and B. A.Bodhaine, El Chichon volcanic debris in an Arctic tropopause fold,Geophys. Res. Lett., 11, 421–424, 1984.
Stolarski, R. S., et al., 1995 Scientific assessment of the atmosphericeffects of stratospheric aircraft, NASA Ref. Publ. 1381, 64 pp., 1995.
Sutton, R. T., H. Maclean, R. Swinbank, A. O’Neill, and F. W. Taylor,High-resolution stratospheric tracer fields estimated from satelliteobservations using Lagrangian trajectory calculations, J. Atmos. Sci.,51, 2995–3005, 1994.
Thomason, L. W., L. R. Poole, and T. Deshler, A global climatology ofstratospheric aerosol surface area density deduced from Strato-spheric Aerosol and Gas Experiment II measurements: 1984–1994,J. Geophys. Res., 102, 8967–8976, 1997.
Thorncroft, C. D., B. J. Hoskins, and M. E. McIntyre, Two paradigmsof baroclinic-wave life-cycle behaviour, Q. J. R. Meteorol. Soc., 119,17–55, 1993.
Trenberth, K. E., Global analyses from ECMWF and atlas of 1000 to10 mb circulation statistics, NCAR Tech. Note, NCAR/TN-3731STR,Natl. Cent. for Atmos. Res., Boulder, Colo., 1992.
Trepte, C. R., and M. H. Hitchman, Tropical stratospheric circulationdeduced from satellite aerosol data, Nature, 355, 626–628, 1992.
Trepte, C. R., R. E. Veiga, and M. P. McCormick, The polewarddispersal of Mount Pinatubo volcanic aerosol, J. Geophys. Res., 98,18,563–18,573, 1993.
Volk, C. M., et al., Quantifying transport between the tropical andmid-latitude lower stratosphere, Science, 272, 1763–1768, 1996.
6289HARVEY ET AL.: TROPICAL AEROSOL IN THE ALEUTIAN HIGH

Waugh, D. W., Subtropical stratospheric mixing linked to disturbancesin the polar vortices, Nature, 365, 535–537, 1993.
Waugh, D. W., Seasonal variation of isentropic transport out of thetropical stratosphere, J. Geophys. Res., 101, 4007–4023, 1996.
Waugh, D. W., R. A. Plumb, P. A. Newman, M. R. Schoeberl, L. R.Lait, M. Loewenstein, J. R. Podolske, J. W. Elkins, and K. R. Chan,Fine-scale, poleward transport of tropical air during AASE 2, Geo-phys. Res. Lett., 21, 2603–2606, 1994.
Ziemke, J. R., and J. L. Stanford, Zonal asymmetries in SAMS strato-spheric methane and nitrous oxide, Q. J. R. Meteorol. Soc., 121,911–925, 1995.
T. D. Fairlie, V. L. Harvey, and R. B. Pierce, NASA Langley Re-search Center, MS 401B, Hampton, VA 23681. ([email protected])
M. H. Hitchman, Department of Atmospheric and Oceanic Sci-ences, University of Wisconsin-Madison, Madison, WI 53706.
(Received July 29, 1998; revised November 12, 1998;accepted November 16, 1998.)
HARVEY ET AL.: TROPICAL AEROSOL IN THE ALEUTIAN HIGH6290