tropical storm maria floods puerto ricotropical storm maria . floods puerto rico. gary s. votaw . a....
TRANSCRIPT
Tropical Storm Maria Floods Puerto Rico
Gary S. Votaw
a. Synoptic History
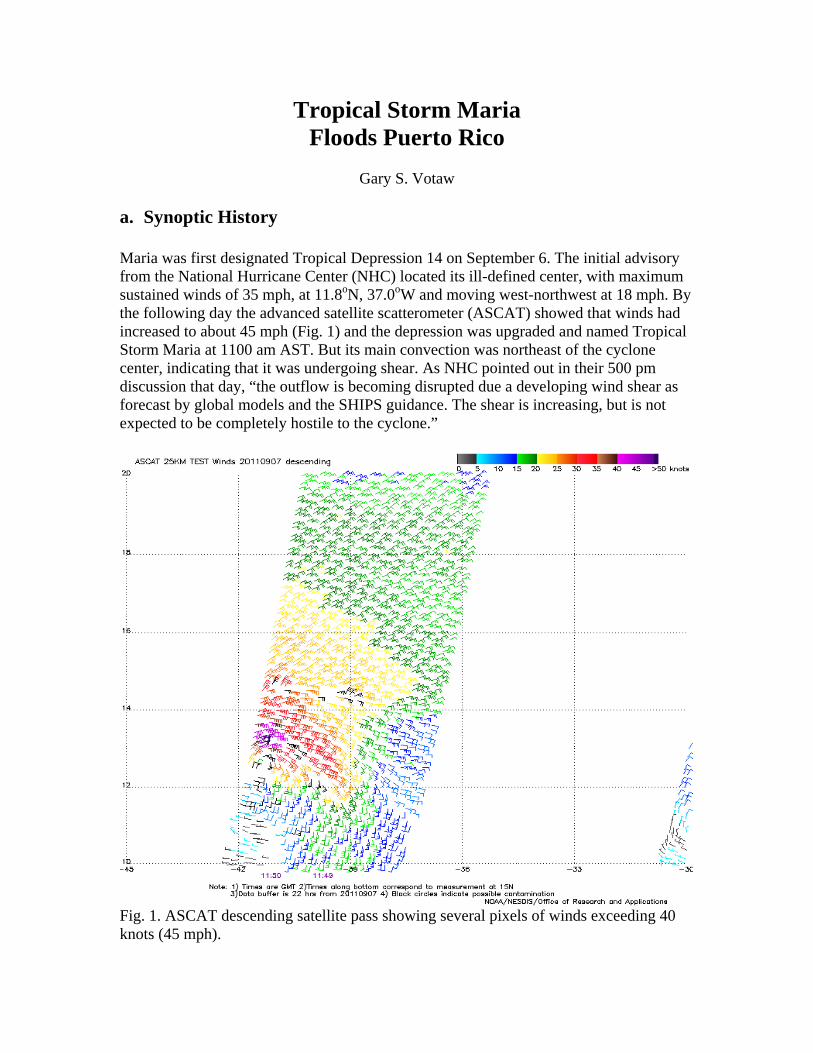
Maria was first designated Tropical Depression 14 on September 6. The initial advisory from the National Hurricane Center (NHC) located its ill-defined center, with maximum sustained winds of 35 mph, at 11.8oN, 37.0oW and moving west-northwest at 18 mph. By the following day the advanced satellite scatterometer (ASCAT) showed that winds had increased to about 45 mph (Fig. 1) and the depression was upgraded and named Tropical Storm Maria at 1100 am AST. But its main convection was northeast of the cyclone center, indicating that it was undergoing shear. As NHC pointed out in their 500 pm discussion that day, “the outflow is becoming disrupted due a developing wind shear as forecast by global models and the SHIPS guidance. The shear is increasing, but is not expected to be completely hostile to the cyclone.”
Fig. 1. ASCAT descending satellite pass showing several pixels of winds exceeding 40 knots (45 mph).
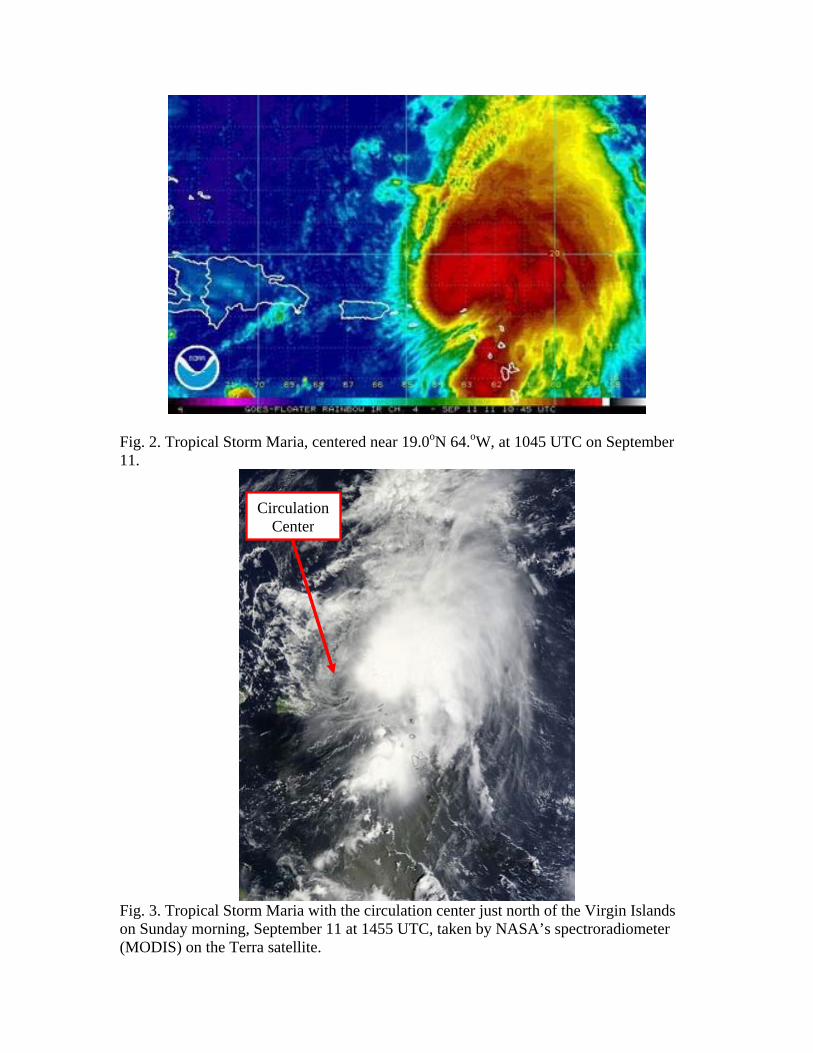
Fig. 2. Tropical Storm Maria, centered near 19.0oN 64.oW, at 1045 UTC on September 11.
Circulation Center
Fig. 3. Tropical Storm Maria with the circulation center just north of the Virgin Islands on Sunday morning, September 11 at 1455 UTC, taken by NASA’s spectroradiometer (MODIS) on the Terra satellite.
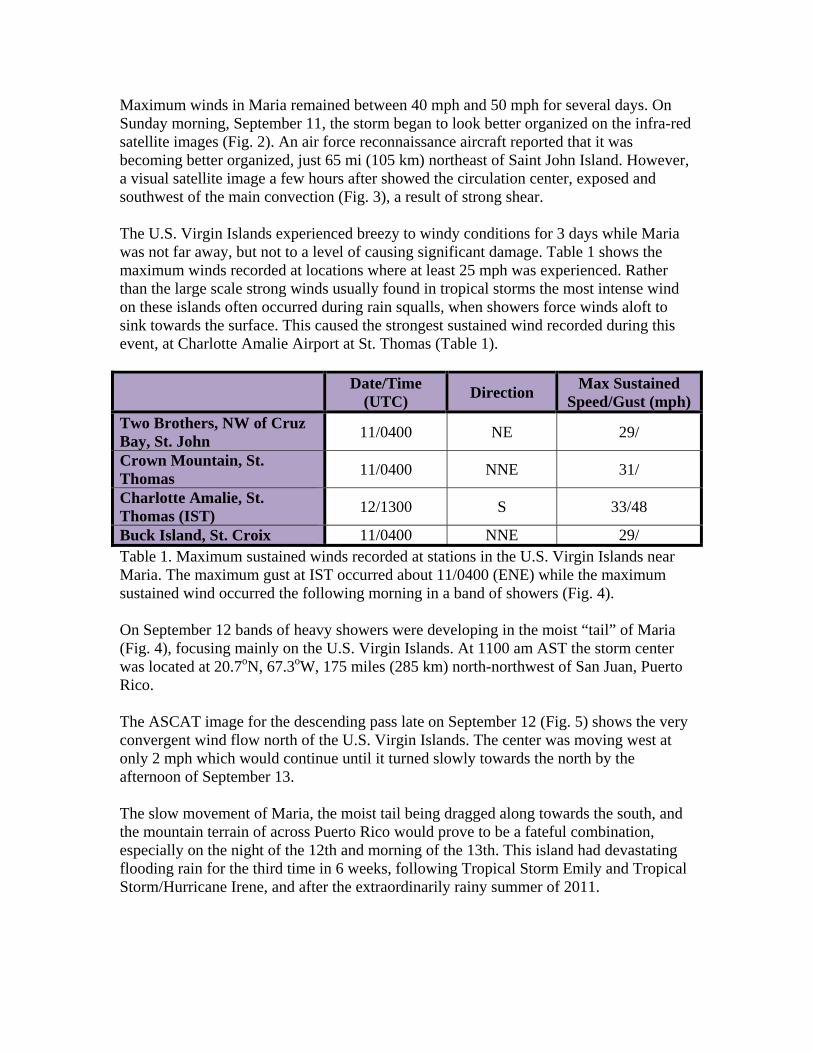
Maximum winds in Maria remained between 40 mph and 50 mph for several days. On Sunday morning, September 11, the storm began to look better organized on the infra-red satellite images (Fig. 2). An air force reconnaissance aircraft reported that it was becoming better organized, just 65 mi (105 km) northeast of Saint John Island. However, a visual satellite image a few hours after showed the circulation center, exposed and southwest of the main convection (Fig. 3), a result of strong shear. The U.S. Virgin Islands experienced breezy to windy conditions for 3 days while Maria was not far away, but not to a level of causing significant damage. Table 1 shows the maximum winds recorded at locations where at least 25 mph was experienced. Rather than the large scale strong winds usually found in tropical storms the most intense wind on these islands often occurred during rain squalls, when showers force winds aloft to sink towards the surface. This caused the strongest sustained wind recorded during this event, at Charlotte Amalie Airport at St. Thomas (Table 1). Date/Time
(UTC) Direction Max Sustained Speed/Gust (mph)
Two Brothers, NW of Cruz Bay, St. John 11/0400 NE 29/
Crown Mountain, St. Thomas 11/0400 NNE 31/
Charlotte Amalie, St. Thomas (IST) 12/1300 S 33/48
Buck Island, St. Croix 11/0400 NNE 29/ Table 1. Maximum sustained winds recorded at stations in the U.S. Virgin Islands near Maria. The maximum gust at IST occurred about 11/0400 (ENE) while the maximum sustained wind occurred the following morning in a band of showers (Fig. 4). On September 12 bands of heavy showers were developing in the moist “tail” of Maria (Fig. 4), focusing mainly on the U.S. Virgin Islands. At 1100 am AST the storm center was located at 20.7oN, 67.3oW, 175 miles (285 km) north-northwest of San Juan, Puerto Rico. The ASCAT image for the descending pass late on September 12 (Fig. 5) shows the very convergent wind flow north of the U.S. Virgin Islands. The center was moving west at only 2 mph which would continue until it turned slowly towards the north by the afternoon of September 13. The slow movement of Maria, the moist tail being dragged along towards the south, and the mountain terrain of across Puerto Rico would prove to be a fateful combination, especially on the night of the 12th and morning of the 13th. This island had devastating flooding rain for the third time in 6 weeks, following Tropical Storm Emily and Tropical Storm/Hurricane Irene, and after the extraordinarily rainy summer of 2011.
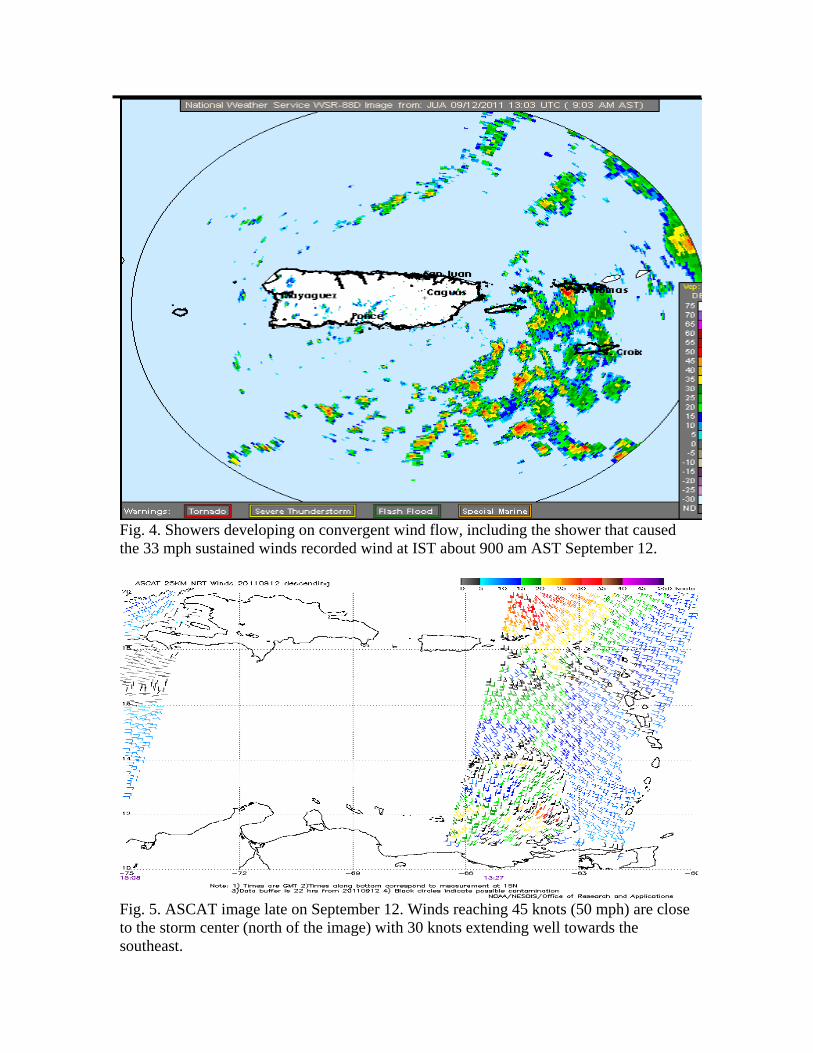
Fig. 4. Showers developing on convergent wind flow, including the shower that caused the 33 mph sustained winds recorded wind at IST about 900 am AST September 12.
Fig. 5. ASCAT image late on September 12. Winds reaching 45 knots (50 mph) are close to the storm center (north of the image) with 30 knots extending well towards the southeast.
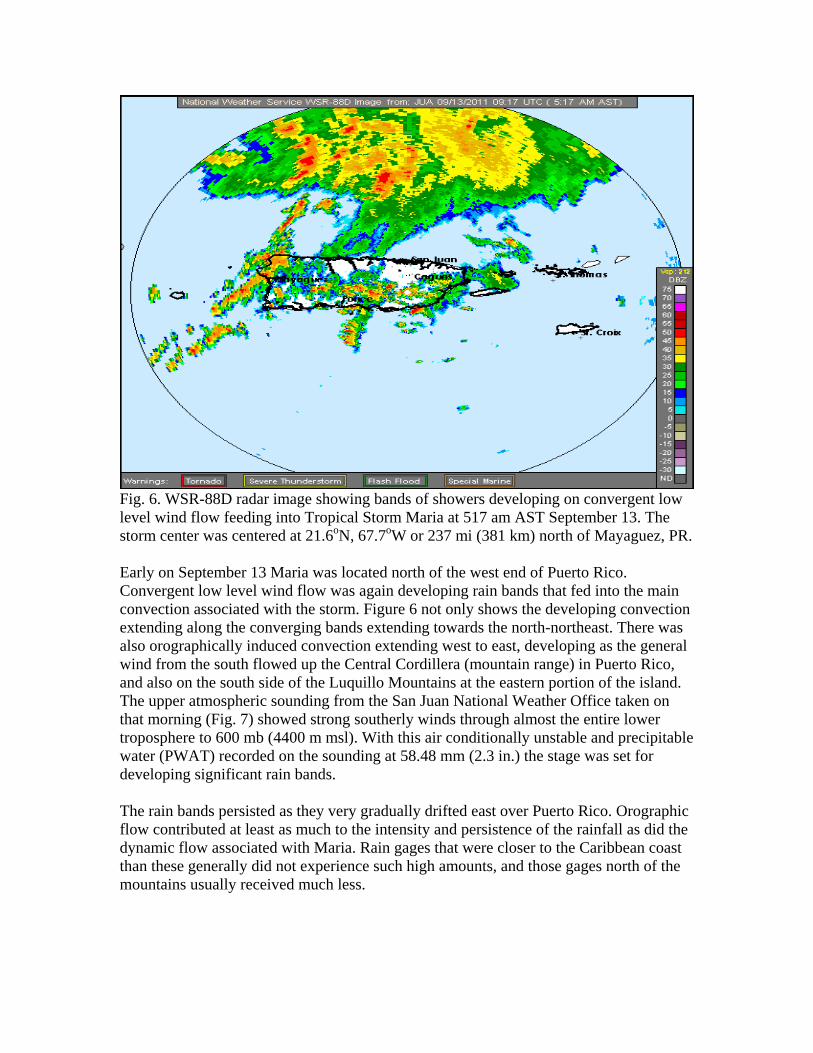
Fig. 6. WSR-88D radar image showing bands of showers developing on convergent low level wind flow feeding into Tropical Storm Maria at 517 am AST September 13. The storm center was centered at 21.6oN, 67.7oW or 237 mi (381 km) north of Mayaguez, PR. Early on September 13 Maria was located north of the west end of Puerto Rico. Convergent low level wind flow was again developing rain bands that fed into the main convection associated with the storm. Figure 6 not only shows the developing convection extending along the converging bands extending towards the north-northeast. There was also orographically induced convection extending west to east, developing as the general wind from the south flowed up the Central Cordillera (mountain range) in Puerto Rico, and also on the south side of the Luquillo Mountains at the eastern portion of the island. The upper atmospheric sounding from the San Juan National Weather Office taken on that morning (Fig. 7) showed strong southerly winds through almost the entire lower troposphere to 600 mb (4400 m msl). With this air conditionally unstable and precipitable water (PWAT) recorded on the sounding at 58.48 mm (2.3 in.) the stage was set for developing significant rain bands. The rain bands persisted as they very gradually drifted east over Puerto Rico. Orographic flow contributed at least as much to the intensity and persistence of the rainfall as did the dynamic flow associated with Maria. Rain gages that were closer to the Caribbean coast than these generally did not experience such high amounts, and those gages north of the mountains usually received much less.
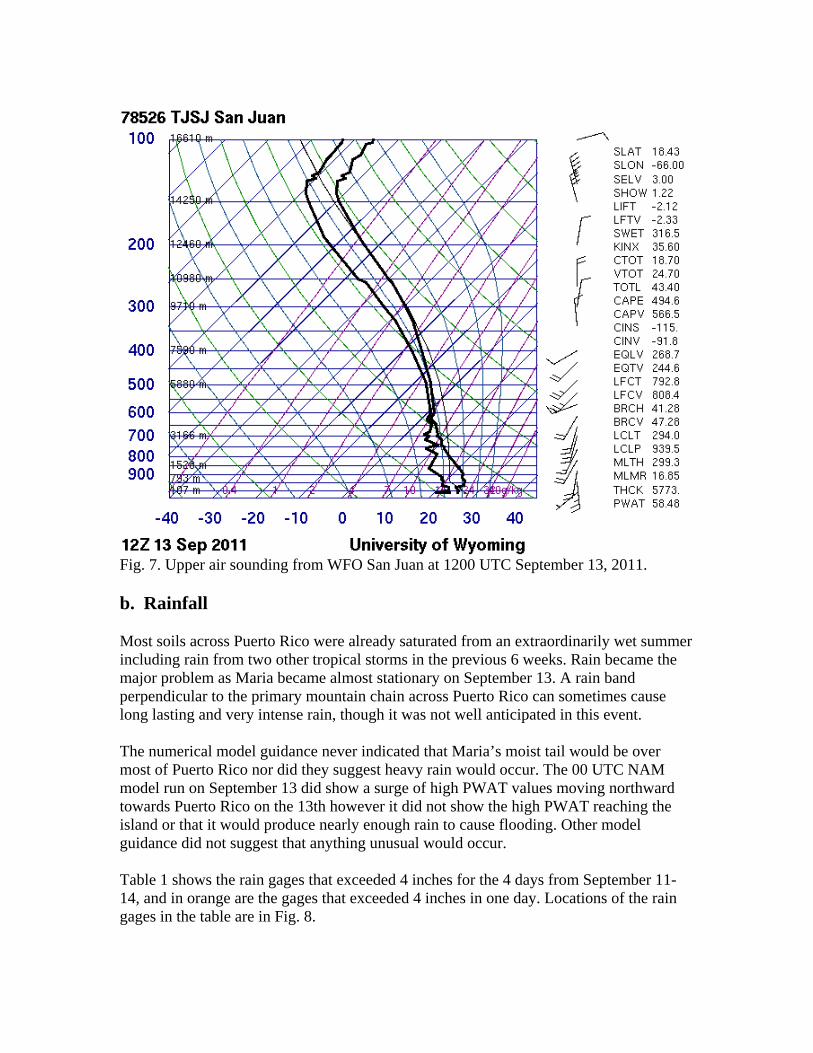
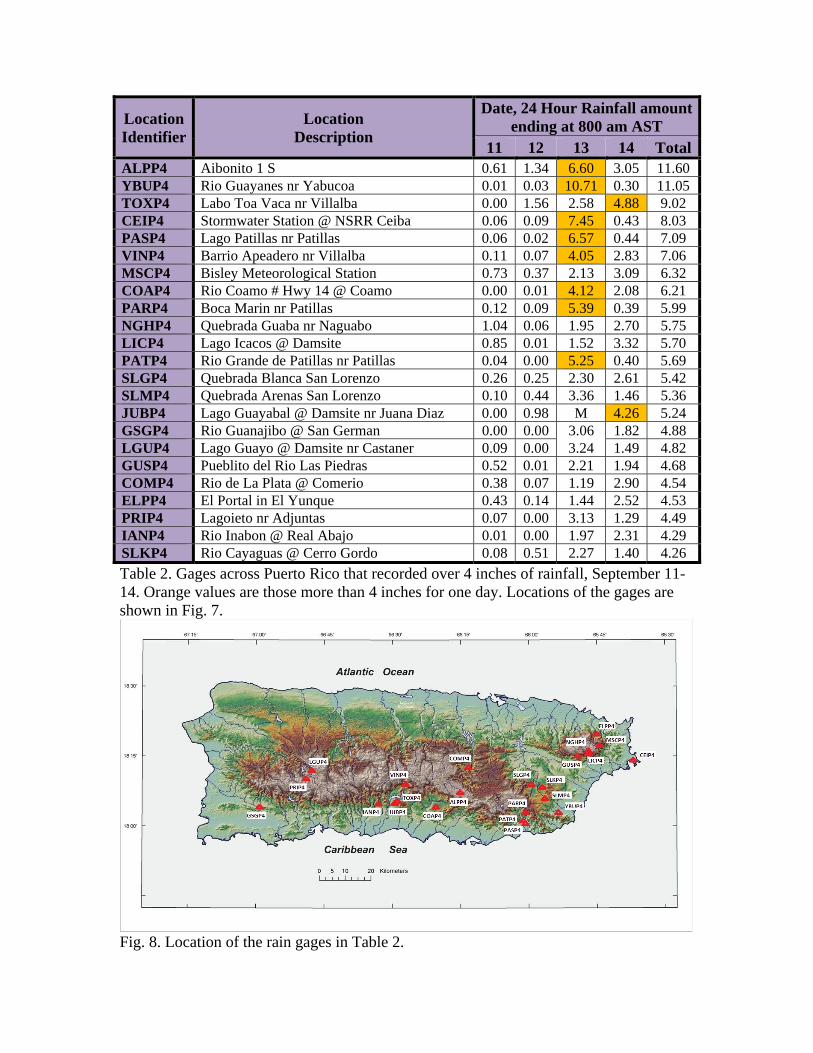
Fig. 7. Upper air sounding from WFO San Juan at 1200 UTC September 13, 2011. b. Rainfall Most soils across Puerto Rico were already saturated from an extraordinarily wet summer including rain from two other tropical storms in the previous 6 weeks. Rain became the major problem as Maria became almost stationary on September 13. A rain band perpendicular to the primary mountain chain across Puerto Rico can sometimes cause long lasting and very intense rain, though it was not well anticipated in this event. The numerical model guidance never indicated that Maria’s moist tail would be over most of Puerto Rico nor did they suggest heavy rain would occur. The 00 UTC NAM model run on September 13 did show a surge of high PWAT values moving northward towards Puerto Rico on the 13th however it did not show the high PWAT reaching the island or that it would produce nearly enough rain to cause flooding. Other model guidance did not suggest that anything unusual would occur. Table 1 shows the rain gages that exceeded 4 inches for the 4 days from September 11-14, and in orange are the gages that exceeded 4 inches in one day. Locations of the rain gages in the table are in Fig. 8.
Location Identifier
Location Description
Date, 24 Hour Rainfall amountending at 800 am AST
11 12 13 14 TotalALPP4 Aibonito 1 S 0.61 1.34 6.60 3.05 11.60 YBUP4 Rio Guayanes nr Yabucoa 0.01 0.03 10.71 0.30 11.05 TOXP4 Labo Toa Vaca nr Villalba 0.00 1.56 2.58 4.88 9.02 CEIP4 Stormwater Station @ NSRR Ceiba 0.06 0.09 7.45 0.43 8.03 PASP4 Lago Patillas nr Patillas 0.06 0.02 6.57 0.44 7.09 VINP4 Barrio Apeadero nr Villalba 0.11 0.07 4.05 2.83 7.06 MSCP4 Bisley Meteorological Station 0.73 0.37 2.13 3.09 6.32 COAP4 Rio Coamo # Hwy 14 @ Coamo 0.00 0.01 4.12 2.08 6.21 PARP4 Boca Marin nr Patillas 0.12 0.09 5.39 0.39 5.99 NGHP4 Quebrada Guaba nr Naguabo 1.04 0.06 1.95 2.70 5.75 LICP4 Lago Icacos @ Damsite 0.85 0.01 1.52 3.32 5.70 PATP4 Rio Grande de Patillas nr Patillas 0.04 0.00 5.25 0.40 5.69 SLGP4 Quebrada Blanca San Lorenzo 0.26 0.25 2.30 2.61 5.42 SLMP4 Quebrada Arenas San Lorenzo 0.10 0.44 3.36 1.46 5.36 JUBP4 Lago Guayabal @ Damsite nr Juana Diaz 0.00 0.98 M 4.26 5.24 GSGP4 Rio Guanajibo @ San German 0.00 0.00 3.06 1.82 4.88 LGUP4 Lago Guayo @ Damsite nr Castaner 0.09 0.00 3.24 1.49 4.82 GUSP4 Pueblito del Rio Las Piedras 0.52 0.01 2.21 1.94 4.68 COMP4 Rio de La Plata @ Comerio 0.38 0.07 1.19 2.90 4.54 ELPP4 El Portal in El Yunque 0.43 0.14 1.44 2.52 4.53 PRIP4 Lagoieto nr Adjuntas 0.07 0.00 3.13 1.29 4.49 IANP4 Rio Inabon @ Real Abajo 0.01 0.00 1.97 2.31 4.29 SLKP4 Rio Cayaguas @ Cerro Gordo 0.08 0.51 2.27 1.40 4.26 Table 2. Gages across Puerto Rico that recorded over 4 inches of rainfall, September 11-14. Orange values are those more than 4 inches for one day. Locations of the gages are shown in Fig. 7.
Fig. 8. Location of the rain gages in Table 2.
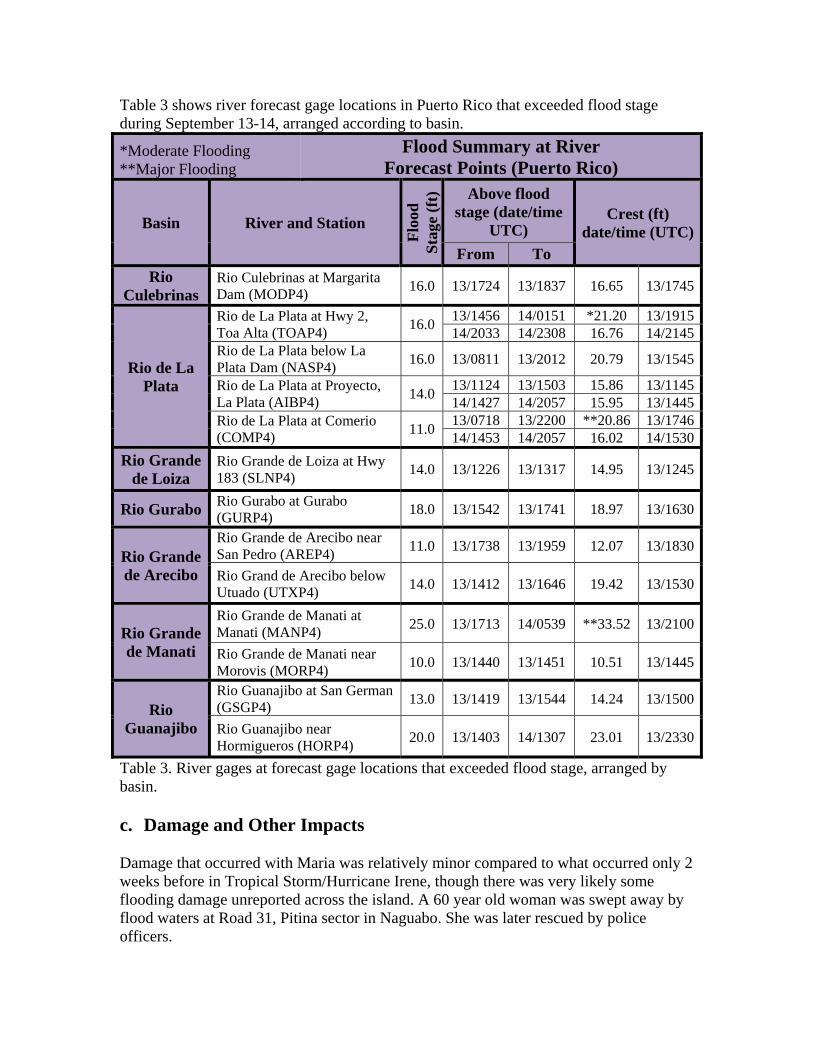
Table 3 shows river forecast gage locations in Puerto Rico that exceeded flood stage during September 13-14, arranged according to basin.
*Moderate Flooding **Major Flooding
Flood Summary at River Forecast Points (Puerto Rico)
Basin River and Station
Floo
d St
age
(ft)
Above flood stage (date/time
UTC) Crest (ft)
date/time (UTC)From To
Rio Culebrinas
Rio Culebrinas at Margarita Dam (MODP4) 16.0 13/1724 13/1837 16.65 13/1745
Rio de La Plata
Rio de La Plata at Hwy 2, Toa Alta (TOAP4) 16.0 13/1456 14/0151 *21.20 13/1915
14/2033 14/2308 16.76 14/2145Rio de La Plata below La Plata Dam (NASP4) 16.0 13/0811 13/2012 20.79 13/1545
Rio de La Plata at Proyecto, La Plata (AIBP4) 14.0 13/1124 13/1503 15.86 13/1145
14/1427 14/2057 15.95 13/1445Rio de La Plata at Comerio (COMP4) 11.0 13/0718 13/2200 **20.86 13/1746
14/1453 14/2057 16.02 14/1530Rio Grande
de Loiza Rio Grande de Loiza at Hwy 183 (SLNP4) 14.0 13/1226 13/1317 14.95 13/1245
Rio Gurabo Rio Gurabo at Gurabo (GURP4) 18.0 13/1542 13/1741 18.97 13/1630
Rio Grande de Arecibo
Rio Grande de Arecibo near San Pedro (AREP4) 11.0 13/1738 13/1959 12.07 13/1830
Rio Grand de Arecibo below Utuado (UTXP4) 14.0 13/1412 13/1646 19.42 13/1530
Rio Grande de Manati
Rio Grande de Manati at Manati (MANP4) 25.0 13/1713 14/0539 **33.52 13/2100
Rio Grande de Manati near Morovis (MORP4) 10.0 13/1440 13/1451 10.51 13/1445
Rio Guanajibo
Rio Guanajibo at San German (GSGP4) 13.0 13/1419 13/1544 14.24 13/1500
Rio Guanajibo near Hormigueros (HORP4) 20.0 13/1403 14/1307 23.01 13/2330
Table 3. River gages at forecast gage locations that exceeded flood stage, arranged by basin. c. Damage and Other Impacts
Damage that occurred with Maria was relatively minor compared to what occurred only 2 weeks before in Tropical Storm/Hurricane Irene, though there was very likely some flooding damage unreported across the island. A 60 year old woman was swept away by flood waters at Road 31, Pitina sector in Naguabo. She was later rescued by police officers.
Urban roadway flooding occurred along portions of Highway 53 between Naguabo and Ceiba, along Highway 3 on the northeast of the island, and on Highway 53 near Puerto Del Rey and Roosevelt Roads/Ceiba. These highways were temporarily impassable.
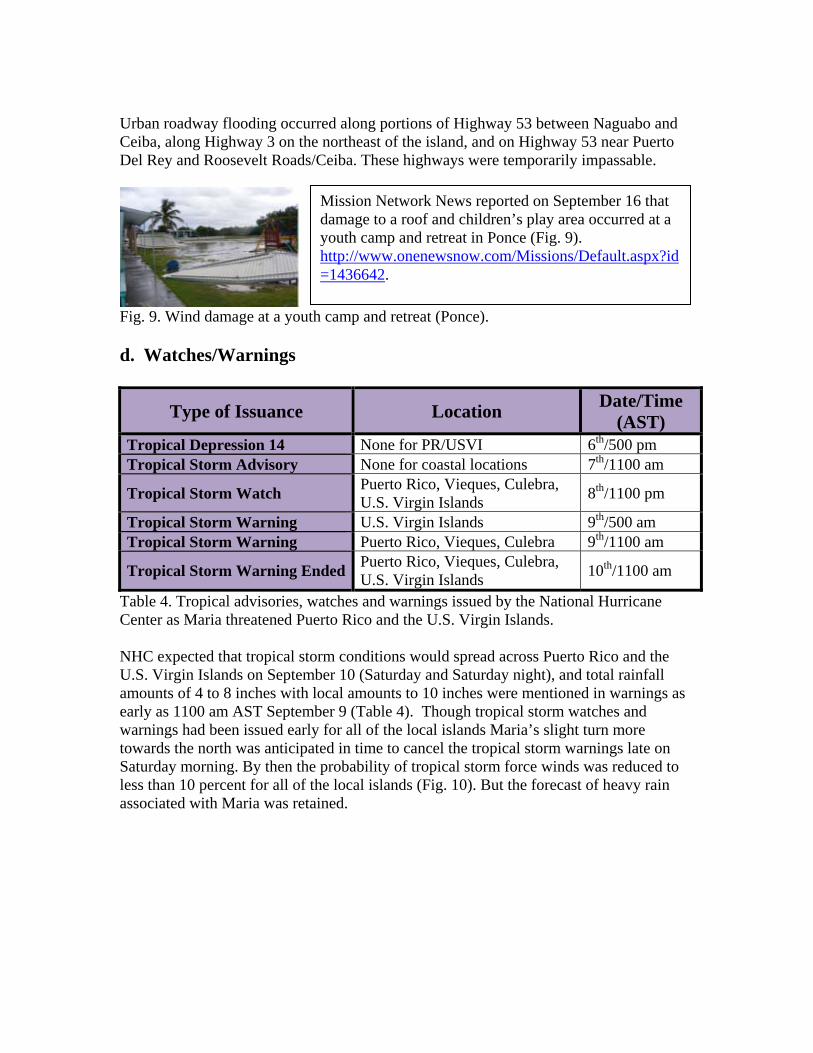
Fig. 9. Wind damage at a youth camp and retreat (Ponce).
Mission Network News reported on September 16 that damage to a roof and children’s play area occurred at a youth camp and retreat in Ponce (Fig. 9). http://www.onenewsnow.com/Missions/Default.aspx?id=1436642.
d. Watches/Warnings
Type of Issuance Location Date/Time (AST)
Tropical Depression 14 None for PR/USVI 6th/500 pm Tropical Storm Advisory None for coastal locations 7th/1100 am
Tropical Storm Watch Puerto Rico, Vieques, Culebra, U.S. Virgin Islands 8th/1100 pm
Tropical Storm Warning U.S. Virgin Islands 9th/500 am Tropical Storm Warning Puerto Rico, Vieques, Culebra 9th/1100 am
Tropical Storm Warning Ended Puerto Rico, Vieques, Culebra, U.S. Virgin Islands 10th/1100 am
Table 4. Tropical advisories, watches and warnings issued by the National Hurricane Center as Maria threatened Puerto Rico and the U.S. Virgin Islands.
NHC expected that tropical storm conditions would spread across Puerto Rico and the U.S. Virgin Islands on September 10 (Saturday and Saturday night), and total rainfall amounts of 4 to 8 inches with local amounts to 10 inches were mentioned in warnings as early as 1100 am AST September 9 (Table 4). Though tropical storm watches and warnings had been issued early for all of the local islands Maria’s slight turn more towards the north was anticipated in time to cancel the tropical storm warnings late on Saturday morning. By then the probability of tropical storm force winds was reduced to less than 10 percent for all of the local islands (Fig. 10). But the forecast of heavy rain associated with Maria was retained.
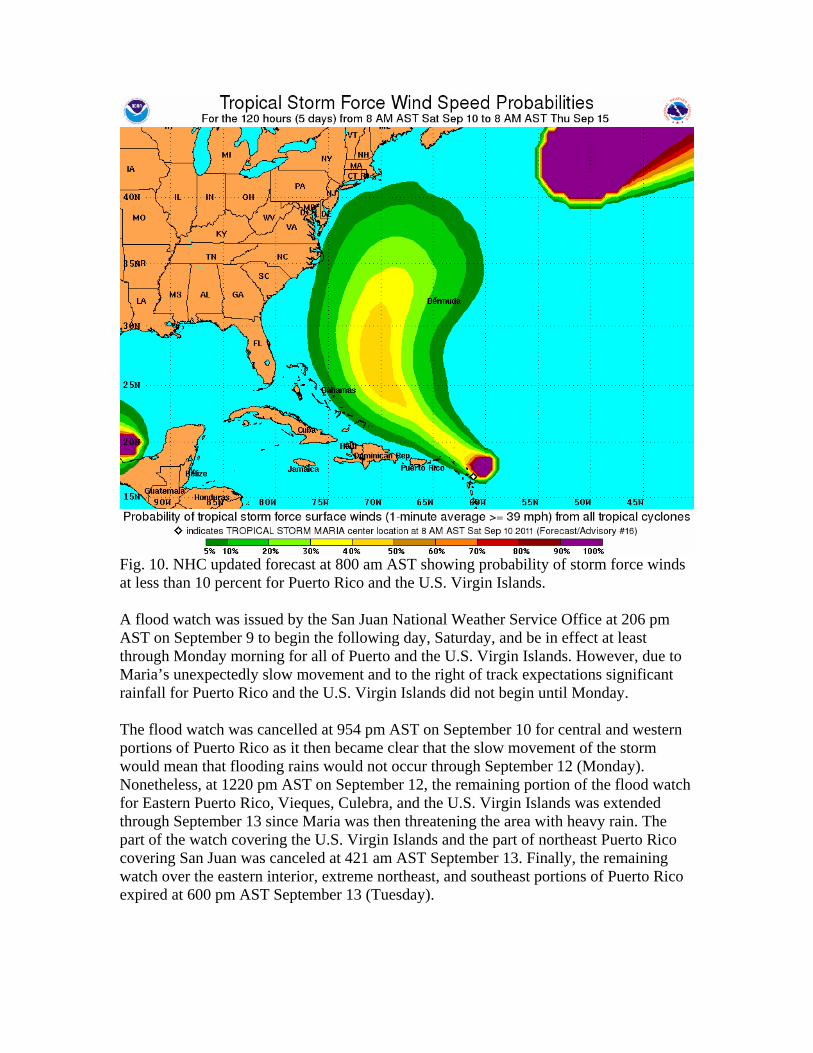
Fig. 10. NHC updated forecast at 800 am AST showing probability of storm force winds at less than 10 percent for Puerto Rico and the U.S. Virgin Islands. A flood watch was issued by the San Juan National Weather Service Office at 206 pm AST on September 9 to begin the following day, Saturday, and be in effect at least through Monday morning for all of Puerto and the U.S. Virgin Islands. However, due to Maria’s unexpectedly slow movement and to the right of track expectations significant rainfall for Puerto Rico and the U.S. Virgin Islands did not begin until Monday. The flood watch was cancelled at 954 pm AST on September 10 for central and western portions of Puerto Rico as it then became clear that the slow movement of the storm would mean that flooding rains would not occur through September 12 (Monday). Nonetheless, at 1220 pm AST on September 12, the remaining portion of the flood watch for Eastern Puerto Rico, Vieques, Culebra, and the U.S. Virgin Islands was extended through September 13 since Maria was then threatening the area with heavy rain. The part of the watch covering the U.S. Virgin Islands and the part of northeast Puerto Rico covering San Juan was canceled at 421 am AST September 13. Finally, the remaining watch over the eastern interior, extreme northeast, and southeast portions of Puerto Rico expired at 600 pm AST September 13 (Tuesday).
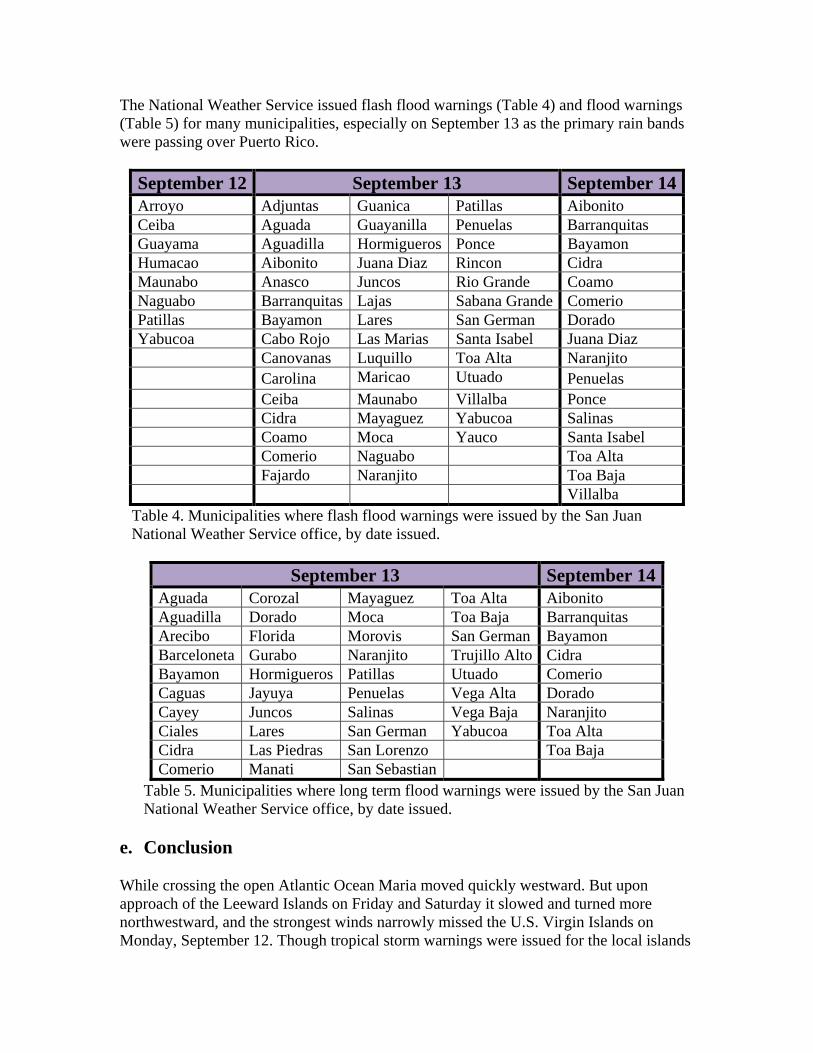
The National Weather Service issued flash flood warnings (Table 4) and flood warnings (Table 5) for many municipalities, especially on September 13 as the primary rain bands were passing over Puerto Rico.
September 12 September 13 September 14Arroyo Adjuntas Guanica Patillas Aibonito Ceiba Aguada Guayanilla Penuelas Barranquitas Guayama Aguadilla Hormigueros Ponce Bayamon Humacao Aibonito Juana Diaz Rincon Cidra Maunabo Anasco Juncos Rio Grande Coamo Naguabo Barranquitas Lajas Sabana Grande Comerio Patillas Bayamon Lares San German Dorado Yabucoa Cabo Rojo Las Marias Santa Isabel Juana Diaz Canovanas Luquillo Toa Alta Naranjito
Carolina Maricao Utuado Penuelas Ceiba Maunabo Villalba Ponce Cidra Mayaguez Yabucoa Salinas Coamo Moca Yauco Santa Isabel Comerio Naguabo Toa Alta Fajardo Naranjito Toa Baja Villalba
Table 4. Municipalities where flash flood warnings were issued by the San Juan National Weather Service office, by date issued.
September 13 September 14
Aguada Corozal Mayaguez Toa Alta Aibonito Aguadilla Dorado Moca Toa Baja Barranquitas Arecibo Florida Morovis San German Bayamon Barceloneta Gurabo Naranjito Trujillo Alto Cidra Bayamon Hormigueros Patillas Utuado Comerio Caguas Jayuya Penuelas Vega Alta Dorado Cayey Juncos Salinas Vega Baja Naranjito Ciales Lares San German Yabucoa Toa Alta Cidra Las Piedras San Lorenzo Toa Baja Comerio Manati San Sebastian
Table 5. Municipalities where long term flood warnings were issued by the San Juan National Weather Service office, by date issued.
e. Conclusion While crossing the open Atlantic Ocean Maria moved quickly westward. But upon approach of the Leeward Islands on Friday and Saturday it slowed and turned more northwestward, and the strongest winds narrowly missed the U.S. Virgin Islands on Monday, September 12. Though tropical storm warnings were issued for the local islands
the turn toward the right was anticipated soon enough to correctly cancel the warnings on the 10th. The storm moved north far enough to not be a major threat the local islands, except for flooding in the convective tail that would pass over Puerto Rico particularly on September 13. Flooding rains from Maria proved a much more difficult forecast challenge. Even though the NHC’s forecasted storm track was adjusted in time to dismiss the threat of storm force wind by the September 10 the total amount of forecast rainfall was then reduced to 2 to 4 inches with isolated amounts to 6 inches. The threat of heavier rain was not included in the forecast until the update at 200 pm AST September 13, after the intense rain bands had already developed. At that time total forecasted rainfall was raised to 4 to 8 inches over Puerto Rico with isolated amounts of 15 to 20 inches over higher elevations. The flood watch was issued generally 2 days too early since the storm passed by to the north and slowed greatly. Extending the watch to late Tuesday worked well though significant flooding did not materialize for the U.S. Virgin Islands, Culebra or Vieques. Flooding did occur over the interior, south central and southwest portions of Puerto Rico where no watch was in effect. Even as the watch was extended on September 12 for Eastern Puerto Rico and the U.S. Virgin Islands the models still did not suggest that rain would be a problem. However, short term flash flood warnings and flood warnings for rivers covered the event quite well once the developing rain bands were recognized.