ts-oncogene-transformed erythroleukemic cells: a novel
TRANSCRIPT

Haematology and Blood Transfusion Vol. 31 Modern Trends in Human Leukemia VII Edited by Neth, Gallo, Greaves, and Kabisch © Springer-Verlag Berlin Heidelberg 1987
ts-Oncogene-Transformed Erythroleukemic Cells: A Novel Test System for Purifying and Characterizing Avian Erythroid Growth Factors
E. Kowenz 1,2, A. Leutz 1 ,2, G. D6derlein 1, T. Graf 1 , and H. Beug 1
A. Introduction
An emerging, important characteristic of many leukemic cell types is their altered dependence on and/or response to hematopoietic growth factors [6, 17]. In mammals, many of these growth-regulatory proteins have been purified and the respective genes molecularly cloned [16, 26], but the mechanism by which they regulate growth and differentiation of normal hematopoietic precursors is still poorly understood. This is due partly to the fact that such hematopoietic precursors do not self-renew in vitro and constitute only a minor fraction of bone marrow cells, precluding their purification in large numbers [25]. One particularly successful approach to circumventing this problem was the use of avian retroviral oncogenes that transform hematopoietic precursors [10].
For instance, avian retroviruses containing tyrosine kinase oncogenes such as verbB, v-sea, or v-src, as well as the v-Ha-ras oncogene, readily transform avian erythroid progenitor cells [late BFU-E (burst-forming unit erythroid) to early CFU-E (colonyforming unit erythroid)] from chick bone marrow [8, 11]. By transformation, these precursors are induced to self-renew and thus to grow into mass cultures of immature, precursor-like cells. The transformed cells, however, retain the ability to undergo termi-
1 European Molecular Biology Laboratory, Postfach 10.2209, 6900 Heidelberg, FRO 2 Present address: University of New York at Stonybrook, Dept. of Microbiology, Life Sciences Bldg., Stonybrook, NY 11790
nal differentiation at low frequency [3, 7, 12]. At the same time, they become independent of an activity present in anemic chicken serum that induces CFU-E-like colonies in chicken bone marrow and probably represents avian erythropoietin (EPO) [1, 21].
Recently, our laboratory described the use of erythroblasts transformed with temperature-sensitive mutants of v-erbB (ts AEV) and v-sea (ts S13) containing retroviruses as novel systems for studying differentiation of normal and leukemic erythroid cells. Upon a shift to the nonpermissive temperature, ts-AEV and ts-S13 erythroblasts are induced to differentiate synchronously into erythrocytes. At the same time, the cells regain their dependence on a factor(s) from anemic chicken serum [1-3] (H. Beug et al., unpublished work).
Since little information was available on the nature of this avian erythropoietin-like factor(s) and its possible relationship to mammalian erythropoietin [5, 20], we were interested in using ts-oncogene-transformed erythroblasts to attempt its purification and characterization. Here we describe two simple assay systems for avian erythroid growth factors and their use in partially purifying and characterizing chicken erythropoietin, which is shown to be a glycoprotein of 38 kd, resembling mammalian EPO in many respects.
B. Materials and Methods
I. Viruses and Cells
A temperature-sensitive mutant of the S13 strain of avian erythroblastosis virus [2], re-
199
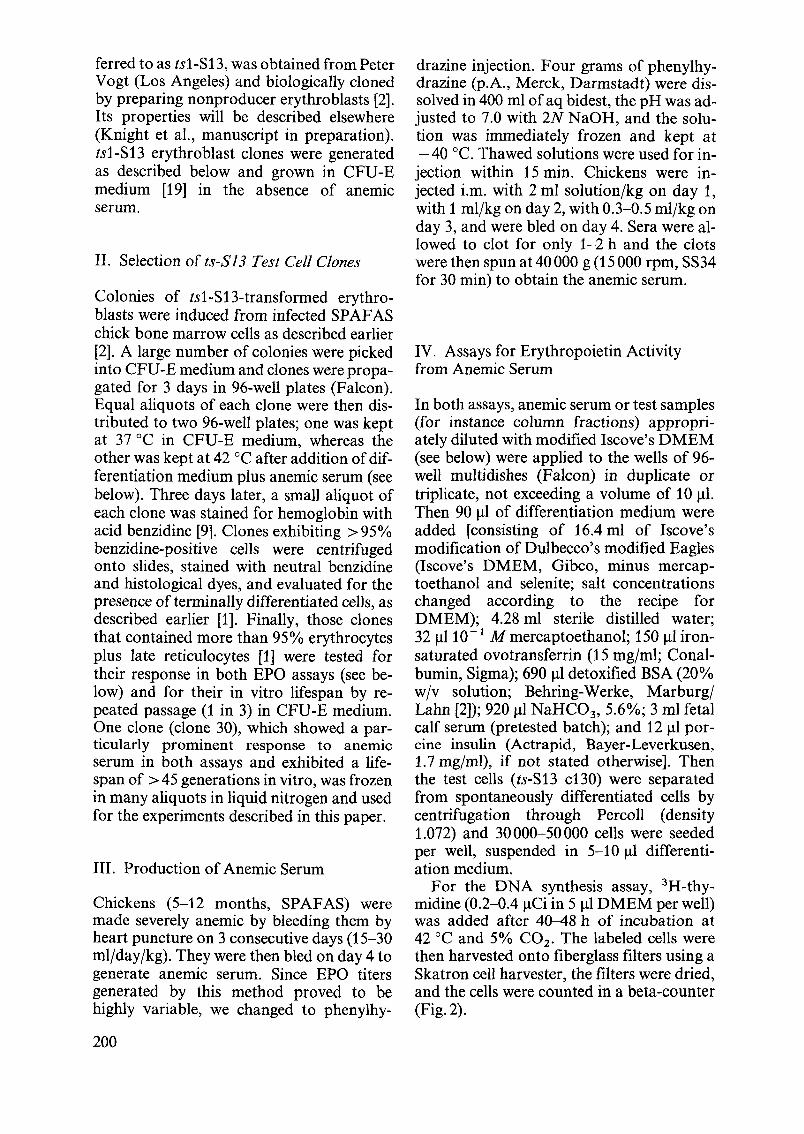
ferred to as ts1-S13, was obtained from Peter Vogt (Los Angeles) and biologically cloned by preparing nonproducer erythroblasts [2]. Its properties will be described elsewhere (Knight et aI., manuscript in preparation). ts1-S13 erythroblast clones were generated as described below and grown in CFU -E medium [19] in the absence of anemic serum.
II. Selection of ts-S13 Test Cell Clones
Colonies of ts1-S13-transformed erythroblasts were induced from infected SP AF AS chick bone marrow cells as described earlier [2]. A large number of colonies were picked into CFU-E medium and clones were propagated for 3 days in 96-well plates (Falcon). Equal aliquots of each clone were then distributed to two 96-well plates; one was kept at 37 DC in CFU-E medium, whereas the other was kept at 42 DC after addition of differentiation medium plus anemic serum (see below). Three days later, a small aliquot of each clone was stained for hemoglobin with acid benzidine [9]. Clones exhibiting> 95% benzidine-positive cells were centrifuged onto slides, stained with neutral benzidine and histological dyes, and evaluated for the presence of terminally differentiated cells, as described earlier [1]. Finally, those clones that contained more than 95% erythrocytes plus late reticulocytes [1] were tested for their response in both EPO assays (see below) and for their in vitro lifespan by repeated passage (1 in 3) in CFU-E medium. One clone (clone 30), which showed a particularly prominent response to anemic serum in both assays and exhibited a lifespan of > 45 generations in vitro, was frozen in many aliquots in liquid nitrogen and used for the experiments described in this paper.
III. Production of Anemic Serum
Chickens (5-12 months, SPAFAS) were made severely anemic by bleeding them by heart puncture on 3 consecutive days (15-30 ml/day/kg). They were then bled on day 4 to generate anemic serum. Since EPO titers generated by this method proved to be highly variable, we changed to phenylhy-
200
drazine injection. Four grams of phenylhydrazine (p.A., Merck, Darmstadt) were dissolved in 400 ml of aq bidest, the pH was adjusted to 7.0 with 2N NaOH, and the solution was immediately frozen and kept at - 40 DC. Thawed solutions were used for in-jection within 15 min. Chickens were injected i.m. with 2 ml solution/kg on day 1, with 1 ml/kg on day 2, with 0.3-0.5 ml/kg on day 3, and were bled on day 4. Sera were allowed to clot for only 1-2 h and the clots were then spun at 40000 g (15000 rpm, SS34 for 30 min) to obtain the anemic serum.
IV. Assays for Erythropoietin Activity from Anemic Serum
In both assays, anemic serum or test samples (for instance column fractions) appropriately diluted with modified Iscove's DMEM (see below) were applied to the wells of 96-well multidishes (Falcon) in duplicate or triplicate, not exceeding a volume of 10 Ill. Then 90 III of differentiation medium were added [consisting of 16.4 ml of Iscove's modification of Dulbecco's modified Eagles (lscove's DMEM, Gibco, minus mercaptoethanol and selenite; salt concentrations changed according to the recipe for DMEM); 4.28 ml sterile distilled water; 32 11110 -1 M mercaptoethanol; 150 III ironsaturated ovotransferrin (15 mg/ml; Conalbumin, Sigma); 690 III detoxified BSA (20% w/v solution; Behring-Werke, Marburgj Lahn [2]); 920 III NaHC03 , 5.6%; 3 ml fetal calf serum (pretested batch); and 12 III porcine insulin (Actrapid, Bayer-Leverkusen, 1.7 mg/ml), if not stated otherwise]. Then the test cells (ts-S13 c130) were separated from spontaneously differentiated cells by centrifugation through Percoll (density 1.072) and 30000-50000 cells were seeded per well, suspended in 5-10 III differentiation medium.
For the DNA synthesis assay, 3H-thymidine (0.2-0.4 IlCi in 5 III DMEM per well) was added after 40--48 h of incubation at 42 DC and 5% CO2 , The labeled cells were then harvested onto fiberglass filters using a Skatron cell harvester, the filters were dried, and the cells were counted in a beta-counter (Fig. 2).
For the photometric hemoglobin assay (measuring accumulated hemoglobin in viable cells) cells were incubated for 50-72 hat 42°C and 5% CO2 . They were then transferred to 96-well, V-bottomed microtiter plates and washed twice with Hanks' balanced salt solution containing 0.1 % detoxified BSA. Cells were lysed in 20 III H 20 for 20 min, and 200 III of developing reagent was added (0.5 mg/ml O-phenylenediamine in 0.1 M citrate/phosphate buffer, pH 5.0, containing 5 IlI/ml 30% H 20 2 added just prior to use). The color was allowed to develop for 15-30 min in the dark at room temperature, and the solutions were transferred to a flat-bottomed 96-well micro titer plate containing 30 III of 4 M sulphuric acid per well to stop the reaction and enhance the color. Absorbances were read at 492 in a Kontron SLT210 ELISA photometer, using 630 mm as the reference wavelength (Fig. 1).
V. Partial Purification of Chicken Erythropoietin
We centrifuged 200 ml of pooled anemic chicken sera for 90 min at 150000 g (Ti45 rotor Beckman, 40000 rpm). The clear supernatant was then applied to a Sephadex G25 column (Sephadex G25 fine; 5 cm in diameter, 50 cm long, equilibrated with 50 mM (NH4 hC03 buffer, pH 8.0). Protein-containing fractions eluting before or at the exclusion volume were then directly applied to a DEAE ion-exchange column (DEAE Sephacel; 6 cm in diameter, 25 cm long, equilibrated with 50 mM (NH4hC03 buffer, pH 8.0). After washing with 500 ml of starting buffer the column was eluted with a linear gradient of 50-400 mM (NH4)zC03 ; pH 8.0; gradient volume 21. Active fractions eluting at 150-200 mM (NH4hC03 were combined and lyophilized.
F or size-exclusion chromatography, the lyophilized fractions from DEAE ion-exchange chromatography were dissolved in 10 ml of 50 mM (NH4 hC03 buffer, pH 8, and applied to a size-exclusion column (Biogel P60, BioRad; 200-400 mesh, 5 cm in diameter, 90 cm long, 20 ml/h). The activity eluted behind the main protein peak (at a mol. wt.) range of 50000-30000). Active fractions were pooled and lyophilized.
For affinity chromatography, the lyophilized material was dissolved in 50 ml phosphate-buffered saline plus 0.1 mM MnCl2 and 0.1 mM CaCI2 , pH 7.4, and applied to two connected columns containing immobilized lentil-lectin (Affi-Gel P10, 8 mg lentillectin/ml gel, column volume 50 ml) and immobilized wheat-germ agglutinin (WGA, Pharmacia, Sepharose 4B, 10 mg lectin/ml gel, column volume 20 ml). After application of the sample and washing with 1 I of the above buffer, the two columns were separated. The lentil-lectin column was eluted with 100 mM methyl-alpha-n-mannopyranoside, the WGA column with 200 mM N-acetyl glucosamine in the same buffer. No biological activity was found in the flowthrough of both columns or in the lentil-lectin eluate. The WGA eluate containing all the biological activity was concentrated by ultrafiltration (Amicon, PM 10), dialyzed against 50 mM (NH4hC0 3 , and lyophilized. It was then dissolved in PBS and chromatographed on a small Sephadex G25 column (10 ml) in PBS to remove traces of Nacetyl glucosamine, which were toxic in the bioassays.
VI. Characterization of Chicken Erythropoietin by High-pressure Liquid Chromatography (HPLC)
1. Reversed-phase HPLC
An aliquot of partially purified chicken EPO (250 III from a total of 5 ml) was adjusted to 100 mM Tris-HCI, pH 6.8, and applied to a C-3 column (Ultrapore, RPSC, Altex, 0.5 ml/min). The column was washed consecutively with HPLC-water and 0.1 % trifluoroacetic acid (TF A) in water (buffer A) and eluted with an acetonitrile gradient as follows: 10 min 0%-45% buffer B (75% acetonitrile in 0.1 % TF A), 60 min 45%-70% buffer B. Fractions (2 ml) were collected during the second phase of the gradient elution, lyophilized, and dissolved in DMEM for testing of their activity.
2. Size-exclusion HPLC
Another aliquot of partially purified EPO was adjusted to 100 mM sodium phosphate buffer, pH 6.8, and applied to two coupled
201
size-exclusion columns (pre-column, LKB TSK 4000, 0.7 cm in diameter, 10 cm long, plus two separation columns, LKB, TSK 3000, 0.7 cm in diameter, 60 cm long). Columns were eluted at 0.5 ml/min and fractions (1 ml, 2 min/fraction) were collected 40 min after injection. Fractions were diluted appropriately with DMEM before testing in both available EPO assays.
C. Results and Discussion
I. Assay Systems for Avian Erythroid Growth Factors Using ts-Oncogenetransformed Leukemic Erythroblasts
Previous work had shown that erythroblasts transformed by temperature-sensitive mu-
tants of v-erbB or v-sea required factors in anemic chicken serum for terminal differentiation in vitro after a shift to the nonpermissive temperature. Pilot experiments designed to test the usefulness of these cells in possible assay systems for erythroid growth factors quickly demonstrated that ts-sea erythroblasts were much more suitable for such assays than ts-erbB cells (probably because of the presence of v-erbA in the latter) [13]. In addition, it soon became evident that suitable test-cell clones had to be selected, exhibiting the potential for complete in vitro differentiation as well as an extended in vitro lifespan [1] (see Materials and Methods).
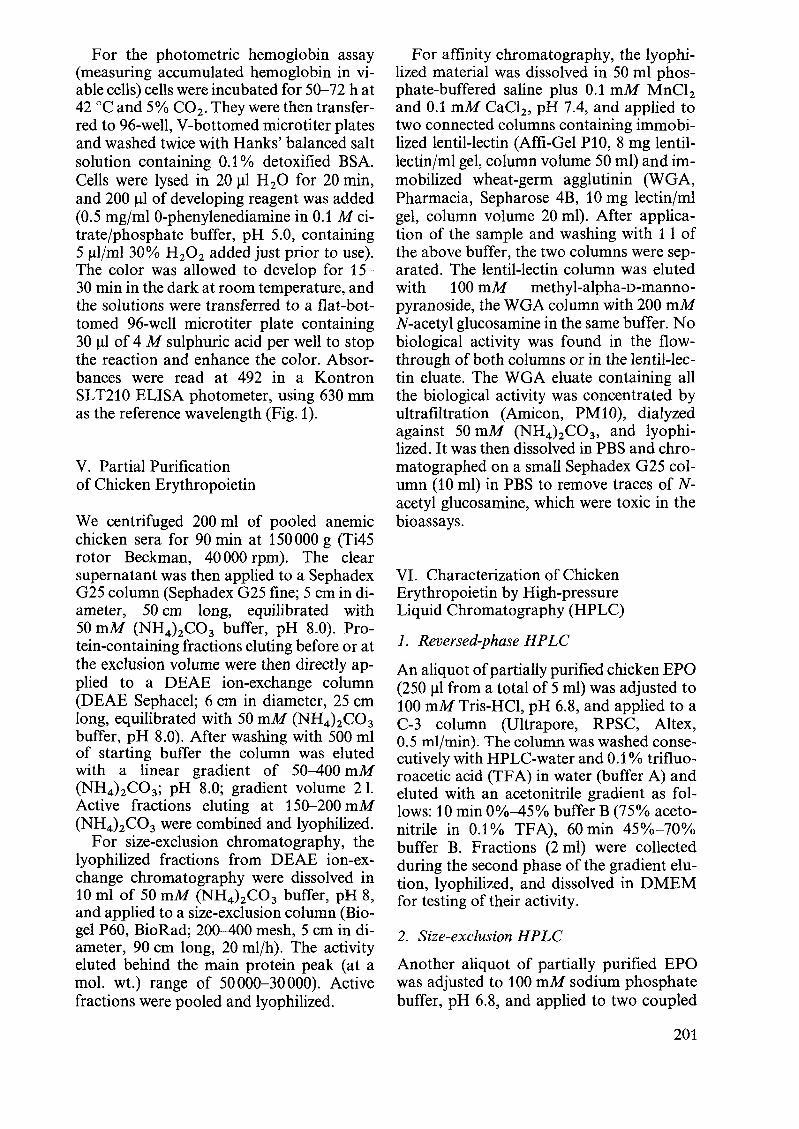
Investigation of the differentiation behavior of such a selected ts-S13 erythroblast clone (clone 30) after shift to 42 °C with and
30h ,420 47h 4ZO
plus anemiC serum
minus anemic serum
- . - - --- . . Fig.I. Differentiation of Is-S13 erythroblasts in the presence and absence of anemic serum. Is-S13 erythroblasts (clone 30) were incubated at 420 in differentiation medium plus or minus anemic serum. At the times indicated, aliquots were cy-
202
tocentrifuged onto slides, stained with neutral benzidine plus histological dyes, and photographed under blue light (480 Jlm) to reveal histochemical hemoglobin staining [1]. Arrowheads indicate lysed and moribund cells
ts 513 erythroblasts
/' "" U W + EPO - EPO
~ Incorporate I I --+ 3H-thymidine; ~ harvest on filters;
~
~ count
~
~ Wash cells;
:,(§l,., --+ lyse in aq bidest; ·:j,:·i_~;;. determine hemoglobin
photometrical! y
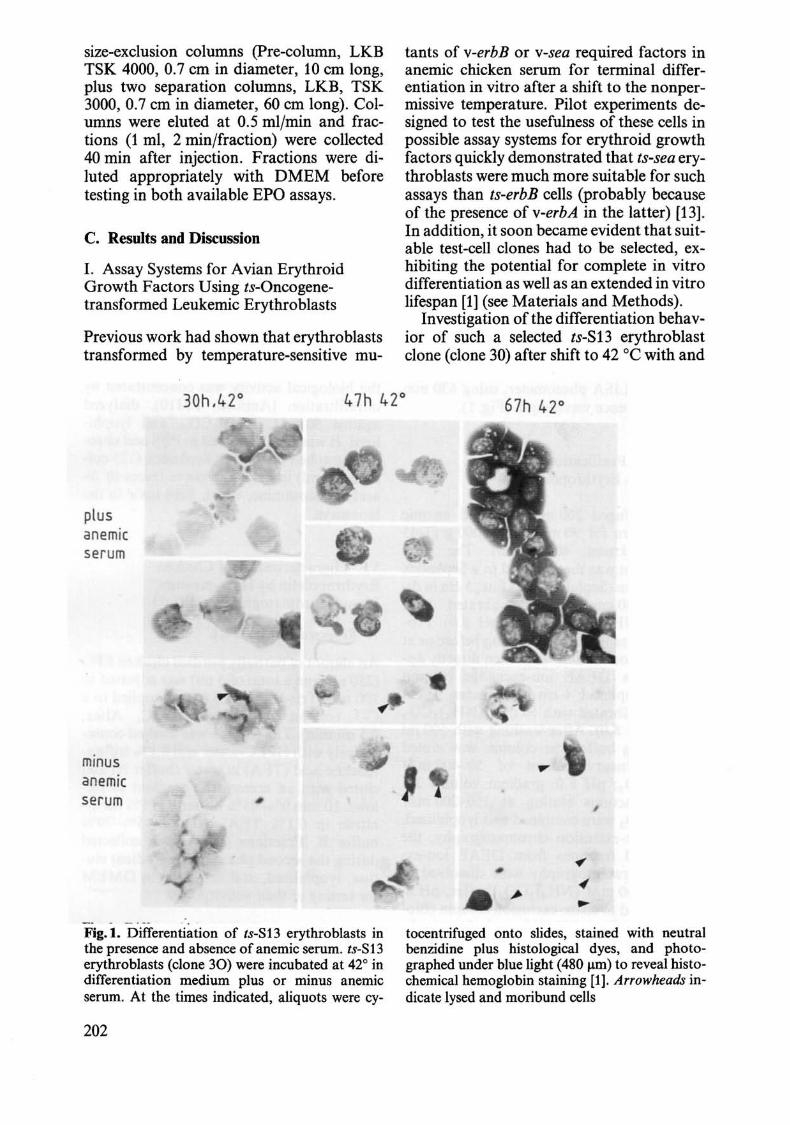
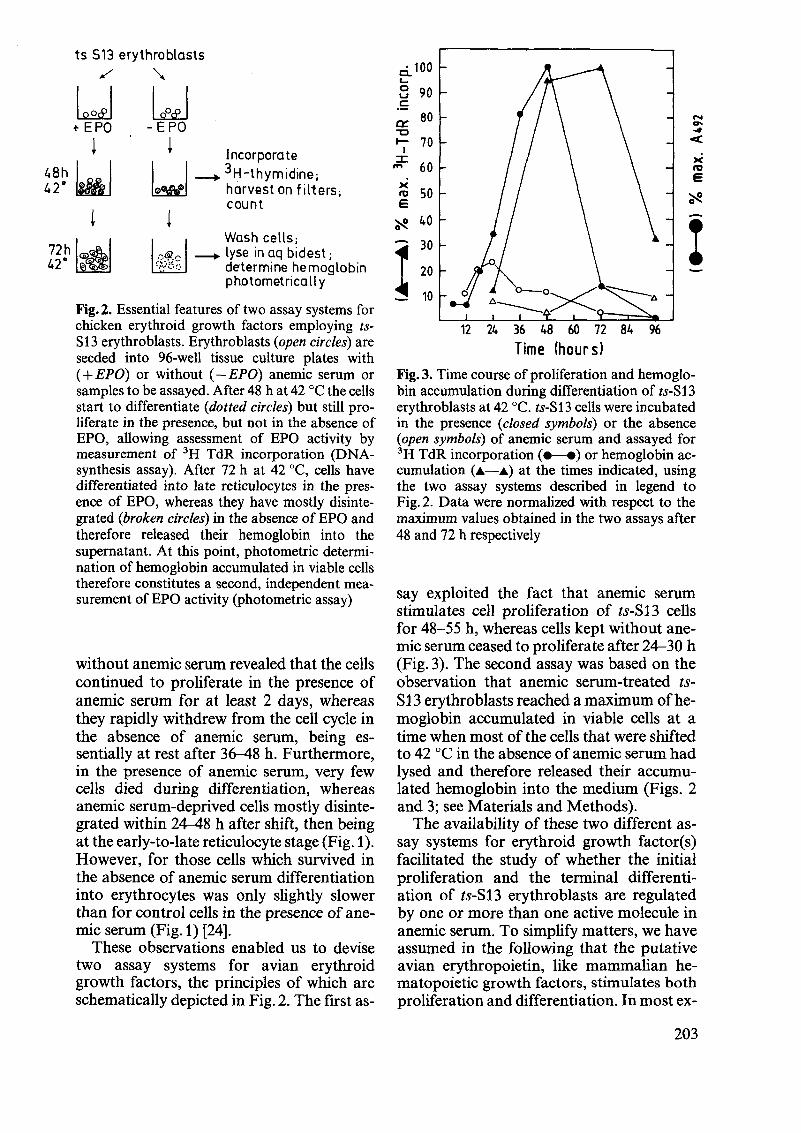
Fig.2. Essential features of two assay systems for chicken erythroid growth factors employing tsS13 erythroblasts. Erythroblasts (open circles) are seeded into 96-well tissue culture plates with ( + EPO) or without (-EPO) anemic serum or samples to be assayed. After 48 hat 42 DC the cells start to differentiate (dotted circles) but still proliferate in the presence, but not in the absence of EPO, allowing assessment of EPO activity by measurement of 3H TdR incorporation (DNAsynthesis assay). After 72 h at 42 DC, cells have differentiated into late reticulocytes in the presence of EPO, whereas they have mostly disintegrated (broken circles) in the absence of EPO and therefore released their hemoglobin into the supernatant. At this point, photometric determination of hemoglobin accumulated in viable cells therefore constitutes a second, independent measurement of EPO activity (photometric assay)
without anemic serum revealed that the cells continued to proliferate in the presence of anemic serum for at least 2 days, whereas they rapidly withdrew from the cell cycle in the absence of anemic serum, being essentially at rest after 3~8 h. Furthermore, in the presence of anemic serum, very few cells died during differentiation, whereas anemic serum-deprived cells mostly disintegrated within 24-48 h after shift, then being at the early-to-Iate reticulocyte stage (Fig. 1). However, for those cells which survived in the absence of anemic serum differentiation into erythrocytes was only slightly slower than for control cells in the presence of anemic serum (Fig. 1) [24].
These observations enabled us to devise two assay systems for avian erythroid growth factors, the principles of which are schematically depicted in Fig. 2. The first as-
ci.. 1 00 L-a 90 u .S: 0:: 80 '0 I- 70
I :r
60 ,.., )(
50 ro e ~ 40
1 30
20
10
12 24 36 48 60 72 84 96
Time (hours)
N .... -# c(
)(
ro e ~
I
Fig. 3. Time course of proliferation and hemoglobin accumulation during differentiation of ts-S13 erythroblasts at 42 DC. ts-S13 cells were incubated in the presence (closed symbols) or the absence (open symbols) of anemic serum and assayed for 3H TdR incorporation (e-e) or hemoglobin accumulation (.-.) at the times indicated, using the two assay systems described in legend to Fig.2. Data were normalized with respect to the maximum values obtained in the two assays after 48 and 72 h respectively
say exploited the fact that anemic serum stimulates cell proliferation of ts-S13 cells for 48-55 h, whereas cells kept without anemic serum ceased to proliferate after 24-30 h (Fig. 3). The second assay was based on the observation that anemic serum-treated IsS13 erythroblasts reached a maximum of hemoglobin accumulated in viable cells at a time when most of the cells that were shifted to 42 DC in the absence of anemic serum had lysed and therefore released their accumulated hemoglobin into the medium (Figs. 2 and 3; see Materials and Methods).
The availability of these two different assay systems for erythroid growth factor(s) facilitated the study of whether the initial proliferation and the terminal differentiation of ts-S13 erythroblasts are regulated by one or more than one active molecule in anemic serum. To simplify matters, we have assumed in the following that the putative avian erythropoietin, like mammalian hematopoietic growth factors, stimulates both proliferation and differentiation. In most ex-
203
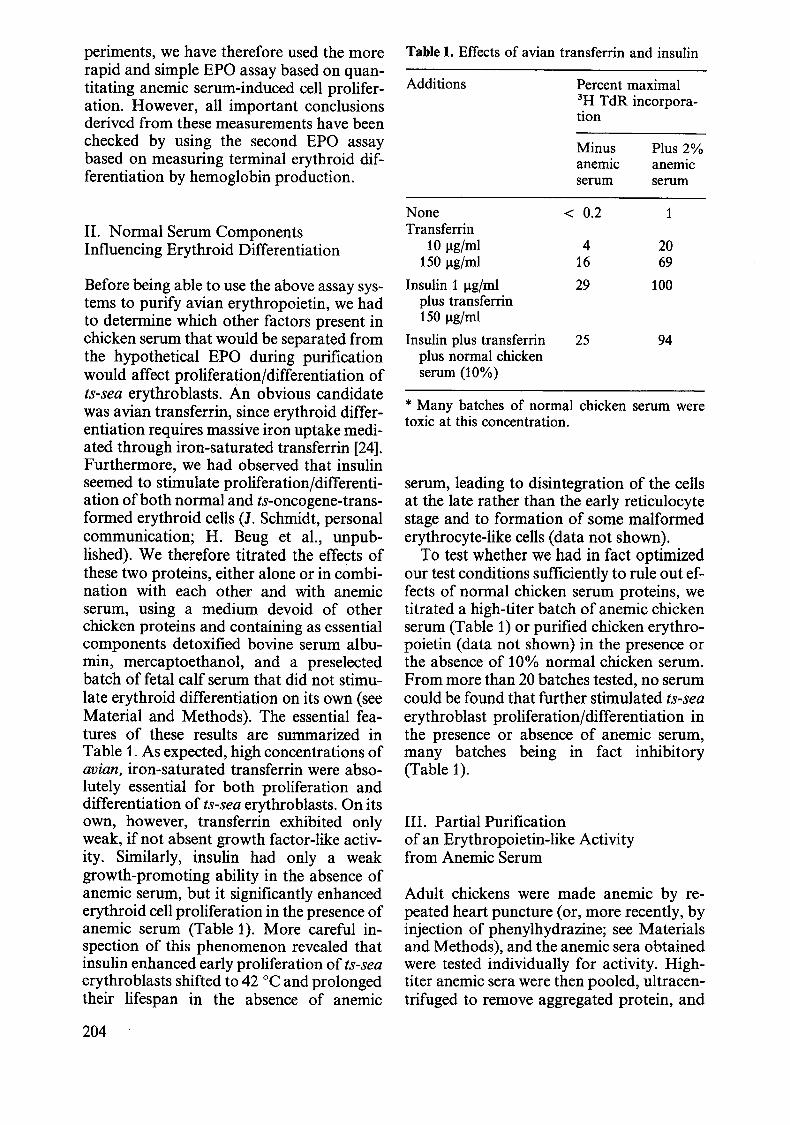
periments, we have therefore used the more Table 1. Effects of avian transferrin and insulin rapid and simple EPO assay based on quantitating anemic serum-induced cell proliferation. However, all important conclusions derived from these measurements have been checked by using the second EPO assay based on measuring terminal erythroid differentiation by hemoglobin production.
II. Normal Serum Components Influencing Erythroid Differentiation
Before being able to use the above assay systems to purify avian erythropoietin, we had to determine which other factors present in chicken serum that would be separated from the hypothetical EPO during purification would affect proliferation/differentiation of ts-sea erythroblasts. An obvious candidate was avian transferrin, since erythroid differentiation requires massive iron uptake mediated through iron-saturated transferrin [24]. Furthermore, we had observed that insulin seemed to stimulate proliferation/differentiation of both normal and ts-oncogene-transformed erythroid cells (J. Schmidt, personal communication; H. Beug et aI., unpublished). We therefore titrated the effects of these two proteins, either alone or in combination with each other and with anemic serum, using a medium devoid of other chicken proteins and containing as essential components detoxified bovine serum albumin, mercaptoethanol, and a preselected batch of fetal calf serum that did not stimulate erythroid differentiation on its own (see Material and Methods). The essential features of these results are summarized in Table 1. As expected, high concentrations of avian, iron-saturated transferrin were absolutely essential for both proliferation and differentiation of ts-sea erythroblasts. On its own, however, transferrin exhibited only weak, if not absent growth factor-like activity. Similarly, insulin had only a weak growth-promoting ability in the absence of anemic serum, but it significantly enhanced erythroid cell proliferation in the presence of anemic serum (Table 1). More careful inspection of this phenomenon revealed that insulin enhanced early proliferation of ts-sea erythroblasts shifted to 42°C and prolonged their lifespan in the absence of anemic
204
Additions Percent maximal 3H TdR incorpora-tion
Minus Plus 2% anemic anemic serum serum
None < 0.2 1 Transferrin
10 Jlg/ml 4 20 150 Jlg/ml 16 69
Insulin 1 Jlg/ml 29 100 plus transferrin 150 Jlg/ml
Insulin plus transferrin 25 94 plus normal chicken serum (10%)
* Many batches of normal chicken serum were toxic at this concentration.
serum, leading to disintegration of the cells at the late rather than the early reticulocyte stage and to formation of some malformed erythrocyte-like cells (data not shown).
To test whether we had in fact optimized our test conditions sufficiently to rule out effects of normal chicken serum proteins, we titrated a high-titer batch of anemic chicken serum (Table 1) or purified chicken erythropoietin (data not shown) in the presence or the absence of 10% normal chicken serum. From more than 20 batches tested, no serum could be found that further stimulated ts-sea erythroblast proliferation/differentiation in the presence or absence of anemic serum, many batches being in fact inhibitory (Table 1).
III. Partial Purification of an Erythropoietin-like Activity from Anemic Serum
Adult chickens were made anemic by repeated heart puncture (or, more recently, by injection of phenylhydrazine; see Materials and Methods), and the anemic sera obtained were tested individually for activity. Hightiter anemic sera were then pooled, ultracentrifuged to remove aggregated protein, and

E 1.0 c: r-I C1' -:I"
QJ u c: rtJ
..c 0.5 t-
o III
..c «
0.1 to Protein (mg/mll
Fig. 4. Partial purification of chicken erythropoietin. Unfractionated anemic serum (.) and pooled, active fractions after DEAE ion-exchange and size-exclusion chromatography (.) and after combined lentil- lectin-WGA affinity chromatography (_) were assayed for their biological activity by titration in the photometric EPO assay and plotted against protein concentration
consecutively subjected to DEAE ion-exchange chromatography, size-exclusion chromatography, and affinity chromatography on plant lectins (see Materials and Methods). The main difficulty in these experiments was substantial loss of EPO activity during the first steps of the purification procedure. This was probably due to proteases liberated by platelets during serum clotting (data not shown) and could be partially overcome by addition of protease inhibitors, rapid performance of the purification steps, and use of lyophilizable buffers for concentration of column fractions.
Figure 4 shows the result of a typical purification procedure. Starting with about 200 ml of anemic serum, the erythropoietinlike activity could be purified about 80-fold, recovering 25% of the original activity. The most effective purification step was the combination of lentil-lectin and wheat - germ -agglutinin affinity chromatography (see Materials and Methods). Most serum glycoproteins, but not EPO, bound to the first column, containing immobilized lentil lectin, whereas the EPO activity was effectively
bound to the second column, containing immobilized WGA, from which it could be eluted with N-acetyl glucosamine.
IV. EPO Activity in Anemic Serum Probably Due to a Single Glycoprotein of About 38 kd
The partial purification of chicken erythropoietin described above yielded enough activity to further characterize this avian erythroid growth factor by HPLC. Figure 5 a demonstrates that the activity eluted as a single sharp peak after separation ofthe partially purified EPO preparation of a reversed-phase HPLC column (see Materials and Methods). Figure 5 a also shows that reversed-phase HPLC resulted in a further 20-fold purification of chicken EPO without further significant losses of biological activity.
In a different approach, two aliquots of partially purified EPO were separated by size-exclusion HPLC in two separate experiments. Fractions from the first size-exclusion run were assayed by the photometric EPO assay, whereas those from the second run were assayed by the DNA-synthesis assay. Figure 5 b shows that the EPO activity again eluted as a single sharp peak at about 38 kd, regardless of whether ts-S13 erythroblast proliferation or differentiation was used to determine EPO activity. Furthermore, size-exclusion HPLC also resulted in a 20-fold further purification of chicken EPO.
Titration of the HPLC-purified EPO preparation on ts-sea erythroblasts together with unfractionated anemic serum demonstrated that the activity in the purified material was indistinguishable from the activity in anemic serum in both assay systems (Fig. 6a). Furthermore, the purified EPO allowed formation of healthy, mature erythrocytes to an even larger extent than anemic serum did (Fig. 6 b), indicating that a single, acidic glycoprotein of approximately 38 kd is responsible for the erythropoietin-like activity in anemic chicken serum. Finally, the purified EPO preparation stimulated the formation of normal erythroid colonies (CFU-E) from chick bone marrow at dilutions similar to those active on ts-S13 erythrob lasts (data not shown), further con-
205
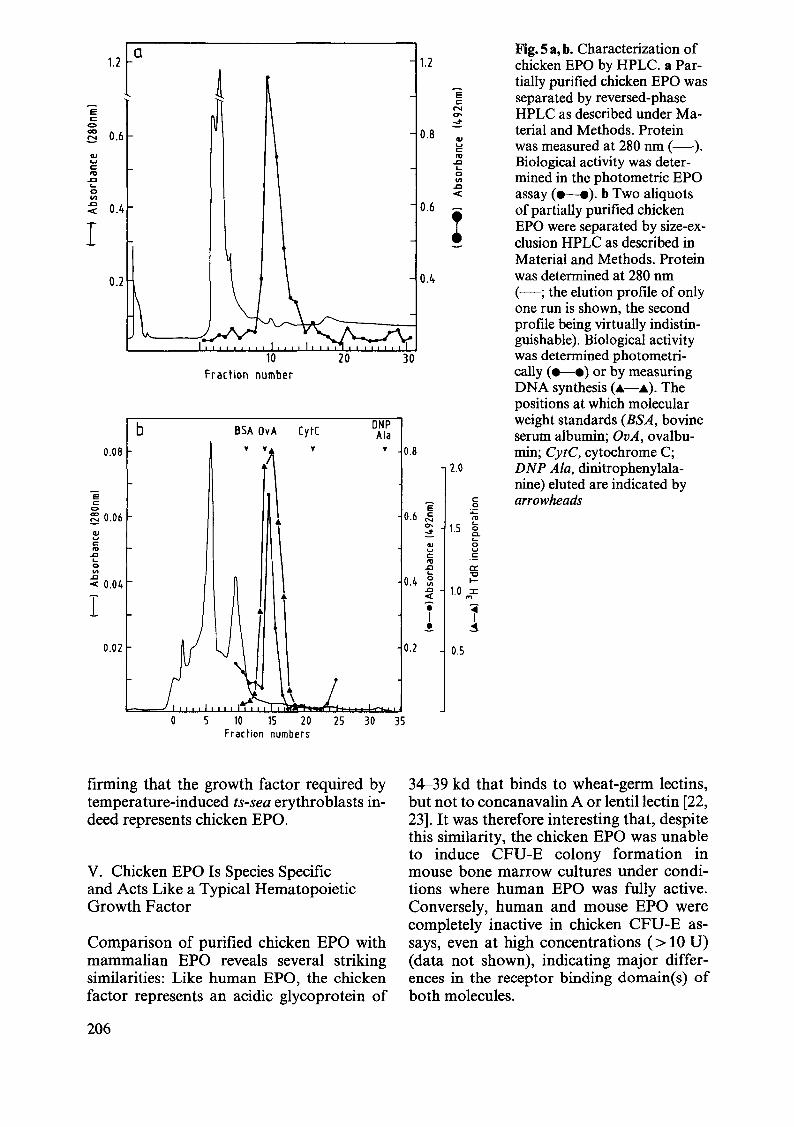
a Fig. 5 a, b. Characterization of 1.2 1.2 chicken EPO by HPLC. a Par-
tially purified chicken EPO was E separated by reversed-phase c:
E N HPLC as described under Ma-c: a-0 ~ terial and Methods. Protein co 0.6 0.8 .!:::! III .... was measured at 280 nm (-) . c: III "' Biological activity was deter-.... .Q c: c...
"' 0 mined in the photometric EPO .Q VI c... .Q
assay (.-.). b Two aliquots 0
"" VI .Q
0.4 0.6 of partially purified chicken "" I I EPO were separated by size-ex-clusion HPLC as described in Material and Methods. Protein
0.2 0.4 was determined at 280 nm (-; the elution profile of only one run is shown, the second profile being virtually indistin-guishable). Biological activity was determined photometri-
Fraction number cally (.-.) or by measuring DNA synthesis ( ... - ... ). The positions at which molecular
b BSA OvA [yt[ ONP weight standards (BSA, bovine Ala serum albumin; OvA, ovalbu-
0.08 ~
'\ ~ ~ 0.8 min; CytC, cytochrome C;
2.0 DNP Ala, dinitrophenylala-
E nine) eluted are indicated by
c: arrowheads c: E 0 C> :;: C; 0.06 0.6 ~ ", • 0- 1.5
...
\ 0
~ ::!. Cl. ... c: QJ 0 IV u u
..c c: .= ... ", 0 .J:I a:: VI L.. 't:J ..c 0.4 :;: I-"" 0.04 .J:I 1.0 :I:
I • « ,., .. "1 I ..! ~
0.02 0.2 0.5
15 20 25 30 35 Fraction numbers
firming that the growth factor required by temperature-induced ts-sea erythroblasts indeed represents chicken EPO.
V. Chicken EPO Is Species Specific and Acts Like a Typical Hematopoietic Growth Factor
Comparison of purified chicken EPO with mammalian EPO reveals several striking similarities: Like human EPO, the chicken factor represents an acidic glycoprotein of
206
34-39 kd that binds to wheat-germ lectins, but not to concanavalin A or lentil lectin [22, 23]. It was therefore interesting that, despite this similarity, the chicken EPO was unable to induce CFU-E colony formation in mouse bone marrow cultures under conditions where human EPO was fully active. Conversely, human and mouse EPO were completely inactive in chicken CFU-E assays, even at high concentrations (> 10 U) (data not shown), indicating major differences in the receptor binding domain( s) of both molecules.

E c:
1.0
~Q8 ~
~ 0.6 c: I"CI
..c ~ 0.4 VI
..c <C
0.2
a
ru W 10 1.0
::l n o
4~ o .., OJ ..... o ::l
2M "C 3 x ~
o I
~
Sample cone. (%) Sample cone. (%)
Fig. 6 a, b. Comparison of the biological activities of anemic serum and purified chicken erythropoietin. a Unfractionated anemic serum (A-A), purified EPO (after reversed-phase HPLC; e-.), and normal chicken serum (.--.) were titrated for biological activity by measuring hemoglobin accumulation (photometric assay, left panel) or 3H-TdR incorporation (DNA-synthesis
OUf studies using homogeneous, synchronously differentiating erythroid cells as targets for chicken EPO demonstrate, however, that chicken EPO acts like a typical hematopoietic growth factor, in that it is required for both survival and proliferation of hormone-dependent progenitor cells preprogrammed to undergo erythroid differentiation. In addition, the studies presented
assay, right panel). b Phase-contrast micrographs of ts-S13 erythroblasts kept for 3 days at 42°C in the presence (highest concentrations shown in a) of purified EPO (left panel), anemic serum (middle panel), or normal chicken serum (right panel) are shown. Note well-differentiated erythrocytes formed in purified EPO and anemic serum (arrows)
here help to resolve some ambiguities in the literature concerning avian EPO. Our finding that differentiating avian erythroid cells absolutely require high concentrations of avian Fe-transferrin explains why this molecule was claimed to represent an avian erythroid growth factor in a nonoptimized test system [5]. For the same reason, the possibility cannot be excluded that an EPO-like ac-
207

tivity of 60 kd found in anemic serum [20] represents transferrin, or more probably a mixture of this molecule with avian EPO.
Finally, our assay systems made it possible to demonstrate that avian erythroid progenitors respond to other growth-promoting factors than EPO. First, insulin cooperates with avian EPO, probably by lowering the concentration of EPO required for promoting growth/differentiation of ts-oncogenetransformed erythroblasts (Beug et aI., unpublished). A similar cooperativity of insulin with growth factors was reported for PDOF [18] and IOFII [14] and has also been observed for cMOF, an avian growth factor active on myelomonocyte progenitors [15] (A. Leutz and H. Beug, unpublished). In addition, we have recently identified an erythroid growth factor secreted by avian leukemic pre-B, pre-T cells (REVT-Iymphoblasts; [1] that stimulates early proliferation of ts-sea erythroblasts and promotes terminal erythroid differentiation only in the presence of low concentrations of chicken EPO (A. Leutz and H. Beug, unpublished).
---. - D. Conclusions
In this paper we have shown that ts-oncogene-transformed erythroleukemic cells can be successfully used to assay, purify, and characterize avian erythroid growth factors. Although these erythroid leukemic cells appear to be completely growth-factor independent at the permissive temperature, when the oncogene is fully active, they become dependent for survival, growth, and differentiation on specific erythroid growth factors as soon as the oncogene product is temperature inactivated. Our studies also clearly show that chicken EPO does not induce or modulate the erythroid differentiation program, but rather controls the cell's ability to undergo a series of preprogrammed differentiation events. Since no growth factor detectable in the two assay systems described or in CFU-E assays is secreted by the leukemic cells [2, 3], the oncogene seems to induce factor independence by an intrinsic mechanism, for instance by producing a constitutive signal normally generated by the EPO receptor after ligand binding [4].
208
Although it appears difficult at present to achieve a complete purification of chicken EPO, due to the limited availability of anemic chicken serum, purification of other erythroid growth factors secreted by cell lines is currently underway, using the assay systems described. In the long run, we hope to identify the respective growth factor receptors in order to be able to study how tyrosine kinase oncogenes such as v-erbB or v-sea can bypass signaling pathways employed by erythroid-specific growth factor receptors, with the outcome of fatal leukemia.
References
1. Beug H, Palmieri S, Freudenstein C, Zentgraf H, GrafT (1982) Hormone-dependent terminal differentiation in vitro of chicken erythroleukemia cells transformed by ts mutants of avian erythroblastosis virus. Cell 28:907-919
2. Beug H, Hayman MJ, Graf T, Benedict SH, Wallbank AM, Vogt PK (1985) S13, a rapidly oncogenic replication-defective avian retrovirus. Virology 145:141-153
3. Beug H, Kahn P, Doederlein G, Hayman MJ, Graf T (1985) Characterization of hematopoietic cells transformed in vitro by AEV-H, an erbB-containing avian erythroblastosis virus. In: Neth R, Gallo R, Greaves M, Janka K (eds) Modern trends in human leukemia, VI. Springer, Berlin Heidelberg New York Tokyo, pp 290-297
4. Beug H, Kahn P, Vennstroem B, Hayman MJ, Graf T (1985) How do retroviral oncogenes induce transformation in avian erythroid cells? Proc R Soc London [BioI] 226:121-126
5. Coll J, Ingram VM (1981) Identification of ovotransferrin as a heme-, colony- and burststimulating factor in chick erythroid cell cultures. Exp Cell Res 131: 173-184
6. Cook WD, Metcalf D, Nicola N, Burgess A, Walker F (1985) Malignant transformation of a growth factor-dependent myeloid cell line by Abelson virus without evidence of an autocrine mechanism. Cell 41 :677-683
7. Frykberg L, Palmieri S, Beug H, GrafT, Hayman MJ, Vennstroem B (1983) Transforming capacities of avian erythroblastosis virus mutants deleted in the erbA or erbB oncogenes. Cell 32:227-238
8. Gazzolo L, Moscovici C, Moscovici MG, Samarut J (1979) Response of hemopoietic cells to avian acute leukemia viruses: effects on the differentiation of the target cells. Ce1116:627-638
9. Graf T, Ade N, Beug H (1978) Temperaturesensitive mutant of avian erythroblastosis virus suggests a block of differentiation as mechanism of leukaemogenesis. Nature 257:496-501
10. Graf T, Beug H (1978) Avian leukemia viruses: interaction with their target cells in vivo and in vitro. BBA Revs Cancer 516:269-299
11. Graf T, von Kirchbach A, Beug H (1981) Characterization of the hematopoietic target cells of AEV, MC29 and AMV avian leukemia viruses. Exp Cell Res 131:331-343
12. Kahn P, Adkins B, Beug H, Graf T (1984) Src- and fps-containing avian sarcoma viruses transform chicken erythroid cells. Proc Natl Acad Sci USA 81:7122-7126
13. Kahn P, Frykberg L, Brady C, Stanley IJ, Beug H, Vennstroem B, GrafT (1986) V-erbA cooperates with sarcoma oncogenes in leukemic cell transformation. Cell 45:349-356
14. King GL, Kahn CR (1981) Non-parallel evolution of metabolic and growth-promoting function of insulin. Nature 292:644--646
15. Leutz A, Beug H, GrafT (1984) Purification and characterization of cMGF, a novel chicken myelomonocytic growth factor. EMBO J 3:3191-3197
16. Nicola NA, Metcalf D (1984) Binding of the differentiation-inducer, granulocyte-colonystimulating factor to responsive but not unresponsive leukemia cell lines. Proc Nat! Acad Sci USA 81:3765-3769
17. Pierce JH, DiGiore PP, Aaronson SA, Potter M, Pumphrey J, Scott A, Ihle IN (1985) Neoplastic transformation of mast cells by Abelson-MuLV: abrogation of IL-3 depen-
dence by a nonautocrine mechanism. Cell 41:685-693
18. Petrides PE, Bohler P (1980) The mitogenic activity of insulin: an intrinsic property of the molecule. Biochem Biophys Res Commun 95:1138-1141
19. Radke K, Beug H, Kornfeld S, GrafT (1982) Transformation of both erythroid and myeloid cells by E26, an avian leukemia virus that contains the myb gene. Ce1131:643-653
20. Samarut J (1978) Isolation of an erythropoietic stimulating factor from the serum of anemic chicks. Exp Cell Res 115:123-126
21. Samarut J, Gazzolo L (1982) Target cells infected by avian erythroblastosis virus differentiate and become transformed. Cell 28:921-929
22. Spivak JL, Small D, Shaper JH, Hollenberg MD (1978) Use of immobilized lectin and other ligands for the partial purification of erythropoietin. Blood 52: 1178-1186
23. Spivak JL, Small D, Hollenberg MD (1977) Erythropoietin: isolation by affinity chromatography with lectin-agarose derivates. Proc Natl Acad Sci USA 74:4633-4635
24. Schmidt JA, Marshall J, Hayman MJ, Ponka P, Beug H (1986) Control of erythroid differentiation: possible role of the transferrin cycle. Cell 46:41-51
25. van Zant G, Goldwasser E (1984) Erythropoietin and its target cells. In: Guroff G (ed) Growth and maturation factors, vol 2. Wiley, New York
26. Walker F, Burgess A W (1985) Specific binding of radioiodinated granulocyte-macrophage colony stimulating factor to hematopoietic cells. EMBO J 4:933-939
209