ts04 - accelerating manufacturing productivity · months to 3 months, as part of company’s six...
TRANSCRIPT

Copyright © 2012 Rockwell Automation, Inc. All rights reserved.Rev 5058-CO900B
TS-04 Accelerating Manufacturing Productivity & Performance through Manufacturing Intelligence
Imtiaz Javeed Product Manager- Visualization & Information Software Suite

Copyright © 2012 Rockwell Automation, Inc. All rights reserved.
Scheduling• Production Planning
• Utilization / Capacity
• Capable to Promise
Planning & Logistics• Facility Systems
• Shipping
• Inventory Control
Maintenance• Equipment Monitoring
• Predictive / Preventive
• Scheduled / Unscheduled
Operator• Uptime
• Throughput / Cycle Time
• Quality
Manufacturing: Islands of Information
2
Plant Management• Profitability
• Utilization / Capacity
• Asset Utilization
• Energy
Each functional area of a plant generates data…
…This data is typically isolated creating “Islands of Information”

Copyright © 2012 Rockwell Automation, Inc. All rights reserved.
Manufacturing Landscape
3
Productivity
• Unplanned Downtime
• Equipment Efficiency / OEE
Quality & Operations
• Compliance Tracking
• Improved First Pass Quality /
Process Consistency
Network Convergence & Security
• Infrastructure Modernization
• Security & Anti-Virus / Anti-
Tampering Protection – Top
Floor to Shop Floor
Virtualization & Thin Clients
• Reduction in Physical Servers
• Shop Floor Thin Clients
Common Issues
• Manual Data Collection
• Data consistency /
Standardization
• Energy Usage / OptimizationAsset Management
• Preventative / Predictive
Maintenance
• Reduced MTTR

Copyright © 2012 Rockwell Automation, Inc. All rights reserved.
Maintenance
What is the maintenance
schedule?
Actual Scrap/Rejectsfrom OEE System
What is the reject
rate?
Actual Cycle Timefrom Control System
Average rate
during shift?
What is the production
plan?
Production Schedule Quality Data
What is the
quality?
What is target?
Order Management
Order = 900 units
10 minutes
scheduleddowntime
95%pass rate
5 rejectsper hour
132 units per
hour
150 units per
hour
Islands of Information: Founded on multiple sources of data
4
How many systems are currently needed to make a simple calculation…
“Can I produce 900 units this shift to fulfill a customer promise date?”
Will the
customer
order ship on
time?
Plant Management
105 * 95%
= 100
units
Capacity
=150
units
150 * 50/60
= 125 units132 * 50/60
= 110
units
110 – 5
= 105
units
Current Shift Production = 800 units
Time remaining = 1 hour
Target
=900
units
YES!
ERPProd
SchedCMMS LIMS
ControlSystem
OEESystem
Copyright © 2012 Rockwell Automation, Inc. All rights reserved.
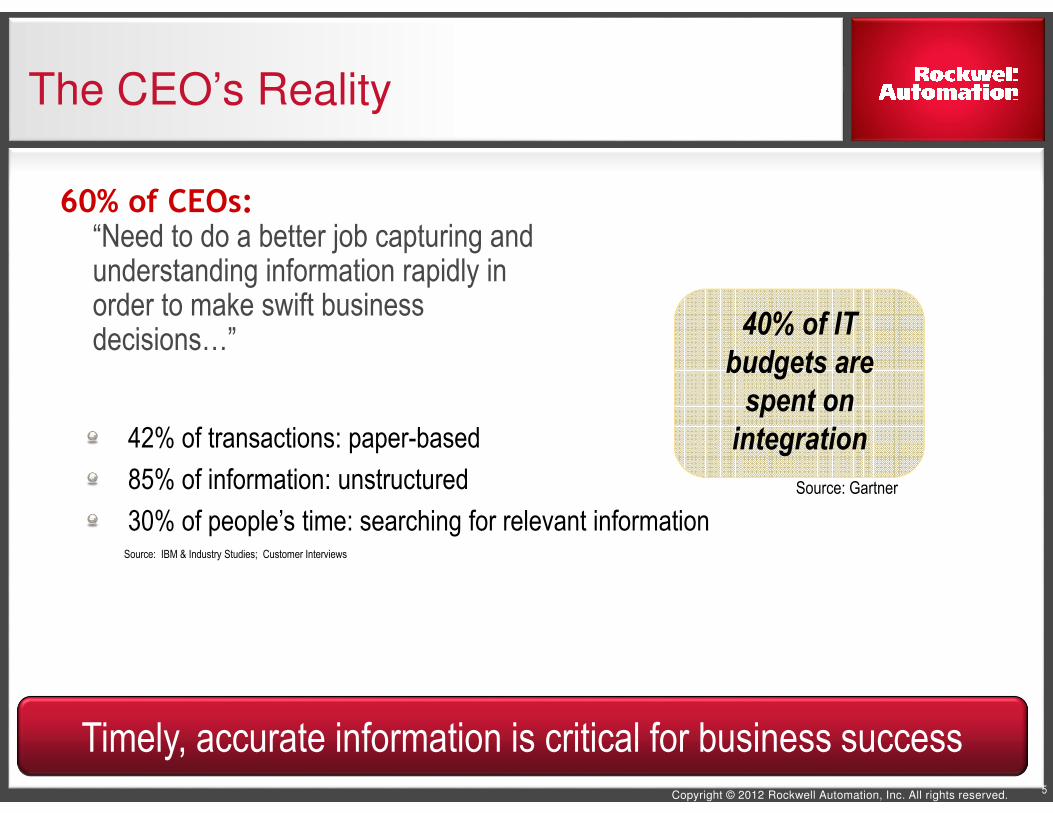
The CEO’s Reality
60% of CEOs:
“Need to do a better job capturing and understanding information rapidly in order to make swift business decisions…”
5
40% of IT
budgets are
spent on
integration
Source: IBM & Industry Studies; Customer Interviews
Source: Gartner
42% of transactions: paper-based
85% of information: unstructured
30% of people’s time: searching for relevant information
Timely, accurate information is critical for business success

Copyright © 2012 Rockwell Automation, Inc. All rights reserved.
A House Divided - a Universal Problem
6
1 98 1
981 38
199
8
1 981981 78
199
81 9
8 1981 88
199
8
1 981981 58
199
8
… the lack of adequate
1 98 1
981 98
199
8
?
?
??
?
Alarms &
Event History
Control
Systems HMI /
SCADA
HMI /
SCADA
Manufacturing Information Workers
Production
Historians
• Unique Reporting Tools
• Proprietary User Interfaces
• Different security measures
• Dissimilar data formats
• Diverse protocols

Copyright © 2012 Rockwell Automation, Inc. All rights reserved.
Reports/Visibility
Analytics
Current State: A Highly Fragmented ‘MESS’ in the Plants
The majority of plant floor systems are custom, stand-alone applications
Production Monitoring
Downtime Analysis
Production Counts
Constraint ID & Analysis
Schedule Execution/
Hit to Hit
Process Control Boards
Dock Inventory
Process Sheets
Manual Production Count
Cycle Time Analysis
Environmental Systems
Metrics (DTD, BTS)
Shipping
Container Track’g
Lot Tracking
Rack Tagging
Raw Mat Ordering & Inv
Dock Inventory
Schedule Optimization
Inventory Control
Line Side Replenishment
Part Consumption
Campaigns
Shipping – Error Proofing
External Metrics
Internal Metrics
Traceability
Error Proofing
Defect Tracking
SPC
Repair Bay OI
Quarantine
Scrap & Reject Reporting
Tool Monitoring
Predictive
Preventive
Crisis
Reliability & Maintenance
Downtime Analysis
Fluid Tracking
Programmable Dev Supp
Plant Design & Layout
Die Re-Chroming
Information Portal
Energy/Building Mgmt
Cost Management
Policy Deployment
Best Practice
Timekeeping
Metrics for Workforce
Issues Management
Production Log
Knowledge Management
Training
Birth History Sequencing
Logistics Quality Production Maintenance Management

Copyright © 2012 Rockwell Automation, Inc. All rights reserved.
Maintenance
What are my downtime
causes?
Production Manager
What are my bottlenecks?
8
Extending Automation Investments To Provide Operations Knowledge
Engineering
What is my equipment
utilization?
Plant Manager
What is my response time to a
new order?
Quality
What is my rejection rate?
Operations
How are we doing against
plan?
ERP
8

Copyright © 2012 Rockwell Automation, Inc. All rights reserved.Copyright © 2011 Rockwell Automation, Inc. All rights reserved. 9
How is data analyzed today?
Copyright © 2009 Rockwell Automation, Inc. All rights reserved. 9
Hmm… I have a
theory. I’ll need to find
someone who can
help me find the data I
need…
Historian Batch LIMS
The local ‘data expert’
uses their ‘inside
knowledge’ to
• connect Excel to
multiple data
sources…
• extract the relevant
data from the period
of interest…
• manually collate it together…
… and send the
result to the person
requesting the data.
… I don’t have time
for this… What
system is it in? How
do I access it?
Time…
Copyright © 2012 Rockwell Automation, Inc. All rights reserved.
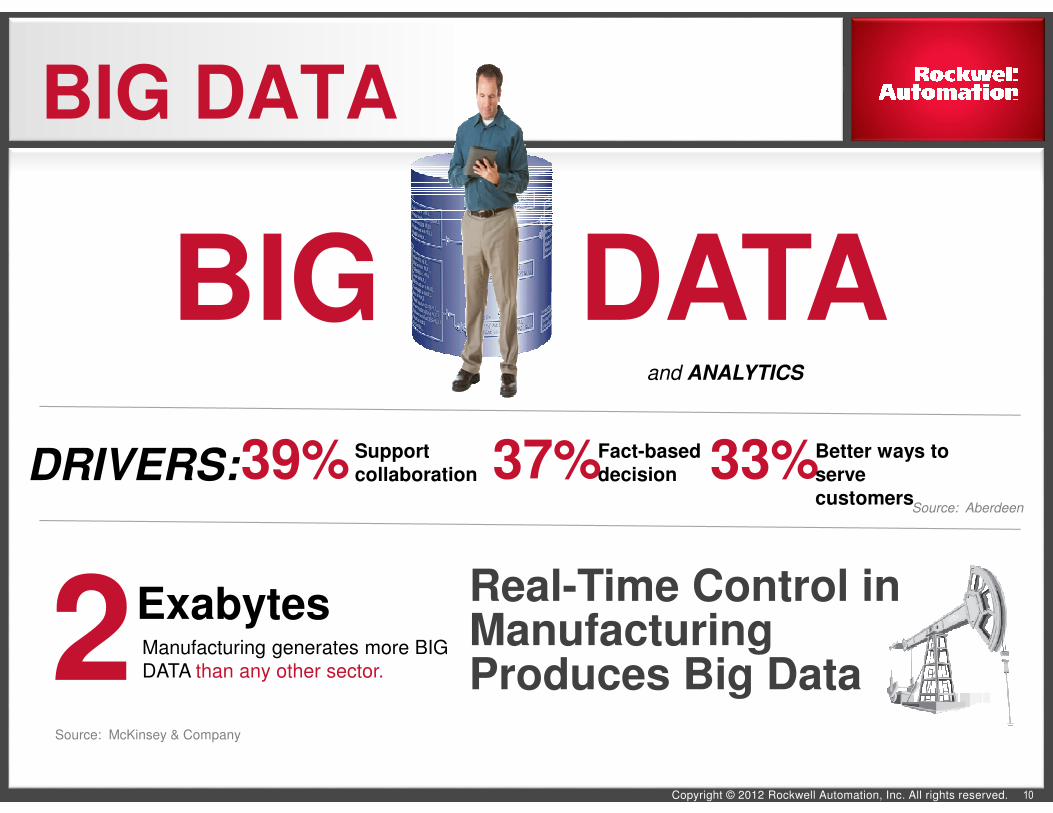
Source: McKinsey & Company
39% Support
collaboration
Source: Aberdeen
BIG DATAand ANALYTICS
DRIVERS: 37%Fact-based
decision 33%Better ways to
serve
customers
BIG DATA
10
Exabytes2Real-Time Control in Manufacturing Produces Big Data
Manufacturing generates more BIG
DATA than any other sector.

Copyright © 2012 Rockwell Automation, Inc. All rights reserved.
What is Manufacturing Intelligence ?
11
+ = IMPROVEDDecisionMaking
� Manufacturing Intelligence
� Software used to bring a corporation’s manufacturing data together from many
sources for the purpose of reporting, analysis, and visualization.
� As data is combined from multiple sources, it can be given context that will help
users find what they need regardless of where is came from.
� The primary goal is to turn data into real knowledge (information), and drive
business results based on that knowledge.
Source: Wikipedia http://en.wikipedia.org/wiki/Enterprise_manufacturing_intelligence
The Data Exists in Your Systems – Finding and Contextualizing is the key

Copyright © 2012 Rockwell Automation, Inc. All rights reserved.

Copyright © 2012 Rockwell Automation, Inc. All rights reserved.
Enterprise Manufacturing Intelligence Includes
13

Copyright © 2012 Rockwell Automation, Inc. All rights reserved.
Unified Production Model (UPM)
14
My Enterprise�
Chicago Plant
�
Line 1
Area 1�
Area 2
�
Tank ReportBatch TrendActual vs Target
Equipment�
Pump 001Uptime Dashboard
Pressure
�
Pump 002
�
�
Mixer 001�
Chicago
Dallas
Cleveland
TICHMI4n21
TICArea2_4n21
TICArea2Ext4n21
References data directly
at its source - “Single
Version of the Truth”
Maps data from multiple
sources into logical unitsPumps, Valves, etc.
Plants, Lines, Workcells, etc.Products, Ingredients, etc.
Combines relevant data from
multiple systems to present the
entire story !Control / Plant Floor
Operations / Production SchedulingMaintenance, Quality, etc.
Line
Cleveland Plant�
Reports�
Copyright © 2012 Rockwell Automation, Inc. All rights reserved.
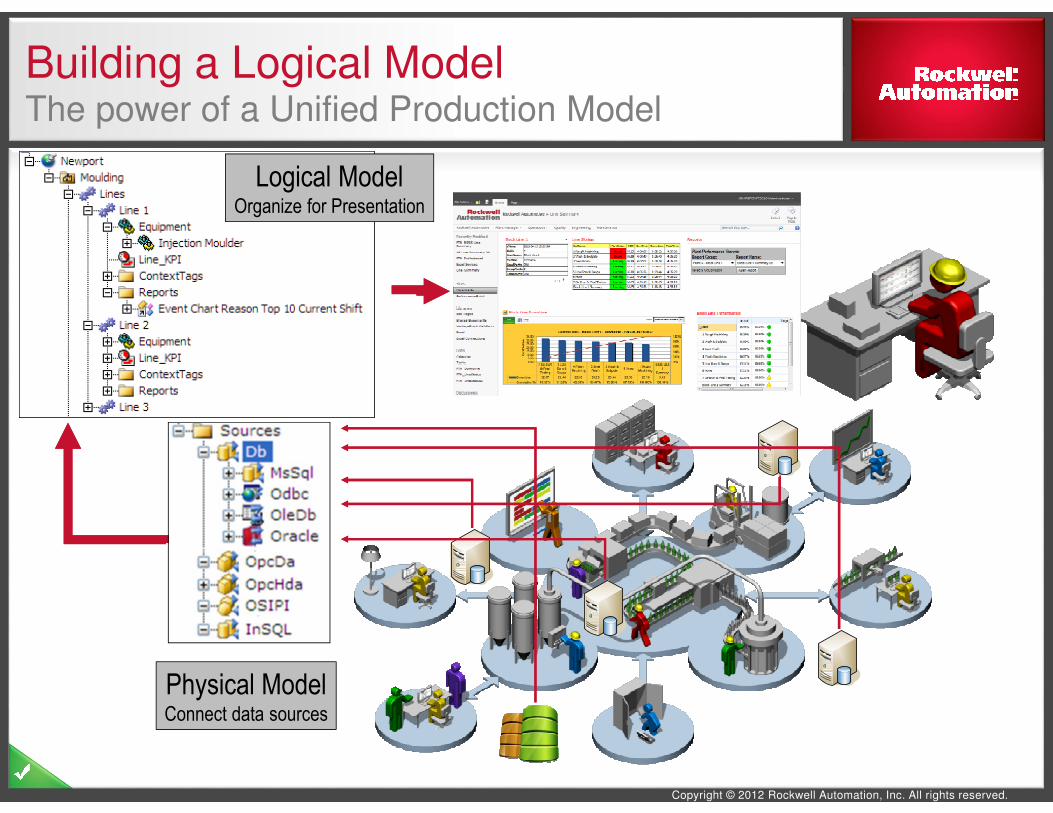
Building a Logical ModelThe power of a Unified Production Model
Physical ModelConnect data sources
Logical ModelOrganize for Presentation

Copyright © 2012 Rockwell Automation, Inc. All rights reserved.
Why is a Model Important?
� Organize the Model fit Your Needs
� Production Managers may want to see the logical
layout of the plant that matches the physical
equipment
� But Maintenance may want to see this in a way
that groups ALL like equipment together, they see
the SAME data, but can navigate to the
information differently.
� An Easy to Understand Model
� Individual Plant Areas May not use the same
terms or same systems
� Using a model can be a way everyone is using the
terms that make sense to them

Copyright © 2012 Rockwell Automation, Inc. All rights reserved.
For the Operators
� Monitoring process to keep production running
� Identifying relationships to optimize the process
Operator
For the Production Manager
� Schedule, track production activity
� Way production is running, ways to improve
Production
For the Engineering / Maintenance
Manger
� Keeping plant running
� Predicative maintenance, asset optimization
Engineering
For the Quality Manager
� How product was made, ensure compliance
� Ways to improve product and yield
Quality
For the Executive� Costs, schedules, production output
� Financial indicators, sustainability
Plant Mgmt.
Different Users, Different NeedsRole-based Reporting and Analytics The Right Information at the Right Level
Copyright © 2012 Rockwell Automation, Inc. All rights reserved.
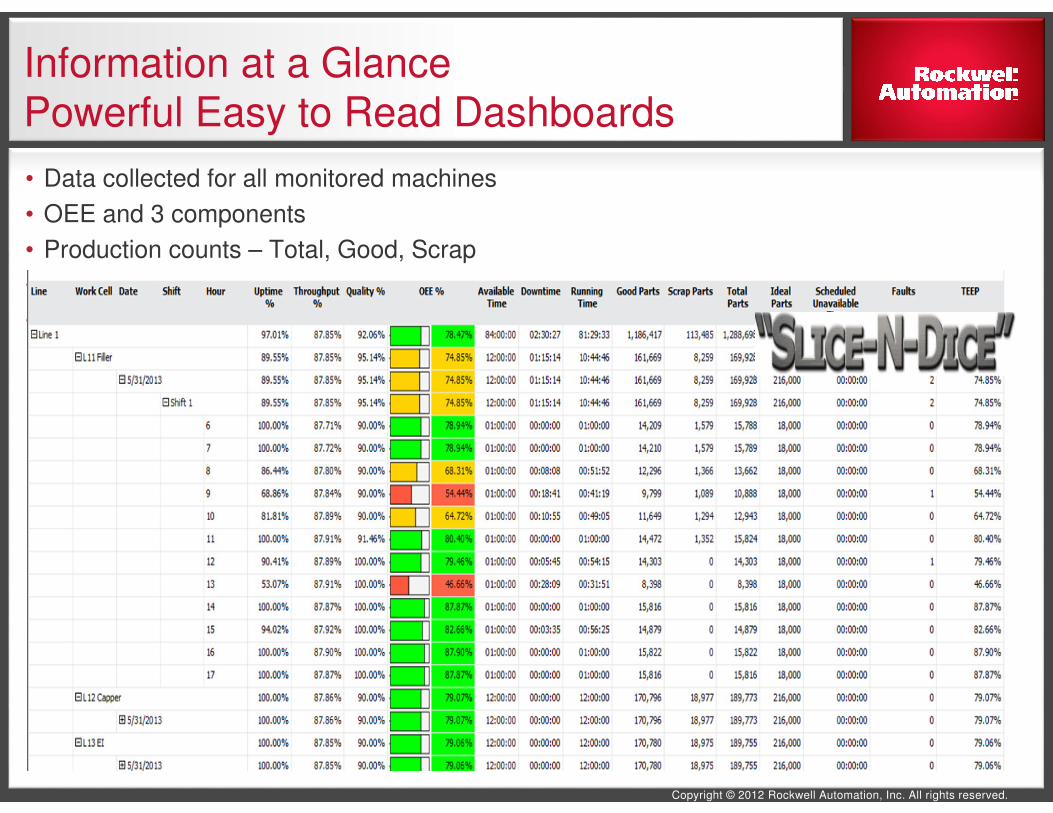
Information at a GlancePowerful Easy to Read Dashboards
• Data collected for all monitored machines
• OEE and 3 components
• Production counts – Total, Good, Scrap
• Available time, Downtime, Running time
• Slice and dice in up to 9 dimensions for reporting
• Date/time, Plant Model, Shift, Part, 5 user-defined

Copyright © 2012 Rockwell Automation, Inc. All rights reserved. 19
Mobile Capabilities

Copyright © 2012 Rockwell Automation, Inc. All rights reserved.
FactoryTalk® VantagePoint KPIAutomatically Display & Share KPIs!
20
� A native Windows 8.1 application that visually shows off your
FactoryTalk® VantagePoint® system in a simple but powerful way
� It uses KPIs (Key Performance Indicators) to focus your attention
� With your KPI’s you can:
� Visually represent your data as a gauge,
bar graph or indicator
� Collaborate by sending an e-mail with
instructions and attaching a KPI
� Drill down to more specific detail
� Leverage Live Tiles to provide continuous
updates by pinning a KPI on the Start page
� See a map view of your KPI’s based on
geographic location
Available for download from the Microsoft Store

Copyright © 2012 Rockwell Automation, Inc. All rights reserved.
FactoryTalk® VantagePoint EMI MobilityProviding Information When and Where you need It
21
� Mobile Landing Page
� Responsive User Interface
� Support for all major mobile platforms (iOS, Android)
� Mobile Model Browser
� Mobile Favorites – personalized, available on any device
� Ad Hoc dashboard or trend creation
� Mobile Content
� Excel Reports, Advanced Reports
� Trend, XY Plot charts
� New Composer – Drag and Drop Dashboard Creation
� Mobile First Design – Optimized for your browsing
experience

Copyright © 2012 Rockwell Automation, Inc. All rights reserved.
ComposerCreate Displays Quickly and Easily
22
� Create new displays on a Tablet or PC Device
� Drag and Drop Canvas for Display Creation
� Library of Widgets (Gauges, Indicators, Trends, Text)
� Save displays as favorites
� Simplified single click functionality for display creation from mobile phones

Copyright © 2012 Rockwell Automation, Inc. All rights reserved.
Why FactoryTalk VantagePoint?Trend Anywhere – PC, HMI, Tablet, or Phone
23
� Create Trend templates for re-use
or ad-hoc trends to analyze
impromptu situations
� Publish trends for sharing /
collaborating with others
� Diagnose and analyze data from
any connected data source
� Powerful trend functionality – Pan,
zoom, stack and synchronize
� Display multiple time period at the
same time to determine batch
variations

Copyright © 2012 Rockwell Automation, Inc. All rights reserved.
Cycle Time, Loading & Unloading Time & SPC Reports
(Conf24
Load & unloading time trends

Copyright © 2012 Rockwell Automation, Inc. All rights reserved.
Leading Automotive SupplierAutomated Data Collection and Reporting Boosts Productivity
• Increased OEE and productivity by 50 percent, helping
the facility execute more than 11.5 million data collection
transactions per day to monitor inventory, production,
budget, equipment operation and more
• Reduced project development time by 50 percent, from 6
months to 3 months, as part of company’s Six Sigma
process
• Eliminated the time associated with manual paperwork
• Needed flexibility to adjust production
volume at any time to meet customer
demands
• Faced ongoing pressures to reduce
downtime and boost productivity
• Needed an automated data collection and
reporting system to replace current manual
system
Tier 1 automotive supplier cuts development time, increases efficiency and eliminates paperwork
• Collect manufacturing performance data with
FactoryTalk® Metrics and use that data to improve processes and
generate production reports
• Execute more than 11.5 million data collection transactions per day
to monitor inventory, production, budget and more
• Oversee maintenance activities through
FactoryTalk AssetCentre
• Achieve real-time data reporting through
Allen-Bradley® PanelView™ and FactoryTalk View software
RESULTS
CHALLENGE SOLUTION
25
Copyright © 2012 Rockwell Automation, Inc. All rights reserved.
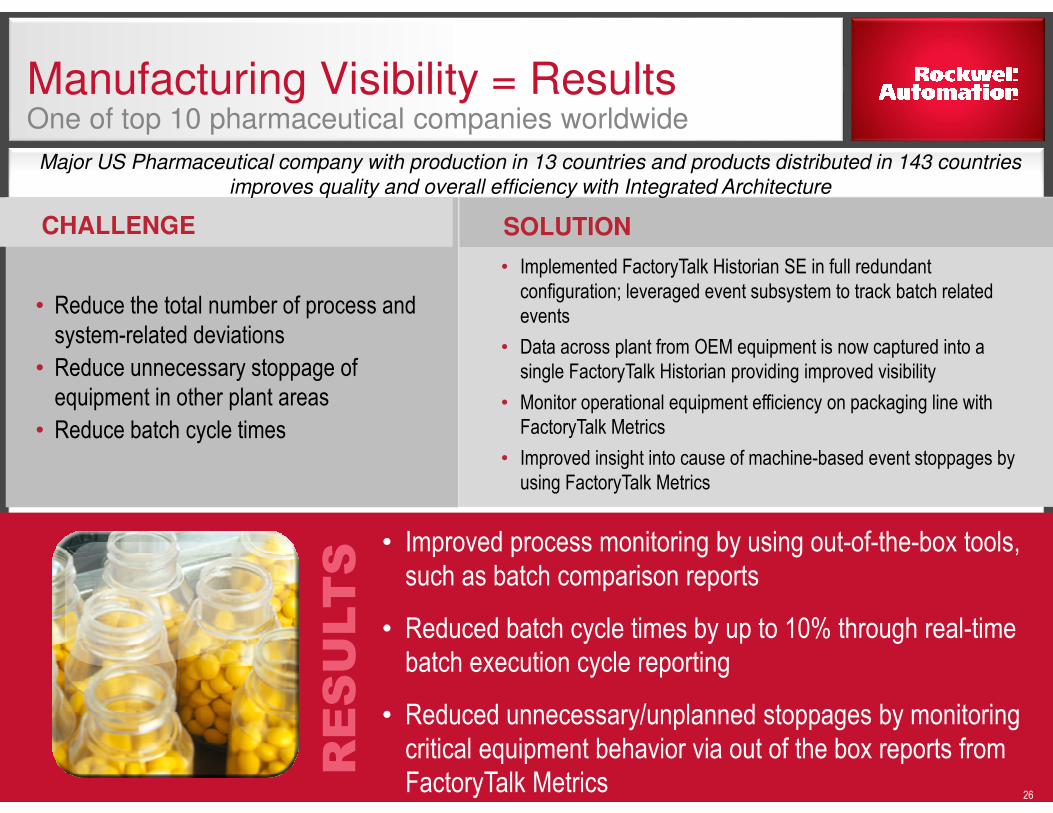
Manufacturing Visibility = ResultsOne of top 10 pharmaceutical companies worldwide
26
• Improved process monitoring by using out-of-the-box tools,
such as batch comparison reports
• Reduced batch cycle times by up to 10% through real-time
batch execution cycle reporting
• Reduced unnecessary/unplanned stoppages by monitoring
critical equipment behavior via out of the box reports from
FactoryTalk Metrics
• Reduce the total number of process and
system-related deviations
• Reduce unnecessary stoppage of
equipment in other plant areas
• Reduce batch cycle times
Major US Pharmaceutical company with production in 13 countries and products distributed in 143 countries
improves quality and overall efficiency with Integrated Architecture
• Implemented FactoryTalk Historian SE in full redundant
configuration; leveraged event subsystem to track batch related
events
• Data across plant from OEM equipment is now captured into a
single FactoryTalk Historian providing improved visibility
• Monitor operational equipment efficiency on packaging line with
FactoryTalk Metrics
• Improved insight into cause of machine-based event stoppages by
using FactoryTalk Metrics
RESULTS
CHALLENGE SOLUTION

Copyright © 2012 Rockwell Automation, Inc. All rights reserved.
CHALLENGE SOLUTION
Case Study – Energy Intelligence Global Automotive Manufacturer
• Validated energy consumption data to participate in government energy rebate program
• Reduced energy usage by 15%
• Reduce energy consumption per vehicle
produced
• Affirm energy usage data is collected and
accurate for Plant
• Simplify reporting of energy consumption
Customer turned to Rockwell Automation to help them reduce energy usage
• Utilized FactoryTalk® VantagePoint, Historian,
AssetCentre, and ControlLogix® to collect and visualize
information from the production floor
• Implemented a real-time tracking and monitoring system for
gas, steam and electric usage (WAGES)
RESULTS

Copyright © 2012 Rockwell Automation, Inc. All rights reserved.
Discover Manufacturing Intelligencehttp://discover.rockwellautomation.com/mi
28
Copyright © 2012 Rockwell Automation, Inc. All rights reserved.
www.rockwellautomation.com
Follow ROKAutomation on Facebook & Twitter.
Connect with us on LinkedIn.
Rev 5058-CO900B
Thank you for participating!
Your feedback is valuable! Please complete the session survey.
E-Mail us – [email protected]