tso series transmission system operation glen boyle, sr
TRANSCRIPT

Disclaimer
• This training presentation is provided as a reference for preparing for the PJM Certification Exam.
• Note that the following information may not reflect current PJM rules and operating procedures.
• For current training material, please visit: http://pjm.com/training/training-material.aspx
PJM©2014

PJM©2011 www.pjm.com 1 PJM ©2011 www.pjm.com 1
Interconnection Training Program
PJM State & Member Training Dept.
Transmission System Operations
TO1

PJM©2011 www.pjm.com 2
Agenda
• 6 modules
– Basic Theory
– Reliability, Limits, Failures
– Contingency Analysis
– Out of Merit Dispatch
– Voltage and Voltage Adjustment
– Outage Scheduling

PJM©2011 www.pjm.com 3
Agenda
• Methods of Instruction
– Presentation
– Class discussion
– Exercises
– Operator Training Simulator Demonstrations
– EPRI OTS PC Simulation
– PowerWorld Simulator Demonstrations
– Videos?
– Quizzes • 3 quizzes

PJM©2011 www.pjm.com 4
Agenda
• Purpose and Function of the Transmission System
– TO1-1
• System Voltage and VAR Characteristics
– TO1-2
• Distribution and Generation Shift Factors
– TO1-3

PJM©2011 www.pjm.com 5
Module Objectives
• Review the purpose and function of the transmission system.
• Review basic system voltage and VAR characteristics
• Demonstrate basic distribution factor theory.
• Determine power flows utilizing system distribution factors and generation shift factors
• Introduce the concept of $/MW effect.

PJM©2011 www.pjm.com 6
Transmission System Fundamentals TO1-1

PJM©2011 www.pjm.com 7
Module Objectives
• List the purpose and functions of the transmission system.
• Distinguish between the transmission system, the sub-transmission system and the distribution system.
• Given a simple one-line diagram, identify the major features of the PJM transmission system including:
– Lines, buses, and generating stations

PJM©2011 www.pjm.com 8
Purpose and Function of the Transmission System
• Coordinated Operation
– Single system
– Part of the Eastern Interconnection
• Reliability
• Economy
– No transmission = Distributed Generation • $$$$

PJM©2011 www.pjm.com 9
PJM & PJM West 500 kV Breaker DiagramDate11/13/2002
DescriptionLayout of APS system with PJM
LayoutE.D. Colodonato
Checked
Created in Visio. All revisions should be made in Visio then copied to PPT Visio : DOC#146099 Power Point : DOC#191687
12B
12C
11B
11C
11A
10B
10C
56
Chalk Point
5070 5071
to Possum Point
Burches
Hill
23
21
22
41
43
63
61
Calvert Cliffs
62
1
2
H
B
G
A
Waugh Chapel
3
1
2
BLACK
RED
5072
5051
7AB
7BB 6BB
6AB 5AB
5BB
Brighton
5055
1
2
L
M
H
J
K A
C
3
2
Conastone
5011
N
35
45
65
55
25 235
245
1
Peach Bottom
5012
20515
215
225
23
501
505
503
504
Keeney
51
50
5053
115
315 325
125 135
335
Limerick
225 225
2
345
355
4A
4B
5010
475
185 285
575 675
385
Whitpain
1 2 3
5030
5031
505
503502
50
5036
Red Lion
1-5
2-6 2-8
1-7 1-9
2-5
New Freedom
5-6 7-8
1
2
2 3 4
1-3
1-5
2-6
Hope Creek
3-4
1
2
5-6
15015
2-10
1-9
1-8
2-8 2-6
1-5
Salem
9-10 5-6
2
1
2 1
5037
1-3
2-3 2-5
1-5 1-7
2-7
Deans1
2
1 2 3
5021
East Windsor
T1
Smithburg
5024
5020
145
475 175
138 kV
1
1TRHS
Elroy
5028
5029
5017
5023
3-4
2
2-3
1-2
1
1-6
5-6
4-5
5019
ALS
ELN
ELS
Hosensack
5044
N
S
500702
500802 502602
TMI4
8
070802 502612
1
2
1
5007
5008
CON
TMI ALB
KEY SUN N
CON
-TMI
Juniata
KEY-
ALBSUN S
4A
4B
N
S
5046
Sunbury
5045
SUN N
SUN S
SQ2 N WES N
WES S
Susquehanna
SQ2 S
2
N
S
5043
WES W WES E
B W B E
JUN JUN-
HOS
HOS
EW
1
5027
138kV
3
Wescosville
Alburtis
5018
to Ramapo
Branchburg
5004
5005
5052
5026
5009
5016
5014
21
N S
C182
145 MVAR
501382 B1-92
Hunterstown
5013
#1 bank
832/985 MVA
Fall 2001 Jan 2003
Spring 2002 Jan 2003 Jan 2003
CT1 CT2 CT3 ST1
165
MW
165
MW
165
MW
335
MW
14 2
1
2
16
1 3
4 5 6
8 9
21
5003
Keystone
5002
43
5001
5006
1
2
1
2 3
4 5
6 7 8
Conemaugh
21
Bedington
Doubs
Meadow Brook
Black Oak
Hatfield
Pruntytown
Fort Martin
Cabot
Yukon
Wylie Ridge
Harrison
to Kammer
(AEP)
Belmont
Pleasants
54 51 55
53 52
5956
50
BA
1 3 4 2
to Loudoun
1
3
2
1
2
34
7
8
2
3
520
544
512 514
3
1
9
7
A
B
2
3
3
2
3
1 4
6 9
7
2
1
2 5 8
1 2 3
542
518
South Bend
1
507
513
2 3
5001513
1
6
2
1
2 5
1
2
4
524
532
4 1
N
S
5 2
5
7
530
3
5
1
2
7
8
9
4
1
2
502
508
516
1 2 3
1 2
4 5 6
4
to Mt. Storm
510
526
1
3
4
2
64 13
Fayette
10
12
7 4
6
N
S
11 8 5
1
3
2
3 2 1
502
528
530
530
3
2
6
5
3 42
to Mt. Storm to Mt. Stormto Morrisville
572 580
7 9
10
12
5 6
2 3
5 765/500 kV
2 31
200
765/500 kV
to Mountianeer
765 kV
500 kV
New Construction
transfomer
breaker
generator
capacitor
KEY
PJM West PJM
PJM West PJM
501
Steel City
51
3
1
2
2

PJM©2011 www.pjm.com 10

PJM©2011 www.pjm.com 11

PJM©2011 www.pjm.com 12
http://www.pjm.com/documents/maps.html

PJM©2011 www.pjm.com 13
Transmission Paths (Bulk Transmission)
• Purpose
– Transfer bulk power from a generation source to load centers reliably and economically
• Typical Path lengths
– Range from 1/2 mile to 180 miles in Eastern U.S. • PJM longest Dumont-Marysville 765 kv (AEP) 180 miles
• PJM shortest 5037 Hope Creek - Salem <1 Mile
– Longer in Western U.S.
– For EHV, longer path lengths is more economical

PJM©2011 www.pjm.com 14
Transmission Paths (Bulk Transmission)
• Typical voltage values
– Transmission is generally characterized by high voltage values • 69 kV - lowest voltage considered transmission
• 765 kV - Highest voltage level used in U.S.
– Different definitions depending on company
– Above 230 Kv considered EHV

PJM©2011 www.pjm.com 15
Bulk Electric System (BES)
ReliabilityFirst Corporation (RFC) adopted the definition of Bulk Electric System (BES) to include facilities 100kV and above
The new BES definition new includes facilities that used to be controlled by Member TOs
All NERC and Regional standards will apply to all BES facilities
PJM©2011 www.pjm.com 16
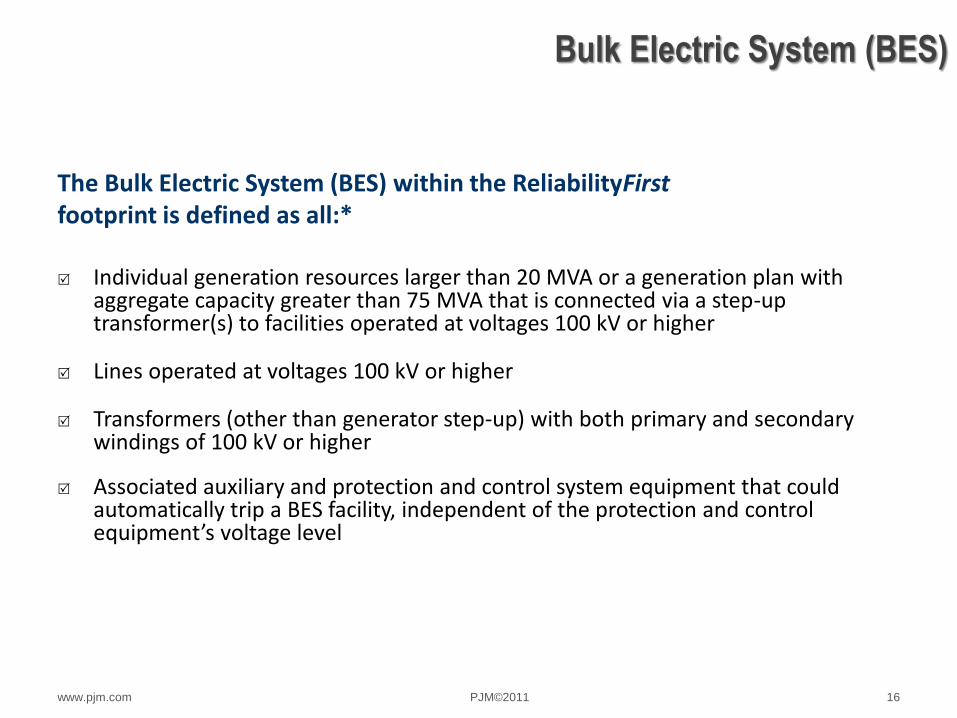
Bulk Electric System (BES)
The Bulk Electric System (BES) within the ReliabilityFirst footprint is defined as all:* Individual generation resources larger than 20 MVA or a generation plan with
aggregate capacity greater than 75 MVA that is connected via a step-up transformer(s) to facilities operated at voltages 100 kV or higher
Lines operated at voltages 100 kV or higher
Transformers (other than generator step-up) with both primary and secondary windings of 100 kV or higher
Associated auxiliary and protection and control system equipment that could automatically trip a BES facility, independent of the protection and control equipment’s voltage level

PJM©2011 www.pjm.com 17
Transmission Paths (Bulk Transmission)
Distribution Voltage Transmission Subtransmission
Primary Secondary
765 kV
500 kV
345 kV
230 kV
138 kV
115 kV
69 kV
34.5 kV
25 kV
14.4 kV
13.2 kV
12 kV
4 kV
480 V
120 V
Typical Voltage Values

PJM©2011 www.pjm.com 18
Transmission Paths (Bulk Transmission)
• Applications
– Backbone of the system • ties generation to load
– Used to connect companies
– Used to connect to outside pools
– Generally controlled by ISO (Independent System Operator)
• Let’s look at common flows on the transmission system on the PC simulator! – H:\CorporateServices\Training\Powerworldcases\ExampleCases\ECAR\98FFECAR.pwb

PJM©2011 www.pjm.com 19
Transmission Paths (Sub-transmission)
• General definition
– Medium voltage power transmission path underlying the bulk transmission system
• Typical voltage values
– 34.5 kV to 138 kV
• Typical path lengths
– 0.1 to 40 miles

PJM©2011 www.pjm.com 20
Transmission Paths (Sub-transmission)
• Application
– Intra-company power flow paths
– Move power from one area of a company to another
– Serve larger loads

PJM©2011 www.pjm.com 21
Transmission Paths (Distribution System)
• General definition
– Those power lines which supply energy to residential and commercial customers and some of the smaller industrials
• Two Typical Voltage Ranges
– Primary Distribution • 12 kV - 25 kV
– Secondary Distribution • 120 V - 480 V

PJM©2011 www.pjm.com 22
Transmission Paths (Distribution System)
• Two types of distribution systems
– Networks • Normally densely populated areas
– Radial • Normally in rural areas
• Typical path lengths
– Several pole spans to many miles
• Applications
– Supply of power to customers

PJM©2011 www.pjm.com 23
Transmission Line Standards - Glossary
• ACSR – aluminum conductor steel reinforced; Bare aluminum conductors stranded
around an inner core of galvanized steel wire(s). Often used in overhead power distribution and transmission lines.
• Kcmil – a measure of conductor area in thousands of circular mills; a circular mil (Cmil)
is the area of a circle with a diameter of one-thousandth (0.001) of an inch.
• kV – kilovolt (1,000 volts)
• M – million $
• MVA – megavolt-ampere (1 million volt-amperes); a unit of apparent power in an
alternating-current circuit. A volt-ampere (VA) is the product of voltage (volts) times current (amperes). A device rated at 10 amps and 120 V has a VA rating of 1200 or 1.2 kVA or 0.0012 MVA.

PJM©2011 www.pjm.com 24
Overhead Transmission Line Standards
Overhead Lines
Voltage Conductor Size (kcmil) Right of Way Width
Range
Typical Normal Rating
(MVA)
Order of Magnitude
Installation Cost per
Circuit Mile (Millions)
69 kV 556 ACSR 60 - 90 ft. 85 $ 0.300 / mile
115 kV 795 ACSR 90 - 130 ft. 175 $ 0.450 / mile
138 kV 1033 ACSR 100 - 150 ft. 250 $ 0.700 / mile
230 kV 1590 ACSR 100 - 160 ft. 650 $ 0.950 / mile
345 kV 2167 ACSR 140 - 160 ft. 1650 $ 1.5 / mile
500 kV 2493 ACSR 160 - 200 ft. 2700 $ 1.8 / mile
765 kV
1351 ACSR (4 conductor
bundled) 200-250 ft. 4000 $ 2.5 / mile

PJM©2011 www.pjm.com 25
69 kV Line
Conductor Size 556 ACSR
Right of Way 60 – 90 ft.
Normal MVA Rating 85 MVA
Cost per Circuit Mile $ 0.300 M / mile
Structure Type Single Pole, Steel or Wood

PJM©2011 www.pjm.com 26
Double Circuit 115 kV Lines
Conductor Size 795 ACSR
Right of Way 90 – 130 ft.
Normal MVA Rating 175 MVA
Cost per Circuit Mile $ 0.450 M / mile
Structure Type Single Pole, Steel or Wood

PJM©2011 www.pjm.com 27
Double Circuit 138 kV Lines
Conductor Size 1033 ACSR
Right of Way 100 – 150 ft.
Normal MVA Rating 250 MVA
Cost per Circuit Mile $ 0.700 M / mile
Structure Type Single Pole, Steel

PJM©2011 www.pjm.com 28
230 kV Line
Conductor Size 1590 ACSR
Right of Way 100 – 160 ft.
Normal MVA Rating 650 MVA
Cost per Circuit Mile $ 0.950 M / mile
Structure Type Wood H-Frame, Steel

PJM©2011 www.pjm.com 29
345 kV Line
Conductor Size 2167 ACSR
Right of Way 140 – 160 ft.
Normal MVA Rating 1650 MVA
Cost per Circuit Mile $1.5 M / mile
Structure Type Wood H-Frame, Steel

PJM©2011 www.pjm.com 30
500 kV Line
Conductor Size 2493 ACSR (bundled)
Right of Way 160 – 200 ft.
Normal MVA Rating 2700 MVA
Cost per Circuit Mile $ 1.8 M / mile
Structure Type Lattice Tower, Steel

PJM©2011 www.pjm.com 31
756 kV Line
Conductor Size 1351 ACSR (4 conductor
bundled)
Right of Way 200 – 250 ft.
Normal MVA Rating 4000 MVA
Cost per Circuit Mile $ 2.5 M / mile
Structure Type Lattice Tower, Steel
PJM©2011 www.pjm.com 32
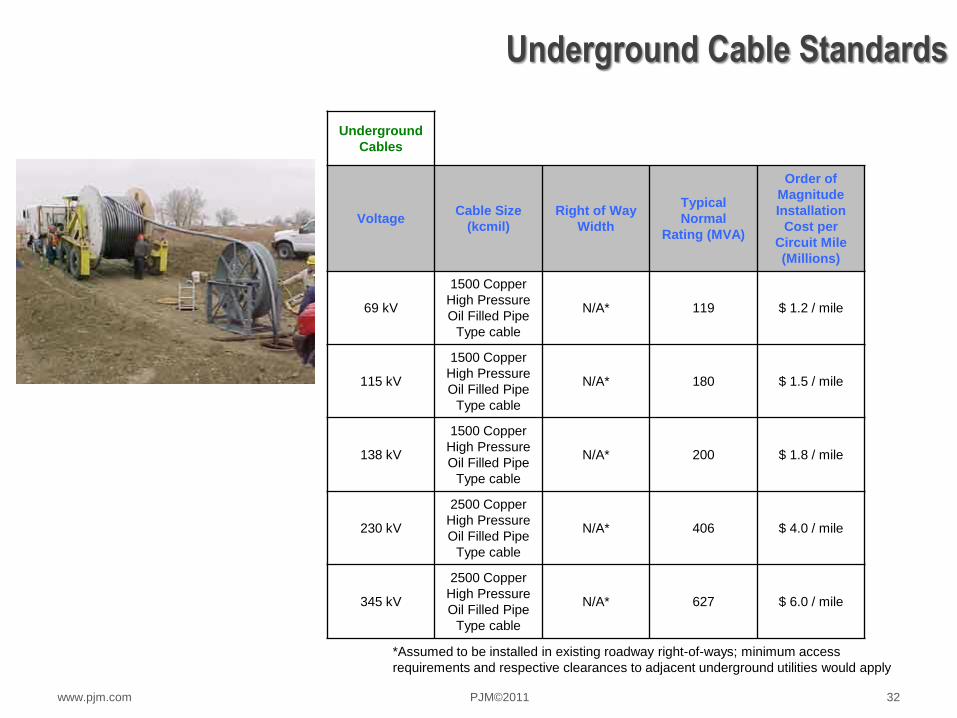
Underground Cable Standards
Underground
Cables
Voltage Cable Size
(kcmil)
Right of Way
Width
Typical
Normal
Rating (MVA)
Order of
Magnitude
Installation
Cost per
Circuit Mile
(Millions)
69 kV
1500 Copper
High Pressure
Oil Filled Pipe
Type cable
N/A* 119 $ 1.2 / mile
115 kV
1500 Copper
High Pressure
Oil Filled Pipe
Type cable
N/A* 180 $ 1.5 / mile
138 kV
1500 Copper
High Pressure
Oil Filled Pipe
Type cable
N/A* 200 $ 1.8 / mile
230 kV
2500 Copper
High Pressure
Oil Filled Pipe
Type cable
N/A* 406 $ 4.0 / mile
345 kV
2500 Copper
High Pressure
Oil Filled Pipe
Type cable
N/A* 627 $ 6.0 / mile
*Assumed to be installed in existing roadway right-of-ways; minimum access
requirements and respective clearances to adjacent underground utilities would apply
PJM©2011 www.pjm.com 33
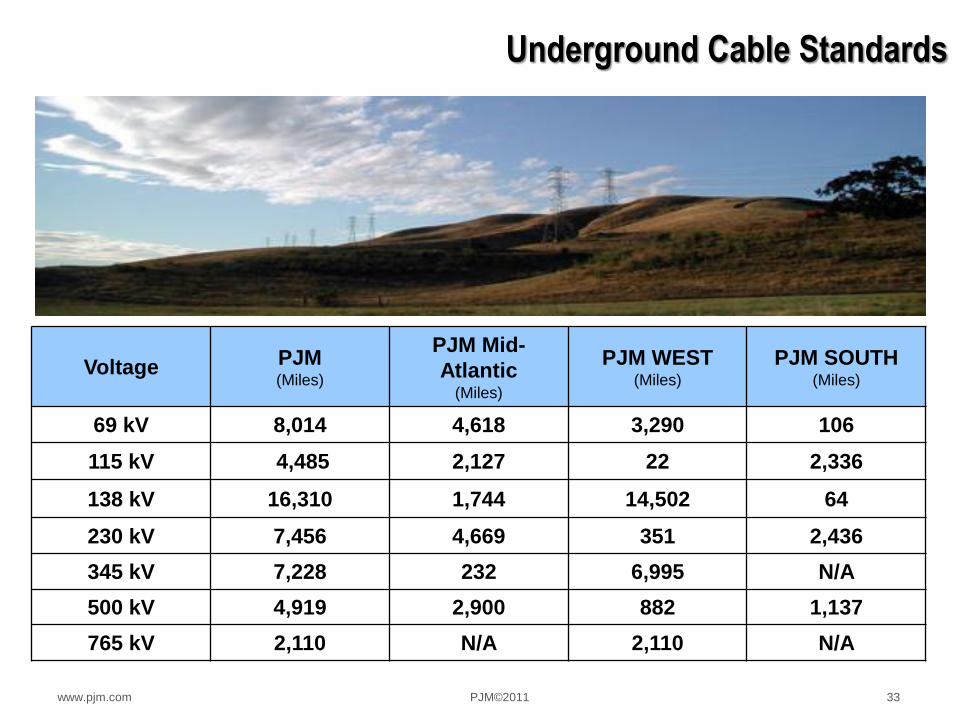
Voltage PJM (Miles)
PJM Mid-
Atlantic (Miles)
PJM WEST (Miles)
PJM SOUTH (Miles)
69 kV 8,014 4,618 3,290 106
115 kV 4,485 2,127 22 2,336
138 kV 16,310 1,744 14,502 64
230 kV 7,456 4,669 351 2,436
345 kV 7,228 232 6,995 N/A
500 kV 4,919 2,900 882 1,137
765 kV 2,110 N/A 2,110 N/A
Underground Cable Standards

PJM©2011 www.pjm.com 34
Transmission Paths (Distribution System)
• Exercise TO1-1.1

PJM©2011 www.pjm.com 35
Features of the Transmission System
• Generating Stations
– Source of the power (Car out of driveway)
• Transmission Lines
– Path of power flow (Freeway)
– Naming Conventions vary by company • Number, Terminals, Voltage Level

PJM©2011 www.pjm.com 36
Features of the Transmission System
• Buses
– Points of connection (Cloverleaf)
– Many breaker configurations • Straight
• Ring
• Breaker and a half
• Double bus/double breaker
Buses

PJM©2011 www.pjm.com 37
Features of the Transmission System
• Circuit Breakers
– Switch to interrupt the flow of current in a circuit (Car accident or police stop)
• Transformers
– Used to transform voltage from one level to another (on-ramp or off-ramp)
Circuit Breaker

PJM©2011 www.pjm.com 38
Features of the Transmission System
• Other Devices
– Phase angle regulators
– Disconnects
– Capacitors
– Reactors
• Exercise TO1-1.2
– Use PJM 500 kV one-line on following slide…..

PJM©2011 www.pjm.com 39

PJM©2011 www.pjm.com 40
Summary
• List the purpose and functions of the transmission system.
• Distinguish between the transmission system, the sub-transmission system and the distribution system.
• Given a simple one-line diagram, identify the major features of the PJM transmission system including:
– Lines, buses, and generating stations

PJM©2011 www.pjm.com 41
System Voltage and VAR Characteristics
TO1-2

PJM©2011 www.pjm.com 42
Lesson Objectives
• Identify situations which may cause the system voltage to drop below accepted standards.
• Identify situations which may cause the system voltage to rise above accepted standards.
• List the MVAR sources and sinks on the power system.
• Explain how system capacitance supplies MVARS to the system.

PJM©2011 www.pjm.com 43
Lesson Objectives
• Define Surge Impedance Loading and state its significance to system operation.

PJM©2011 www.pjm.com 44
System Voltage Characteristics
• Relationship between reactive flow and voltage
– Voltage levels most affected by • VAR generation/absorption
• Reactive (MVAR) flow distribution
– Large reactive flows cause large voltage drops
– Large voltage differences cause large reactive flows
Reactive Power (MVAR) are required for Real Power (MW) to flow.

PJM©2011 www.pjm.com 45
System Voltage Characteristics
• Voltage profile
– On most lines voltage decreases from sending to receiving end of transmission line.

PJM©2011 www.pjm.com 46
System Voltage Characteristics
• a = angle of voltage
• b = angle of current
• P = real power = VIr = VI cos(a-b)
• Q = reactive power = VIx = VI sin(a-b)
• S = complex power = VI cos(a-b) +jVI sin(a-b)
• power factor = cos (a-b)
P=VIcos(a-b) W
Q=
VIs
in(a
-b) V
ar
(a-b)

PJM©2011 www.pjm.com 47
System Voltage Characteristics
• Factors affecting voltage
– VAR supply • Excess VARs on system, voltage will rise
• Shortage of VARs on system, voltage will decrease
– VAR Sources • System capacitance
• Capacitor banks
• Generators (lagging)

PJM©2011 www.pjm.com 48
System Voltage Characteristics
• Factors affecting voltage (continued)
– VAR loads • Motors
• VAR losses
• Generators (leading)
• Reactors
• Transformers
– Power (MW) Flow • Increasing load (MW) causes larger I2R loss and IR voltage drop

PJM©2011 www.pjm.com 49
System Voltage Characteristics
• Factors affecting voltage (continued) – Reactive (MVAR) Flow
• Increasing reactive (MVAR) flow causes larger I2X loss and IX voltage drop
• Voltage drop due to reactive flow is larger than for real power flow
• VARs don’t travel well.
– Solar Magnetic Disturbance • Can cause a large VAR requirement in transformers
• May cause tripping of capacitor banks
– MVAR Simulation on Powerworld H:\Corporate Services\Training\Powerworld Cases\Chapter 2\Problem 2_24.pwb

PJM©2011 www.pjm.com 50
System Voltage Characteristics
• Results
– Result is constantly changing voltage profile

PJM©2011 www.pjm.com 51
System Voltage Characteristics
• Results
– For light loads, voltage can rise due to low losses and line capacitance

PJM©2011 www.pjm.com 52
System Voltage Characteristics
• Results
– Voltage Varies with VAR supply and consumption

PJM©2011 www.pjm.com 53
VARs From Transmission Lines
• Line open at one end
– VAR flow back toward closed end

PJM©2011 www.pjm.com 54
VARs From Transmission Lines
Equation for Ferranti Effect

PJM©2011 www.pjm.com 55
VARs From Transmission Lines
• VARs supplied by charging of line
MVARs Supplied by Lines and Cables
Voltage Transmission Line Transmission Cable
765 kV 4.6 MVAR/Mile
500 kV 1.7 MVAR/Mile
345 kV 0.8 MVAR/Mile 15–30 MVAR/Mile
230 kV 0.3 MVAR/Mile 5-15 MVAR/Mile
115 kV 0.1 MVAR/Mile 2-7 MVAR/Mile

PJM©2011 www.pjm.com 56
Attachment B - Transmission Operation Manual
VARs From Transmission Lines

PJM©2011 www.pjm.com 57
Attachment B - Transmission Operation Manual
VARs From Transmission Lines

PJM©2011 www.pjm.com 58
Attachment B - Transmission Operation Manual
VARs From Transmission Lines

PJM©2011 www.pjm.com 59
KEYSTONE-JUNIATA 5004 118 3.1 196.5 514.5 14.5 216.9 540.4 15.4 238.0 566.1 16.1
Keystone Juniata
550
525 kV V2 =
5004 Line
VARs From Transmission Lines

PJM©2011 www.pjm.com 60
KEYSTONE-JUNIATA 5004 118 3.1 196.5 514.5 14.5 216.9 540.4 15.4 238.0 566.1 16.1
Keystone Juniata
550
528.1 kV
540.4 kV
216.9 MVAR 0 MVAR
5004 Line
V1 =
VARs From Transmission Lines

PJM©2011 www.pjm.com 61
VARs From Transmission Lines
• Line connected to load
– Power (MW) losses increase with load
– Reactive (MVAR) losses increase with load
Load
Load
increases
MW Flow increases
MVAR Flow increases
PJM©2011 www.pjm.com 62
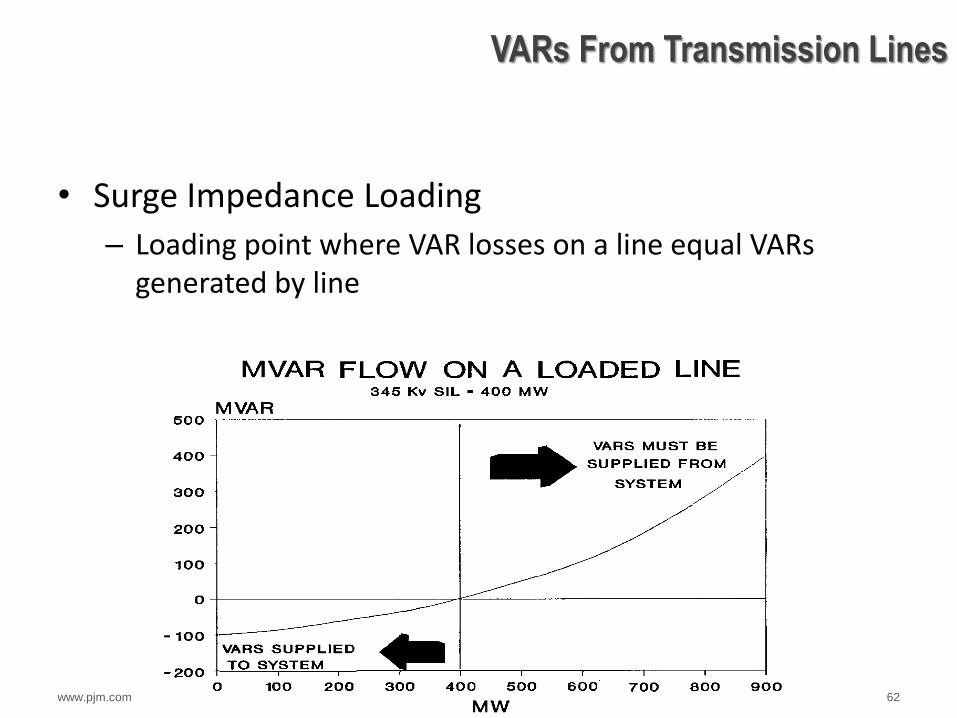
VARs From Transmission Lines
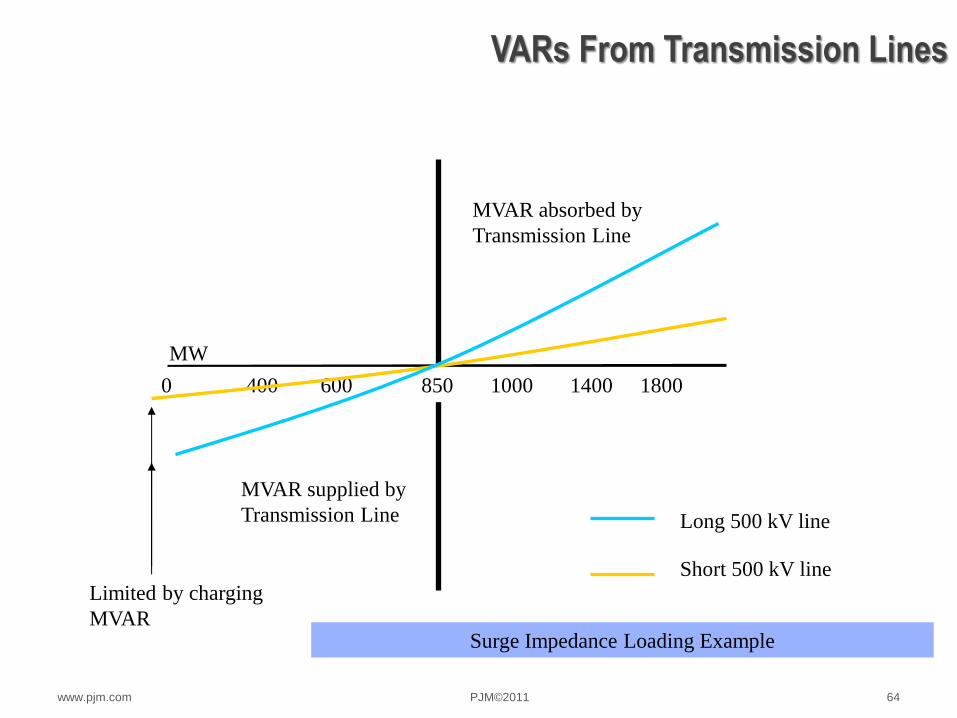
• Surge Impedance Loading
– Loading point where VAR losses on a line equal VARs generated by line

PJM©2011 www.pjm.com 63
VARs From Transmission Lines
• Surge Impedance Loading
– 765 kV = 2100 MW
– 500 kV = 850 MW
– 345 kV = 400 MW
– 230 kV = 135 MW
PJM©2011 www.pjm.com 64
MW
0 400 600 850 1000 1400 1800
MVAR absorbed by
Transmission Line
MVAR supplied by
Transmission Line Long 500 kV line
Short 500 kV line Limited by charging
MVAR Surge Impedance Loading Example
VARs From Transmission Lines

1.0 pu 1.0 pu
MVAR
Required
MVAR
Required
Voltage Profile
Line loaded above SIL
As line loading increases:
Reactive losses increase proportional to I2
Reactive supply decreases proportional to V2
VARs from Transmission Lines

1.0 pu 1.0 pu
MVAR
Supplied
MVAR
Supplied
Voltage Profile
Line loaded below SIL
As line loading decreases:
Reactive losses decrease proportional to I2
Reactive supply increases proportional to V2
VARs from Transmission Lines

PJM©2011 www.pjm.com 67
VARs From Transmission Lines
• Switching Operations
– Open one end • Provides VARs to closed end of line due to line capacitance
MVAR Flow

PJM©2011 www.pjm.com 68
VARs From Transmission Lines
• Switching Operations (continued)
– Open both ends • Removes that line from service
• No longer supplies VARs (high voltage) or uses VARs (low voltage)
– Switching Over-voltages • Very high voltages which occur for a short duration
• Can be handled in insulation design or use of surge suppression devices

PJM©2011 www.pjm.com 69
VARs From Transmission Lines
• Lightning Over-voltages
– Much more severe than switching surges
– >1000 kV
– Can cause insulation failure or flashover
– Controlled by surge arrestors or lightning rods

PJM©2011 www.pjm.com 70
Summary
• Identify situations which may cause the system voltage to drop below accepted standards.
• Identify situations which may cause the system voltage to rise above accepted standards.
• List the MVAR sources and sinks on the power system.

PJM©2011 www.pjm.com 71
Summary
• Explain how system capacitance supplies MVARS to the system.
• Define Surge Impedance Loading and state its significance to system operation.

PJM©2011 www.pjm.com 72
Distribution Factors and Generation Shift Factors
TO1-3

PJM©2011 www.pjm.com 73
Lesson Objectives
• Define a transmission line distribution factor.
• Briefly describe the application of distribution factors for system operation.
• Given appropriate distribution factors, analyze the impact of taking a line out of service.
• Define a generation shift factor and describe its application for system operation.

PJM©2011 www.pjm.com 74
Lesson Objectives
• Given appropriate generation shift factors, analyze the impact of a shift in generation.
• Define the concept of $/MW effect and its application in the new operating environment.

PJM©2011 www.pjm.com 75
Introduction to Distribution Factors
• Definition
– The percentage of flow currently on a line that will transfer to another line as a result of the loss of the first line
• Characteristics of Distribution Factors
– Determined by line impedances
– Computer generated
– Expressed as a decimal number of 1.0 or less
– Distribution factor for a line for the loss of itself is -1.0 if line flow is positive.

PJM©2011 www.pjm.com 76
Introduction to Distribution Factors
• Characteristics of Distribution Factors (continued)
– Can be a positive or negative factor
– Sum of all distribution factors in a closed system is zero
• Formula: • New flow on line = Previous flow + [(Dfax) (Flow on outaged
facility)]

PJM©2011 www.pjm.com 77
Example Simple Calculations
For the loss of line C:
Dfaxb= 0.5 Dfaxc = -1.0
Dfaxd = 0.3 Dfaxe = 0.2

PJM©2011 www.pjm.com 78
Example Simple Calculations
Let’s do Exercise TO1_3.1!

PJM©2011 www.pjm.com 79
Applications of Distribution Factors
• Line Outages
– Use distribution factors to estimate how power will flow and predict any flow problems which may result from a line outage. • Generally performed by computer tool
• Flow Analysis
– Used to predict the results of losing a specific piece of equipment (Contingency analysis)

PJM©2011 www.pjm.com 80

PJM©2011 www.pjm.com 81
PJM Distribution Factor Table
• Try Exercise TO1_3.2.

PJM©2011 www.pjm.com 82
Generation Shift Factors
• Similar to Distribution Factors
– Decimal Fraction
– Used to analyze the effect of generation shifts on MW flow
– Does NOT add up to 0
• Definition
– Fraction of change in generation MW output that will appear on a line or facility
– Used to predict the effect of generation changes on transmission line flow

PJM©2011 www.pjm.com 83
Generation Shift Factors
• Formula
New flow on line = Previous flow + [(Gen Shift Factor)(Amount of MW
Shift)]

PJM©2011 www.pjm.com 84
Generation Shift Factors
Line 3 = 500 MW
Increase Gen A by
100 MW.
What is resultant
flow on Line 3? LINE 5
New Flow = 500 MW + (.12)(+100MW) = 512 MW

PJM©2011 www.pjm.com 85
Generation Shift Factors
Line 3 = 512 MW
Now, Generator C is
decreased by 100 MW.
What is resultant flow
on Line 3? LINE 5
New Flow = 512 MW + (-0.6)(-100MW) = 572 MW

PJM©2011 www.pjm.com 86
Generation Shift Factors
Try Exercise
TO1_3.3!
LINE 5

PJM©2011 www.pjm.com 87
$/MW Effect
• Adjustment of Shift Factors due to Economics.
• Definition
– $/MW Effect = (Current Dispatch Rate - Unit Bid) / Unit Generator Shift Factor
– Unit with lowest $/MW effect is redispatched when system is constrained.
– Other unit operating constraints taken into account (I.e. min run time, time from bus, etc)
– In an emergency, economics takes the “back seat” to reliability.

PJM©2011 www.pjm.com 88
$/MW Effect
Line #1 is overloaded!
Dispatch rate = $20
Unit D = $21
Unit B = $40
Which unit would you
raise to alleviate the
overload?

PJM©2011 www.pjm.com 89
$/MW Effect
Unit D = ($20-$21)/(-.12)
= $8.33/MW
Unit B = ($20-$40)/(-.2)
= $100/MW
Select Unit D even
though effect is less!

PJM©2011 www.pjm.com 90
$/MW Effect
• Let’s do Exercise TO1_3.4 on $/MW Effect.
• 2 PowerWorld Simulations on Loop Flows and Power Transfer Distribution Factors (PDTF)

PJM©2011 www.pjm.com 91
Summary
• Define a transmission line distribution factor.
• Briefly describe the application of distribution factors for system operation.
• Given appropriate distribution factors, analyze the impact of taking a line out of service.
• Define a generation shift factor and describe its application for system operation.

PJM©2011 www.pjm.com 92
Summary
• Given appropriate generation shift factors, analyze the impact of a shift in generation.
• Define the concept of $/MW effect and its application in the new operating environment.

PJM©2011 www.pjm.com 93
Module Summary
• Review the purpose and function of the transmission system.
• Review basic system voltage and VAR characteristics
• Demonstrate basic distribution factor theory.
• Determine power flows utilizing system distribution factors and generation shift factors
• Introduce the concept of $/MW effect.

PJM©2011 www.pjm.com 94
Questions?

PJM©2011 www.pjm.com 95
Disclaimer: PJM has made all efforts possible to accurately document all information in this presentation. The information seen here does not supersede the PJM Operating Agreement or the PJM Tariff both of which can be found by accessing: http://www.pjm.com/documents/agreements/pjm-agreements.aspx For additional detailed information on any of the topics discussed, please refer to the appropriate PJM manual which can be found by accessing: http://www.pjm.com/documents/manuals.aspx