tuberculosis in indonesia: tipping the balance towards better
TRANSCRIPT

Tuberculosis in Indonesia:
Tipping the balance towards better
control
Bachti Alisjahbana
Medical Faculty, Padjadjaran University, TB Operational Research Group, National TB Program, Indonesia

Overview
TB Situation
Program challenges
Operational research
Biomedical research
Conclusion

Indonesia Pop = 247 million

22 High Burden Countries, 2012
Indonesia 5.8%
South Africa 4.9%
China 14.3%
India 21.1%
Other 15.9%
Bangladesh 3.8%
Nigeria 4.9%
Ethiopia 3.3%
Pakistan 3.2%
Philippines 2.7%
In Indonesia : Prevalence: 730.000 (297/100 thousand) Incidence: 460.000 (185/100 thousand) Mortality: 67.000 HIV in TB = ~3% WHO report 2013

91
81
5458
73.8
87 86 86.1 86.789.5 91 91 91 91 91.2
86.7
1.44.6
7.512
19 20 21
30.6
37.6
54
68
75.7
69.872.8 73.1
78.3
60.7
0
10
20
30
40
50
60
70
80
90
100
Tahun
CDR & Success Rate Kasus TB Paru BTA Positif, Indonesia 1995-2011*)
SR CDR
Target CDRI ndo 75%, Global 70%
Target SR Indo 86%, Global ≥ 85% s/d 3rd Quarter (data gathered by 10 Jan 2012)

National TB Program Achievement (WHO, 2013)
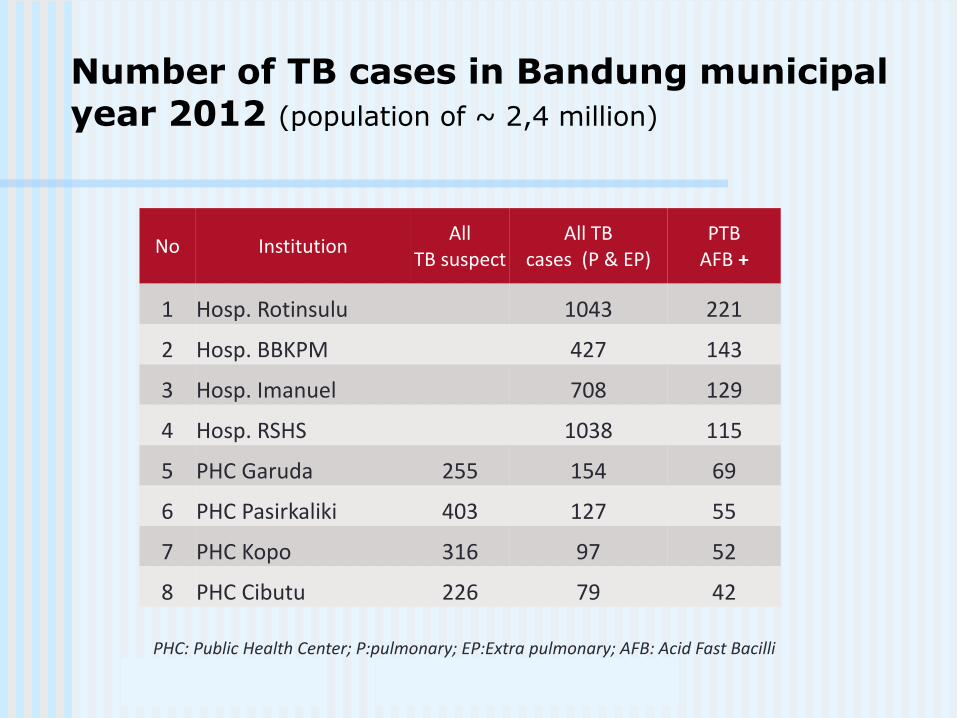
Number of TB cases in Bandung municipal year 2012 (population of ~ 2,4 million)
No Institution All
TB suspect All TB
cases (P & EP) PTB
AFB +
1 Hosp. Rotinsulu 1043 221
2 Hosp. BBKPM 427 143
3 Hosp. Imanuel 708 129
4 Hosp. RSHS 1038 115
5 PHC Garuda 255 154 69
6 PHC Pasirkaliki 403 127 55
7 PHC Kopo 316 97 52
8 PHC Cibutu 226 79 42
PHC: Public Health Center; P:pulmonary; EP:Extra pulmonary; AFB: Acid Fast Bacilli

Overview
TB situation
Program challenges
Operational research
Biomedical research
Conclusion


TB Laboratories
3 national
Surabaya
Bandung
Univ Indo, Jakarta
2 referral lab. just passed QA.
5.566 TB lab.
59% (3.284) EQAS,
75% good result

TB-MDR
Among new patients,
resistance to any drug 17.1%
MDR-TB 1.8%.
Retreatment cases,
Resistance 34.3% and
MDT 17.1%.
WHO estimated 6900 cases are MDR TB (annual incidence).
Total notification MDR-TB was 428, (0.12% coverage).

TB-HIV
HIV prevalence in new TB is 3.3%.
~ 1% TB patients
know their HIV status.
Among HIV positive,
only 29% enrolled on
ART.

National Strategy 2016 Toward a free-TB, healthy, just and self- reliant society
Technical Strategies
1.Scaling-up and improve quality DOTS
2.Addressing TB/HIV, MDR-TB, & the needs of poor and vulnerable
3.Engaging all public and private
providers in implementation of ISTC.
4.Empowering TB patients &
communities

National Strategy 2010-2016
Functional Strategies
1.Strengthening health system, HRD and TB control program management
2.Increasing commitment of central and local government
3.Enhancing research, development and
utilization of strategic information

Overview
TB Situation
Program challenges
Operational research
Biomedical research
Conclusion

TB Operational Research Group (TORG)
Under the NTP
Facilitate operational research (OR)
Increase capacity to conduct OR through intensive courses
Review TB research proposals submitted to NTP
Provide technical assistance in OR at National level.
Facilitate implementation of OR results in program

Operational Research Topics
Case detection Com empowerment 5
Hospital (manamgent, ISTC) 3
Laboratory 4
Public health center management 4
Utilization of Remote health post 3
Patient Health seeking behavior 2
Active case findings 1
Private practice 1
Case holding Patient behavior assessment 2
Education, group support, Info tech support 3
Hospital DOTS Management, ISTC 2
MDR TB Factors to increased coverage 1
TB HIV Management of collbaorative 1
Pediatric TB Diagnosis 1
33

Scope of the TORG Network

Evaluation of implementation of Xpert-Mtb-Rif
National level OR
5 Xpert deployed in 2012, 10 more in 2013
Aiming for HIV and MDR-TB
Increase D/ yield,
faster detection MDR TB
Hesitation rely only xpert
Culture still needed

TB prevalence survey

TB prevalence survey Preliminary findings
Smear-positive TB prevalence higher than previously estimated*
Probably more sensitive screening, & diagnosis
Prevalence in rural > urban
Prevalence peaked in 25-34 age. Ongoing significant transmission?
Gaps between prevalence and notifications are greater in men and oldest age

Overview
TB Situation
Program challenges
Operational research
Biomedical research
Conclusion

Biomedical research
New findings
→ new challenges

First project (2000-2005)
Immunogenetic basis of susceptibility to and disease manifestations from tuberculosis
Why patient gets TB
What immunogenetic pattern?
Others condition?
900 Cases, 1000 Control
Funded by KNAW

Setting

Double Trouble... TB & DM
Alisjahbana et al, Int Journ of Tub and Lung Dise, 2006, 10(6), 696-700
age (years)
Control subjects
10
15
20
25
30
35
40
10 20 30 40 50 60 70
Tuberculosis patients
age (years)
Bo
dy m
ass
ind
ex (
kg
/m2
)
10
15
20
25
30
35
40
10 20 30 40 50 60 70
No DM
DM
Bo
dy m
ass
ind
ex (
kg
/m2
)

Africa DM: 11 million (6%) TB: 2.9 million (32%)
Europe DM: 24 million (14%) TB: 0.2 million (2%)
Asia DM: 102 million (60%) TB: 5.6 million (62%)
Oceania DM: 1 million (1%) TB: 0.02 million (0.2%)
South America DM: 10 million (6%) TB: 0.3 million (3%)
North America DM: 23 million (13%) TB: 0.1 million (1%)
Double trouble of TB & DM in Asia

EC, Fp7
To determine
prevalence of DM among TB patients & vice versa
feasible, accurate and cost-effective ways of screening.
DM management level required with TB treatment
glucose control effect on TB treatment outcome
Pathopysiological studies

Pharmacokinetic studies
Rifampicin plasma concentration is significanty reduced in TB-DM patient Nijland et al, 2006, CID

TB Diagnostic
(Lidya Chaidir et al, 2013)

Bacterological studies Drug Sensitivity Testing?
Figure 3. AMK = Amikacin, INH =
Isoniazid, RIF=Rifampicin, PAS=Para
aminosalisilic acid, ETB=Ethambutol,
STR=Streptomicin. Numbers shows
antibiotic concentration in medium
(mg/l).
Con-
trol
1/100 Con-trol
AMK
5
INH
0.1
INH
0.2
INH
0.5
INH
1
INH
2
RIF
0.1
RIF
0.2
RIF
0.5
RIF
1
RIF
2
RIF
5
PAS
1
ETB
1
ETB
2
ETB
5
ETB
10
ETB
20
STR
1
STR
2
STR
5
STR
10
STR
20
The proportional method Multiwell method

TB Beijing genotype
Related with higher disease severity?
Our studies
More severe
More treatment failure
R. Van Crevel, EID, 880 Vol. 7, No. 5, September-October 2001

Population Structure of M. tuberculosis in Papua vs Java
Mtb Finger Printing, show huge variability across Indonesian Islands MIRU-VNTR and MLPA later shows more distinctive power (Lidya Chaidir et al, 2013)

Latent TB IGRA vs Mantoux in children case contact

Latent TB Treatment
Multicenter clinical trial (2012-now)
latent TB (TST +)
800 adult, 300
child
4Rif vs 9INH
safety & efficacy
immunological pattern

Conclusion
Problems
Host Diabetes Immuno-genetic HIV-TB
Operational Research Diagnostic Imuno-diagnostic
Clin evaluation Pharmaco kinetics
Bacteriology Beijing study Drug susceptibility test Transmission dynamic
MDR-TB
Diagnosis & Management
Coevolution study

Thank You
TB Operational Research Group
TB research Group Bandung

5 Level of TB Laboratory
1.Satellite facility
2.Health facility lab. TB microscopy.
3.Intermediate TB laboratory located in District. Cross check service level I
4.Province referral TB laboratory providing
cross check for level 2
5.National referral TB laboratory.