tulare county general plan recirculated draft...
TRANSCRIPT

Appendix G Phase I Water Supply Evaluation for Tulare County


Tulare County General Plan 2030 Update G-1 ESA / 207497 Recirculated Draft Environmental Impact Report February 2010
APPENDIX G Water Supply Evaluation Technical Appendix
Appendix G provides a copy of the Water Supply Evaluation Report (June 2009) prepared for the General Plan 2030 Update. This report provides the water supply information that was used to determine the adequacy of future water supply resources necessary to serve the proposed project.


TTUULLAARREE CCOOUUNNTTYY
GGEENNEERRAALL PPLLAANN UUPPDDAATTEE
PPHHAASSEE 11-- WWAATTEERR SSUUPPPPLLYY EEVVAALLUUAATTIIOONN
JJUUNNEE 22000099

Tulare County Phase 1 Water Supply Evaluation June 2009
Prepared by:

Tulare County Phase 1 Water Supply Evaluation June 2009
Table of Contents Section 1 – Introduction .................................................................................................................. 1 Section 2 – Demand Conditions ..................................................................................................... 2
2.1 Existing Water Demand ..................................................................................................... 2 2.2 Future Water Demand ........................................................................................................ 6 2.3 The Effect of Conservation and Demand Management .................................................. 11
Section 3 – Supply Conditions ...................................................................................................... 13 3.1 Surface Water Characteristics .......................................................................................... 13
3.1.1 Geographic Descriptions of Watersheds ................................................................... 13 3.1.2 Surface Water Yields ................................................................................................ 17
3.2 Groundwater Characteristics ............................................................................................ 19 3.2.1 Geographic and Hydrogeologic Characteristics ....................................................... 19 3.2.2 Overview of Groundwater Quality ........................................................................... 24 3.2.3 Groundwater use and overdraft in Tulare County .................................................... 24
3.3 Issues Affecting Supplies ................................................................................................. 26 3.3.1 Groundwater Overdraft ............................................................................................. 26 3.3.2 San Joaquin River Restoration Settlement ................................................................ 27 3.3.3 Population Growth Within and Near Tulare County ................................................ 27 3.3.4 Joint Management of Shared Aquifers ..................................................................... 27 3.3.5 Groundwater Adjudications ...................................................................................... 28 3.3.6 Water Transfers and Exchanges ................................................................................ 28 3.3.7 Delta Supply Issues ................................................................................................... 29 3.3.8 Climate Change and Variability ................................................................................ 29 3.3.9 Institutional Issues Affecting Water Supplies........................................................... 30
3.4 Summary of Water Supplies ............................................................................................ 31 Section 4 – Integration .................................................................................................................. 33
4.1 Future Scenarios............................................................................................................... 33 4.2 Conclusion ....................................................................................................................... 35

FINAL DRAFT
Tulare County Phase 1 Water Supply Evaluation June 2009
1
SSSeeeccctttiiiooonnn 111 ––– IIInnntttrrroooddduuuccctttiiiooonnn The Phase 1 – Water Supply Evaluation provides an initial analysis and information to support the determination of environmental impacts to water resources in Tulare County associated with adoption of the General Plan Update.
The focus of the following sections are to describe and analyze the present and future water supplies and demands in Tulare County, specifically focusing on the geographic areas of the County that comprise the vast majority of the agricultural and urban water demands. Using data readily available from the Department of Water Resources (DWR) for the Tulare County region for 1999, 2002 and 2003, as well as land use data available from various sources, including the County, this analysis provides a representation of ‘existing’ supply and demand conditions and projects ‘future’ conditions contemplated by the General Plan Update.
The document is separated into the following sections:
Section 2 – This section provides analysis of existing and projected demand conditions, focused primarily on the ‘valley floor’ portion of the County’s water users, and reflects the potential change in demand resulting from anticipated displacement of irrigated agricultural lands with mixed-use urban development as contemplated by the General Plan Update.
Section 3 – This section describes the surface and groundwater resources available to the County and qualitatively contemplates the potential issues that may affect their long-term reliability and availability.
Section 4 – This section integrates the water supply and demand conditions, under a defined set of scenarios, to represent the potential impact on the County’s surface and groundwater resources attributed to the General Plan Update.

FINAL DRAFT
Tulare County Phase 1 Water Supply Evaluation June 2009
2
SSSeeeccctttiiiooonnn 222 ––– DDDeeemmmaaannnddd CCCooonnndddiiitttiiiooonnnsss This section provides information used to represent the existing water demand condition as well as an analysis of potential future demand conditions, based upon the land use changes contemplated by the General Plan Update.
2.1 EXISTING WATER DEMAND Existing water demand conditions were estimated based upon planning data available from the California Department of Water Resources (DWR). DWR subdivides California into geographical study areas for planning purposes. Existing Tulare County water demand conditions were calculated based on water demand data provided by DWR at the finest level of detail available – the Detailed Analysis Unit (DAU).
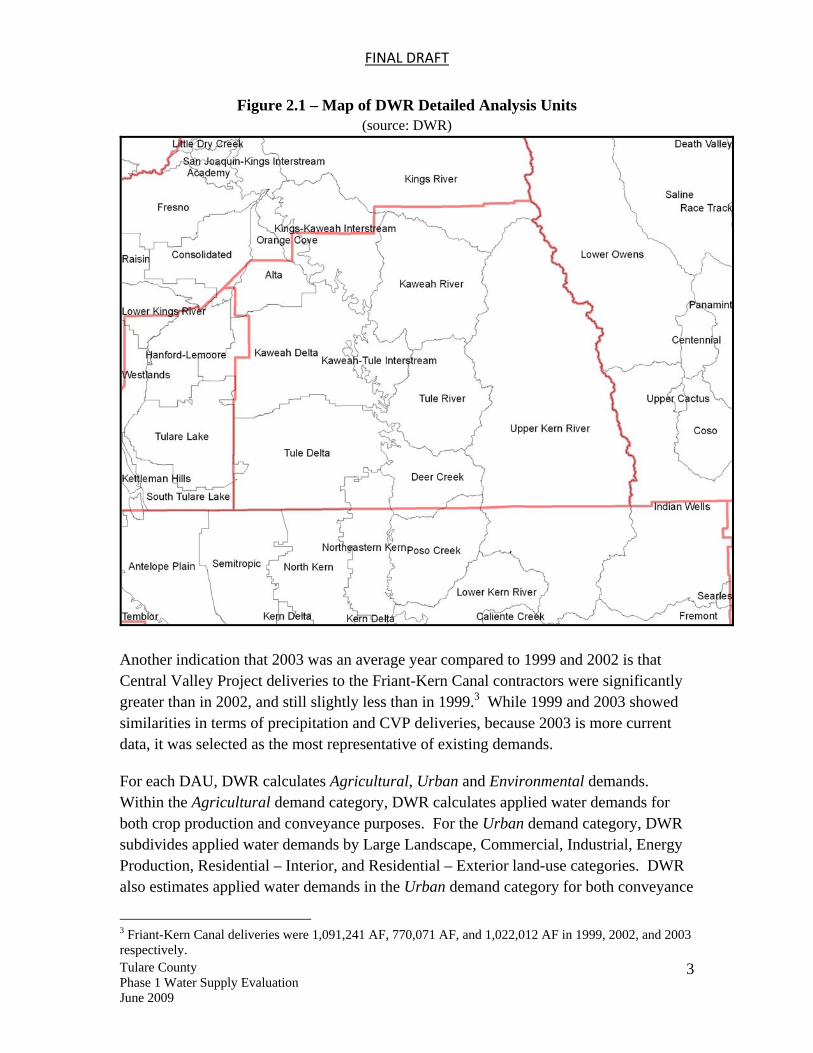
The DAUs included in this water demand analysis are: Alta, Consolidated, Deer Creek, Kaweah Delta, Kaweah River, Kaweah-Tule Interstream, Kings River, Kings-Kaweah Interstream, Northeastern Kern, Orange Cove, Poso Creek, Tulare Lake, Tule Delta, Tule River, and Upper Kern River (see Figure 2.1). Where some DAUs straddle the Tulare County line, only the portion of the DAU inside the county boundary was considered for purposes of the water demand analysis.
Based upon water demand data developed by DWR for the 2009 Water Plan Update, existing water demand in Tulare County is assumed to be similar to the annual demand for 2003 represented in water budgets developed by DWR for the aforementioned DAUs. For the 2009 Water Plan Update, DWR is using Water Years 1999, 2002 and 2003 to represent water demands under various hydrologic conditions. Compared to 1999 and 2002, 2003 was an average water year in the Tulare Lake Hydrologic Region and thus, assumed to be ‘average’ within Tulare County. This was determined by reviewing average historic precipitation in the City of Visalia – and comparing the average precipitation with the precipitation in 1999, 2002 and 2003. Average precipitation in Visalia is approximately 11.03 inches per year.1 In 2003, the precipitation measured at Visalia, California was 7.49 inches.2 Notably, while not approaching the average, 2002 was considerably drier (than 2003), while 1999 saw slightly more precipitation (than 2003).
1http://www.weather.com. 2 California Irrigation Management Information System (CIMIS) indicates that precipitation was 5.69 in. and 8.11 in. in 2002 and 1999 respectively.
FINAL DRAFT
Tulare County Phase 1 Water Supply Evaluation June 2009
3
Figure 2.1 – Map of DWR Detailed Analysis Units (source: DWR)
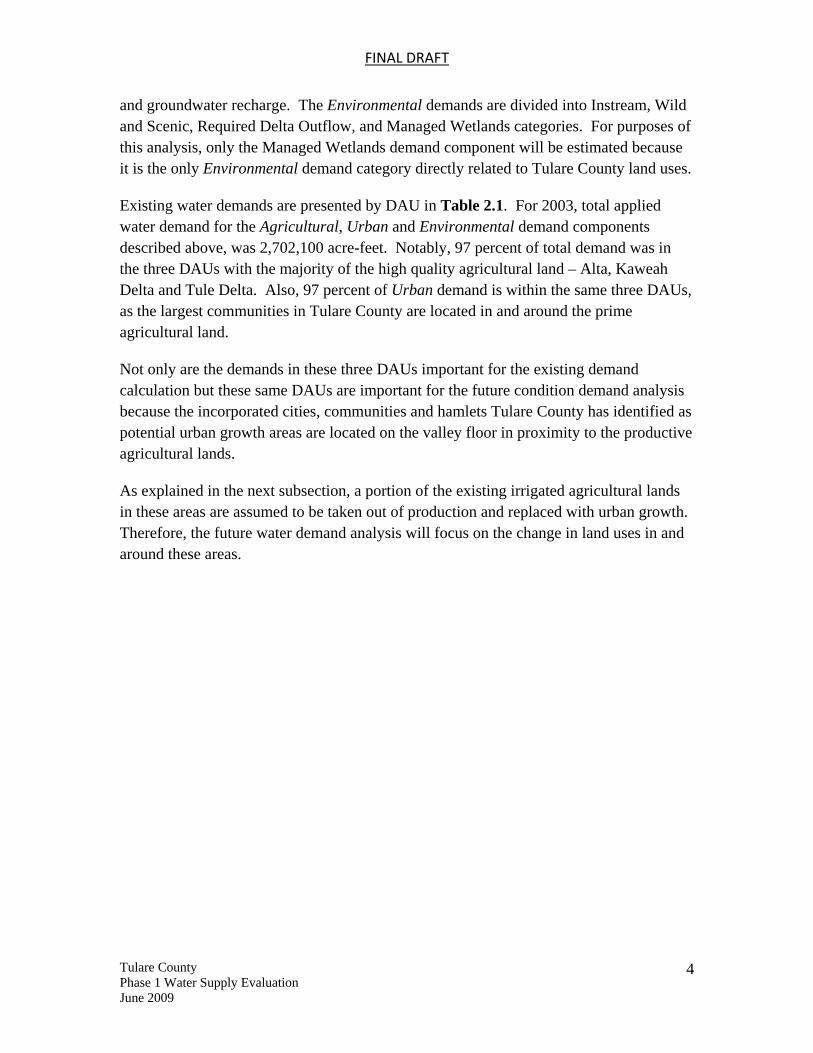
Another indication that 2003 was an average year compared to 1999 and 2002 is that Central Valley Project deliveries to the Friant-Kern Canal contractors were significantly greater than in 2002, and still slightly less than in 1999.3 While 1999 and 2003 showed similarities in terms of precipitation and CVP deliveries, because 2003 is more current data, it was selected as the most representative of existing demands.
For each DAU, DWR calculates Agricultural, Urban and Environmental demands. Within the Agricultural demand category, DWR calculates applied water demands for both crop production and conveyance purposes. For the Urban demand category, DWR subdivides applied water demands by Large Landscape, Commercial, Industrial, Energy Production, Residential – Interior, and Residential – Exterior land-use categories. DWR also estimates applied water demands in the Urban demand category for both conveyance
3 Friant-Kern Canal deliveries were 1,091,241 AF, 770,071 AF, and 1,022,012 AF in 1999, 2002, and 2003 respectively.
FINAL DRAFT
Tulare County Phase 1 Water Supply Evaluation June 2009
4
and groundwater recharge. The Environmental demands are divided into Instream, Wild and Scenic, Required Delta Outflow, and Managed Wetlands categories. For purposes of this analysis, only the Managed Wetlands demand component will be estimated because it is the only Environmental demand category directly related to Tulare County land uses.
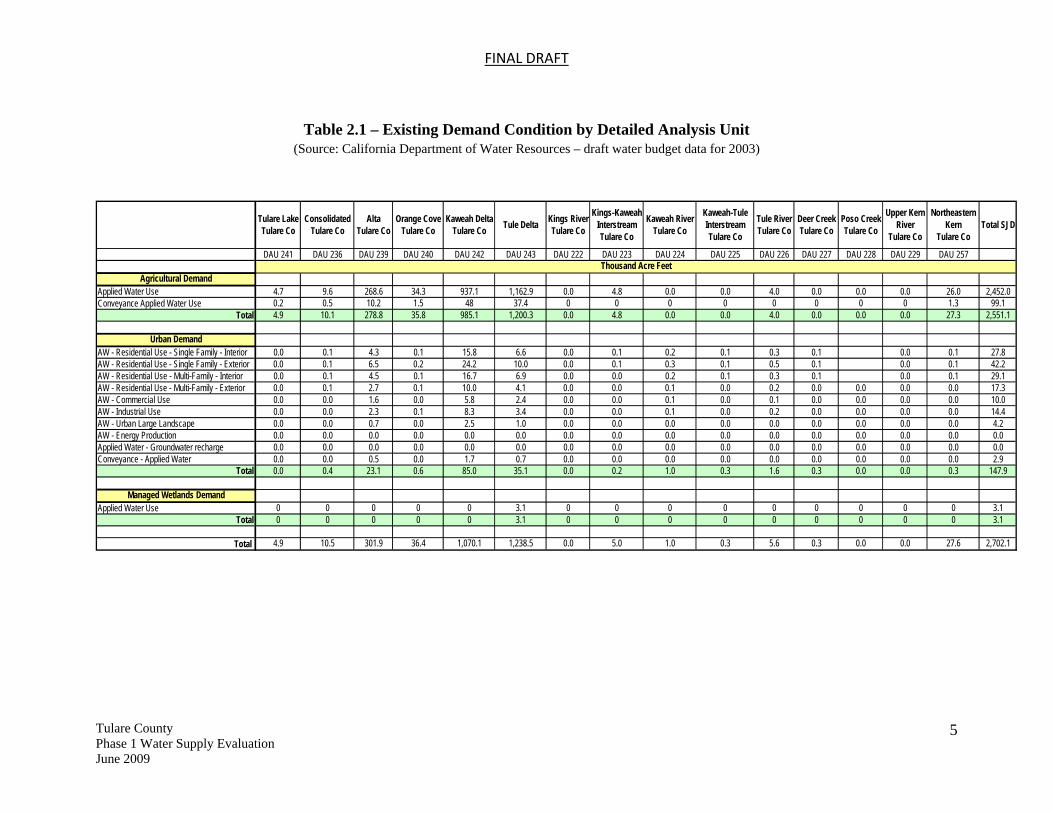
Existing water demands are presented by DAU in Table 2.1. For 2003, total applied water demand for the Agricultural, Urban and Environmental demand components described above, was 2,702,100 acre-feet. Notably, 97 percent of total demand was in the three DAUs with the majority of the high quality agricultural land – Alta, Kaweah Delta and Tule Delta. Also, 97 percent of Urban demand is within the same three DAUs, as the largest communities in Tulare County are located in and around the prime agricultural land.
Not only are the demands in these three DAUs important for the existing demand calculation but these same DAUs are important for the future condition demand analysis because the incorporated cities, communities and hamlets Tulare County has identified as potential urban growth areas are located on the valley floor in proximity to the productive agricultural lands.
As explained in the next subsection, a portion of the existing irrigated agricultural lands in these areas are assumed to be taken out of production and replaced with urban growth. Therefore, the future water demand analysis will focus on the change in land uses in and around these areas.
FINAL DRAFT
Tulare County Phase 1 Water Supply Evaluation June 2009
5
Table 2.1 – Existing Demand Condition by Detailed Analysis Unit (Source: California Department of Water Resources – draft water budget data for 2003)
Tulare LakeTulare Co
ConsolidatedTulare Co
AltaTulare Co
Orange CoveTulare Co
Kaweah DeltaTulare Co Tule Delta Kings River
Tulare Co
Kings-Kaweah InterstreamTulare Co
Kaweah RiverTulare Co
Kaweah-Tule InterstreamTulare Co
Tule RiverTulare Co
Deer CreekTulare Co
Poso CreekTulare Co
Upper Kern River
Tulare Co
Northeastern Kern
Tulare CoTotal SJD
DAU 241 DAU 236 DAU 239 DAU 240 DAU 242 DAU 243 DAU 222 DAU 223 DAU 224 DAU 225 DAU 226 DAU 227 DAU 228 DAU 229 DAU 257
Agricultural DemandApplied Water Use 4.7 9.6 268.6 34.3 937.1 1,162.9 0.0 4.8 0.0 0.0 4.0 0.0 0.0 0.0 26.0 2,452.0Conveyance Applied Water Use 0.2 0.5 10.2 1.5 48 37.4 0 0 0 0 0 0 0 0 1.3 99.1
Total 4.9 10.1 278.8 35.8 985.1 1,200.3 0.0 4.8 0.0 0.0 4.0 0.0 0.0 0.0 27.3 2,551.1
Urban DemandAW - Residential Use - Single Family - Interior 0.0 0.1 4.3 0.1 15.8 6.6 0.0 0.1 0.2 0.1 0.3 0.1 0.0 0.1 27.8AW - Residential Use - Single Family - Exterior 0.0 0.1 6.5 0.2 24.2 10.0 0.0 0.1 0.3 0.1 0.5 0.1 0.0 0.1 42.2AW - Residential Use - Multi-Family - Interior 0.0 0.1 4.5 0.1 16.7 6.9 0.0 0.0 0.2 0.1 0.3 0.1 0.0 0.1 29.1AW - Residential Use - Multi-Family - Exterior 0.0 0.1 2.7 0.1 10.0 4.1 0.0 0.0 0.1 0.0 0.2 0.0 0.0 0.0 0.0 17.3AW - Commercial Use 0.0 0.0 1.6 0.0 5.8 2.4 0.0 0.0 0.1 0.0 0.1 0.0 0.0 0.0 0.0 10.0AW - Industrial Use 0.0 0.0 2.3 0.1 8.3 3.4 0.0 0.0 0.1 0.0 0.2 0.0 0.0 0.0 0.0 14.4AW - Urban Large Landscape 0.0 0.0 0.7 0.0 2.5 1.0 0.0 0.0 0.0 0.0 0.0 0.0 0.0 0.0 0.0 4.2AW - Energy Production 0.0 0.0 0.0 0.0 0.0 0.0 0.0 0.0 0.0 0.0 0.0 0.0 0.0 0.0 0.0 0.0Applied Water - Groundwater recharge 0.0 0.0 0.0 0.0 0.0 0.0 0.0 0.0 0.0 0.0 0.0 0.0 0.0 0.0 0.0 0.0Conveyance - Applied Water 0.0 0.0 0.5 0.0 1.7 0.7 0.0 0.0 0.0 0.0 0.0 0.0 0.0 0.0 0.0 2.9
Total 0.0 0.4 23.1 0.6 85.0 35.1 0.0 0.2 1.0 0.3 1.6 0.3 0.0 0.0 0.3 147.9
Managed Wetlands DemandApplied Water Use 0 0 0 0 0 3.1 0 0 0 0 0 0 0 0 0 3.1
Total 0 0 0 0 0 3.1 0 0 0 0 0 0 0 0 0 3.1
Total 4.9 10.5 301.9 36.4 1,070.1 1,238.5 0.0 5.0 1.0 0.3 5.6 0.3 0.0 0.0 27.6 2,702.1
Thousand Acre Feet

FINAL DRAFT
Tulare County Phase 1 Water Supply Evaluation June 2009
6
2.2 FUTURE WATER DEMAND Currently, all land in the communities and hamlets, as well as the land in the Urban Development Boundary of each incorporated city is under Tulare County land-use jurisdiction. The future water demand condition assumes that Tulare County retains land-use jurisdiction over all communities and hamlets, as well as development within the Urban Development Boundary. Assuming that the County retains land-use jurisdiction, even if not ultimately the situation, the future demand estimate reflects the most conservative (highest) representation of the potential water resources impacts related to the land-use planning decisions by Tulare County.
First, to estimate the future demand condition, the land use change is analyzed. The change in land use assumes a certain number of irrigated agricultural acres are removed from production and that mixed-use urban development exists instead.4 The estimate of irrigated agricultural acres removed assumes that all Prime Farmland, Farmland of Statewide Importance and Unique Farmland located within the defined growth boundaries of the identified hamlets, communities and cities changes from irrigated agriculture to urban uses. The assumed values are provided in Table 2.2.5 For each acre of agricultural land removed, a commensurate reduction in the annual applied water quantity for the associated historic crop is assumed to also occur.
To estimate the change in applied agricultural water demand (i.e., acre-feet of water per acre of crop) based upon the elimination of irrigated agricultural land, a weighted unit demand was developed using an assumed crop mix, estimated crop evapotranspiration of applied water (ETAW) and assumed irrigation efficiencies. As shown in Table 2.3, the future demand analysis divides irrigated crops into five broad categories – Citrus, Field Crops-Other, Field Crops-Alfalfa/Pasture, Orchards and Vineyards.6 For each crop category an ETAW is provided.7 For the Field Crop and Orchard categories, ETAW is reported as the average of multiple crops in each category.
4 This approach was taken pursuant to conversations with Dave Bryant and Ray Weiss on May 19, 2009. 5 The Prime Farmland, Farmland of Statewide Importance and Unique Farmland categories were developed by the California Department of Conservation. Importantly, both Prime Farmland and Farmland of Statewide Importance are irrigated lands. Unique Farmland is usually irrigated but may include non-irrigated orchards. Importantly, the farmland categories do not include confined animal agriculture, which Department of Conservation tracks separately. Therefore, all acres identified as farmland are assumed to have a water demand. 6 The acreage totals were obtained from the 2003 Tulare County Agricultural Commissioner’s Report. The Agricultural Commissioner’s estimate for irrigated pasture was reduced significantly based upon conversations with DWR field staff, which indicated that very little “improved” irrigated grass pasture remains in Tulare County. 7 ETAW was obtained from the Department of Water Resources based upon field work for the 2009 California Water Plan.

FINAL DRAFT
Tulare County Phase 1 Water Supply Evaluation June 2009
7
Table 2.2 Tulare County Agricultural Land
Prime(acres)
StatewideImportance
(acres)Unique(acres)
Total(acres)
Alpaugh 0 20 0 20Cutler-Orosi 460 780 100 1,340Delano 170 0 0 170Ducor 10 190 0 200Earlimart 540 50 0 590East Orosi 0 90 0 90East Porterville 40 30 0 70Goshen 710 120 0 830Ivanhoe 60 270 0 330Kingsburg 5 210 0 215Lemon Cove 220 200 10 430London 110 20 0 130Patterson Tract 150 0 0 150Pixley 1,230 0 0 1,230Plainview 20 40 20 80Poplar-Cotton Center 490 20 0 510Richgrove 60 140 0 200Springville 10 10 50 70Strathmore 0 340 0 340Terra Bella 60 650 0 710Three Rivers 10 130 0 140Tipton 270 0 0 270Traver 0 450 0 450Woodville 270 0 0 270
Allensworth 0 180 0 180Delft Colony 10 30 0 40East Tulare Villa 0 0 0 0Lindcove 0 190 0 190Monson 90 60 0 150Seville 10 0 0 10Teviston 400 0 0 400Tonyville 0 0 0 0Waukena 80 0 0 80West Goshen 30 110 0 140Yettern 0 10 0 10
Dinuba 2,210 1,060 0 3,270Exeter 1,920 530 0 2,450Farmersville 880 0 0 880Lindsay 1,810 3,420 40 5,270Porterville 2,770 3,760 760 7,290Tulare 6,620 130 10 6,760Visalia 20,370 970 80 21,420Woodlake 570 1,490 210 2,270
59,645
Communities
Hamlets
City UDB
TOTAL

FINAL DRAFT
Tulare County Phase 1 Water Supply Evaluation June 2009
8
Table 2.3 Evapotranspiration of Applied Water
ETAW (in./yr.)Typical
Other Deciduous 33.70Pistachios 34.68
Average 34.19
ETAW (in./yr.)Typical
Alfalfa - Hay 40.33Pasture/Range Irrigated 41.08
Average 40.71
ETAW (in./yr.)Typical
Cotton 26.94Corn and Grain 24.46
Average 25.70
ETAW (in./yr.)Typical
Citrus 26.84
ETAW (in./yr.)Typical
Grape Vines 22.39
Field Crops - Other
Citrus
Vineyards
Orchard
Field Crops - Pasture & Hay
To generate the unit demand for each crop type, an irrigation efficiency between 70 and 80 percent was assumed, depending on typical irrigation methods for crops in each category.8 A weighted unit demand was then developed by multiplying the percentage of total irrigated acreage for each crop category by the unit demand. As shown in Table 2.4, the total weighted unit water demand factor of 3.3 acre-feet per acre was generated by adding all of the crop-specific weighted unit demand factors. Thus, it is assumed that for each acre of agricultural land that comes out of production within the designated areas of urban growth, there is a reduction in applied water demand of 3.3 acre-feet per year (prior to the commensurate increase due to the new urban demand, which is discussed later).
To estimate the reduction in agricultural demand, the weighted unit demand factor shown in Table 2.4 is applied to each acre of agricultural land coming out of production as shown in Table 2.2. The estimated reduction in agricultural demand is approximately 200,000 AF/YR is shown in Table 2.5.
8 Estimated irrigation efficiencies were obtained from DWR. Actual irrigation efficiencies may be higher in many instances. However, the assumptions used in this analysis are conservative.

FINAL DRAFT
Tulare County Phase 1 Water Supply Evaluation June 2009
9
Table 2.4 Weighted Agricultural Unit Demand
Crop Category2003Acres
% of Total Acres
EstimatedETcrop
(inch/ac)
AssumedIrrigationEfficiency
Unit Demand(af/ac)
WeightedUnit Demand
(af/ac)Citrus 109,363 14% 26.8 75% 3.0 0.4Alfalfa and Pasture 104,149 13% 40.7 69% 4.9 0.7Field Frops - Other 359,163 46% 25.7 70% 3.1 1.4Orchards (Deciduous) 142,144 18% 34.2 80% 3.6 0.7Vineyards 60,903 8% 22.4 74% 2.5 0.2Total 775,722 100% 3.3
To estimate the commensurate increase in demand from the new mixed-use urban land use (that is assumed to replace the irrigated agricultural use), a weighted unit demand for the urban classification was developed. An approximate land-use mix was developed based upon review of the City of Fresno’s Urban Water Management Plan (UWMP) and professional judgment from other studies. It is assumed that residential units comprise about 60 percent of the land use in the developing urban areas, with associated land uses such as commercial, industrial, parks and public uses accounting for another 35 percent of the land uses. It is assumed that 5 percent of the land is comprised of other uses such as roads, and it is assumed that these areas are not irrigated. The unit demand factors were taken from the City of Fresno’s UWMP as well.
The residential demand factors will vary by unit density, so an assumed average figure is used to cover a range of densities in each category. The unit demand factors are consistent with observed unit demand factors in other Central Valley communities. For example, in the single-family residential category, assuming a dwelling unit density of five units per acre, the overall unit water demand factor would be 0.70 acre-feet per dwelling unit per year, including the water ‘lost’ from the system during delivery to the customer’s turnout. Assuming 10 percent of this demand is associated with system losses, unit demand would be 0.63 acre-feet per dwelling unit per year at the customer’s turnout, which is consistent with unit demands in other residential communities in the Central Valley. As shown in Table 2.6, the weighed unit demand factor is 3.1 acre-feet per acre.
By applying a weighed unit demand factor of 3.1 acre-feet per acre per year to the mixed-use urban land uses that are assumed to replace the irrigated lands, the resulting commensurate increase in demand is approximately 186,000 acre-feet per year (see Table 2.5). The difference between the existing agricultural demand and the future urban demand is about 13,000 acre-feet per year. Thus, it is assumed that there will be a slight reduction in water demand between that observed on the agricultural lands in the existing condition and that anticipated from the new mixed-use urban demands assumed in the future.

FINAL DRAFT
Tulare County Phase 1 Water Supply Evaluation June 2009
10
Table 2.5 Change in Water Demand
Reduced
Ag Demand(af/yr)
Added Urban Demand
(af/yr)Difference
(af/yr)
Alpaugh -67 63 -4Cutler-Orosi -4,486 4,188 -298Delano -569 531 -38Ducor -670 625 -45Earlimart -1,975 1,844 -131East Orosi -301 281 -20East Porterville -234 219 -16Goshen -2,778 2,594 -185Ivanhoe -1,105 1,031 -73Kingsburg -720 672 -48Lemon Cove -1,439 1,344 -96London -435 406 -29Patterson Tract -502 469 -33Pixley -4,117 3,844 -274Plainview -268 250 -18Poplar-Cotton Center -1,707 1,594 -113Richgrove -670 625 -45Springville -234 219 -16Strathmore -1,138 1,063 -76Terra Bella -2,377 2,219 -158Three Rivers -469 438 -31Tipton -904 844 -60Traver -1,506 1,406 -100Woodville -904 844 -60
00
Allensworth -603 563 -40Delft Colony -134 125 -9East Tulare Villa 0 0 0Lindcove -636 594 -42Monson -502 469 -33Seville -33 31 -2Teviston -1,339 1,250 -89Tonyville 0 0 0Waukena -268 250 -18West Goshen -469 438 -31Yettern -33 31 -2
0 00 0
Dinuba -10,946 10,219 -728Exeter -8,201 7,656 -545Farmersville -2,946 2,750 -196Lindsay -17,641 16,469 -1,173Porterville -24,403 22,781 -1,622Tulare -22,629 21,125 -1,504Visalia -71,704 66,938 -4,766Woodlake -7,599 7,094 -505
-199,662 186,391 -13,271
Communities
Hamlets
City UDB

FINAL DRAFT
Tulare County Phase 1 Water Supply Evaluation June 2009
11
Table 2.6 Weighted Urban Unit Demand
% of Land AreaPer Acre
Unit Factor
(af/ac/yr)
WeightedUnit Demand
(af/ac/yr)SF Residential 48% 3.5 1.7MF Residential 12% 6.0 0.7Commercial 20% 1.9 0.4Industrial 5% 1.9 0.1Parks 5% 3.0 0.2Public 5% 2.0 0.1Other (e.g., Roads) 5% 0.0 0.0
Total n/a n/a 3.1 The reduction in demand also translates into a potential reduction in county-wide demand. Assuming the existing county-wide demand is 2,702,100 acre-feet, and demand is reduced by 13,000 acre-feet per year through a shift to urban uses, then future county-wide demand is assumed to be approximately 2,689,000 acre-feet per year.
On the county-wide scale, this reduction is negligible, especially when compared to overall County estimated demand determined by DWR for 1999 and 2002, which were approximately 2,602,000 acre-feet and 2,857,000 acre-feet per year, respectively. Given the range of demands across years – a factor of cropped acreage in any given year, crop types, urban variances and climatic conditions – the slight reduction in demand assumed to occur from the displacement of irrigated agricultural lands with mixed-use urban demands could be considered negligible.
For purposes of this evaluation and given the preceding analysis, the average County demand represented for 2003 is assumed to also approximate the future baseline water demand condition given the anticipated displacement of irrigated agriculture with mixed-use urban growth. For this evaluation, the future County-wide applied water demand is assumed to be 2,700,000 acre-feet per year, with 2,350,000 acre-feet the average demand for agriculture and 350,000 acre-feet the average demand for urban needs.9
2.3 THE EFFECT OF CONSERVATION AND DEMAND MANAGEMENT Although efforts to conserve water within existing urban and agricultural uses have been on-going, more recent events, directives from the Governor and legislative action all indicate more conservation will be needed in the future. To reflect additional savings from long-term water
9 The subdivision of urban and agricultural demand reflects an estimated reduction of 200,000 acre-feet of agricultural demand, compared to the 2003 value in Table 2.1. A commensurate increase of 200,000 acre-feet occurs in urban demand, compared to the 2003 values in Table 2.1.

FINAL DRAFT
Tulare County Phase 1 Water Supply Evaluation June 2009
12
conservation and demand management efforts, the baseline future demand of 2,700,000 is assumed to be potentially reduced as follows:
Urban demand is reduced by 10 percent – Implementation of 1) landscape ordinances required under State law10 (including water-budget assignments, turf use limitations, and installation of ET controllers), 2) volumetric pricing tied to meter installation, 3) compliance with best management practices (tied to participation in the California Urban Water Conservation Council or as may be required through legislation under consideration), and 4) potential mandates to reduce per-capita use by 20 percent by 2020 (as directed by the Governor in a February 2008 comprehensive water management plan) will have the effect of an average reduction across existing and to-be-built urban demands. Actual County-wide savings may exceed this estimate, but, for purposes of this evaluation, a conservative value is assumed.
o Future urban baseline (without conservation) = 350,000 acre-feet o Future urban baseline (with conservation) = 315,000 acre-feet
Agricultural demand is reduced by 5 percent – Agricultural land in Tulare County is
already some of the most efficiently irrigated cropland in California. Driven by expensive imported contract water, high-lift groundwater pumping, and limitations on the available, managed local surface water, farmers have already implemented most of the cost-effective opportunities. Therefore, the additional savings is limited so as not to potentially overstate the actual potential.
o Future agricultural baseline (without conservation) = 2,350,000 acre-feet o Future agricultural baseline (with conservation) = 2,230,000 acre-feet
When combined, the anticipated effects of conservation and demand management measures in the urban and agricultural sectors are assumed to result in the following County-wide demand estimates:
o Future County-wide baseline (without conservation) = 2,700,000 acre-feet o Future County-wide baseline (with conservation) = 2,545,000 acre-feet
10 See pending California Model Water Efficient Landscape Ordinance, California Code of Regulations Title 23, Sections 490-495.

FINAL DRAFT
Tulare County Phase 1 Water Supply Evaluation June 2009
13
SSSeeeccctttiiiooonnn 333 ––– SSSuuupppppplllyyy CCCooonnndddiiitttiiiooonnnsss This section provides a discussion of the surface and groundwater resources available within Tulare County. A discussion of potential issues that may constrain these demands in the future is also included. This information is used to determine an existing condition as well as provide an analysis of potential future supply conditions, based upon the land use changes contemplated by the General Plan Update.
3.1 SURFACE WATER CHARACTERISTICS The purpose of this subsection is to briefly characterize the surface water supplies in Tulare County. In short, Tulare County receives surface water supplies in approximately equal proportions from local streams and imported water from the Friant-Kern Canal and the Cross Valley Canal. Surface water planning efforts in the County address some identified issues but new challenges are emerging that may impact the overall reliability of Tulare County’s surface water.11
3.1.1 Geographic Descriptions of Watersheds Tulare County encompasses 4,863 square miles in the San Joaquin River Basin. Tulare County is primarily located within DWR’s Tulare Lake Hydrologic Region (Tulare HR).12 The City of Visalia is the major population center in Tulare County, however it is entirely dependent on groundwater for its supply. Tulare HR imports more water than any other HR in the state.13 Surface water supply for Tulare County comes from local streams and rivers, and is imported through the CVP and SWP distribution systems.
3.1.1.1 Local watersheds
Local streams in Tulare County flow from the Sierra Nevada Mountains westwards towards the San Joaquin Valley. Tulare County General Plan defines four watersheds in the County: Kings River Watershed, Kaweah Watershed, Tule Watershed, and Deer Creek/White River Watershed (Figure 3.1). Water districts in the county have developed facilities consisting generally of unlined canals and gravity or low pressure pipelines to take advantage of these locally derived surface water resources.
11 This analysis draws on data from several sources: The Tulare County General Plan Background Report, Chapter 10-2 “Water Resources”, December 2007 (“Chapter 10-2”); the Tulare County General Plan Background Appendix C, July 2007 (“Plan Appendix C”); DWR Bulletin 118-2003 and updated DWR subbasin information found at http://www.groundwater.water.ca.gov/bulletin118/basin_desc/basins_t-y.cfm (accessed May 31, 2009); and DWR Bulletin 160-2005. 12 Some data, notably many of those compiled at the state level by DWR, are aggregated at the level of 10 Hydrologic Regions. Data at this level can be of limited use as these regions do not coincide with administrative or political boundaries, as in the case of Tulare County and Tulare Lake HR. 13 DWR Bulletin 160-2005.

FINAL DRAFT
Tulare County Phase 1 Water Supply Evaluation June 2009
14
Figure 3.1
Tulare County Watersheds14
The Kings River Watershed encompasses 1,742 square miles.15 Demand is primarily agricultural. The primary local water supply comes from the Kings River, through operation of Courtright Reservoir (123,200 acre-feet), Wishon Reservoir (128,300 acre-
14 Note that Figure 3.1 defines the upper boundaries of each watershed as coincident with the Friant-Kern Canal. While this definition is convenient in representing the bulk of the area to which water is supplied for agricultural and urban use, clearly the physical boundaries of each watershed are farther to the east. 15 Chapter 10-2.
FINAL DRAFT
Tulare County Phase 1 Water Supply Evaluation June 2009
15
feet), and Pine Flat Reservoir (1,000,000 acre-feet).16 Yearly average runoff for the Kings River is 1,689,700 acre-feet, although runoff varies greatly depending on annual climatic conditions.
The Kaweah Watershed is south of the Kings River Watershed. The Kaweah River drains 561 square miles of the Sierra Nevada Mountains, and is actually a tributary to the Tule River. The primary source of local water supply is the Kaweah River, and operations of Terminus Reservoir/Lake Kaweah. Lake Kaweah was recently enlarged to 183,800 acre-feet capacity to increase flood protection for downstream communities. Average annual runoff of the Kaweah River is approximately 430,000 acre-feet.
Farther south, the Tule River Watershed is primarily supplied by the Tule River, which drains 390 square miles above Lake Success (capacity 82,300 acre-feet). Average annual runoff of the Tule River is about 136,000 acre-feet.
The Deer Creek/White River Watershed is in the southern portion of the county. Surface supplies emanate from a low-elevation stream group. This area has the highest dependence on imported CVP water of any region in Tulare County. Camp Nelson Water Company diverts water from Belknap Creek for its supply. Springville Public Utility District owns pre-1914 water rights, including rights reserved for the eventual development of land within the district.17
3.1.1.2 Imported Water
The main source of imported water in Tulare County is the Friant Division of the Central Valley Project (CVP). Water is supplied to contractors in Tulare County through the Friant-Kern Canal (Figure 3.1), which runs from Friant Dam/Millerton Reservoir on the San Joaquin River (520,000 acre-feet capacity, 400,000 acre-feet useable to supply irrigation demands). The CVP supplies water to eighteen districts in Tulare County (Table 3.1), provided through an exchange agreement with water rights holders along the lower San Joaquin River. The San Joaquin River right holders are supplied with Delta water in exchange for letting the San Joaquin River water stored at Friant Dam to be delivered along the Friant-Kern canal.
16 Reservoir capacities from California Data Exchange Center, http://cdec.water.ca.gov/misc/resinfo.html, Accessed June 8, 2009. 17 Tulare County Plan Background Appendix C, C-6.

FINAL DRAFT
Tulare County Phase 1 Water Supply Evaluation June 2009
16
Table 3.1 Irrigation Districts in Tulare County
Watershed Entity Surface Water Imported Water Source Groundwater Extraction
Deer Creek/ White River
Alpaugh Irrigation District
NA Friant-Kern Canal (1,000af average)
19,000 af
Alta Irrigation District
King River 163,500 af/yr
Friant-Kern Canal (surplus) 230,000 af
Deer Creek/ White River
Atwell Island 50 (CVC)
Tulare City of Lindsay 2,500 (CVP); 50 (CVC)
Deer Creek/ White River
Delano-Earlimart Irrigation District
NA Friant-Kern Canal (146,050 af average)
8,000 af
Kaweah Exeter Irrigation District
NA Friant-Kern Canal (1,000 af average)
14,000 af
Deer Creek/ White River
Frasinetto Farms
400 (CVC)
Kings Hills Valley Irrigation District
NA Cross Valley Canal (2,000 af average)
1,000 af
Kaweah Ivanhoe Irrigation District
Kaweah River Friant-Kern Canal (11,650 af average)
15,000 af
Kaweah Delta Water Cons. District
Kaweah River Friant-Kern Canal (24,000 af average)
130,000 af
Deer Creek/ White River
Kern-Tulare Water District
Kern River Cross Valley Canal (41,000 af average)
33,000 af
Tulare Lindmore Irrigation District
NA Friant-Kern Canal (44,000 af average)
28,000 af
Lower Tulare River Irrigation Dist.
Tule River Friant-Kern Canal (180,200 af average) Cross Valley Canal (31,000 af average)
NA
Tulare Lindsay-Strathmore Irrigation District
NA Friant-Kern Canal (24,150 af average)
NA
Kings Orange Cove Irrigation District
NA Friant-Kern Canal (39,200 af average)
30,000 af
Pioneer Water Irrigation District
Tule River 3,000 af

FINAL DRAFT
Tulare County Phase 1 Water Supply Evaluation June 2009
17
Tulare Pixley Irrigation District
NA Friant-Kern Canal (1,700 af average) Cross Valley Canal (31,000 af average)
130,000 af
Tulare Porterville Irrigation District
Tule River Friant-Kern Canal (31,000 af average)
15,000 af
Deer Creek/ White River
Rag Gulch Water District
Kern River Friant-Kern Canal (3,700 af average) Cross Valley Canal (13,300 af average)
Tulare Saucelito Irrigation District
Tule River Friant-Kern Canal (37,600 af average)
15,000 af
Kaweah Stone Corral Irrigation District
NA Friant-Kern Canal (10,000 af average)
5,000 af
Deer Creek/ White River
Styro-Tek 45 (CVC)
Tulare Teapot Dome Irrigation District
NA Friant-Kern Canal (5,600 af average)
Deer Creek/ White River
Terra Bella Irrigation District
NA Friant-Kern Canal (29,000 af average)
2,000 af
Kaweah Tulare Irrigation District
Kaweah River Friant-Kern Canal (100,500 af average)
65,000 af
Source: Bookman-Edmonston Engineering Inc. Water Resources Management in the Southern San Joaquin Valley, Table A-1.
The Cross Valley Canal transfers water from the California Aqueduct to the east side of the San Joaquin Valley near Bakersfield. A complex series of conveyance and exchange agreements allows water to be swapped between the Arvin-Edison Water Storage District and five entities in Tulare County that contract for water from Shasta Dam and Reservoir. Water delivered from the Delta via the Cross Valley Canal to the Arvin-Edison Water Storage District is exchanged for a portion of Arvin-Edison’s CVP water supply. The reliability of deliveries from the SWP sources may impact the exchange arrangements with CVP users.
3.1.2 Surface Water Yields The purpose of this section is to describe in general terms yields from local and imported surface water sources. In the baseline year 2003, Tulare County local and imported surface water supplies, as well as reused surface water supplies, were approximately
FINAL DRAFT
Tulare County Phase 1 Water Supply Evaluation June 2009
18
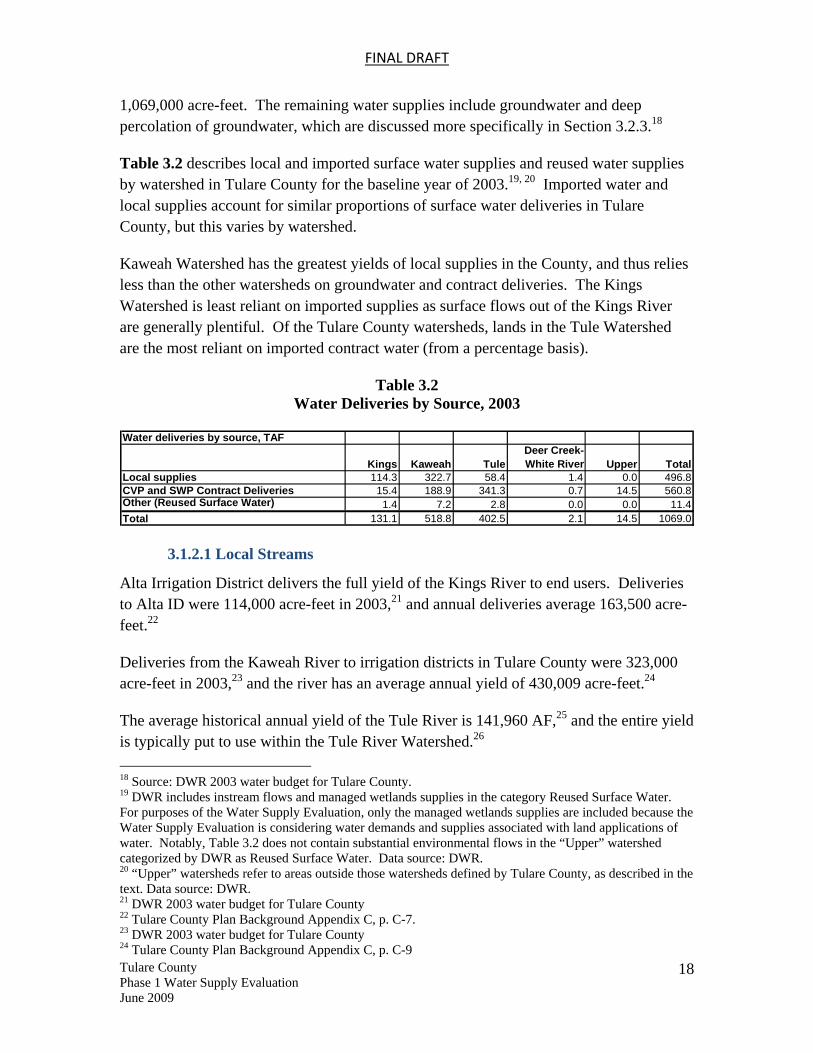
1,069,000 acre-feet. The remaining water supplies include groundwater and deep percolation of groundwater, which are discussed more specifically in Section 3.2.3.18
Table 3.2 describes local and imported surface water supplies and reused water supplies by watershed in Tulare County for the baseline year of 2003.19, 20 Imported water and local supplies account for similar proportions of surface water deliveries in Tulare County, but this varies by watershed.
Kaweah Watershed has the greatest yields of local supplies in the County, and thus relies less than the other watersheds on groundwater and contract deliveries. The Kings Watershed is least reliant on imported supplies as surface flows out of the Kings River are generally plentiful. Of the Tulare County watersheds, lands in the Tule Watershed are the most reliant on imported contract water (from a percentage basis).
Table 3.2 Water Deliveries by Source, 2003
Water deliveries by source, TAF
Kings Kaweah TuleDeer Creek-White River Upper Total
Local supplies 114.3 322.7 58.4 1.4 0.0 496.8CVP and SWP Contract Deliveries 15.4 188.9 341.3 0.7 14.5 560.8Other (Reused Surface Water) 1.4 7.2 2.8 0.0 0.0 11.4Total 131.1 518.8 402.5 2.1 14.5 1069.0
3.1.2.1 Local Streams
Alta Irrigation District delivers the full yield of the Kings River to end users. Deliveries to Alta ID were 114,000 acre-feet in 2003,21 and annual deliveries average 163,500 acre-feet.22
Deliveries from the Kaweah River to irrigation districts in Tulare County were 323,000 acre-feet in 2003,23 and the river has an average annual yield of 430,009 acre-feet.24
The average historical annual yield of the Tule River is 141,960 AF,25 and the entire yield is typically put to use within the Tule River Watershed.26 18 Source: DWR 2003 water budget for Tulare County. 19 DWR includes instream flows and managed wetlands supplies in the category Reused Surface Water. For purposes of the Water Supply Evaluation, only the managed wetlands supplies are included because the Water Supply Evaluation is considering water demands and supplies associated with land applications of water. Notably, Table 3.2 does not contain substantial environmental flows in the “Upper” watershed categorized by DWR as Reused Surface Water. Data source: DWR. 20 “Upper” watersheds refer to areas outside those watersheds defined by Tulare County, as described in the text. Data source: DWR. 21 DWR 2003 water budget for Tulare County 22 Tulare County Plan Background Appendix C, p. C-7. 23 DWR 2003 water budget for Tulare County 24 Tulare County Plan Background Appendix C, p. C-9
FINAL DRAFT
Tulare County Phase 1 Water Supply Evaluation June 2009
19
Deer Creek and White River have only limited and intermittent surface water flows.
3.1.2.2 Imported water
Contracts with the Friant Division of the CVP are very significant for contractors within Tulare County. Class 1 water is the first 800,000 acre-feet of ‘firm’ Friant supply, from which contractors in the County receive a total of 404,900 acre-feet per year.27 Class 2 supplies start to develop after all Class 1 contracts have been filled and total 565,200 acre-feet per year in the County.28 Class 1 supplies are thus much more reliable than Class 2 supplies. CVP facilities statewide deliver their full contract allocations only 20 percent of the time. Tulare County CVP Contractors may also receive “221 Water” which is water available through the CVP system in times of surplus.
Cross Valley Canal deliveries bring up to 128,300 acre-feet of additional water into the region.
Table 3.1 describes in greater detail the contract amounts in each watershed.
3.2 GROUNDWATER CHARACTERISTICS The purpose of this section is to briefly characterize the groundwater supplies in Tulare County. Historically groundwater resources have been extracted to satisfy about one third of existing urban and agricultural demands, but are limited by groundwater basin yield in some locations and water quality issues in others. Groundwater planning efforts in the County address some identified issues but new challenges are emerging that may impact the overall reliability of the County’s groundwater supplies.
3.2.1 Geographic and Hydrogeologic Characteristics Tulare County encompasses 4,863 square miles in the San Joaquin Valley. This analysis focuses on the western portion of the county that overlies the aquifers discussed below. As noted previously, Tulare County is primarily located within DWR’s Tulare Lake Hydrologic Region (Tulare HR).29 The City of Visalia is the major population center in Tulare County, and is entirely dependent on groundwater for its supply.
Tulare County has unconfined groundwater throughout the entire county, and confined groundwater in its western portion underlying the Kings, Kaweah, and Tule Subbasins.
25 Tulare County Plan Background Appendix C, p. C-14 26 Tulare County Plan Background Appendix C, p. C-14 27 Tulare County Plan Background Appendix C, p. C-25, and see tables 28 Tulare County Plan Background Appendix C, p. C-25, and see tables. 29 Some data, notably many of those compiled at the state level by DWR, are aggregated at the level of 10 Hydrologic Regions. Although these data may be the best available on some topics, data at this level can be of limited use as these regions do not coincide with administrative or political boundaries as in the case of Tulare County and Tulare Lake HR.

FINAL DRAFT
Tulare County Phase 1 Water Supply Evaluation June 2009
20
Areas near the King, Kaweah, and Tule Rivers contain highly permeable soils with opportunities for natural and artificial recharge, while the areas between the alluvial fans have less permeable soils. Alluvial deposits containing fresh water commonly exceed 1,000 feet in depth, with the maximum thickness of deposits in the southern end of the San Joaquin Valley at 4,400 feet. An important structure is the Corcoran Clay layer, which can be found in the Kaweah and Tule Subbasins. Where present, this layer restricts water movement, dividing groundwater into a confined layer below the Corcoran Clay and an unconfined layer above it.
Tulare County is primarily underlain by three groundwater subbasins within the San Joaquin Valley basin.30 These subbasins are Kings (5-22.08), Kaweah (5-22.11) and Tule (5-22.13), as defined by DWR. Figure 3.3 shows Tulare County in the context of the State’s aquifers.
The Kings Subbasin underlies 976,000 acres of Fresno, Kings, and Tulare Counties, and is roughly bounded on its southern end by the Kings River Watershed boundary.31 The bulk of this subbasin underlies Fresno County, including the City of Fresno. In the Kings Subbasin, groundwater flows from areas underlying Fresno County into aquifers underlying the Kings River area. Well yields in the Kings Subbasin average 500-1,500 gallons per minute (gpm), with a maximum of 3,000 gpm, and an average depth of 210 feet.
The Kings Subbasin is a “Type C,” or low level of knowledge, basin, indicating that there is not enough data to estimate its groundwater extraction or a groundwater budget.32 Estimates of specific yields for the basin ranges from 0.2 percent to 36 percent, with a recent estimate of 11.3 percent on average.33
The Kaweah Subbasin underlies 446,000 acres, primarily in Tulare County, with its western portion underlying Kings County. Within Tulare County, the Kaweah Subbasin coincides with the Kaweah River Watershed. Well yields in Kaweah Subbasin average 1,000-2,000 gallons per minute (gpm), with a maximum of 2,500 gpm, with well depths ranging from 100-500 feet. The estimated average specific yield for this subbasin is 10.8 percent.34
30 DWR Bulletin 118-2003, and see Figure 3.3. Note that these basin designations may not be based on detailed local study. 31 Watershed boundaries referred to here are as described in the Tulare County General Plan, and shown in Figure 3.1. 32 See DWR Bulletin 118-2003, p. 110 for category descriptions. 33 DWR Bulletin 118, Kings Subbasin Update, 1/20/06. 34 DWR Bulletin 118, Kaweah Subbasin Update, 2/27/04.

FINAL DRAFT
Tulare County Phase 1 Water Supply Evaluation June 2009
21
Figure 3.335 Groundwater basins in California.
35DWR Bulletin 118-2003.

FINAL DRAFT
Tulare County Phase 1 Water Supply Evaluation June 2009
22
The Kaweah subbasin has a “Type B” level of groundwater balance knowledge, indicating a use-based estimate of its groundwater budget. The Kaweah River is the major source of recharge to the area. DWR estimates natural recharge to be 62,400 acre-feet per year. There are approximately 286,000 acre-feet of applied water recharged into the subbasin, and an unknown amount of artificial recharge. Annual urban and agricultural extraction is estimated to be 58,800 acre-feet and 699,000 acre-feet, respectively. Other extractions and subsurface inflow were not determined. The Tule Subbasin is in the southwestern portion of Tulare County, underlying 467,000 acres. Within Tulare County, the Tule Subbasin coincides with the Tule River, Deer Creek and White River watersheds. There are hydrogeologic connections between Tulare County and Kern and/or Kings Counties adjoining Tule Subbasin.36 The estimated average specific yield for this subbasin is 9.5 percent.37 Land subsidence of 12 to 16 feet has occurred in the subbasin in the past. Maximum well yields in the Tule Subbasin are 3,000 gpm, with average yields not reported. Tule Subbasin has a “Type B” level of groundwater balance knowledge. Natural recharge is estimated at 34,000 acre-feet per year, and there are about 201,000 acre-feet of applied water recharge. Annual urban extraction is estimated to be 19,300 acre-feet per year, and annual agricultural extraction was estimated to be 641,000 acre-feet per year. Other extractions and subsurface inflow and outflow were not determined.38 In the Foothills region outside of these defined Subbasins, groundwater is also used, with extractions primarily derived from unconfined aquifers. In the eastern portion of the county in the Sierra Foothills, wells are less productive as the groundwater aquifer characteristics are less suitable to large-scale groundwater storage. Specifically, moving into the foothills the permeable and loamy soils give rise to fractured rock aquifers. Nevertheless, in certain areas communities have been successful in harnessing groundwater from these types of aquifers. Figure 3.4 shows the enumerated groundwater sub-basins underlying Tulare County.
36 The Tule Subbasin is probably at least partially defined based on political, rather that hydrogeologic characteristics. A small portion of Tulare Lake Subbasin (5-22.12) underlies Tulare County, but is not detailed in this analysis. 37 DWR B118, Tule Subbasin Update, 2/27/04. 38 DWR Bulletin 118, Tule Subbasin Update, 2/27/04.

FINAL DRAFT
Tulare County Phase 1 Water Supply Evaluation June 2009
23
Figure 3.439 Groundwater Subbasins - Tulare Hydrologic Region
39 DWR Bulletin 118-2003.

FINAL DRAFT
Tulare County Phase 1 Water Supply Evaluation June 2009
24
3.2.2 Overview of Groundwater Quality Detailed discussion of groundwater quality is beyond the scope of this effort, but below is a general overview of groundwater quality in Tulare County. In most areas of Tulare County, groundwater quality is acceptable for agricultural and urban uses through normal treatment and delivery operations. Where local impairments exist, the primary constituents of concern are high TDS, nitrate, arsenic, and organic compounds such as herbicides, pesticides and fertilizers, as well as instances of radiological parameters such as uranium and radium 228. However, these are not of significant concern across most of the subbasins. The salinity of groundwater typically increases in a westward direction across the San Joaquin Valley. Conversely, nitrates and radiological components present near the Sierra foothills region decrease with distance from the Foothills. The Kings Subbasin’s groundwater near the Sierra foothills may be high in nitrates and sometimes radiological contaminants, and there are localized instances of pesticide impairment.40 Farther from the foothills, naturally occurring contaminants are diluted by surface water recharge, and replaced with organic contaminants. All communities in the Kings Subbasin are influenced by water quality issues to some extent.41 The Kaweah subbasin has high nitrate areas on its eastern side where TDS values typically range from 300-600 mg/L. The Tule Subbasin has some of the most significant issues in the County, with chlorides, nitrates, and DBCP extending several miles from the Sierra foothills including beneath the City of Lindsay. Water quality in this area is variable. Communities along the Highway 99 axis have access to good quality deep and shallow sources, while water quality in other areas is unacceptable due to arsenic and other naturally occurring contaminants. Arsenic is a locally specific problem. For example, several communities, such as Alpaugh, had wells brought into noncompliance when Maximum Contaminant Levels for arsenic were reduced from 50 ppb to 10 ppb.
3.2.3 Groundwater use and overdraft in Tulare County As mentioned in Section 3.1.2, Tulare County relies on a combination of local surface water, imported surface water, and groundwater to meet its agricultural and urban demands. Groundwater is particularly important as a water source in the region. DWR classifies groundwater supplies according to two distinct categories. The first is Net Groundwater and the second is Deep Percolation of Surface and Groundwater. Net 40 DWR B118, Kings Subbasin Update, 1/20/06. 41 Plan Appendix C, C-8.

FINAL DRAFT
Tulare County Phase 1 Water Supply Evaluation June 2009
25
Groundwater is the remainder of Total Groundwater Supply (calculated based upon groundwater withdrawals) and Deep Percolation of Surface and Groundwater. Deep Percolation of Surface and Groundwater is a distinct supply that ultimately resides in the groundwater basin, but originates as applied water from both surface and groundwater sources prior to percolation into the basin. Thus, the baseline groundwater supply is assumed to be the combination of these two sources, which for 2003 was about 1,633,000 acre-feet.
Table 3.2 Water Deliveries by Groundwater Source
Water deliveries by source, TAF
Kings Kaweah TuleDeer Creek-White River Upper Total
Groundwater (Net) 111 226 462 3 14 815GW (Deep Perc. of Surface and GW) 107 326 374 0 12 818Total 218 551 836 3 25 1633 Groundwater has historically accounted for 41% of total water supply in Tulare HR, among the highest percentages in the State.42 In addition, the sum total use of groundwater in Tulare HR is higher than the total groundwater use in any other HR. The Kings, Tule, and Kaweah Basins were all among 11 basins identified by DWR in 1980 as being in a ‘critical condition of overdraft’.43 Groundwater pumping increases in Tulare County when surface supplies available to the County are reduced. Surface water supplies have been reduced in recent years due to drought, environmental restrictions, and other factors (see Section 3.3 below). Estimates of groundwater overdraft vary for the Tulare Lake HR. Total overdraft has been recently estimated at 820,000 acre-feet per year,44 while historical overdraft has been estimated at 308,000 acre feet per year for the period 1921-1993.45 DWR estimated changes in groundwater storage for the Tulare HR over a range of recent water year types as +263,000 acre feet in 1998, -1,625,000 acre-feet in 2000, and -4,115,000 acre feet in 2001.46 42 DWR Bulletin 118-2003, Table 12, p. 113. 43 Water Code §12924. ‘A basin is subject to critical conditions of overdraft when continuation of present water management practices would probably result in significant adverse overdraft-related environmental, social, or economic impacts.’ (DWR Bulletin 118-2003, p. 98). As of 2003, this determination has not been revisited. 44 Chapter 10-2, citing DWR. 45 U.S. Bureau of Reclamation (1997) Central Valley Project Improvement Act, Draft Programmatic Environmental Impact Statement. Documents and Model Runs. USBR, Sacramento, CA, as cited in Harou, J. and J. Lund (2008). "Ending groundwater overdraft in hydrologic-economic systems." Hydrogeology Journal 16(6): 1039-1055. 46 DWR Bulletin 160-2005, p. 8-7.

FINAL DRAFT
Tulare County Phase 1 Water Supply Evaluation June 2009
26
In Tulare County, groundwater yields tend to increase with distance from the foothills. However, since demands for groundwater increase as well, groundwater overdraft also tends to increase in the westward direction.47 Subsidence has occurred in various parts of the County. In the Kaweah Subbasin, subsidence of up to 4 feet has occurred due to compaction. In response to such overdraft, there are at least 19 entities in Tulare County with active groundwater management programs.48 Among the larger programs are those administered by the Kaweah Delta Water Conservation District, the Kings River Water Conservation District, the Tulare Irrigation District, the Lower Tule Water Users Association, and the Alta Irrigation District, and the Kings River Water Conservation District.
3.3 ISSUES AFFECTING SUPPLIES Section 3.3 describes specific issues affecting surface water and groundwater supplies in Tulare County that could have an impact on land-use planning decisions over the 20 year planning period. These issues include: Groundwater Overdraft; the San Joaquin River Restoration Settlement; Population Growth within and near Tulare County; Joint Management of Shared Aquifers; Groundwater Adjudications; Water Transfers and Exchanges; Delta Supply Issues; Climate Change and Variability; and Institutional Changes to the Water Regulatory Framework, .
3.3.1 Groundwater Overdraft As described in previous sections, the groundwater basin in the Tulare Lake HR has experienced substantial overdraft. In addition to depletion of water faster than it can be naturally or artificially recharged, declining water tables can impact the basin as a resource. Impacts can include (i) increased pumping expenses, (ii) impacts to water quality, and (iii) subsidence that can in some cases permanently decrease the storage capacity of the aquifer. Thus, overdraft itself can have effects beyond depletion of an existing quantity of water, but also can impact the ability to use the basin as a storage facility. The future value of such storage capacity in California is potentially very high, and should be taken into account in today’s groundwater management. It should also be noted that such impacts are not limited to the portions of the basin directly underlying the water user responsible for the overdraft, but can impact neighboring users as well.
47 Plan Appendix C. 48 Chapter 10-2.

FINAL DRAFT
Tulare County Phase 1 Water Supply Evaluation June 2009
27
3.3.2 San Joaquin River Restoration Settlement The San Joaquin River Restoration Settlement (SJR Settlement) could lead to decreased flows in the Friant-Kern Canal, resulting in reduced imported surface water supplies to some CVP contractors in Tulare County (see Table 3.1). One of the main purposes of building the Friant-Kern Canal was to reduce groundwater pumping in the southern San Joaquin Valley. As such, to the extent that these surface supply reductions cannot be compensated for by increased water use efficiency, water users may increase groundwater pumping in the region. The result may be exacerbation of existing declining water tables or initiation of overdraft where an aquifer was previously in a general balanced condition. Though the specific impact to Tulare County CVP contractors from the SJR Settlement is not fully understood (e.g. the SJR Settlement calls for mitigation, but will require substantial time and investment), this analysis cannot speculate on any reduction in surface water resources that would be directly attributable to the SJR Settlement.
3.3.3 Population Growth Within and Near Tulare County Cities in the region, including Visalia, Exeter, Fresno, Bakersfield, and others, rely on groundwater for much or all of their water supply. Increases in urban water demand resulting from population growth may be offset by decreases in other forms of water use (i.e. agricultural water conversion) or increases in water use efficiency. But the nature and extent of agricultural water conversion and water use efficiency measures is not known. Moreover, the hydrogeologic implications of increased localized pumping in groundwater basins (i.e. the potential for cones of depression) are not known. Current regional trends suggest that future urban growth may rely on groundwater supplies to meet demand.
In addition to its increase in demands for groundwater, urbanization may negatively affect groundwater recharge. Urbanization generally reduces the amount of permeable surfaces for percolation of water into underlying basins. Urban planning efforts that include development of permeable surfaces in urban settings, infiltration basins, and other measures for stormwater capture can offset such effects, while providing flood control benefits. Nevertheless, the extent and impacts of future urban growth in Tulare County on natural groundwater recharge is not fully known and should be considered in future planning efforts.
3.3.4 Joint Management of Shared Aquifers Declining groundwater levels adjacent to Tulare County can affect groundwater yields and sustainability in Tulare County. Any development or management in adjacent counties that overly shared subbasins may adversely impact Tulare County’s ability to manage its own groundwater supplies.
FINAL DRAFT
Tulare County Phase 1 Water Supply Evaluation June 2009
28
The importance of managing groundwater across political boundaries in this region has been recognized. For example, an Integrated Regional Water Management Plan for the Kings River Basin acknowledges the need for collaboration between Fresno, Kings, and Tulare Counties, and includes recharge efforts to help mitigate for historic overdrafting of the basin.
3.3.5 Groundwater Adjudications Although hydrologic connections between surface water and groundwater are well-documented, California groundwater law is for the most part separate from surface water law. Landowners overlying groundwater aquifers may drill wells and extract water for use on their land, correlative to neighboring landowners. Where surplus groundwater supplies are available, groundwater may be appropriated for use on non-overlying lands. Most agricultural extractions are considered overlying use while urban extractions are generally considered groundwater appropriations.
Conflicts over the nature and extent of groundwater use can result in lawsuits that force adjudication of a groundwater basin. In such cases, a court determines how much groundwater each owner can extract, and enforces limitations on each user’s water allocations. An adjudication process within any of the subbasins in the County could impact supplies available to manage for existing and anticipated demands.
3.3.6 Water Transfers and Exchanges As patterns of demand change in Tulare County, both spatially and with respect to classes of use, water transfers and exchanges may become increasingly important. As described above, water exchange arrangements already provide some imported water supplies to the County. Short-term transfers negotiated on the spot market currently make up the bulk of water transfers in the state, and can be an effective solution to drought conditions. However, reducing the long-term risk of drought-induced water shortfalls may necessitate the increase of longer-term agreements such as dry-year options that are triggered by specific water conditions. Challenges in water transfers are largely institutional: they include the need for better quantification and monitoring of water rights, the need to document and alleviate third-party impacts, and the need to streamline the water transfer process. Expanding the potential for transfer and exchanges in Tulare County may expand the portfolio of water supplies available to the County – thereby improving overall water supply reliability when some sources decline. In contrast, if locally generated water resources are allowed to transfer outside of the County, an impact to the overall availability and reliability of water for County needs could result.

FINAL DRAFT
Tulare County Phase 1 Water Supply Evaluation June 2009
29
3.3.7 Delta Supply Issues Delta water issues have broad implications throughout the state of California – even to areas that seem far removed from its locale. In Tulare County, water supplies are derived directly from the San Joaquin River via the Friant-Kern Canal and the Sacramento-San Joaquin Delta via the California Aqueduct and Cross Valley Canal through exchange arrangements with State Water Project water users. Any change to the water distribution systems in the Delta has immediate impact on the reliability of surface deliveries in Tulare County. The complex legal framework links deliveries of San Joaquin water directly to deliveries from the Delta.
For instance, the San Joaquin River Basin Exchange Contractors hold contract rights with the United States Bureau of Reclamation to replace the Contractors’ San Joaquin River water rights with water exported from the Sacramento-San Joaquin Delta in order to build and use Friant Dam. If USBR is unable to deliver Delta water to the Exchange Contractors, the Exchange Contractors may call for the water to be released from Friant Dam under the terms of their contracts, assuring their water supply but impacting Friant Division CVP contractors in Tulare County. Accordingly, issues affecting Delta exports have direct impacts on the water supply reliability issues in Tulare County.
3.3.8 Climate Change and Variability Climate change will affect California’s water resources through changes in precipitation patterns49 and through temperature warming that will change the seasonal patterns of streamflow around which California’s water resources system has been developed.50 California’s water system depends on the storage of water in three different ways: seasonal snowpack that delays runoff from winter precipitation until later in the water year when demands are higher; surface storage in the form of dams, lakes and reservoirs; and groundwater percolation and storage.
While there is growing consensus among scientists and water managers that climate change will impact water systems, the implications of climate change on these three classes of reservoirs are understood with varying levels of clarity. First, it is understood with high confidence that results of temperature modeling consistently suggest that California’s snowpack will decrease in coming decades, resulting in earlier patterns of runoff.
Second, it is very likely that operations of California’s surface water system will be affected from both the increased difficulty of balancing flood control and water storage,
49 Seager, R., M. Ting, et al. (2007). "Model Projections of an Imminent Transition to a More Arid Climate in Southwestern North America." Science 316(5828): 1181-1184. 50 Vicuna, S. and J. Dracup (2007). "The evolution of climate change impact studies on hydrology and water resources in California." Climatic Change 82(3): 327-350.
FINAL DRAFT
Tulare County Phase 1 Water Supply Evaluation June 2009
30
increasing the risk of sub-optimal use of storage. Also, increasing demands may be expected based on higher ET requirements or changed cropping patterns.
Third, there are reasons to expect that climate change may impact groundwater even though the direct climate connection is less well-understood.51 For example, changes in patterns of recharge are expected to result from changes in runoff patterns. However, the expected runoff change only increases the flow during existing peak recharge periods, so capturing of the additional runoff may be challenging. Climate change may also alter demands for groundwater indirectly, through changes in demand for and supply of surface water.
3.3.9 Institutional Issues Affecting Water Supplies The purpose of this section is to briefly note some institutional factors, including legal, regulatory, and legislative, that may impact both groundwater and surface water supplies in Tulare County over the coming decades.
3.3.9.1 Potential changes in California Groundwater Law
The potential also exists for future legislation to change California’s groundwater regulations, and if so might change the way groundwater is used in Tulare County and elsewhere.52
Other states have recognized the potential for problems arising from lack of groundwater management. The Arizona legislature, for example, implemented policies in the 1980s and 1990s to quantify rights to use groundwater supplies and to store groundwater. Colorado has integrated rights to pump groundwater with surface water rights doctrine, and has a watershed-based system of regional water governance, as opposed to California’s reliance largely on local decision-making.
The point of describing other legal frameworks is to highlight the fact that there are other ways of managing groundwater and surface water, and to point out that the law evolves over time. If future legislation changes the way groundwater and surface water are regulated in California, it could change the way the resource can be used in Tulare County.
51 Dettinger, M. D. and S. Earman (2007). "Western ground water and climate change—Pivotal to supply sustainability or vulnerable in its own right?" Association of Ground Water Scientists and Engineers Newsletter June 2007, 4-5. 52 Groundwater depletion can have long-term adverse impacts not only on the basin directly underlying a groundwater user, but also on neighboring property owners, Thus, an unregulated groundwater basin can result in a ‘tragedy of the commons’ where the resource as a whole is impacted because it is not managed for the collective good. Such commons problems can be seen as motivation for increased regulation.

FINAL DRAFT
Tulare County Phase 1 Water Supply Evaluation June 2009
31
3.3.9.2 Regulatory Risk
The term “regulatory risk” when used by drinking water purveyors refers to the uncertainty in future regulations. For example, risks to the acceptability of drinking water quality in a given water source can be brought on not by changes in the quality of the water supply itself, but by tightening of drinking water standards, or by uncertainty in the impacts of regulation.53 Trends towards more restrictive water quality standards may continue in future, possibly rendering existing sources of water unusable for some purposes.
3.3.9.3 Water Supply and Use Legislation
In recent years, policies have been introduced to mitigate increasing water use in the State. One pending example is DWR’s 20 x 2020 program, which seeks to reduce per capita urban water use by 20% across the state per the February 2008 directive from the Governor. While legislation is still pending, if passed it will affect demand trajectories. Naturally, urban demands are a function of efficiency and population, so population growth greater than 20% could outstrip potential total demand reduction benefits from efficiency measures, resulting in continued increased demand and groundwater impacts. But the rate of decline may be slowed or reversed by such legislation, at least in the short term. Similarly, there has been increasing attention in California towards connections between land use change and water supply.54 For example, a water purveyor must prove that it has sufficient water to meet the demands of a development that has 500 units or more. Such trends in water planning and management are likely to continue as the fresh water resources become more scarce. 3.4 SUMMARY OF WATER SUPPLIES The baseline water supplies generally include surface and ground water. Specifically, surface water supplies include imported and local supplies as well as reused surface water (primarily managed wetlands applications). Also, groundwater includes both net groundwater and deep percolation of surface and ground water. Based on the analysis in Section 3, the baseline (2003) supply condition used in Section 4 assumes the following:
1,069,000 surface water; and
1,633,000 acre feet of groundwater.
53 MacGillivray, B. H., P. D. Hamilton, et al. (2006). "Risk analysis strategies in the water utility sector: An inventory of applications for better and more credible decision making." Critical Reviews in Environmental Science and Technology 36(2): 85-139. 54 Arnold, C. A., Ed. (2005). Wet Growth: Should Water Law Control Land Use. Washington DC, Environmental Law Institute.
FINAL DRAFT
Tulare County Phase 1 Water Supply Evaluation June 2009
32
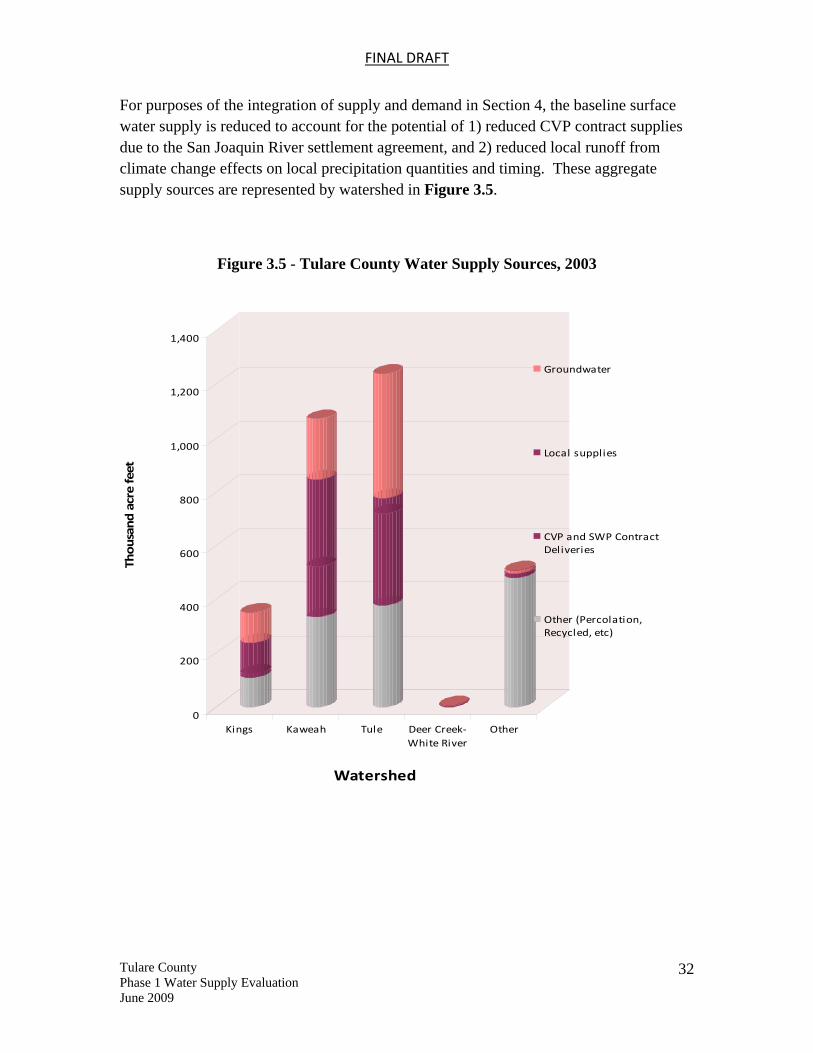
For purposes of the integration of supply and demand in Section 4, the baseline surface water supply is reduced to account for the potential of 1) reduced CVP contract supplies due to the San Joaquin River settlement agreement, and 2) reduced local runoff from climate change effects on local precipitation quantities and timing. These aggregate supply sources are represented by watershed in Figure 3.5.
Figure 3.5 - Tulare County Water Supply Sources, 2003
0
200
400
600
800
1,000
1,200
1,400
Thousand
acre feet
Kings Kaweah Tule Deer Creek‐White River
Other
Watershed
Groundwater
Local supplies
CVP and SWP ContractDeliveries
Other (Percolation,Recycled, etc)
FINAL DRAFT
Tulare County Phase 1 Water Supply Evaluation June 2009
33
SSSeeeccctttiiiooonnn 444 ––– IIInnnttteeegggrrraaatttiiiooonnn Integrating the supply and demand information detailed in Sections 2 and 3 provides an understanding of the potential availability of water supplies to serve the land use changes anticipated with adoption of the General Plan Update.
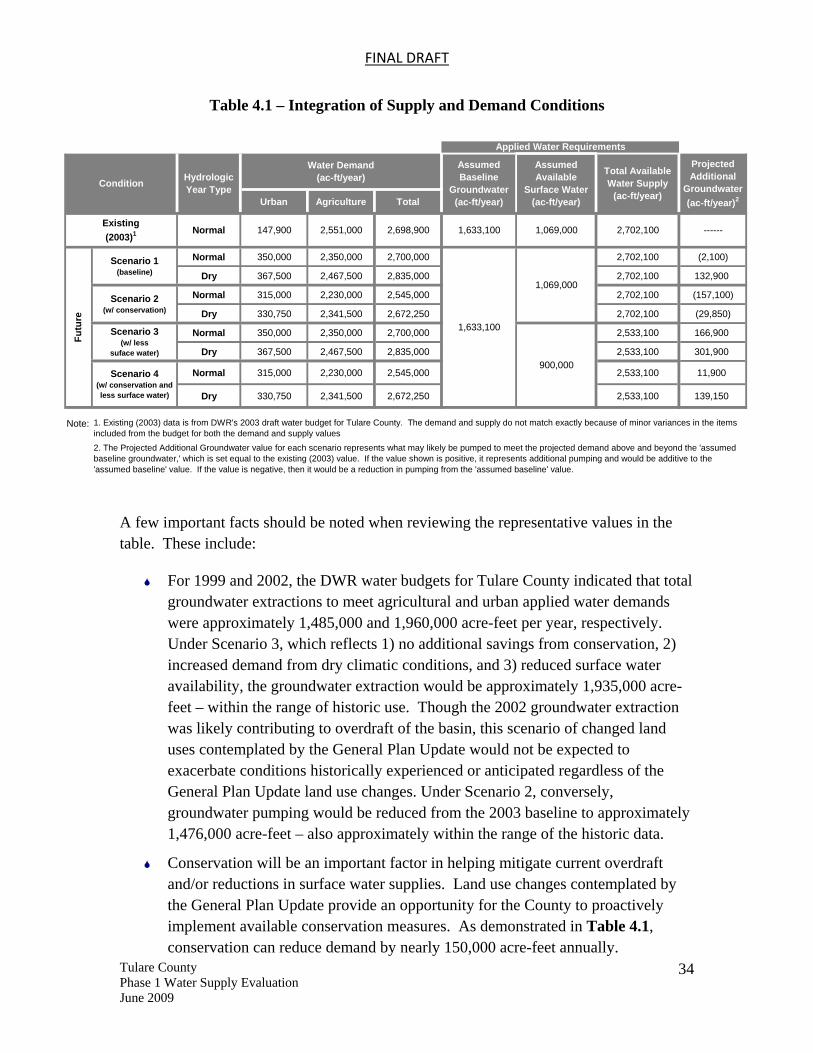
4.1 FUTURE SCENARIOS To assist with determining potential impacts from the policies and land use changes contemplated by the General Plan Update, several scenarios were developed to represent plausible future supply and demand conditions. The resulting integration of the supply and demand scenarios are shown in Table 4.1. Scenarios were developed using the information from Sections 2 and 3 and include:
Scenario 1 – this scenario represents the future baseline demand without conservation and assumes that the surface water and groundwater supplies are available as historically used;
Scenario 2 – this scenario represents future demands with the conservation savings discussed in Section 2.3, with surface and groundwater supplies available as historically used;
Scenario 3 – this scenario represents future baseline demands without conservation and assumes surface water resources are constrained, as discussed in Section 3;
Scenario 4 – this scenario represents future demands with conservation and assumes surface water resources are constrained.
For each scenario, demand is represented for ‘normal’ and ‘dry’ conditions, where dry conditions reflect a 5 percent increase in overall demand due to reduced rainfall and increased temperatures, resulting in increased evapotranspiration of agricultural crops and urban landscaping.
FINAL DRAFT
Tulare County Phase 1 Water Supply Evaluation June 2009
34
Table 4.1 – Integration of Supply and Demand Conditions
A few important facts should be noted when reviewing the representative values in the table. These include:
For 1999 and 2002, the DWR water budgets for Tulare County indicated that total groundwater extractions to meet agricultural and urban applied water demands were approximately 1,485,000 and 1,960,000 acre-feet per year, respectively. Under Scenario 3, which reflects 1) no additional savings from conservation, 2) increased demand from dry climatic conditions, and 3) reduced surface water availability, the groundwater extraction would be approximately 1,935,000 acre-feet – within the range of historic use. Though the 2002 groundwater extraction was likely contributing to overdraft of the basin, this scenario of changed land uses contemplated by the General Plan Update would not be expected to exacerbate conditions historically experienced or anticipated regardless of the General Plan Update land use changes. Under Scenario 2, conversely, groundwater pumping would be reduced from the 2003 baseline to approximately 1,476,000 acre-feet – also approximately within the range of the historic data.
Conservation will be an important factor in helping mitigate current overdraft and/or reductions in surface water supplies. Land use changes contemplated by the General Plan Update provide an opportunity for the County to proactively implement available conservation measures. As demonstrated in Table 4.1, conservation can reduce demand by nearly 150,000 acre-feet annually.
Urban Agriculture Total
Normal 350,000 2,350,000 2,700,000 2,702,100 (2,100)
Dry 367,500 2,467,500 2,835,000 2,702,100 132,900
Normal 315,000 2,230,000 2,545,000 2,702,100 (157,100)
Dry 330,750 2,341,500 2,672,250 2,702,100 (29,850)
Normal 350,000 2,350,000 2,700,000 2,533,100 166,900
Dry 367,500 2,467,500 2,835,000 2,533,100 301,900
Normal 315,000 2,230,000 2,545,000 2,533,100 11,900
Dry 330,750 2,341,500 2,672,250 2,533,100 139,150
Note:
Applied Water Requirements
Total Available Water Supply
(ac-ft/year)
Projected Additional
Groundwater(ac-ft/year)2
Condition
Assumed Available
Surface Water(ac-ft/year)
1,633,100
1,069,000
900,000Scenario 4
(w/ conservation and less surface water)
2. The Projected Additional Groundwater value for each scenario represents what may likely be pumped to meet the projected demand above and beyond the 'assumed baseline groundwater,' which is set equal to the existing (2003) value. If the value shown is positive, it represents additional pumping and would be additive to the 'assumed baseline' value. If the value is negative, then it would be a reduction in pumping from the 'assumed baseline' value.
Assumed Baseline
Groundwater(ac-ft/year)
1. Existing (2003) data is from DWR's 2003 draft water budget for Tulare County. The demand and supply do not match exactly because of minor variances in the items included from the budget for both the demand and supply values
147,900 1,633,100 1,069,000 2,702,100 ------
Hydrologic Year Type
NormalExisting(2003)1
Futu
re
Water Demand(ac-ft/year)
2,698,9002,551,000
Scenario 1(baseline)
Scenario 2(w/ conservation)
Scenario 3(w/ less
suface water)

FINAL DRAFT
Tulare County Phase 1 Water Supply Evaluation June 2009
35
The surface water supply under Scenarios 3 and 4 are arbitrarily assumed to be reduced to 900,000 acre-feet. This reflects an unknown but potential reduction in 1) CVP contract supplies imported into the County due to the San Joaquin River settlement agreement, and 2) reduced local runoff from climate change effects on local precipitation quantities and timing.
4.2 CONCLUSION As demonstrated in this analysis, the actions contemplated in the General Plan Update are not anticipated to cause overall demand in the County to vary from within the range of demands seen historically and documented by DWR – a range of about 2,600,000 acre-feet to 2,850,000 acre-feet.
However, the shift in land use from irrigated agriculture to mixed-use urban development will likely result in the following two potential impacts:
Urban uses will predominantly seek to be served by pumping groundwater on lands that may have previously been served with surface water. Though a few instances of treated surface water for urban needs are in place or being discussed, the vast majority of current urban needs in the County are met with groundwater. Thus, there may be an increase in groundwater extraction to serve the expanded urban needs. [Note that if irrigated agricultural lands displaced by the new urban demand were previously using groundwater, there is theoretically no change in the amount of groundwater extraction. Only in cases where lands were previously served with surface water would there be a likely increase in the total extraction of groundwater.]
o As discussed in Section 3, there is also a likelihood of increased groundwater extraction regardless of adoption of the General Plan Update. This increase, though impacting the County, is not an impact caused by the actions contemplated by the General Plan Update.
Because new or existing urban purveyors will be serving these new urban demands with groundwater, a potentially different supply source than that used by agricultural purveyors on the same land, urban purveyors will be expanding water supply entitlements to the groundwater.