turning the tables-final - oxfam america · turning the tables 3 vacillating public commitments to...
TRANSCRIPT
Oxfam America Research Backgrounders
Turning the Tables: Global trends in public agricultural investments Melinda Smale, Kelly Hauser, and Nienke Beintema with Emily Alpert
Turning the Tables 2
Oxfam America’s Research Backgrounders
Oxfam America’s Research Backgrounders are designed to inform and foster discussion about topics critical to poverty reduction. The series explores a range of issues on which Oxfam America works—all within the broader context of international development and humanitarian relief. The series was designed to share Oxfam America’s rich research with a wide audience in hopes of fostering thoughtful debate and discussion. All Backgrounders are available as downloadable PDFs on our website, www.oxfamamerica.org/research, and may be distributed and cited with proper attribution.*
Topics of Oxfam America’s Research Backgrounders are selected to support Oxfam’s development objectives or key aspects of our policy work. Each Backgrounder represents an initial effort by Oxfam to inform the strategic development of our work, and each is either a literature synthesis or original research, conducted or commissioned by Oxfam America. All Backgrounders have undergone peer review.
Oxfam America’s Research Backgrounders are not intended as advocacy or campaign tools; nor do they constitute an expression of Oxfam America policy. The views expressed are those of the authors—not necessarily those of Oxfam. Nonetheless, we believe this research constitutes a useful body of work for all readers interested in poverty reduction.
Backgrounders available:
1. “Making Investments in Poor Farmers Pay: A review of evidence and sample of options for marginal areas,” by Melinda Smale and Emily Alpert
2. “Turning the Tables: Global trends in public agricultural investments,” by Melinda Smale, Kelly Hauser, and Nienke Beintema, with Emily Alpert
Forthcoming:
3. “A Compendium of Data on US Official Development Assistance to Agriculture” (working title), by Kelly Hauser
* For permission to publish a larger excerpt, please email your request to [email protected].
Author information Melinda Smale, Kelly Hauser, and Emily Alpert are with Oxfam America. Nienke Beintema is head of the Agricultural Science and Technology Indicators (ASTI), based within IFPRI’s International Service for National Agricultural Research (ISNAR) Division.
Turning the Tables 3
Vacillating public commitments to agriculture
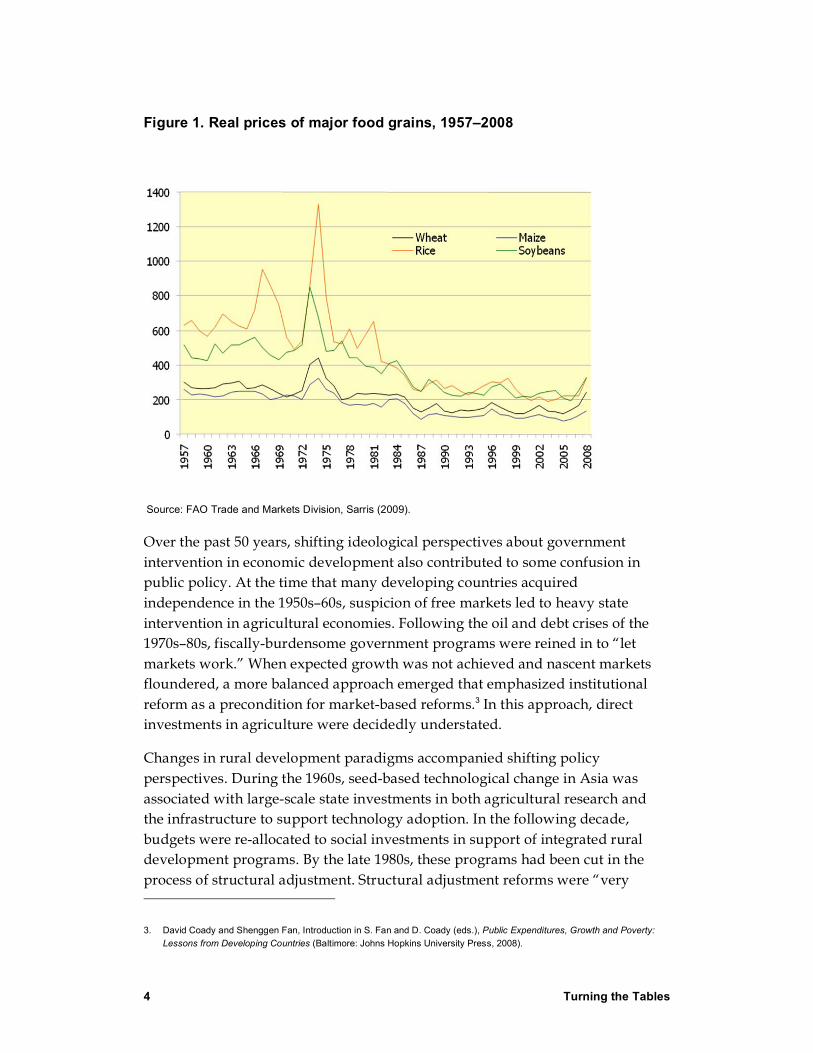
The 20th century witnessed unprecedented growth in agricultural productivity spurred by technological change and predicated on the commitments of governments to invest in agricultural research and development (R&D) and supporting sectors. In developing agricultural areas, spectacular growth occurred most visibly in the locus of the rice- and wheat-based “Green Revolutions” of Asia. Such growth contributed in recent years to a public complacency about the world food supply; in development circles, it was common to hear experts emphasize entitlements to food over constraints to food production. The public was lulled by the fact that “at the end of the 20th century, crop prices were at their lowest point in all recorded history.”1 Even the extraordinarily sharp price hike of 1973 was followed by a downward trend in real prices of bulk commodities. This trend flattened from the late 1980s, and some observers suggested that the long-term decline had ended.2 It was not until the food price crisis of 2008, however, that public complacency also came to end (Figure 1).
1. Robert E. Evenson and Mark Rosegrant, “The Economic Consequences of Crop Genetic Improvement Programmes,” Chapter 23 in R.E. Evenson and D. Gollin (eds.), Crop Variety Improvement and Its Effect on Productivity: The Impact of International Agricultural Research (Wallingford, UK: CABI Publishing, 2003): 495.
2. Organization of Economic Co-operation and Development (OECD), Prospects for Agricultural Productivity Growth: A Developing Country Assessment, Report 11 (2009) of the Group on Commodity Markets, Working Party on Agricultural Policies and Markets, Trade and Agriculture Directorate, Committee for Agriculture.
Turning the Tables 4
Figure 1. Real prices of major food grains, 1957–2008
Source: FAO Trade and Markets Division, Sarris (2009).
Over the past 50 years, shifting ideological perspectives about government intervention in economic development also contributed to some confusion in public policy. At the time that many developing countries acquired independence in the 1950s–60s, suspicion of free markets led to heavy state intervention in agricultural economies. Following the oil and debt crises of the 1970s–80s, fiscally-burdensome government programs were reined in to “let markets work.” When expected growth was not achieved and nascent markets floundered, a more balanced approach emerged that emphasized institutional reform as a precondition for market-based reforms.3 In this approach, direct investments in agriculture were decidedly understated.
Changes in rural development paradigms accompanied shifting policy perspectives. During the 1960s, seed-based technological change in Asia was associated with large-scale state investments in both agricultural research and the infrastructure to support technology adoption. In the following decade, budgets were re-allocated to social investments in support of integrated rural development programs. By the late 1980s, these programs had been cut in the process of structural adjustment. Structural adjustment reforms were “very
3. David Coady and Shenggen Fan, Introduction in S. Fan and D. Coady (eds.), Public Expenditures, Growth and Poverty: Lessons from Developing Countries (Baltimore: Johns Hopkins University Press, 2008).
Turning the Tables 5
deleterious through their effects on indiscriminate reduction of public expenditure,” which “strikes agriculture very hard.”4 In the 1990s, what became known as the “Washington Consensus on Food, Agricultural and Rural Development” gained popularity, redirecting policy interest toward poverty reduction through “sustainable livelihoods.”5 Other reasons for the neglect of agriculture as a sector were that donors sought “quick fixes” to poverty via cash transfers; agriculture was blamed for environmental damage and in development theory, farming was viewed as “a sunset industry.”6
Once more, the 2008 World Development Report placed agriculture, and poverty reduction through agriculture-led growth, at center stage of the Washington policy agenda. The ongoing food, fuel, and financial “crises” have provided an opportunity to revisit what may have gone wrong (or right) with agricultural policy and pinpoint causal relationships, but crisis-motivated policy design is unlikely to solve real agricultural problems. Long-term commitment to investing more, and more wisely, is needed.
The central tenets of this review are that a) global agricultural growth cannot be sustained without a renewed public commitment to invest more and more efficiently in agriculture and supporting sectors, and particularly in agricultural R&D; and b) the world’s rural poor will not earn their share of the benefits from agricultural growth without public commitment to establishing the institutions and policies that mediate the impacts of technical change in agriculture. This paper is one of two papers produced by Oxfam America as background information to support the Oxfam International agricultural campaign.7 The first paper explores specific investment options for programs and interventions designed to address the needs of farmers “left behind” by past productivity gains.8
This second paper reviews the state of expert knowledge on the relationship of agricultural growth and poverty, details why public investments in agriculture are fundamental, and summarizes trends in these investments by national governments, national and international agricultural research organizations, and
4. John Mellor, Pro-Poor Growth: The Relation between Growth in Agriculture and Poverty Reduction (report prepared for USAID/G/EGAD under Purchase Order PCE-0-00-99-00018-00, John Mellor Associates, Inc., Washington, DC, 1999): 20.
5. Catherine Ashley and Simon Maxwell, “Rethinking Rural Development,” Development Policy Review 19 (4, 2001): 395–425.
6. Elizabeth Sadoulet, personal communication with author, Dec 12, 2008.
7. The background research papers were produced as background for an OI briefing paper on public investments in agriculture. Emily Alpert, Melinda Smale, and Kelly Hauser, Investing in Poor Farmers Pays: Rethinking how to invest in agriculture, Oxfam International Briefing Paper 129 (Oxford: Oxfam International, 2009).
8. Melinda Smale and Emily Alpert, “Making Investments in Poor Farmers Pay: A review of evidence and sample of options for marginal areas,” Oxfam America Research Backgrounder number 1 (Boston: Oxfam America, 2009).
Turning the Tables 6
bilateral and multilateral donors. Below, in the section titled “The importance of public investments in agriculture for poor people,” we begin by enumerating the evidence-based arguments that link public investments in agriculture to growth and poverty reduction in developing economies. We report data that depict trends in official development assistance in the section titled “Official Development Assistance to agriculture,” with additional information in Annex 1. In the section titled “National expenditures in agriculture,” we report some summary information on national public investments in agriculture. Among areas of public agricultural investment, investments in agricultural R&D have generated substantial social benefits and particularly high returns in terms of productivity and poverty reduction. For this reason, in the section titled “The importance of public investments in agricultural R&D for poor countries,” we focus on agricultural R&D. We recapitulate the well-known argument for public investments in agricultural R&D, summarize recent evidence on the pivotal importance of agricultural R&D to growth in poor countries, and report data. Working definitions of agricultural research, agricultural productivity, and agricultural investments are found in Box 1.9
Box 1. Working definitions of agricultural research, agricultural productivity, and agricultural investments
Agricultural research
Agricultural science is composed of the aspects of natural, economic, and social science that are used in the practice and understanding of agriculture. Agricultural science includes research and development on production techniques, improving agricultural productivity, transformation of primary products into consumer products, prevention and protection from adverse environmental outcomes, food production and demand, and research on both industrial and non-industrial agricultural systems. Agricultural research and development is conducted by numerous actors, including national and international research institutions, universities, private firms, non-governmental organizations, farmers’ organizations, and individual farmers.
Vernon Ruttan described publicly-funded experiment stations or research institutes “as a system for transforming intellectual and physical capital into new knowledge and new technology. This knowledge is made available in research papers, books, bulletins, and information releases and in consultations with other scientists, science administrators, technicians, extension workers, and producers of agricultural and industrial products. It is frequently embodied in blueprints, formulas, models, seeds,
9. It is important to recognize that investments in other sectors such as rural health and education support productivity growth in the agricultural sector, although we do not discuss these here.
Turning the Tables 7
and chemicals. And its social and economic impact is ultimately realized in the form of technical or institutional change.”10
Agricultural productivity
“Agricultural productivity is a measure of the amount of agricultural output that can be produced with a given level of inputs. Agricultural productivity can be defined and measured in a variety of ways, including the amount of a single output per unit of a single input (e.g., tons of wheat per hectare of land), or in terms of an index of multiple outputs divided by an index of multiple inputs (e.g. the value of all farm outputs divided by the value of all farm inputs). Different measures of agricultural productivity may be of interest in addressing different questions. Labor productivity is interesting, for example, because it helps determine the incomes and welfare of people employed in agriculture (including the majority of rural people in developing countries). Land productivity is interesting because it helps determine the amount of land needed to meet future world food needs—and thus the potential level of pressure on land currently providing other environmental services. Estimates of total factor productivity (TFP) seem to measure differences or changes in the overall productivity or efficiency of agricultural production.”11
Public agricultural investments
We consider investments by governments and international organizations in agricultural R&D and other sectors (roads, rural education and health, electricity, telecommunications) that support agricultural development at several scales or levels of analysis: global and national sectoral allocations, and institutional source of funds. We include not only capital but recurring expenditures as investments, although this distinction is crucial in some contexts. The justification for a fluid definition is the need to assess the potential areas of policy interest for Oxfam in their advocacy with donors and governments.
10. Vernan Ruttan, Agricultural Research Policy (Minneapolis: University of Minnesota Press, 1982).
11. Kieth Wiebe (ed.), Land Quality, Agricultural Productivity, and Food Security (Cheltenham, UK: Edward Elgar, 2008): 6–7.
Turning the Tables 8
The importance of public investments in agriculture for poor people
Agriculture and economic growth There is renewed debate about the role of agriculture in economic growth, aptly summarized by Hazell et al. and Diao et al.12 Despite the historical fact that, with a few exceptions, most countries have been unable to achieve economic growth without growth in agriculture,13 some analysts argue that in an increasingly globalized, urbanized world, agriculture-led growth may no longer be a viable option for today’s poorer nations.14
The arguments for and against agriculture-led growth relate to the strength of linkages between agriculture and other sectors, alternative paths to economic growth, technical feasibility, the policy environment, and poverty impacts. Some argue that agriculture’s linkages may be weaker in today’s liberalized economies than those associated with manufacturing and services, suggesting instead that trade liberalization and foreign direct investment can open better opportunities. Others advance the viewpoint that the best technological opportunities have been exhausted and that with few technological options for fragile environments, combined with increasing diversification to off-farm income sources, farmers on marginal lands would be better off ”laying down their hoes.” Certainly there is little policy tolerance today for the sort of public investments that bolstered the Green Revolution in Asia and are needed for Africa today—especially when governments cannot be held accountable.15
12. Hazell, Colin Poulton, Steve Wiggins, and Andrew Dorward, The Future of Small Farms for Poverty Reduction and Growth, 2020 Vision Discussion Paper 42 (Washington, DC: IFPRI, 2007); Xinshen Diao, Peter Hazell, Danielle Resnick, and James Thurlow, The Role of Agriculture in Development: Implications for Sub-Saharan Africa, IFPRI Research Report 153 (Washington, DC: IFPRI, 2007).
13. Douglas Gollin, Stephen Parente, and Richard Rogerson, “The Role of Agriculture in Development,” American Economic Review 92 (May 2002): 160–164.
14. Caroline Ashley and Simon Maxwell (eds.), “Rethinking Rural Development,” Development Policy Review 19 (December 2001).
15. See Ibid; Xinshen Diao, Peter Hazell, Danielle Resnick, and James Thurlow, The Role of Agriculture in Development: Implications for Sub-Saharan Africa, IFPRI Research Report 153 (Washington, DC: IFPRI, 2007).
Turning the Tables 9
There are counterarguments for each of these arguments. In most African and Central American economies, no viable urban or industrial-driven source of growth has yet emerged. Dependence on nonfarm income is common in both developing and developed agriculture (and not, in and of itself, evidence of transitioning out of agriculture). More migration to urban areas will further exacerbate urban problems caused by a bloated, underemployed population. Moreover, according to most statistics, poverty in Africa, Asia, and Central America (as compared to South America) continues to be rural.
Admittedly, though supported by data, all of these are essentially normative arguments that will take years to resolve post facto with empirical evidence. The economic arguments that relate agricultural growth to poverty reduction are summarized next, along with some recent research findings.
Agricultural-led economic growth and poverty One of the strongest arguments for government investment in agriculture is that it can reduce poverty. Empirical investigation confirms that agricultural growth is “causally prior to growth in manufacturing and services, but the reverse is not true.”16 As stated by Coady and Fan, economic growth is a necessary but not a sufficient condition for poverty reduction. They argue that three policy conditions make it sufficient: a) growth needs to be more intensive in labor; b) the asset base of poor households needs to be strengthened (education and health) so that they can participate; and c) short-term public transfers are required to protect and increase the consumption of the poorest households until they benefit from increased growth and more productive employment opportunities. It follows from these conditions that where agriculture’s share of employment is relatively large, as is the case in many developing countries, the role of agriculture in broad-based growth can be salient and the “invisible hand”17 of agricultural policy is fundamental for achieving poverty reduction.18
Growth in gross domestic product (GDP) has an ambiguous effect on inequality, but agricultural growth is “always pro-poor.”19 The linkages between
16. Colin Thirtle, Xavier Irz, Lin Lin, Victoria McKenzie-Hill, and Steve Wiggins, Relationship between Changes in Agricultural Productivity and the Incidence of Poverty in Developing Countries, DFID Report No. 7946 (UK: DFID, 2001): 2.
17. In economics, the invisible hand is the term economists use to describe the self-regulating nature of the marketplace, coined as a metaphor by Adam Smith in The Wealth of Nations (1776)
18. Coady and Fan, Public Expenditures, Growth and Poverty.
19. Thirtle, Lin, McKenzie-Hill, and Wiggins, Relationship between Changes, 2; see also Xavier Irz, Lin Lin, Colin Thirtle, and Steve Wiggins, “Agricultural Productivity Growth and Poverty Alleviation,” Development Policy Review 19 (4, 2001): 449–466.
Turning the Tables 10
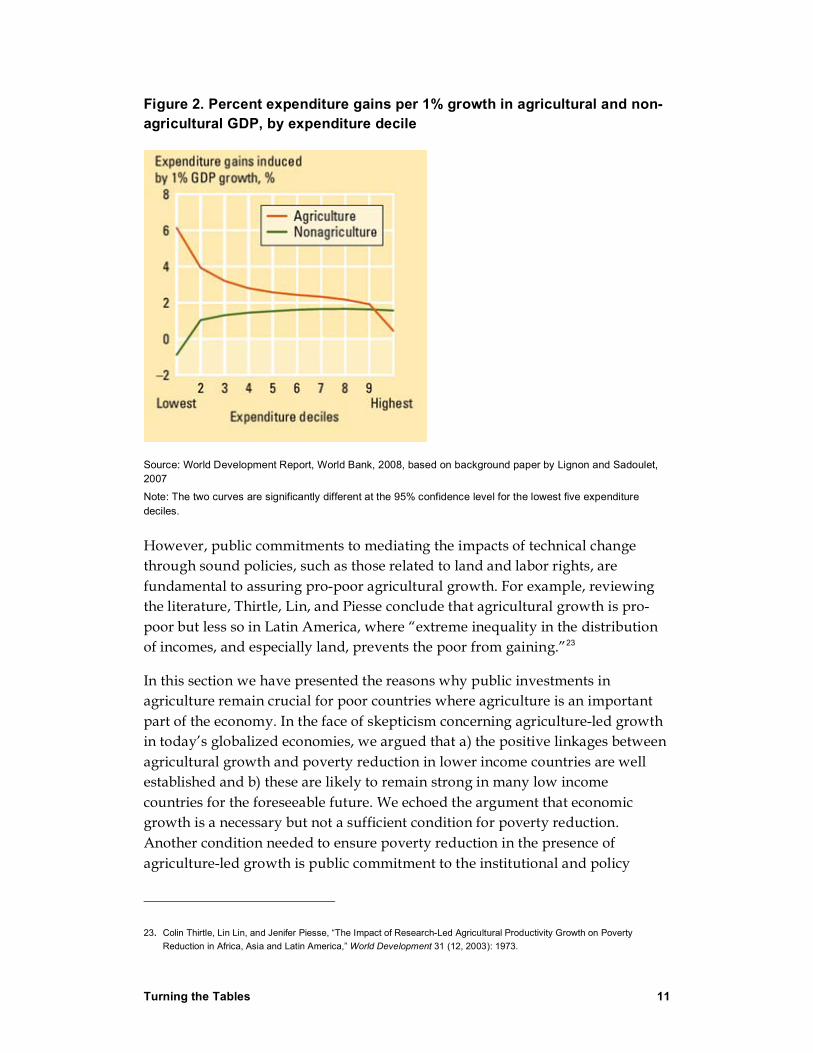
agricultural growth and reduction of both rural and urban poverty are also well established in the development literature:20 the majority of the world’s poor live in rural areas and derive a large share of their income from agriculture; agricultural growth increases rural wages in both farm and nonfarm employment; agricultural growth may also reduce food prices in urban areas.21 Figure 2, generated by rigorous econometric analysis,22 illustrates conclusively that the expenditure (income) gains are many times greater per 1% increase in agricultural as compared to non-agricultural GDP for poorest households (roughly 6% as compared to -1%). Income gains induced by agricultural growth decline with rising expenditure deciles, but remain higher than those induced by non-agricultural growth until the highest decile, where they cross.
20. E.g., Mellor, Pro-Poor Growth; C. Peter Timmer, “The Agricultural Transformation,” in H. Chenery and T.N. Srinivasan (eds.), Handbook of Development Economics, Vol. 1 (Amsterdam: North Holland, 1988); C. Peter Timmer, How Well Do the Poor Connect to the Growth Process, CAER Discussion Paper 178 (Cambridge: Harvard Institute for International Development (HIID), 1997); C. Peter Timmer, “Agriculture and Economic Development,” in B. Gardner and G. Rausser (eds.,) Handbook of Agricultural Economics, Vol. 2 (Philadelphia: Elsevier, 2002): 1893–1943; Martin Ravallion and Gaurav Datt, “How Important to India’s Poor is the Sectoral Composition of Economic Growth?,” The World Bank Economic Review 10 (1, 1996): 1–26; Martin Ravallion and Gaurav Datt, When is Growth Pro-Poor? Evidence from the Diverse Experiences of India’s States, Policy Research Working Paper No. 2263 (Washington, DC: World Bank, 1999); Francois Bourgignon and Christian Morrisson, “Inequality and Development: The Role of Dualism,” Journal of Development Economics 57 (1998): 233–257; Shenggen Fan, Peter Hazell and Sukhadeo Thorat, Linkages between Government Expenditures, Growth, and Poverty in Rural India, IFPRI Research Report 110 (Washington, DC: IFPRI, 1999); World Bank, World Development Report 2000/2001: Attacking Poverty (Washington, DC: The World Bank, 2000).
21. Shenggen Fan and Neetha Rao, "Public Investment, Growth, and Rural Poverty," in S. Fan (ed.), Public Expenditures,
Growth and Poverty: Lessons from Developing Countries, 59 (Baltimore: Johns Hopkins University Press, 2008).
22. Ethan Ligon and Elizabeth Sadoulet, Estimating the Effects of Aggregate Agricultural Growth on the Distribution of Expenditures, background paper for the World Development Report 2008, World Bank, Washington, DC, 2007.
Turning the Tables 11
Figure 2. Percent expenditure gains per 1% growth in agricultural and non-agricultural GDP, by expenditure decile
Source: World Development Report, World Bank, 2008, based on background paper by Lignon and Sadoulet, 2007
Note: The two curves are significantly different at the 95% confidence level for the lowest five expenditure deciles.
However, public commitments to mediating the impacts of technical change through sound policies, such as those related to land and labor rights, are fundamental to assuring pro-poor agricultural growth. For example, reviewing the literature, Thirtle, Lin, and Piesse conclude that agricultural growth is pro-poor but less so in Latin America, where “extreme inequality in the distribution of incomes, and especially land, prevents the poor from gaining.”23
In this section we have presented the reasons why public investments in agriculture remain crucial for poor countries where agriculture is an important part of the economy. In the face of skepticism concerning agriculture-led growth in today’s globalized economies, we argued that a) the positive linkages between agricultural growth and poverty reduction in lower income countries are well established and b) these are likely to remain strong in many low income countries for the foreseeable future. We echoed the argument that economic growth is a necessary but not a sufficient condition for poverty reduction. Another condition needed to ensure poverty reduction in the presence of agriculture-led growth is public commitment to the institutional and policy
23. Colin Thirtle, Lin Lin, and Jenifer Piesse, “The Impact of Research-Led Agricultural Productivity Growth on Poverty Reduction in Africa, Asia and Latin America,” World Development 31 (12, 2003): 1973.
Turning the Tables 12
reforms needed to address the social changes that accompany technical change and ease adjustments for poor people. One simple example is land tenure reform that allows farmers to choose to sell their farms. Next, we present global trends in official development assistance and national public investment in agriculture.
Turning the Tables 13
Official Development Assistance to agriculture
Oxfam examination of data on ODA to agriculture by recipient and subsector was limited to a sample of one hundred of the low to middle-upper income developing countries in Asia, the Pacific, Latin America, and Africa. The omitted countries in the data were either small islands or countries in Central Asia and Eastern Europe. Development Assistance Committee (DAC) member countries include: Australia, Austria, Belgium, Canada, Denmark, Finland, France, Germany, Greece, Ireland, Italy, Japan, Luxembourg, Netherlands, New Zealand, Norway, Portugal, Spain, Sweden, Switzerland, United Kingdom, United States, and the Commission of the European Communities. In this section, unless otherwise mentioned, the term “agriculture” includes forestry and fishing. The Organisation for Economic Co-operation and Development (OECD) did not consider these separate sectors until 1995. Hence, we consider agriculture to include forestry and fishing across the entire time series. From 1995 to 2006, the mean share of forestry and fishing within agriculture was 20%, with a maximum of 33% and a minimum of 14%. Sub-sector data provided insight into forestry and fishing commitments prior to 1995.
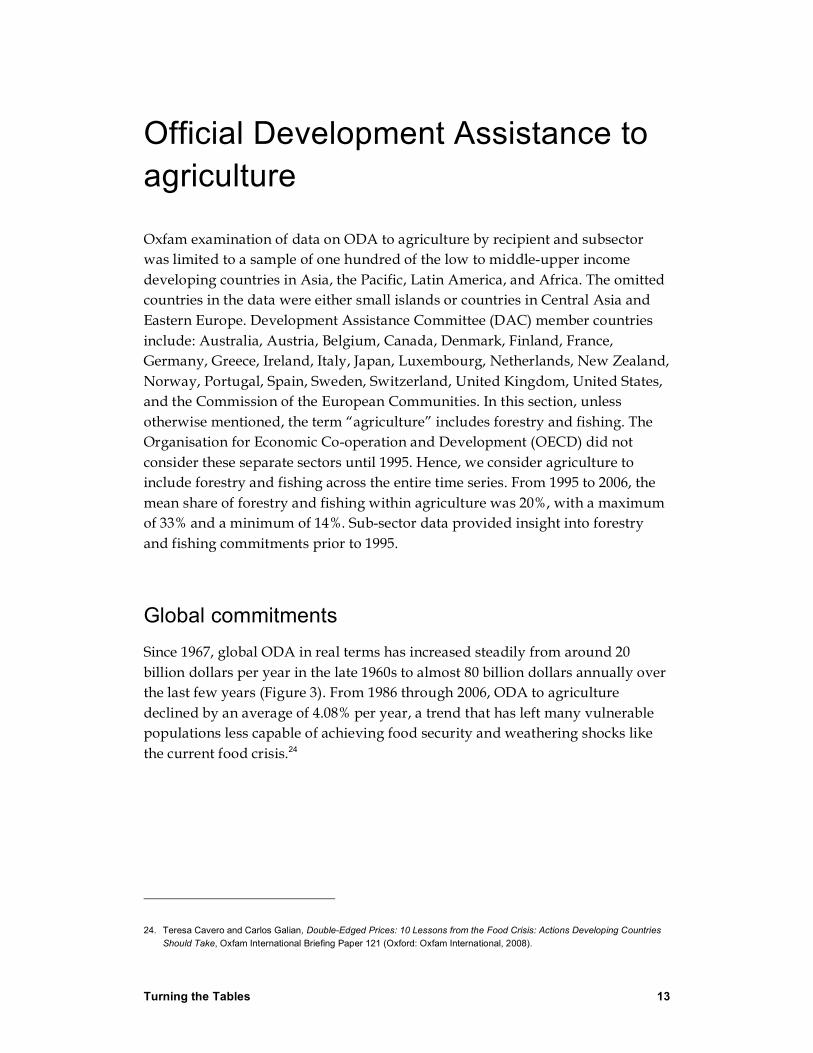
Global commitments Since 1967, global ODA in real terms has increased steadily from around 20 billion dollars per year in the late 1960s to almost 80 billion dollars annually over the last few years (Figure 3). From 1986 through 2006, ODA to agriculture declined by an average of 4.08% per year, a trend that has left many vulnerable populations less capable of achieving food security and weathering shocks like the current food crisis.24
24. Teresa Cavero and Carlos Galian, Double-Edged Prices: 10 Lessons from the Food Crisis: Actions Developing Countries Should Take, Oxfam International Briefing Paper 121 (Oxford: Oxfam International, 2008).
Turning the Tables 14
Figure 3. Total global DAC commitments of Official Development Assistance (ODA)
Source: Authors’ calculations of data from DAC Aid Database, based on commitments expressed in 2006 US dollars.
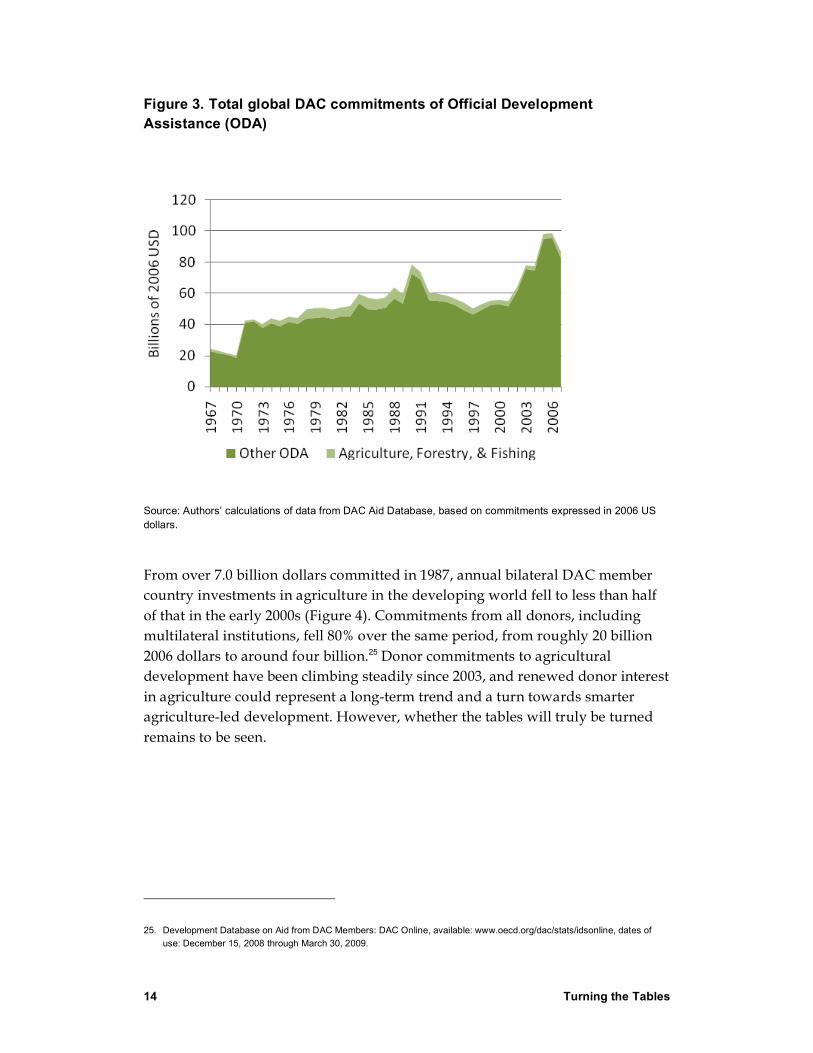
From over 7.0 billion dollars committed in 1987, annual bilateral DAC member country investments in agriculture in the developing world fell to less than half of that in the early 2000s (Figure 4). Commitments from all donors, including multilateral institutions, fell 80% over the same period, from roughly 20 billion 2006 dollars to around four billion.25 Donor commitments to agricultural development have been climbing steadily since 2003, and renewed donor interest in agriculture could represent a long-term trend and a turn towards smarter agriculture-led development. However, whether the tables will truly be turned remains to be seen.
25. Development Database on Aid from DAC Members: DAC Online, available: www.oecd.org/dac/stats/idsonline, dates of use: December 15, 2008 through March 30, 2009.
Turning the Tables 15
Figure 4. Magnitude of Official Development Assistance (ODA) commitments to agriculture
Source: Authors’ calculations of data from the DAC Aid Database, based on commitments expressed in 2006 US dollars.
In 1986, agriculture made up almost 10% of total official ODA. By 2006, that share had shrunk to less than 2%. Development assistance to the transport, storage, communications, and energy sectors also shrunk during the period from 1986 to 2006. Allocations to these sectors fell from more than 20% of total ODA in the mid-1990s to less than 10% in 2006, a decrease of more than 50%. However, over the same period, shares of donor funds allocated to humanitarian aid, action related to debt, donor and NGO administrative costs, and social infrastructure and services other than health and education increased.
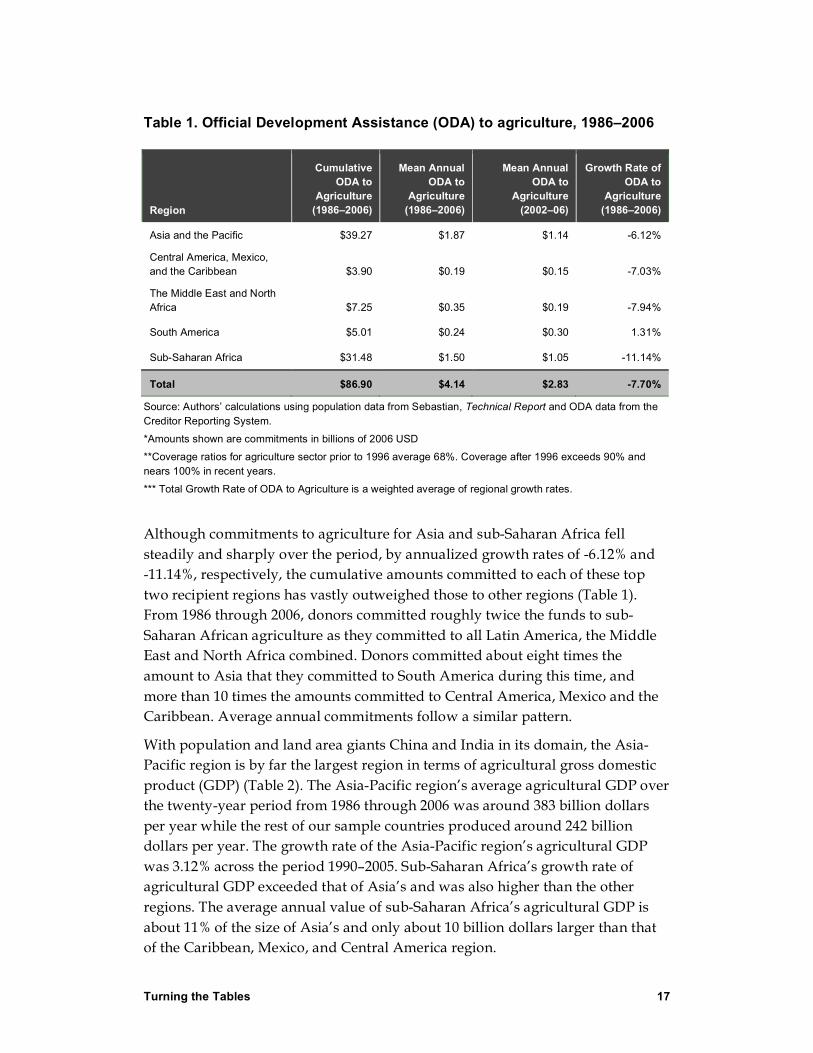
Regional commitments Figure 5 shows commitment levels of ODA to agriculture by region over the period 1986–2006. Sub-Saharan Africa and Asia have been the primary recipients of ODA to agriculture over this period. Since its peak in 1988, ODA to African agriculture has fallen more than aid to other regions of the world, falling by 67% (from 3.5 billion to 1.5 billion dollars) between the years 1988 and 1991, and a similar pattern is visible for Asia and the Pacific. Since 1994, both regions have received around one billion dollars per year in agricultural assistance.

Turning the Tables 16
Consistently, commitments to Latin America, the Middle East, and North Africa are low by comparison.
Figure 5. Official Development Assistance (ODA) to agriculture by region
Source: Authors’ calculations based on commitments reported to the Creditor Reporting System (2008) and extracted from OECD. Stat in 2006 US dollars.
*Coverage ratios for agriculture sector prior to 1996 average 68%. Coverage after 1996 exceeds 90% and nears 100% in recent years.
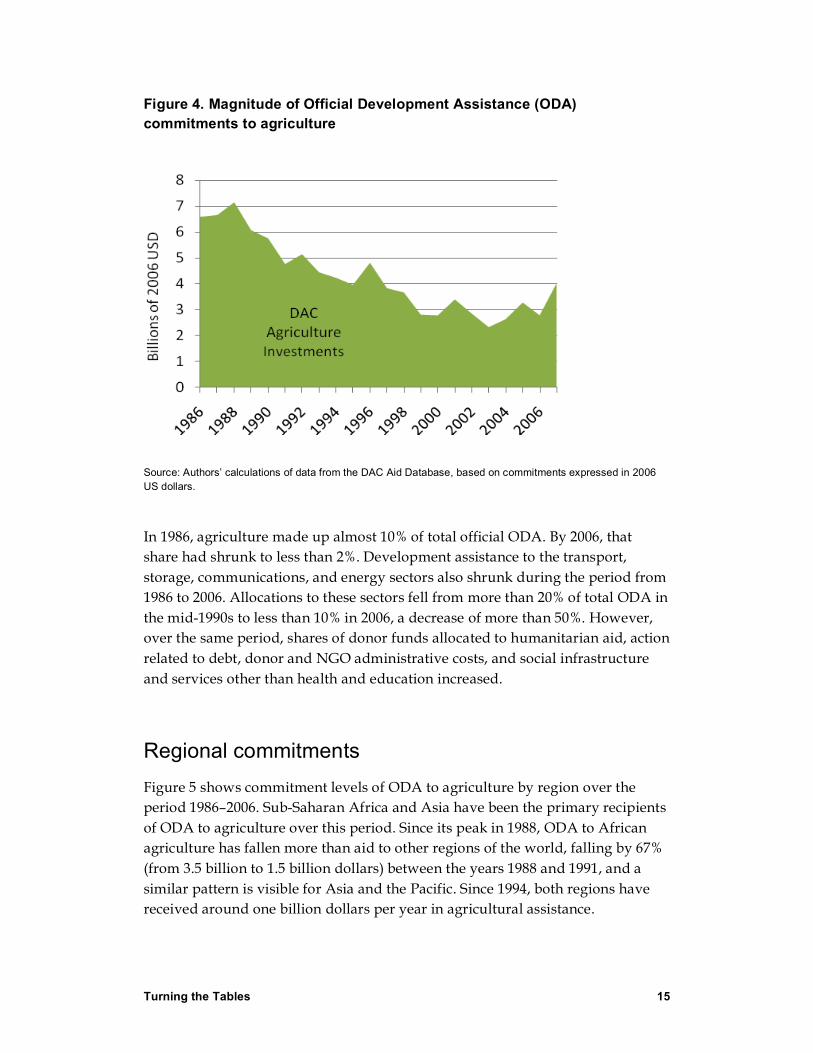
Four of five regions experienced negative annualized growth rates in ODA to agriculture over the period 1986–2006 (Table 1). South America was the only region with a positive growth rate during the period. While the mean annual level of ODA to agriculture for South America was 345 million, donors committed less than 25% of this amount in 2002, indicating significant variability in annual commitment amounts to the region.
Turning the Tables 17
Table 1. Official Development Assistance (ODA) to agriculture, 1986–2006
Region
Cumulative ODA to
Agriculture (1986–2006)
Mean Annual ODA to
Agriculture (1986–2006)
Mean Annual ODA to
Agriculture (2002–06)
Growth Rate of ODA to
Agriculture (1986–2006)
Asia and the Pacific $39.27 $1.87 $1.14 -6.12%
Central America, Mexico, and the Caribbean $3.90 $0.19 $0.15 -7.03%
The Middle East and North Africa $7.25 $0.35 $0.19 -7.94%
South America $5.01 $0.24 $0.30 1.31%
Sub-Saharan Africa $31.48 $1.50 $1.05 -11.14%
Total $86.90 $4.14 $2.83 -7.70%
Source: Authors’ calculations using population data from Sebastian, Technical Report and ODA data from the Creditor Reporting System.
*Amounts shown are commitments in billions of 2006 USD
**Coverage ratios for agriculture sector prior to 1996 average 68%. Coverage after 1996 exceeds 90% and nears 100% in recent years.
*** Total Growth Rate of ODA to Agriculture is a weighted average of regional growth rates.
Although commitments to agriculture for Asia and sub-Saharan Africa fell steadily and sharply over the period, by annualized growth rates of -6.12% and -11.14%, respectively, the cumulative amounts committed to each of these top two recipient regions has vastly outweighed those to other regions (Table 1). From 1986 through 2006, donors committed roughly twice the funds to sub-Saharan African agriculture as they committed to all Latin America, the Middle East and North Africa combined. Donors committed about eight times the amount to Asia that they committed to South America during this time, and more than 10 times the amounts committed to Central America, Mexico and the Caribbean. Average annual commitments follow a similar pattern.
With population and land area giants China and India in its domain, the Asia-Pacific region is by far the largest region in terms of agricultural gross domestic product (GDP) (Table 2). The Asia-Pacific region’s average agricultural GDP over the twenty-year period from 1986 through 2006 was around 383 billion dollars per year while the rest of our sample countries produced around 242 billion dollars per year. The growth rate of the Asia-Pacific region’s agricultural GDP was 3.12% across the period 1990–2005. Sub-Saharan Africa’s growth rate of agricultural GDP exceeded that of Asia’s and was also higher than the other regions. The average annual value of sub-Saharan Africa’s agricultural GDP is about 11% of the size of Asia’s and only about 10 billion dollars larger than that of the Caribbean, Mexico, and Central America region.
Turning the Tables 18
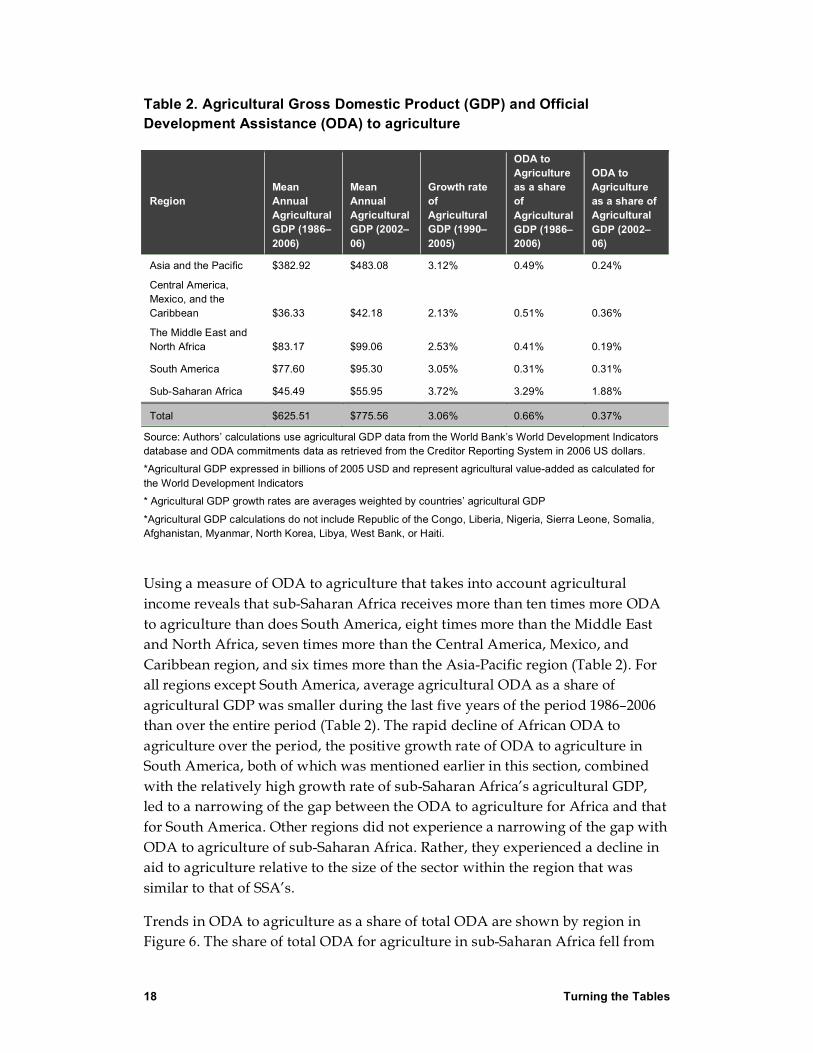
Table 2. Agricultural Gross Domestic Product (GDP) and Official Development Assistance (ODA) to agriculture
Region Mean Annual Agricultural GDP (1986–2006)
Mean Annual Agricultural GDP (2002–06)
Growth rate of Agricultural GDP (1990–2005)
ODA to Agriculture as a share of Agricultural GDP (1986–2006)
ODA to Agriculture as a share of Agricultural GDP (2002–06)
Asia and the Pacific $382.92 $483.08 3.12% 0.49% 0.24%
Central America, Mexico, and the Caribbean $36.33 $42.18 2.13% 0.51% 0.36%
The Middle East and North Africa $83.17 $99.06 2.53% 0.41% 0.19%
South America $77.60 $95.30 3.05% 0.31% 0.31%
Sub-Saharan Africa $45.49 $55.95 3.72% 3.29% 1.88%
Total $625.51 $775.56 3.06% 0.66% 0.37%
Source: Authors’ calculations use agricultural GDP data from the World Bank’s World Development Indicators database and ODA commitments data as retrieved from the Creditor Reporting System in 2006 US dollars.
*Agricultural GDP expressed in billions of 2005 USD and represent agricultural value-added as calculated for the World Development Indicators
* Agricultural GDP growth rates are averages weighted by countries’ agricultural GDP
*Agricultural GDP calculations do not include Republic of the Congo, Liberia, Nigeria, Sierra Leone, Somalia, Afghanistan, Myanmar, North Korea, Libya, West Bank, or Haiti.
Using a measure of ODA to agriculture that takes into account agricultural income reveals that sub-Saharan Africa receives more than ten times more ODA to agriculture than does South America, eight times more than the Middle East and North Africa, seven times more than the Central America, Mexico, and Caribbean region, and six times more than the Asia-Pacific region (Table 2). For all regions except South America, average agricultural ODA as a share of agricultural GDP was smaller during the last five years of the period 1986–2006 than over the entire period (Table 2). The rapid decline of African ODA to agriculture over the period, the positive growth rate of ODA to agriculture in South America, both of which was mentioned earlier in this section, combined with the relatively high growth rate of sub-Saharan Africa’s agricultural GDP, led to a narrowing of the gap between the ODA to agriculture for Africa and that for South America. Other regions did not experience a narrowing of the gap with ODA to agriculture of sub-Saharan Africa. Rather, they experienced a decline in aid to agriculture relative to the size of the sector within the region that was similar to that of SSA’s.
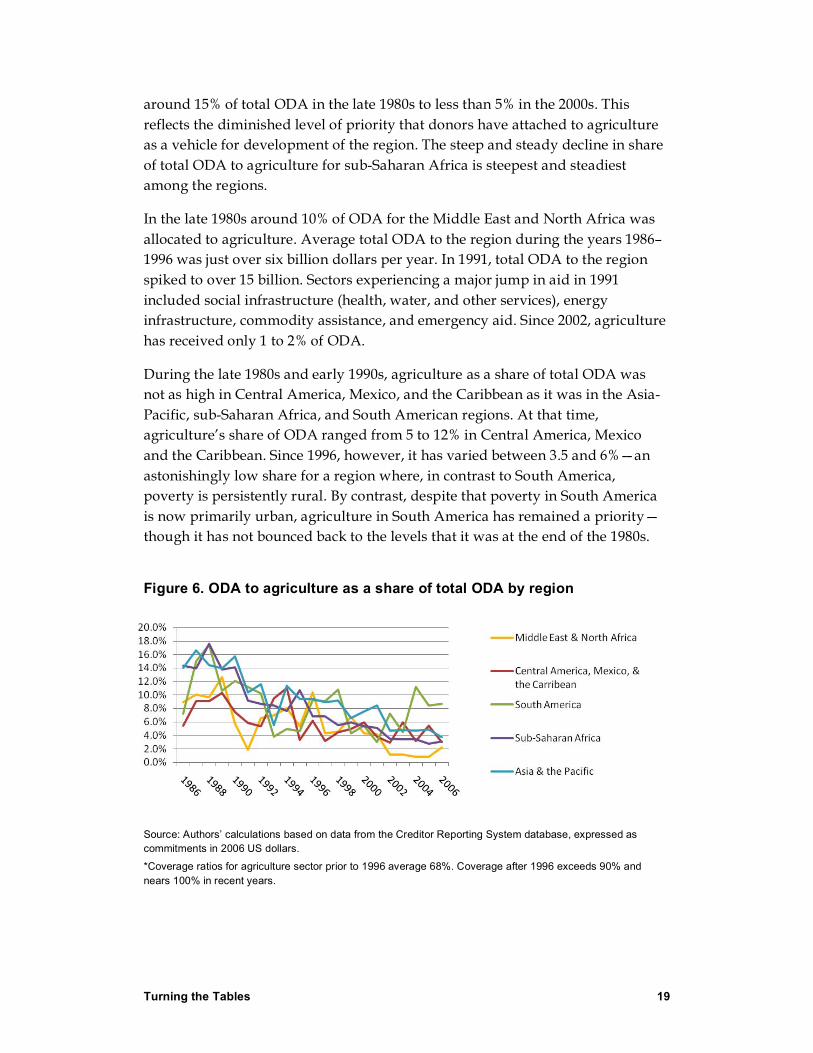
Trends in ODA to agriculture as a share of total ODA are shown by region in Figure 6. The share of total ODA for agriculture in sub-Saharan Africa fell from
Turning the Tables 19
around 15% of total ODA in the late 1980s to less than 5% in the 2000s. This reflects the diminished level of priority that donors have attached to agriculture as a vehicle for development of the region. The steep and steady decline in share of total ODA to agriculture for sub-Saharan Africa is steepest and steadiest among the regions.
In the late 1980s around 10% of ODA for the Middle East and North Africa was allocated to agriculture. Average total ODA to the region during the years 1986–1996 was just over six billion dollars per year. In 1991, total ODA to the region spiked to over 15 billion. Sectors experiencing a major jump in aid in 1991 included social infrastructure (health, water, and other services), energy infrastructure, commodity assistance, and emergency aid. Since 2002, agriculture has received only 1 to 2% of ODA.
During the late 1980s and early 1990s, agriculture as a share of total ODA was not as high in Central America, Mexico, and the Caribbean as it was in the Asia-Pacific, sub-Saharan Africa, and South American regions. At that time, agriculture’s share of ODA ranged from 5 to 12% in Central America, Mexico and the Caribbean. Since 1996, however, it has varied between 3.5 and 6%—an astonishingly low share for a region where, in contrast to South America, poverty is persistently rural. By contrast, despite that poverty in South America is now primarily urban, agriculture in South America has remained a priority—though it has not bounced back to the levels that it was at the end of the 1980s.
Figure 6. ODA to agriculture as a share of total ODA by region
Source: Authors’ calculations based on data from the Creditor Reporting System database, expressed as commitments in 2006 US dollars.
*Coverage ratios for agriculture sector prior to 1996 average 68%. Coverage after 1996 exceeds 90% and nears 100% in recent years.

Turning the Tables 20
Commitment volatility The Paris Declaration of March 2, 2005 outlined 12 indicators of aid effectiveness. Number seven defines predictability of aid an indicator and sets it as a target. It was agreed that the predictability of aid is necessary for long-term planning and the development of institutions.26 Oxfam’s survey of OECD-DAC data led to an analysis of ODA in terms of predictability. In this survey, Oxfam discovered that it is important to have a thorough understanding of the reporting measures used by the database before drawing conclusions based on the data, especially when considering predictability. According to the DAC Statistical Directives, a commitment is:
A firm written obligation by a government or official agency, backed by the appropriation or availability of the necessary funds, to provide resources of a specified amount under specified financial terms and conditions and for specified purposes for the benefit of a recipient country or a multilateral agency.
Commitments are considered to be made at the date a loan or grant agreement is signed or the obligation is otherwise made known to the recipient. For certain special expenditures, e.g. humanitarian aid, the date of disbursement may be taken as the date of commitment.
A disbursement is the placement of resources at the disposal of a recipient country or agency. Disbursements are measured when one of the following occurs: the placement of funds in the hands of the recipient country or agency, payment for goods to be shipped, an unconditionally cashable note is received by a multilateral institution, the withdrawal of funds from a donor account by the recipient, or the transfer of funds to an account in the recipient nation for release upon presentation of certain documents.27
The ratio of net disbursements to ODA commitments has shown an overall increase since 1991 when it was at a low point of 80%. Historically and cumulatively since 1967, the ratio is 86%.
The OECD does not endorse the analysis of data on disbursements by sector prior to 2002 as coverage ratios are below 60%. Thus, disbursements are not commonly used in OECD data analysis.
26. Organization of Economic Co-operation and Development (OECD), The Paris Declaration and AAA, accessed May 2009, available: http://www.oecd.org/document/18/0,3343,en_2649_3236398_35401554_1_1_1_1,00.html.
27. Development Cooperation Directorate, Development Assistance Committee, DAC Statistical Reporting Directives, 2007.
Turning the Tables 21
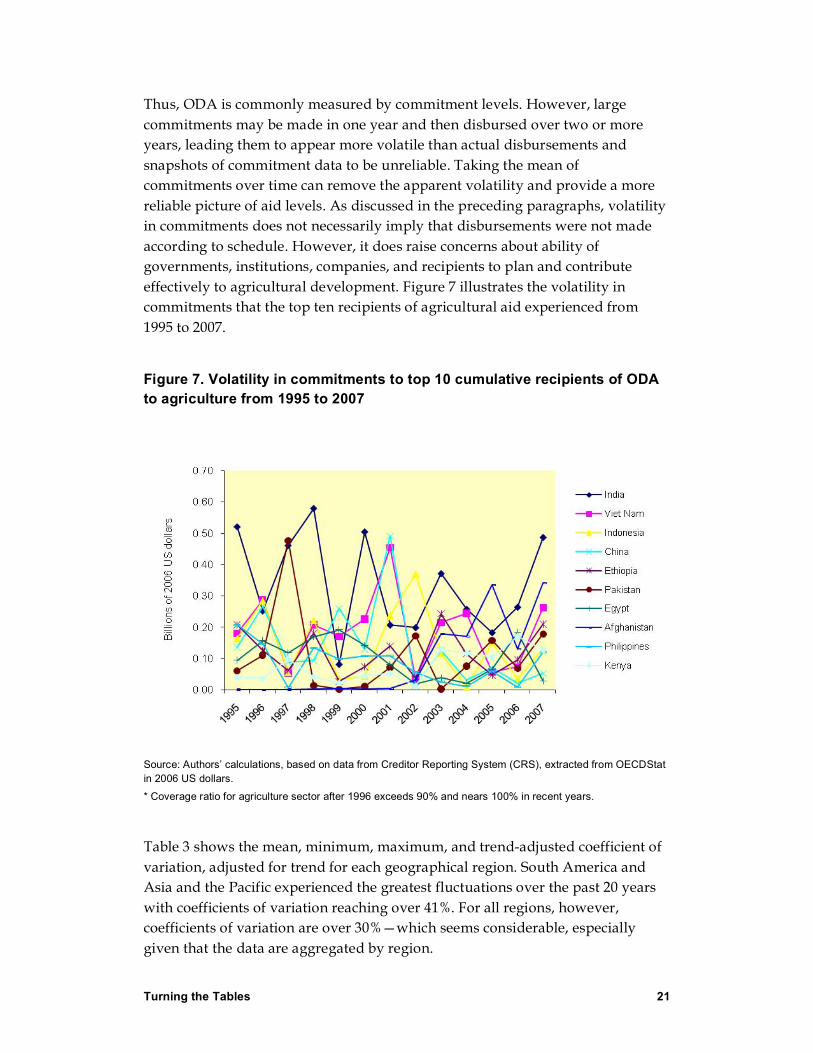
Thus, ODA is commonly measured by commitment levels. However, large commitments may be made in one year and then disbursed over two or more years, leading them to appear more volatile than actual disbursements and snapshots of commitment data to be unreliable. Taking the mean of commitments over time can remove the apparent volatility and provide a more reliable picture of aid levels. As discussed in the preceding paragraphs, volatility in commitments does not necessarily imply that disbursements were not made according to schedule. However, it does raise concerns about ability of governments, institutions, companies, and recipients to plan and contribute effectively to agricultural development. Figure 7 illustrates the volatility in commitments that the top ten recipients of agricultural aid experienced from 1995 to 2007.
Figure 7. Volatility in commitments to top 10 cumulative recipients of ODA to agriculture from 1995 to 2007
Source: Authors’ calculations, based on data from Creditor Reporting System (CRS), extracted from OECDStat in 2006 US dollars.
* Coverage ratio for agriculture sector after 1996 exceeds 90% and nears 100% in recent years.
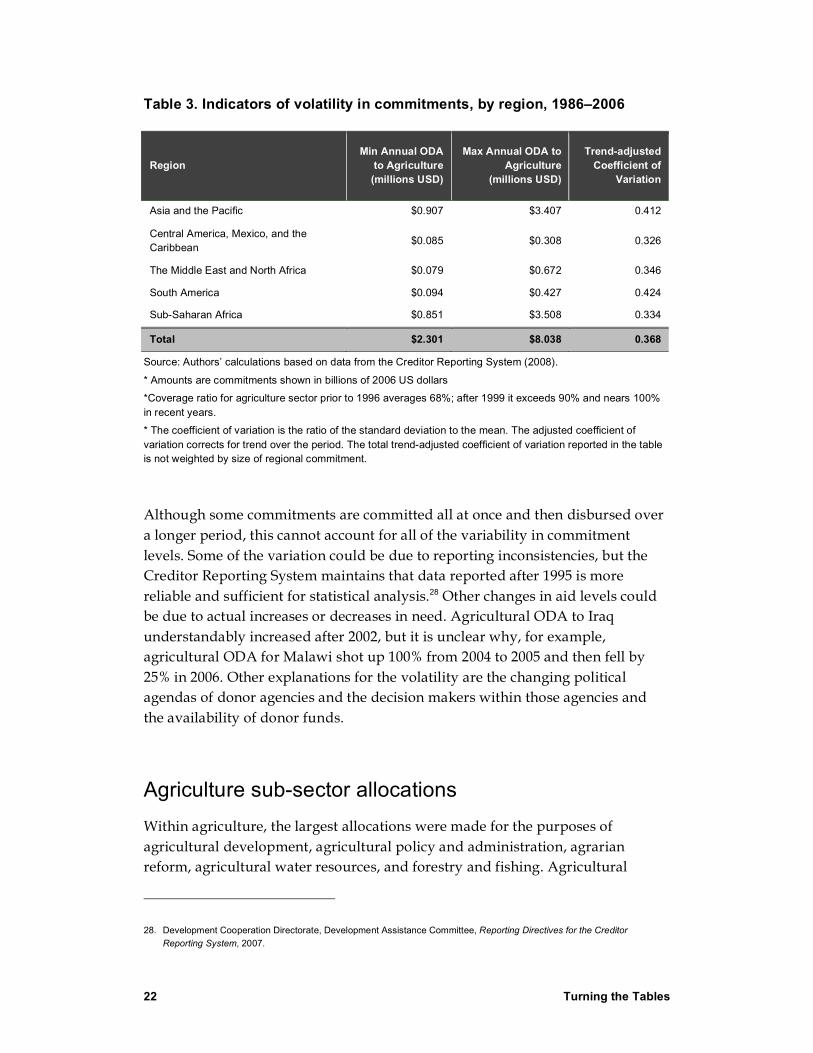
Table 3 shows the mean, minimum, maximum, and trend-adjusted coefficient of variation, adjusted for trend for each geographical region. South America and Asia and the Pacific experienced the greatest fluctuations over the past 20 years with coefficients of variation reaching over 41%. For all regions, however, coefficients of variation are over 30%—which seems considerable, especially given that the data are aggregated by region.
Turning the Tables 22
Table 3. Indicators of volatility in commitments, by region, 1986–2006
Region Min Annual ODA
to Agriculture (millions USD)
Max Annual ODA to Agriculture
(millions USD)
Trend-adjusted Coefficient of
Variation
Asia and the Pacific $0.907 $3.407 0.412
Central America, Mexico, and the Caribbean
$0.085 $0.308 0.326
The Middle East and North Africa $0.079 $0.672 0.346
South America $0.094 $0.427 0.424
Sub-Saharan Africa $0.851 $3.508 0.334
Total $2.301 $8.038 0.368
Source: Authors’ calculations based on data from the Creditor Reporting System (2008).
* Amounts are commitments shown in billions of 2006 US dollars
*Coverage ratio for agriculture sector prior to 1996 averages 68%; after 1999 it exceeds 90% and nears 100% in recent years.
* The coefficient of variation is the ratio of the standard deviation to the mean. The adjusted coefficient of variation corrects for trend over the period. The total trend-adjusted coefficient of variation reported in the table is not weighted by size of regional commitment.
Although some commitments are committed all at once and then disbursed over a longer period, this cannot account for all of the variability in commitment levels. Some of the variation could be due to reporting inconsistencies, but the Creditor Reporting System maintains that data reported after 1995 is more reliable and sufficient for statistical analysis.28 Other changes in aid levels could be due to actual increases or decreases in need. Agricultural ODA to Iraq understandably increased after 2002, but it is unclear why, for example, agricultural ODA for Malawi shot up 100% from 2004 to 2005 and then fell by 25% in 2006. Other explanations for the volatility are the changing political agendas of donor agencies and the decision makers within those agencies and the availability of donor funds.
Agriculture sub-sector allocations Within agriculture, the largest allocations were made for the purposes of agricultural development, agricultural policy and administration, agrarian reform, agricultural water resources, and forestry and fishing. Agricultural
28. Development Cooperation Directorate, Development Assistance Committee, Reporting Directives for the Creditor Reporting System, 2007.
Turning the Tables 23
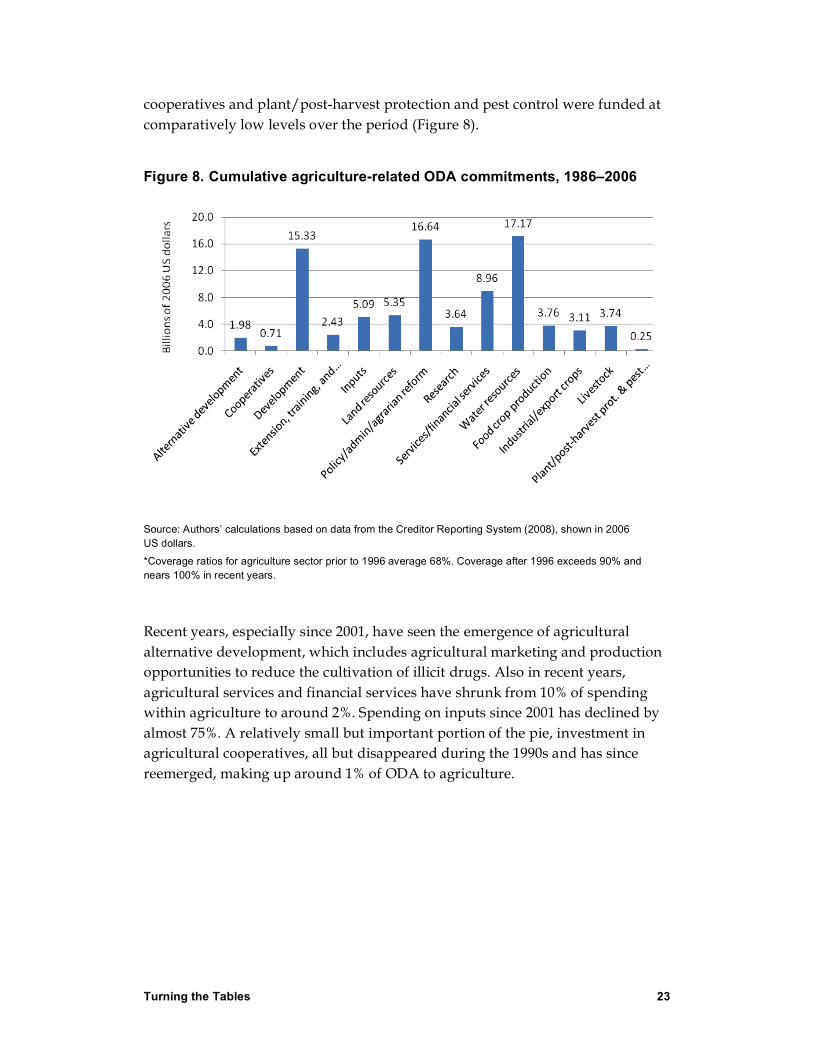
cooperatives and plant/post-harvest protection and pest control were funded at comparatively low levels over the period (Figure 8).
Figure 8. Cumulative agriculture-related ODA commitments, 1986–2006
Source: Authors’ calculations based on data from the Creditor Reporting System (2008), shown in 2006 US dollars.
*Coverage ratios for agriculture sector prior to 1996 average 68%. Coverage after 1996 exceeds 90% and nears 100% in recent years.
Recent years, especially since 2001, have seen the emergence of agricultural alternative development, which includes agricultural marketing and production opportunities to reduce the cultivation of illicit drugs. Also in recent years, agricultural services and financial services have shrunk from 10% of spending within agriculture to around 2%. Spending on inputs since 2001 has declined by almost 75%. A relatively small but important portion of the pie, investment in agricultural cooperatives, all but disappeared during the 1990s and has since reemerged, making up around 1% of ODA to agriculture.

Turning the Tables 24
ODA that facilitates crop production, including that of food crops and industrial and export crops, makes up less than 10% of aid to agriculture. The largest portion for both types of crops is going to sub-Saharan Africa. In the Asia-Pacific region, cumulative aid to food crop production was more than 50% higher than aid to industrial and export crop production. In Central America, Mexico, and the Caribbean, South America, and the Middle East and North Africa, cumulative aid to food crop production is double that of aid to the other. In sub-Saharan Africa, surprisingly given the continent’s food security problems and long-term decline in market conditions for major tropical exports crops such as cacao, coffee, and cotton, cumulative ODA to industrial and export crop production exceeds that to food crop production (Figure 9).
Figure 9. ODA to food crop production versus ODA to industrial/export crop production, cumulative commitments from 1986 through 2006
0
500
1000
1500
2000
2500
ASIA-PACIFIC
CAMEXICA
MID-EAST/N.AFR
ICA
SOUTH AMERICA
SUB-SAHARAN AFRICA
Mill
ions
of 2
006
USD
ODA to Food CropProduction
Industrial/Export CropProduction
Source: Authors’ calculations based on commitments reported to the Creditor Reporting System (CRS) and extracted from OECDStat in 2006 US dollars.
*Coverage ratios for agriculture sector prior to 1996 average 68%. Coverage after 1996 exceeds 90% and nears 100% in recent years.
Turning the Tables 25
In fact, sub-Saharan Africa saw relatively large amounts of investment in industrial/export crops during the late 1980s but food crop investments are now greater in magnitude and have been since the mid-1990s (Figure 9). No other region benefited from such a significant investment in industrial/export crop production during the late 1980s and early 1990s. South America did not receive its first investments into industrial/export crops until 1991. Investments fell in the early 1990s until bottoming out near zero in 1999. From 1994 onward, investment in food crop production in sub-Saharan Africa has fluctuated widely but has remained higher than investments in industrial/export crop production. In other regions, recent years reflect a similar pattern as that of sub-Saharan Africa. ODA to food crop production generally exceeds that of ODA to industrial/export crop production, but annual amounts to each fluctuate considerably.
The data presented in this section confirm that ODA to agriculture is much smaller than it was 20 years ago, in both absolute terms and as a share of total ODA. Available data on national commitments, shown below, do not offset these trends. Commitments also appear to be volatile, which contradicts principles of aid effectiveness and raises concerns for the capacity of poor countries to support agricultural development. Cumulatively, Asia and sub-Saharan Africa have received by far the largest share and funding amount, although Asia and the Pacific have received less per rural capita than all other regions. Certain sub-sectors have been funded at higher levels than others over the past 20 years.
Turning the Tables 26
National expenditures in agriculture
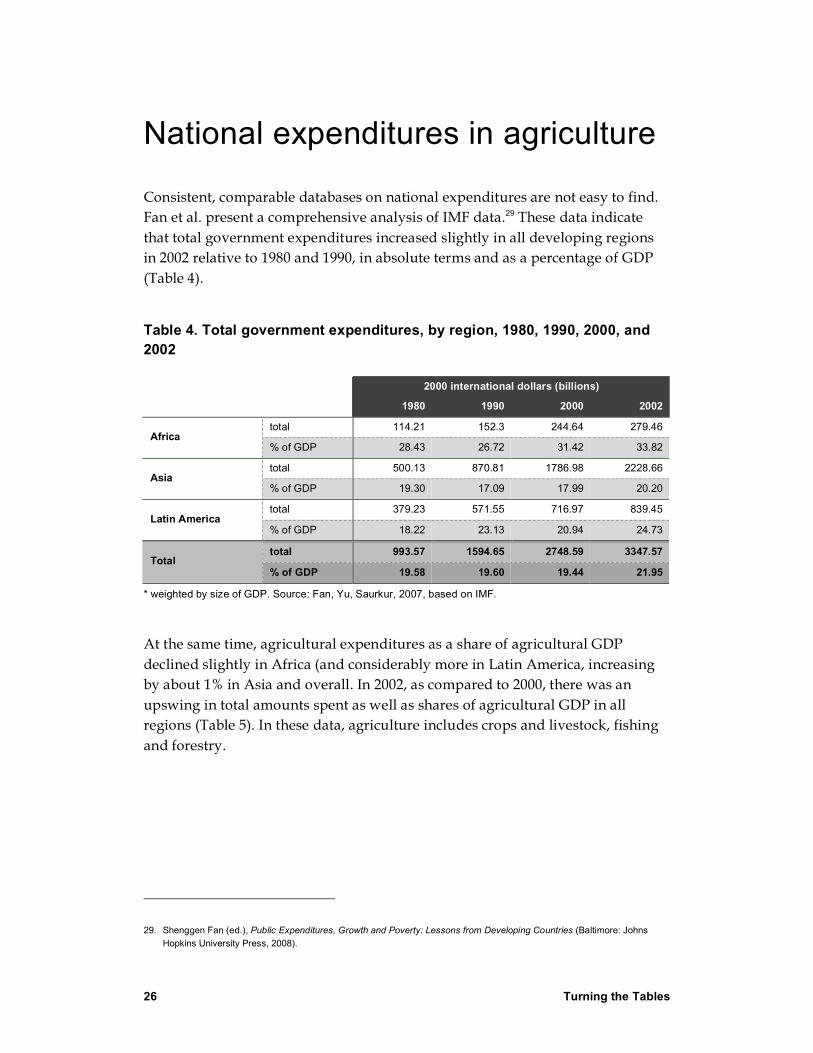
Consistent, comparable databases on national expenditures are not easy to find. Fan et al. present a comprehensive analysis of IMF data.29 These data indicate that total government expenditures increased slightly in all developing regions in 2002 relative to 1980 and 1990, in absolute terms and as a percentage of GDP (Table 4).
Table 4. Total government expenditures, by region, 1980, 1990, 2000, and 2002
2000 international dollars (billions)
1980 1990 2000 2002
total 114.21 152.3 244.64 279.46 Africa
% of GDP 28.43 26.72 31.42 33.82
total 500.13 870.81 1786.98 2228.66 Asia
% of GDP 19.30 17.09 17.99 20.20
total 379.23 571.55 716.97 839.45 Latin America
% of GDP 18.22 23.13 20.94 24.73
total 993.57 1594.65 2748.59 3347.57 Total
% of GDP 19.58 19.60 19.44 21.95
* weighted by size of GDP. Source: Fan, Yu, Saurkur, 2007, based on IMF.
At the same time, agricultural expenditures as a share of agricultural GDP declined slightly in Africa (and considerably more in Latin America, increasing by about 1% in Asia and overall. In 2002, as compared to 2000, there was an upswing in total amounts spent as well as shares of agricultural GDP in all regions (Table 5). In these data, agriculture includes crops and livestock, fishing and forestry.
29. Shenggen Fan (ed.), Public Expenditures, Growth and Poverty: Lessons from Developing Countries (Baltimore: Johns Hopkins University Press, 2008).

Turning the Tables 27
Table 5. Agriculture expenditures, by region, 1980, 1990, 2000, and 2002
2000 international dollars (billions)
1980 1990 2000 2002
agriculture 7.33 7.85 9.90 12.62 Africa
% of ag GDP 7.40 5.44 5.71 6.72
Asia agriculture 74.00 106.54 162.84 191.76
% of ag GDP 9.44 8.51 9.54 10.57
Latin America agriculture 30.48 11.52 18.16 21.23
% of ag GDP 19.51 6.79 11.10 11.57
agriculture 111.80 125.91 190.89 225.61 Total
% of ag GDP 10.76 8.04 9.34 10.32
* weighted by size of GDP. Source: Fan, Yu, Saurkur. 2007, based on IMF.
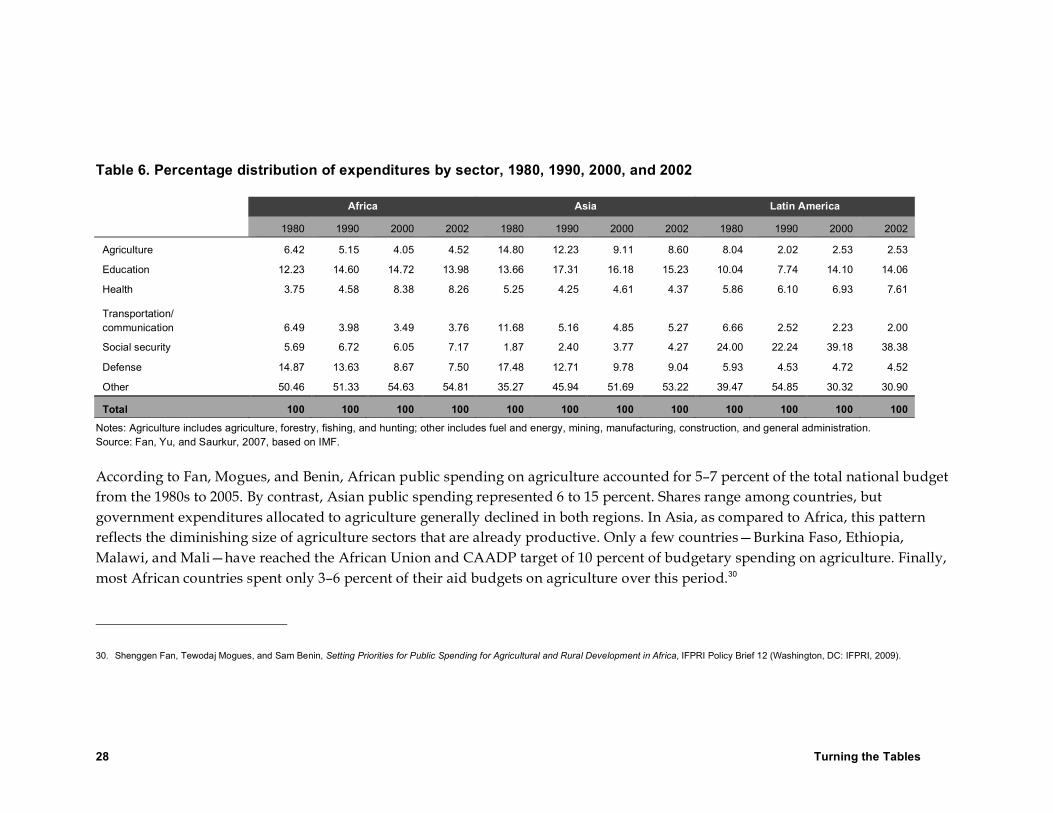
When viewed from the perspective of sectoral shares to total public expenditures, government commitments to agriculture are weakest in Latin America and greatest in Asia, relative to Africa (Table 6). Agricultural shares have declined in each region in each decade, but more so in Latin America (from 8 to 3%), followed by Asia (from 14 to 8%), and least in Africa (from 6 to 5%).
Turning the Tables 28
Table 6. Percentage distribution of expenditures by sector, 1980, 1990, 2000, and 2002
Africa Asia Latin America
1980 1990 2000 2002 1980 1990 2000 2002 1980 1990 2000 2002
Agriculture 6.42 5.15 4.05 4.52 14.80 12.23 9.11 8.60 8.04 2.02 2.53 2.53
Education 12.23 14.60 14.72 13.98 13.66 17.31 16.18 15.23 10.04 7.74 14.10 14.06
Health 3.75 4.58 8.38 8.26 5.25 4.25 4.61 4.37 5.86 6.10 6.93 7.61
Transportation/ communication 6.49 3.98 3.49 3.76 11.68 5.16 4.85 5.27 6.66 2.52 2.23 2.00
Social security 5.69 6.72 6.05 7.17 1.87 2.40 3.77 4.27 24.00 22.24 39.18 38.38
Defense 14.87 13.63 8.67 7.50 17.48 12.71 9.78 9.04 5.93 4.53 4.72 4.52
Other 50.46 51.33 54.63 54.81 35.27 45.94 51.69 53.22 39.47 54.85 30.32 30.90
Total 100 100 100 100 100 100 100 100 100 100 100 100
Notes: Agriculture includes agriculture, forestry, fishing, and hunting; other includes fuel and energy, mining, manufacturing, construction, and general administration. Source: Fan, Yu, and Saurkur, 2007, based on IMF.
According to Fan, Mogues, and Benin, African public spending on agriculture accounted for 5–7 percent of the total national budget from the 1980s to 2005. By contrast, Asian public spending represented 6 to 15 percent. Shares range among countries, but government expenditures allocated to agriculture generally declined in both regions. In Asia, as compared to Africa, this pattern reflects the diminishing size of agriculture sectors that are already productive. Only a few countries—Burkina Faso, Ethiopia, Malawi, and Mali—have reached the African Union and CAADP target of 10 percent of budgetary spending on agriculture. Finally, most African countries spent only 3–6 percent of their aid budgets on agriculture over this period.30
30. Shenggen Fan, Tewodaj Mogues, and Sam Benin, Setting Priorities for Public Spending for Agricultural and Rural Development in Africa, IFPRI Policy Brief 12 (Washington, DC: IFPRI, 2009).
Turning the Tables 29
The importance of public investments in agricultural R&D for poor countries
Why should governments invest in agricultural research in developing economies? There is a well-known, prima facie case for public investments in R&D in general and particularly in agricultural R&D that is based on economic principles. Many of the benefits of agricultural research cannot be appropriated by private investors because of the biological nature of crops and livestock, the spatial organization of farmers, and the risks associated with long payoff horizons. Public investments must compensate in order to ensure that the needs of society are met. Benefits cannot by fully appropriated because farmers, farming regions and countries can “free ride”—that is, many can benefit from the same invention without paying the full costs. Numerous data-based studies also confirm that public investment is far more important to agriculture than to other sectors.31
Alston and Pardey relate free riding to the biological nature of agriculture. The reproductive characteristics of different domesticated crop and livestock species create risk for commercial investors. For instance, the genetic information in improved crop varieties that are developed through research investment can often be reproduced easily and simply by replanting the seed. As a result, plant breeders may not be able to appropriate enough returns from seed sales to make seed development profitable, resulting in less private investment in crop improvement than would be best for society.32 Depending on the crop, the ability to create economically viable hybrid seed, which naturally protects intellectual property, can create much greater incentives for private firms to invest in plant breeding.33 For livestock, differences in fecundity rates and gestation periods
31. Mellor, Pro-poor Growth.
32. Julian Alston and Philip Pardey, Making Science Pay: The Economics of Agricultural R&D Policy (Washington, D.C.: The American Enterprise Institute Press, 1996).
33. Keith Fuglie and others, Agricultural Research and Development: Public and private investments under alternative markets and institutions, Agriculture Economic Report Number 735 (Washington, D.C.: U.S. Department of Agriculture, Economic Research Service, 1996); Michael Morris, Joseph Rusike and Melinda Smale, “Maize seed industries: A conceptual framework,” in M.L. Morris (ed.), Maize Seed Industries in Developing Countries (Boulder, Colorado: Lynne Rienner Publishers, 1998); Paul Heisey, Chittur Srinivasan and Colin Thirtle, Public Sector Plant Breeding in a Privatizing World, Agriculture Information Bulletin Number 772 (Washington, D.C.: U.S. Department of Agriculture, Economic Research Service, 2001).

Turning the Tables 30
make private sector investment far more profitable in poultry than in cattle, with swine occupying an intermediate position.34 In productive sectors where private investment lags because economic incentives are missing, public coffers are instrumental.
Private sector “neglect” is particularly apparent in many poor, developing economies, justifying public investments. Pardey, Alston, and Piggott list some of the reasons why. Markets are more likely to be missing or incomplete for many agricultural inputs, products, and services. In many developing countries, for political expediency, prices have been distorted by policies that set farmgate prices artificially low in order to protect urban populations. The road, marketplace, and market information infrastructure to support widespread diffusion of technologies is largely absent or performs poorly. Innovations now needed in many of the poorer agricultural regions of the world, such as resource management techniques, augmented farm management practices, and non-hybrid, improved varieties of self-pollinating or less heavily traded crops have not been as attractive to private sector investors. The private sector has emphasized the development and delivery of certain types of technologies that are more likely to be profitable and whose benefits are more easily appropriated. Examples include mechanical and chemical technologies, and hybrids of commercial crops.35
In a sense, public investments are needed to “underwrite” scientific progress in agriculture. Biologically driven, agricultural research is a gamble. Agricultural technologies must be developed continually in response to evolving crop pests and environmental conditions that pose new scientific challenges. Scientific research is often technologically complex and reliant on earlier advances, making attribution of benefits to any one project difficult.36 Innovation is also an uncertain, probabilistic process—many dollars must be invested and many options pursued before any single option pays off. Costs and benefits are typically disjoint; a dollar invested today may only pay off years from now. Small-scale private investors don’t have the luxury of an uncertain payback period that can span decades,37 but public investments can make investing more attractive to private firms.
34. Clare Narrod and Keith Fuglie, “Private Investment in Livestock Breeding with Implications for Public Research Policy,” Agribusiness: An International Journal 16 (4, 2000): 457–470.
35. Philip Pardey, Julian Alston, and Roley Piggott (eds), Agricultural R&D in the Developing World: Too Little, Too Late? (Washington, DC: IFPRI, 2006).
36. Paul Heisey and others, Assessing the Economic and Social Benefits of Public Agricultural Research, forthcoming report, Economic Research Service, U.S. Department of Agriculture.
37. There is debate about the length of research lags among experts. Because the research systems in developing countries are younger than those in developed countries and developing countries conduct more applied research, some argue that
Turning the Tables 31
Agricultural production is also atomistic. Relative to other industries, the agricultural sector is characterized by numerous, spatially dispersed producers even when industrialized.38 Consequently, the applicability of new agricultural technology is also highly location-specific. The market for agricultural invention is “highly differentiated” because the “economic value of inventions is sensitive to soil, climate, price, infrastructure, and institutional settings.”39 Success is also “fragmentary.”40 Compared to medical research, the geographical scale of technology transfer in agriculture, and particularly for seed, is limited. Even the semi-dwarf, high-yielding varieties of rice and wheat that spread rapidly across the favored environments of Asia during the Green Revolution had to be locally adapted.
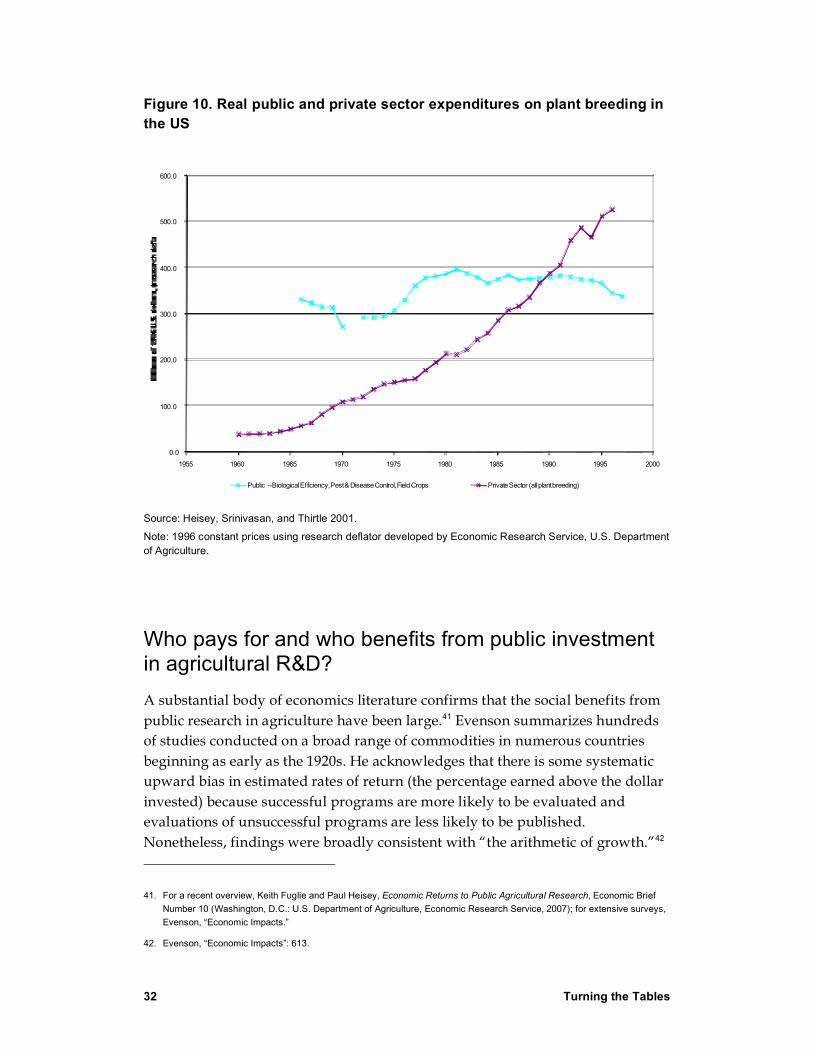
Research-induced productivity growth in agriculture is important not only in poor countries whose economies are based on agriculture but in wealthier countries where most of the national product is industrially-generated. In rich countries such as the US, public sector investments underpin privately-funded agricultural R&D in crucial ways. Private sector investments in plant breeding have risen almost monotonically since 1960 in the US, but public investments have remained stable for biological control, pest and disease management (Figure 10).
lags may be shorter in poorer nations. On the other hand, undercapitalized farmers and inadequate soft and hard market infrastructure increase the time to adoption, reduce the extent of adoption, and cap the ceiling of adoption at lower levels.
38. Alston and Pardey, Making Science Pay; Heisey and others, Economic and Social Benefits.
39. Robert Evenson, “Economic Impacts of Agricultural Research and Extension,” Chapter 11 in B. Gardner and G. Rausser (eds.), Handbook of Agricultural Economics, Volume 1 (Amsterdam: Elsevier, 2001): 576.
40. Heisey and others, Economic and Social Benefits.
Turning the Tables 32
Figure 10. Real public and private sector expenditures on plant breeding in the US
0.0
100.0
200.0
300.0
400.0
500.0
600.0
1955 1960 1965 1970 1975 1980 1985 1990 1995 2000
Public --Biological Efficiency, Pest & Disease Control, Field Crops Private Sector (all plant breeding)
Source: Heisey, Srinivasan, and Thirtle 2001.
Note: 1996 constant prices using research deflator developed by Economic Research Service, U.S. Department of Agriculture.
Who pays for and who benefits from public investment in agricultural R&D? A substantial body of economics literature confirms that the social benefits from public research in agriculture have been large.41 Evenson summarizes hundreds of studies conducted on a broad range of commodities in numerous countries beginning as early as the 1920s. He acknowledges that there is some systematic upward bias in estimated rates of return (the percentage earned above the dollar invested) because successful programs are more likely to be evaluated and evaluations of unsuccessful programs are less likely to be published. Nonetheless, findings were broadly consistent with “the arithmetic of growth.”42
41. For a recent overview, Keith Fuglie and Paul Heisey, Economic Returns to Public Agricultural Research, Economic Brief Number 10 (Washington, D.C.: U.S. Department of Agriculture, Economic Research Service, 2007); for extensive surveys, Evenson, “Economic Impacts.”
42. Evenson, “Economic Impacts”: 613.
Turning the Tables 33
Means and medians were high for both research and extension, but are lower for extension; the range of estimated rates of return was wide, and was wider for extension. Overall, the data were more convincing for agricultural research and extension than for other agricultural programs, such as credit. Evenson concludes that “the evidence….does support the original vision of development economists. Research and extension programs have afforded high payoff investment opportunities.”43
Following the principles of public economics, public investments should not be undertaken if the social return is less than the marginal cost. Evenson cautions that estimated rates of return have nothing to do with whether programs could have been made more effective or not.44 There are also other costs related to public expenditures that are not factored into these calculations. Public expenditures, regardless of the benefits and how they are distributed among actors in the society, impose a cost on society at large by diverting resources from private use and through deadweight loss associated with taxation. These costs are high for poor countries with small tax bases, where they may outweigh benefits (although estimating costs and benefits is difficult).
Germane to this point, Pardey, Alston, and Piggott remind us that only a few rich countries (US, Japan, Germany, and France) made substantial investments in private and public agricultural science industries in the 20th century.45 Most rich countries did not. The authors ask “why should we expect the poorest countries of the world to act like the richest of the rich in this regard?”46
Fortunately for those who did not invest, the benefits of investments in agricultural research cross borders. In the lingo of agricultural research, free riding is called “spillover.” These spillovers occur from “invention-to-invention” (often spatially) and from “science-to-invention” (temporally).47 Spillovers in agricultural R&D occur when investments by one political entity (state, nation) confer benefits on other entities that are able to adopt the technology or apply the knowledge without paying its full price. Of the 292 studies reviewed in a meta-
43. Ibid: 616.
44. Ibid.
45. Pardey, Alston, and Piggott, Too Little, Too Late?
46. Ibid: 15.
47. Hayami and Ruttan provide an alternative conceptual framework for technology transfer: the first stage would be direct transfer of technology (e.g. taking a U.S. maize hybrid to China); the second transfer of research “blueprints” (e.g. developing country researchers learn how to create maize hybrids); and the third transfer of scientific capacity. See Robert Evenson, “Economic Impacts of Agricultural Research and Extension,” Chapter 11 in B. Gardner and G. Rausser (eds.), Handbook of Agricultural Economics, Volume 1 (Amsterdam: Elsevier, 2001): 377.
Turning the Tables 34
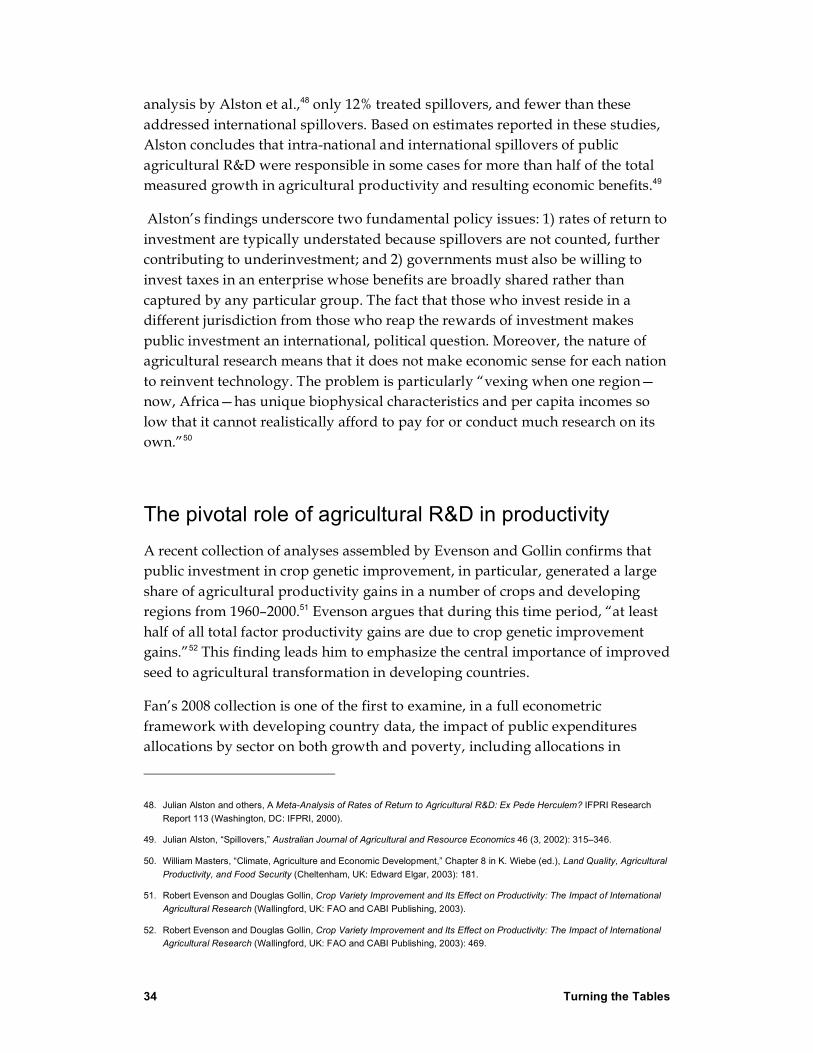
analysis by Alston et al.,48 only 12% treated spillovers, and fewer than these addressed international spillovers. Based on estimates reported in these studies, Alston concludes that intra-national and international spillovers of public agricultural R&D were responsible in some cases for more than half of the total measured growth in agricultural productivity and resulting economic benefits.49
Alston’s findings underscore two fundamental policy issues: 1) rates of return to investment are typically understated because spillovers are not counted, further contributing to underinvestment; and 2) governments must also be willing to invest taxes in an enterprise whose benefits are broadly shared rather than captured by any particular group. The fact that those who invest reside in a different jurisdiction from those who reap the rewards of investment makes public investment an international, political question. Moreover, the nature of agricultural research means that it does not make economic sense for each nation to reinvent technology. The problem is particularly “vexing when one region—now, Africa—has unique biophysical characteristics and per capita incomes so low that it cannot realistically afford to pay for or conduct much research on its own.”50
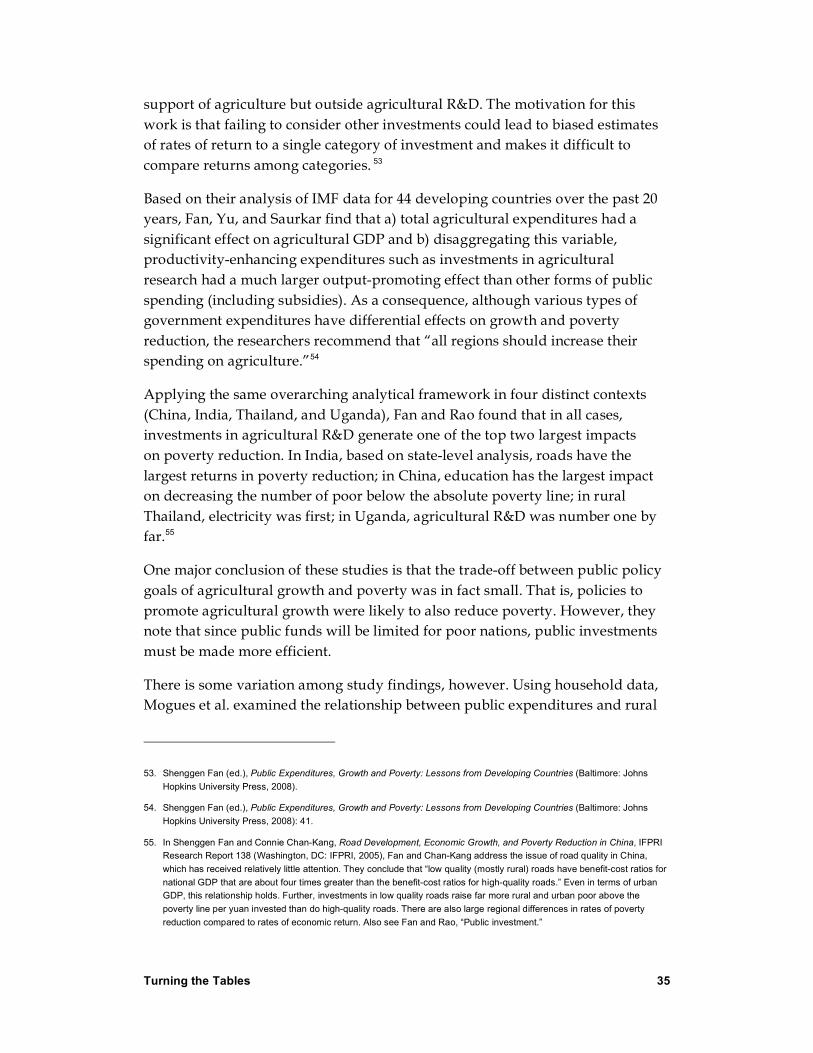
The pivotal role of agricultural R&D in productivity A recent collection of analyses assembled by Evenson and Gollin confirms that public investment in crop genetic improvement, in particular, generated a large share of agricultural productivity gains in a number of crops and developing regions from 1960–2000.51 Evenson argues that during this time period, “at least half of all total factor productivity gains are due to crop genetic improvement gains.”52 This finding leads him to emphasize the central importance of improved seed to agricultural transformation in developing countries.
Fan’s 2008 collection is one of the first to examine, in a full econometric framework with developing country data, the impact of public expenditures allocations by sector on both growth and poverty, including allocations in
48. Julian Alston and others, A Meta-Analysis of Rates of Return to Agricultural R&D: Ex Pede Herculem? IFPRI Research Report 113 (Washington, DC: IFPRI, 2000).
49. Julian Alston, “Spillovers,” Australian Journal of Agricultural and Resource Economics 46 (3, 2002): 315–346.
50. William Masters, “Climate, Agriculture and Economic Development,” Chapter 8 in K. Wiebe (ed.), Land Quality, Agricultural Productivity, and Food Security (Cheltenham, UK: Edward Elgar, 2003): 181.
51. Robert Evenson and Douglas Gollin, Crop Variety Improvement and Its Effect on Productivity: The Impact of International Agricultural Research (Wallingford, UK: FAO and CABI Publishing, 2003).
52. Robert Evenson and Douglas Gollin, Crop Variety Improvement and Its Effect on Productivity: The Impact of International Agricultural Research (Wallingford, UK: FAO and CABI Publishing, 2003): 469.
Turning the Tables 35
support of agriculture but outside agricultural R&D. The motivation for this work is that failing to consider other investments could lead to biased estimates of rates of return to a single category of investment and makes it difficult to compare returns among categories. 53
Based on their analysis of IMF data for 44 developing countries over the past 20 years, Fan, Yu, and Saurkar find that a) total agricultural expenditures had a significant effect on agricultural GDP and b) disaggregating this variable, productivity-enhancing expenditures such as investments in agricultural research had a much larger output-promoting effect than other forms of public spending (including subsidies). As a consequence, although various types of government expenditures have differential effects on growth and poverty reduction, the researchers recommend that “all regions should increase their spending on agriculture.”54
Applying the same overarching analytical framework in four distinct contexts (China, India, Thailand, and Uganda), Fan and Rao found that in all cases, investments in agricultural R&D generate one of the top two largest impacts on poverty reduction. In India, based on state-level analysis, roads have the largest returns in poverty reduction; in China, education has the largest impact on decreasing the number of poor below the absolute poverty line; in rural Thailand, electricity was first; in Uganda, agricultural R&D was number one by far.55
One major conclusion of these studies is that the trade-off between public policy goals of agricultural growth and poverty was in fact small. That is, policies to promote agricultural growth were likely to also reduce poverty. However, they note that since public funds will be limited for poor nations, public investments must be made more efficient.
There is some variation among study findings, however. Using household data, Mogues et al. examined the relationship between public expenditures and rural
53. Shenggen Fan (ed.), Public Expenditures, Growth and Poverty: Lessons from Developing Countries (Baltimore: Johns Hopkins University Press, 2008).
54. Shenggen Fan (ed.), Public Expenditures, Growth and Poverty: Lessons from Developing Countries (Baltimore: Johns Hopkins University Press, 2008): 41.
55. In Shenggen Fan and Connie Chan-Kang, Road Development, Economic Growth, and Poverty Reduction in China, IFPRI Research Report 138 (Washington, DC: IFPRI, 2005), Fan and Chan-Kang address the issue of road quality in China, which has received relatively little attention. They conclude that “low quality (mostly rural) roads have benefit-cost ratios for national GDP that are about four times greater than the benefit-cost ratios for high-quality roads.” Even in terms of urban GDP, this relationship holds. Further, investments in low quality roads raise far more rural and urban poor above the poverty line per yuan invested than do high-quality roads. There are also large regional differences in rates of poverty reduction compared to rates of economic return. Also see Fan and Rao, “Public investment.”
Turning the Tables 36
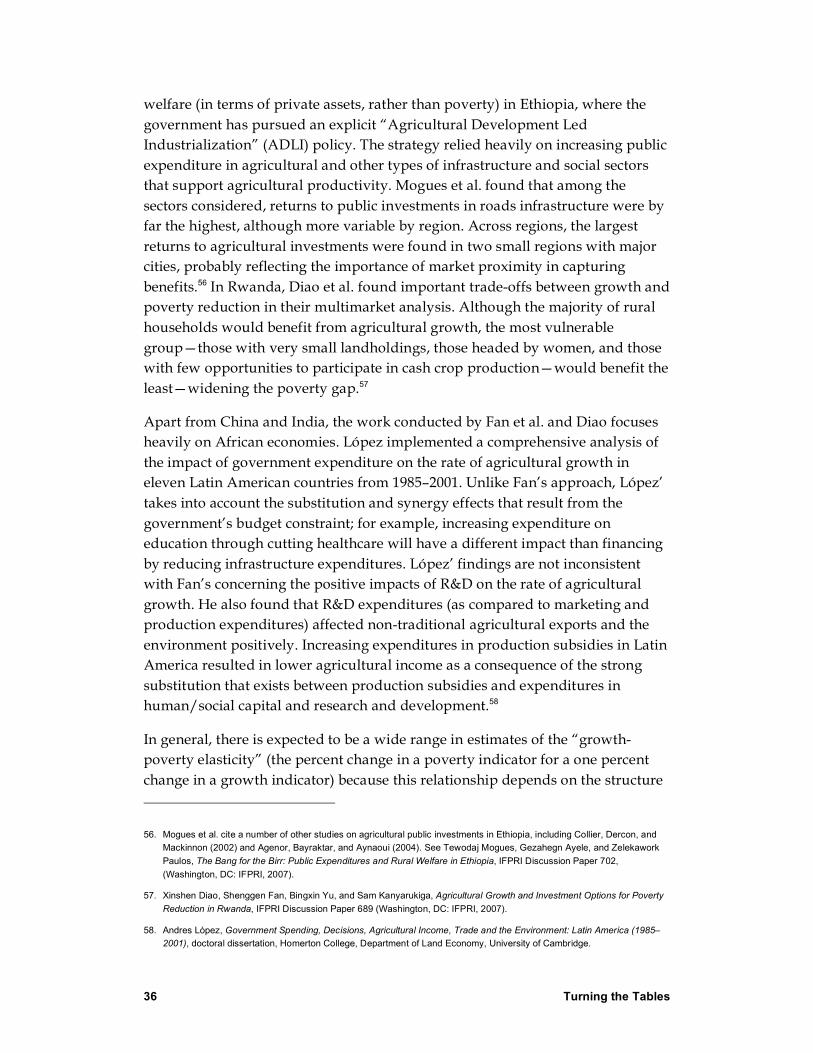
welfare (in terms of private assets, rather than poverty) in Ethiopia, where the government has pursued an explicit “Agricultural Development Led Industrialization” (ADLI) policy. The strategy relied heavily on increasing public expenditure in agricultural and other types of infrastructure and social sectors that support agricultural productivity. Mogues et al. found that among the sectors considered, returns to public investments in roads infrastructure were by far the highest, although more variable by region. Across regions, the largest returns to agricultural investments were found in two small regions with major cities, probably reflecting the importance of market proximity in capturing benefits.56 In Rwanda, Diao et al. found important trade-offs between growth and poverty reduction in their multimarket analysis. Although the majority of rural households would benefit from agricultural growth, the most vulnerable group—those with very small landholdings, those headed by women, and those with few opportunities to participate in cash crop production—would benefit the least—widening the poverty gap.57
Apart from China and India, the work conducted by Fan et al. and Diao focuses heavily on African economies. López implemented a comprehensive analysis of the impact of government expenditure on the rate of agricultural growth in eleven Latin American countries from 1985–2001. Unlike Fan’s approach, López’ takes into account the substitution and synergy effects that result from the government’s budget constraint; for example, increasing expenditure on education through cutting healthcare will have a different impact than financing by reducing infrastructure expenditures. López’ findings are not inconsistent with Fan’s concerning the positive impacts of R&D on the rate of agricultural growth. He also found that R&D expenditures (as compared to marketing and production expenditures) affected non-traditional agricultural exports and the environment positively. Increasing expenditures in production subsidies in Latin America resulted in lower agricultural income as a consequence of the strong substitution that exists between production subsidies and expenditures in human/social capital and research and development.58
In general, there is expected to be a wide range in estimates of the “growth-poverty elasticity” (the percent change in a poverty indicator for a one percent change in a growth indicator) because this relationship depends on the structure
56. Mogues et al. cite a number of other studies on agricultural public investments in Ethiopia, including Collier, Dercon, and Mackinnon (2002) and Agenor, Bayraktar, and Aynaoui (2004). See Tewodaj Mogues, Gezahegn Ayele, and Zelekawork Paulos, The Bang for the Birr: Public Expenditures and Rural Welfare in Ethiopia, IFPRI Discussion Paper 702, (Washington, DC: IFPRI, 2007).
57. Xinshen Diao, Shenggen Fan, Bingxin Yu, and Sam Kanyarukiga, Agricultural Growth and Investment Options for Poverty Reduction in Rwanda, IFPRI Discussion Paper 689 (Washington, DC: IFPRI, 2007).
58. Andres López, Government Spending, Decisions, Agricultural Income, Trade and the Environment: Latin America (1985–2001), doctoral dissertation, Homerton College, Department of Land Economy, University of Cambridge.

Turning the Tables 37
of the economy, the importance of agriculture in the economy, the share of labor in agriculture, and the distribution of the poor between rural and urban areas. The extent to which agricultural growth reduces poverty in African nations, for example, varies considerably by country. Diao et al. propose a typology to better comprehend these differences among African nations, where coastal versus landlocked location, and income from mining, interact with both income and agricultural production environment to determine the magnitude of the growth-poverty elasticity.59
In rural economies, the multipliers to output and employment from increased agricultural incomes are important because they tend to be oriented towards non-tradable goods and services that use underemployed labor; “they stimulate a sector that cannot be stimulated by increased foreign demand and mobilize resources that would otherwise be idle.”60 Compiling evidence from economy-wide simulation models (multimarket and computable general equilibrium) in Ethiopia, Ghana, Rwanda, Uganda, and Zambia, Diao et al. conclude that especially in sub-Saharan Africa, agriculture can generate pro-poor growth through its linkages to the rest of the economy, particularly when it involves small-scale farmers and productivity of food staples (cereals, roots and tubers, pulses, oil crops, and livestock products).61 “No other agricultural markets could offer such growth potential and benefit to Africa’s small farmers at such huge scales.”62 For example, in Rwanda, Diao et al. found that a 1% growth in per capita GDP that is driven by increased staple crops and livestock production has a greater effect on reducing poverty than the same level of growth driven by export crops or nonagricultural sectors.63 Delgado warns, however, that many bulky African staples, such as coarse grains and cassava, are not heavily traded up value chains and their multiplier effects in local economies are limited in the absence of additional, high-value crops in the farming system.64
Thus, a body of empirical research demonstrates that a primary impetus for agricultural productivity growth has been investment in research and development, but investments in education, health and infrastructure sectors to support the agriculture are also key. Next, we summarize trends in agricultural R&D investments.
59. Diao, Hazell, Resnick, and Thurlow, Role of Agriculture in Development.
60. Mellor, Pro-Poor Growth: 18.
61. Diao, Hazell, Resnick, and Thurlow, Role of Agriculture in Development.
62. Ibid: 17.
63. Diao, Fan, Yu, and Kanyarukiga, Agricultural Growth and Investment Options.
64. Chris Delgado, personal communication on December 12, 2009.

Turning the Tables 38
Indicators of public agricultural R&D investments Systematic, internationally comparable datasets on investment and capacity trends in agricultural R&D are published under the umbrella of the Agricultural Science and Technology Indicators (ASTI) initiative.65 The initiative collects substantial original data focused on low- and middle-income countries and maintains access to relevant high-income country data for comparative purposes.
A total of $23 billion 2006 PPP dollars (in 2005 prices)66 were spent by governments, higher-education agencies and nonprofit institutions involved in agricultural R&D worldwide in 2000, the latest year for which comprehensive data are available under the ASTI Initiative.67 Relative levels of expenditures over time for low- and middle-income countries (defined as developing countries) and high-income countries are indicated in Figure 11.
65. The ASTI initiative is managed by the International Food Policy Research Institute (IFPRI) and involves a wide network of national, regional, and international partners (http://www.asti.cgiar.org/).
66. Purchasing power parity (PPP) indexes are synthetic exchange rates used to reflect the purchasing power of currencies, typically comparing prices among a broader range of goods and services than do conventional exchange rates. Using PPPs as conversion factors to denominate value aggregates in international dollars results in more realistic and directly comparable estimates of agricultural research spending across countries than would result from the use of market exchange rates.
67. Nienke Beintema and Jan-Gert Stads, Measuring Agricultural Research Investments: A Revised Global Picture, ASTI Background Note (Washington, DC: IFPRI, 2008) revised the analysis published in Philip Pardey, Nienke Beintema, Steven Dehmer, and Stanley Wood, Agricultural Research: A Growing Global Divide? Food Policy Report 17 (Washington, DC: IFPRI, 2006), prompted by updated ASTI data and World Bank adjustments in their estimated PPP indexes. Their revised calculations show that the world is investing even less in agricultural R&D than previously reported—by about one-tenth. Beintema and Stads confirm that high-income countries as a group continue to invest more in public agricultural R&D than developing countries. Public spending by high-income countries as a whole continued to grow in absolute terms, but their share of global spending decreased from 62 to 57% between 1981 and 2000. PPPs express internationally comparable prices for goods and services. These index adjustments have also led to downward revisions of global economic growth figures by the International Monetary Fund (IMF), and an upward revision of developing-country poverty estimates by the World Bank. Note that new datasets are still insufficient to analyze data beyond 2000 (Beintema and Stads, Measuring Agricultural Research Investments)

Turning the Tables 39
Figure 11. Global public agricultural research expenditure trends by income levels, 1981–2000 (in million 2005 PPP dollars)
0
2,500
5,000
7,500
10,000
12,500
15,000
17,500
20,000
22,500
25,000
1981 1983 1985 1987 1989 1991 1993 1995 1997 1999
Global totalHigh incomeLow & middle income
Notes: Public includes government, higher-education agencies, and nonprofit institutions. These estimates exclude Eastern Europe and former Soviet Union countries. Estimation procedures and methodology are described in Pardey et al. 2006 and various ASTI regional reports available at www.asti.cgiar.org.
Source: ASTI datasets underlying Beintema and Stads (2008a).
Among low- and middle-income countries, China and India led the investment growth in the Asia-Pacific region, where total agricultural R&D spending more than doubled during the 1981–2002 period. Twenty percent of global public expenditures on agricultural R&D were made in this region in 2000. As a result of the increasing share of the Asia-Pacific region in the global total, the shares for sub-Saharan Africa and Latin America and the Caribbean declined during the twenty-year period. In 2000, total spending in agricultural R&D in sub-Saharan Africa as a whole was slightly higher than total spending in Brazil, the greatest public investor in Latin America, and considerably lower than spending levels of either India or China.
Figure 12 illustrates the steeper investment growth path in the Asia-Pacific region compared to Latin America and the Caribbean, and flatter paths that represent fractions of the resources committed in sub-Saharan Africa and West Asia and North Africa. Although data on global public agricultural R&D spending since 2000 is not yet available, more recent data has been collected through the ASTI initiative for some regions. Public spending in agricultural R&D continued to grow in China and the rest of the Asia-Pacific region. Agricultural R&D expenditures in Latin American and the Caribbean rebounded in recent years following a period of contraction during the late 1990s.
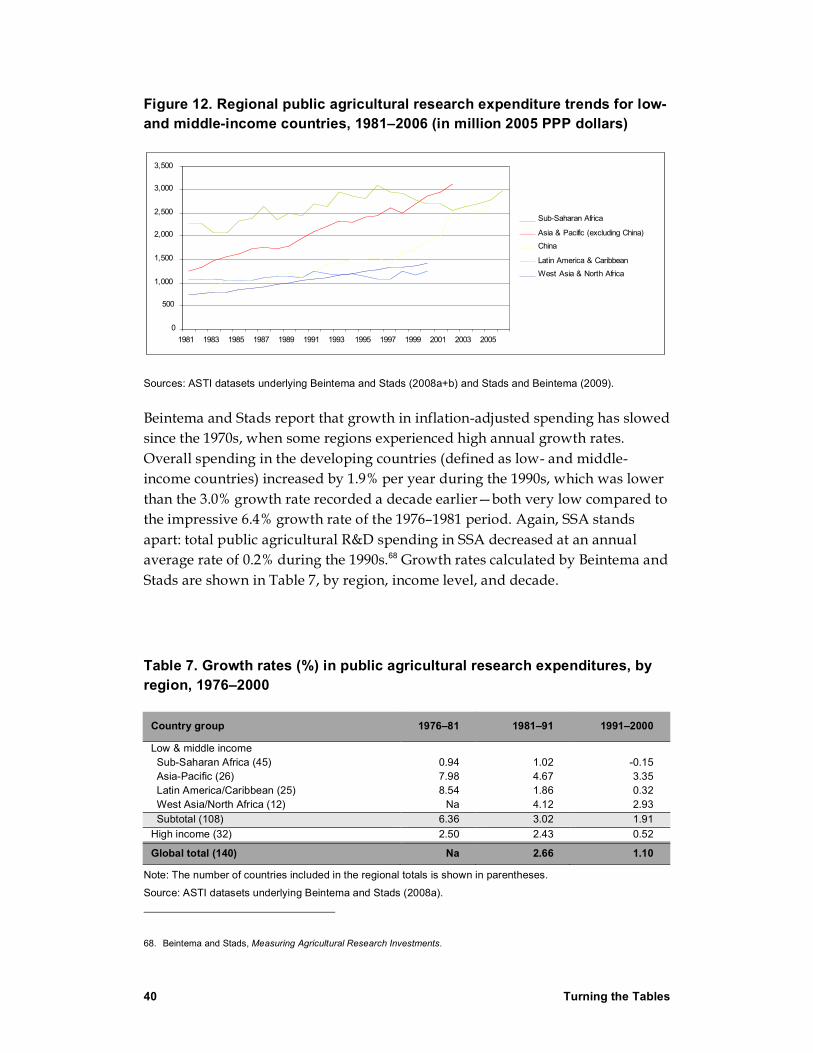
Turning the Tables 40
Figure 12. Regional public agricultural research expenditure trends for low- and middle-income countries, 1981–2006 (in million 2005 PPP dollars)
0
500
1,000
1,500
2,000
2,500
3,000
3,500
1981 1983 1985 1987 1989 1991 1993 1995 1997 1999 2001 2003 2005
Sub-Saharan Africa
Asia & Pacific (excluding China)
China
Latin America & Caribbean
West Asia & North Africa
Sources: ASTI datasets underlying Beintema and Stads (2008a+b) and Stads and Beintema (2009).
Beintema and Stads report that growth in inflation-adjusted spending has slowed since the 1970s, when some regions experienced high annual growth rates. Overall spending in the developing countries (defined as low- and middle-income countries) increased by 1.9% per year during the 1990s, which was lower than the 3.0% growth rate recorded a decade earlier—both very low compared to the impressive 6.4% growth rate of the 1976–1981 period. Again, SSA stands apart: total public agricultural R&D spending in SSA decreased at an annual average rate of 0.2% during the 1990s.68 Growth rates calculated by Beintema and Stads are shown in Table 7, by region, income level, and decade.
Table 7. Growth rates (%) in public agricultural research expenditures, by region, 1976–2000
Country group 1976–81 1981–91 1991–2000
Low & middle income Sub-Saharan Africa (45) 0.94 1.02 -0.15 Asia-Pacific (26) 7.98 4.67 3.35 Latin America/Caribbean (25) 8.54 1.86 0.32 West Asia/North Africa (12) Na 4.12 2.93 Subtotal (108) 6.36 3.02 1.91 High income (32) 2.50 2.43 0.52
Global total (140) Na 2.66 1.10
Note: The number of countries included in the regional totals is shown in parentheses.
Source: ASTI datasets underlying Beintema and Stads (2008a).
68. Beintema and Stads, Measuring Agricultural Research Investments.

Turning the Tables 41
ASTI data also illustrate the gap between the scientific “haves” and “have-nots.” The top 10 countries in terms of public investments in agricultural R&D accounted for 62% of global spending in 2000, had 56% of the world’s population, and produced 52% of global agricultural production. Their share of agricultural land was only 33%—much lower than their contribution to production and GDP. The bottom 80, mostly low-income, countries represented only 6% of global agricultural R&D spending and only 5% of global agricultural production but accounted for 14% of agricultural land and 11% of the world’s population.
These regional trends, however, mask a wide diversity across countries within the various regions. For example, of about half of the 27 sub-Saharan African countries for which time-series data were available, 2000 agricultural R&D expenditures were lower than the levels a decade earlier.69 Stads and Beintema (2009) characterize agricultural R& D investment and capacity in Latin American and the Caribbean as heterogeneous and unequal. About three-quarters of the total 2006 investment of $3.0 billion (in 2005 PPP dollars) was spent by only three countries (Brazil, Mexico, and Argentina), and the investment gap has widened between the region’s low- and middle-income countries since 1996. They note that some of the poorer, more agriculture-dependent countries (such as Guatemala, El Salvador, and Paraguay) experienced sharp cuts in their research expenditures and the ratios of public expenditures on agricultural research to agricultural GDP fell. By contrast, Argentina and Mexico experienced growth. Similar diversity in investments are also seen in the Asia-Pacific region.
In addition to evaluating the absolute levels of expenditures, and to place it in an internationally comparable context, is to measure a country or region’s agricultural R&D efforts with regard to the size of the agricultural sector. According to Beintema and Stads, the most common indicator of this research intensity is expenditures in agricultural R&D as a share of agricultural output (agricultural GDP).70 Intensity ratios are shown by region, income, and decade in Table 8. Intensity ratios averaged around 0.56% in low- and middle-income countries from 1980 to 2000, and interestingly, they were the lowest in the Asia-Pacific; the region experiencing the highest rate of growth and levels of expenditure. In high-income countries, by contrast, intensity ratios rose over the period, and with 2.35% were over four times higher than the average ratio for low-and middle income countries in 2000. According to Pardey et al. the
69. Nienke Beintema and Jan-Gert Stads, Agricultural R&D in Sub-Saharan Africa: An Era of Stagnation, ASTI Background Report (Washington, D.C.: IFPRI, 2006).
70. Beintema and Stads, Measuring Agricultural Research Investments.
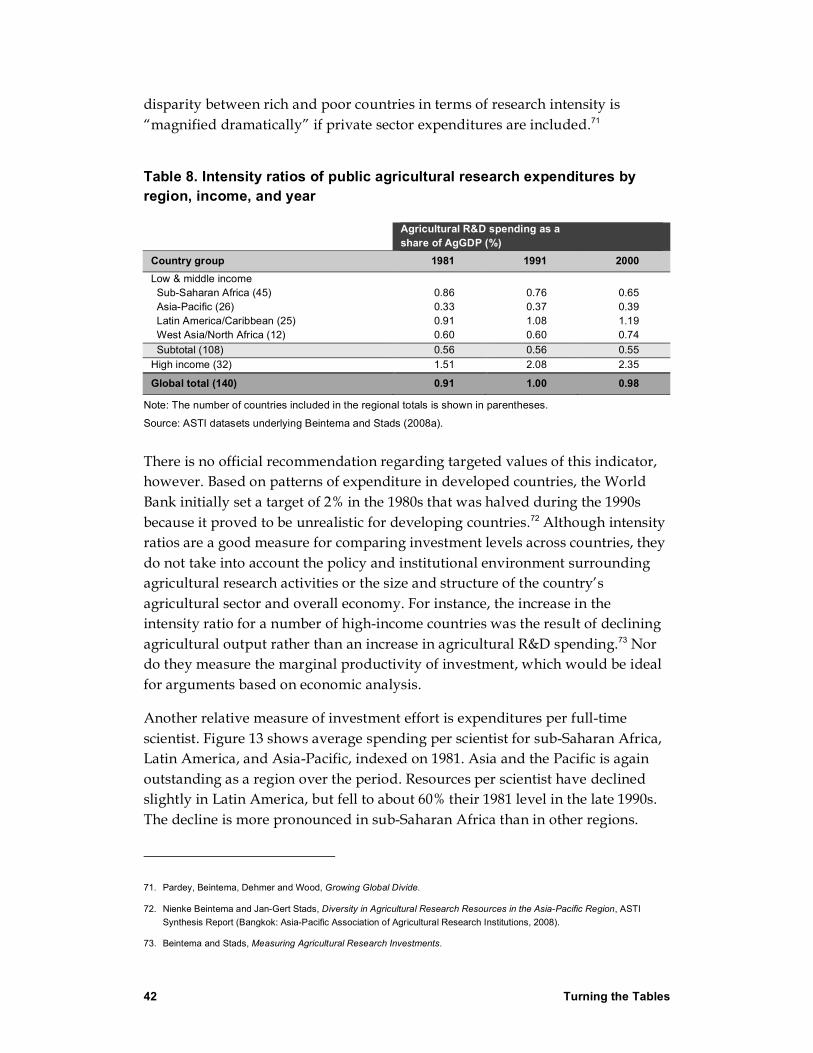
Turning the Tables 42
disparity between rich and poor countries in terms of research intensity is “magnified dramatically” if private sector expenditures are included.71
Table 8. Intensity ratios of public agricultural research expenditures by region, income, and year
Agricultural R&D spending as a share of AgGDP (%)
Country group 1981 1991 2000 Low & middle income Sub-Saharan Africa (45) 0.86 0.76 0.65 Asia-Pacific (26) 0.33 0.37 0.39 Latin America/Caribbean (25) 0.91 1.08 1.19 West Asia/North Africa (12) 0.60 0.60 0.74 Subtotal (108) 0.56 0.56 0.55 High income (32) 1.51 2.08 2.35
Global total (140) 0.91 1.00 0.98
Note: The number of countries included in the regional totals is shown in parentheses.
Source: ASTI datasets underlying Beintema and Stads (2008a).
There is no official recommendation regarding targeted values of this indicator, however. Based on patterns of expenditure in developed countries, the World Bank initially set a target of 2% in the 1980s that was halved during the 1990s because it proved to be unrealistic for developing countries.72 Although intensity ratios are a good measure for comparing investment levels across countries, they do not take into account the policy and institutional environment surrounding agricultural research activities or the size and structure of the country’s agricultural sector and overall economy. For instance, the increase in the intensity ratio for a number of high-income countries was the result of declining agricultural output rather than an increase in agricultural R&D spending.73 Nor do they measure the marginal productivity of investment, which would be ideal for arguments based on economic analysis.
Another relative measure of investment effort is expenditures per full-time scientist. Figure 13 shows average spending per scientist for sub-Saharan Africa, Latin America, and Asia-Pacific, indexed on 1981. Asia and the Pacific is again outstanding as a region over the period. Resources per scientist have declined slightly in Latin America, but fell to about 60% their 1981 level in the late 1990s. The decline is more pronounced in sub-Saharan Africa than in other regions.
71. Pardey, Beintema, Dehmer and Wood, Growing Global Divide.
72. Nienke Beintema and Jan-Gert Stads, Diversity in Agricultural Research Resources in the Asia-Pacific Region, ASTI Synthesis Report (Bangkok: Asia-Pacific Association of Agricultural Research Institutions, 2008).
73. Beintema and Stads, Measuring Agricultural Research Investments.
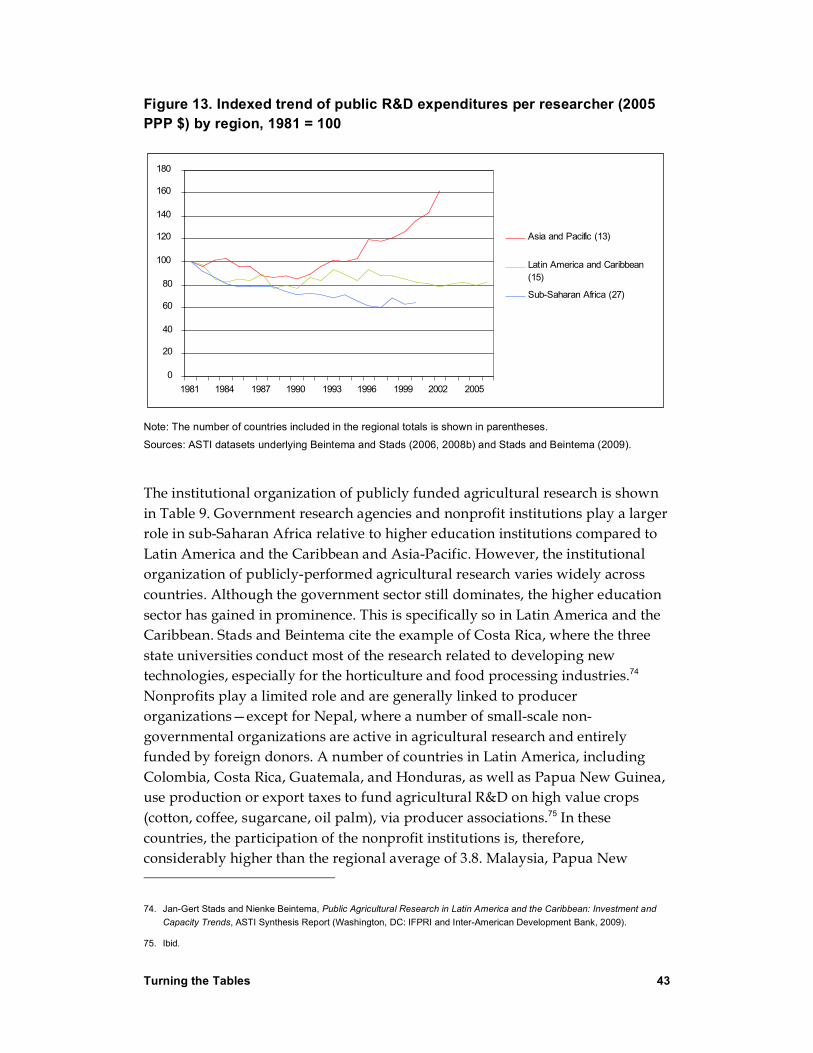
Turning the Tables 43
Figure 13. Indexed trend of public R&D expenditures per researcher (2005 PPP $) by region, 1981 = 100
0
20
40
60
80
100
120
140
160
180
1981 1984 1987 1990 1993 1996 1999 2002 2005
Asia and Pacific (13)
Latin America and Caribbean(15)
Sub-Saharan Africa (27)
Note: The number of countries included in the regional totals is shown in parentheses.
Sources: ASTI datasets underlying Beintema and Stads (2006, 2008b) and Stads and Beintema (2009).
The institutional organization of publicly funded agricultural research is shown in Table 9. Government research agencies and nonprofit institutions play a larger role in sub-Saharan Africa relative to higher education institutions compared to Latin America and the Caribbean and Asia-Pacific. However, the institutional organization of publicly-performed agricultural research varies widely across countries. Although the government sector still dominates, the higher education sector has gained in prominence. This is specifically so in Latin America and the Caribbean. Stads and Beintema cite the example of Costa Rica, where the three state universities conduct most of the research related to developing new technologies, especially for the horticulture and food processing industries.74 Nonprofits play a limited role and are generally linked to producer organizations—except for Nepal, where a number of small-scale non-governmental organizations are active in agricultural research and entirely funded by foreign donors. A number of countries in Latin America, including Colombia, Costa Rica, Guatemala, and Honduras, as well as Papua New Guinea, use production or export taxes to fund agricultural R&D on high value crops (cotton, coffee, sugarcane, oil palm), via producer associations.75 In these countries, the participation of the nonprofit institutions is, therefore, considerably higher than the regional average of 3.8. Malaysia, Papua New
74. Jan-Gert Stads and Nienke Beintema, Public Agricultural Research in Latin America and the Caribbean: Investment and Capacity Trends, ASTI Synthesis Report (Washington, DC: IFPRI and Inter-American Development Bank, 2009).
75. Ibid.
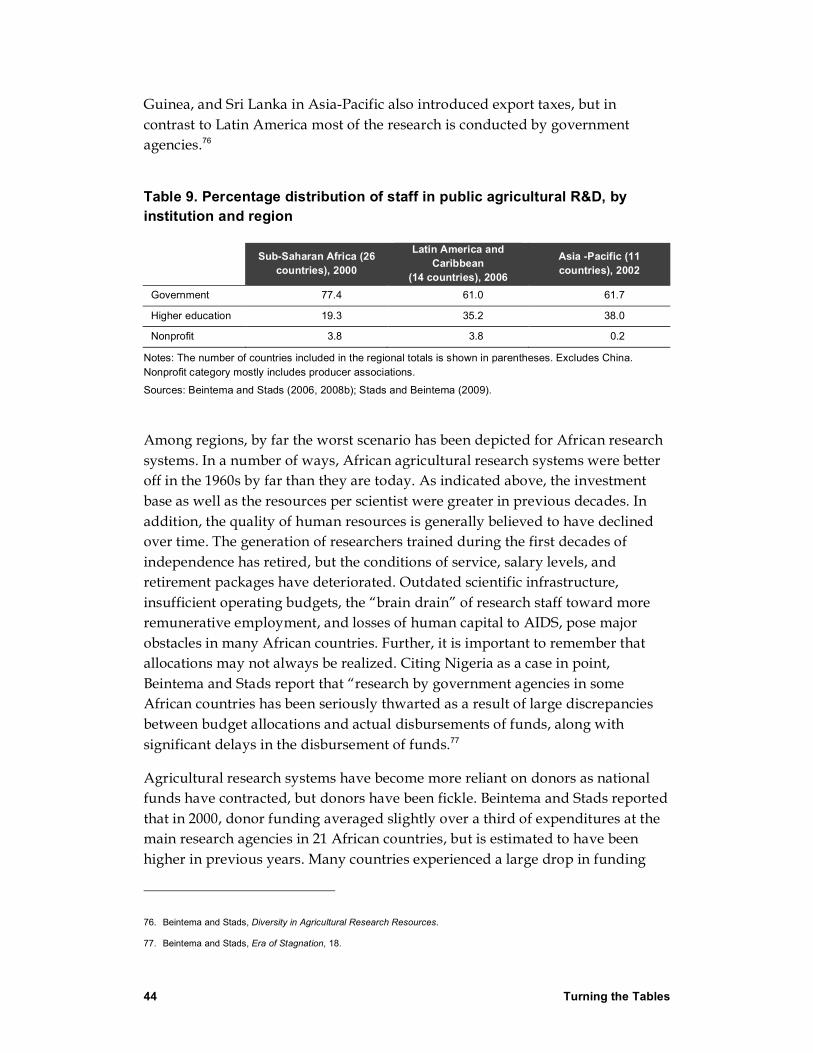
Turning the Tables 44
Guinea, and Sri Lanka in Asia-Pacific also introduced export taxes, but in contrast to Latin America most of the research is conducted by government agencies.76
Table 9. Percentage distribution of staff in public agricultural R&D, by institution and region
Sub-Saharan Africa (26 countries), 2000
Latin America and Caribbean
(14 countries), 2006
Asia -Pacific (11 countries), 2002
Government 77.4 61.0 61.7
Higher education 19.3 35.2 38.0
Nonprofit 3.8 3.8 0.2
Notes: The number of countries included in the regional totals is shown in parentheses. Excludes China. Nonprofit category mostly includes producer associations.
Sources: Beintema and Stads (2006, 2008b); Stads and Beintema (2009).
Among regions, by far the worst scenario has been depicted for African research systems. In a number of ways, African agricultural research systems were better off in the 1960s by far than they are today. As indicated above, the investment base as well as the resources per scientist were greater in previous decades. In addition, the quality of human resources is generally believed to have declined over time. The generation of researchers trained during the first decades of independence has retired, but the conditions of service, salary levels, and retirement packages have deteriorated. Outdated scientific infrastructure, insufficient operating budgets, the “brain drain” of research staff toward more remunerative employment, and losses of human capital to AIDS, pose major obstacles in many African countries. Further, it is important to remember that allocations may not always be realized. Citing Nigeria as a case in point, Beintema and Stads report that “research by government agencies in some African countries has been seriously thwarted as a result of large discrepancies between budget allocations and actual disbursements of funds, along with significant delays in the disbursement of funds.77
Agricultural research systems have become more reliant on donors as national funds have contracted, but donors have been fickle. Beintema and Stads reported that in 2000, donor funding averaged slightly over a third of expenditures at the main research agencies in 21 African countries, but is estimated to have been higher in previous years. Many countries experienced a large drop in funding
76. Beintema and Stads, Diversity in Agricultural Research Resources.
77. Beintema and Stads, Era of Stagnation, 18.
Turning the Tables 45
during the late 1990s, which the authors attributed to the termination of World Bank, USAID or FAO project funding in support of agricultural research. The World Bank was a very important contributor to agricultural research activities in Africa through loan-supported projects, but funds declined precipitously during the 1990s—from $120 million in 1991 to only $8 million in 2002 (in 1993 PPP prices). Funding from the United States Agency for International Development (USAID) also declined from $80 million in 1982 to well under $20 million from 1999 onward.78 Main factors in the decline of USAID funding were the significant decrease in discretionary (non-earmarked) funding for economic growth in general and agriculture specifically, while competition for these funds increased dramatically due to a surge of interest in democracy and governance.79
Irrespective of region or national income, gender discrepancies in scientific staff persistently thwart the development of the human capital that is necessary to keep up with advances in technology, practices, and their dissemination to farmers (Box 2).
Box 2. Gender and scientific research
Beintema documents the well-known gender gap among agricultural research staff in developing countries. Women represent 17% of full-time scientists in the Middle East & North Africa, 18% in sub-Saharan Africa, 20% in Latin America and the Caribbean, and 20% in the Asia-Pacific region. Over all regions, women represent about 1 out of 5 full-time scientists. The share of researchers with higher degrees is lower for women than for men in all regions, and the share of women students enrolled in higher education in the agricultural sciences is lower than in all fields of higher education.80
Stads and Beintema examined this problem more closely in sub-Saharan Africa, using the last year of data available (2000). Across regions, women were least represented in agricultural research in West Africa (under 10%); women were better represented in East and Southern Africa, but also less than 10% in Ethiopia and Eritrea.81 Similarly, the greatest education gap is in West Africa. In a 15-country sample in Latin America, by contrast, Beintema found that 34% of all agricultural researchers were women, with
78. Beintema and Stads, Era of Stagnation.
79. Timothy Mahoney, personal communication, October 30, 2008.
80. Nienke Beintema, “Participation of Female Agricultural Scientists in Developing Countries,” brief prepared for the meeting Women in Science: Meeting the Challenge, an adjunct to the CGIAR Annual General Meeting, Washington, DC, December 4, 2006.
81. Jan-Gert Stads and Nienke Beintema, “Women Scientists in Sub-Saharan African Agricultural R&D,” brief prepared for the USAID meeting Women in Science: Meeting the Challenge. Lessons for Agricultural Sciences in Africa, Washington, DC, June 21, 2006.

Turning the Tables 46
wide variation by country. In Honduras, under 10% were women, while in Argentina and Uruguay, over 40% were women.82
Why, exactly, are these gender differences a problem? The basic point of targeting any social group that has been underrepresented is not that they necessarily do the work better, but that it increases the total pool of talents, increasing the chances of finding talent. Barriers to entry mean that some individuals with talent for this area of endeavor are instead directed to areas where their talents are underutilized, with a loss to society. Even if the distribution of talent in the two populations is the same, it may make more sense to sample the next unexploited talent in the underrepresented group because more talent is obtained at lower opportunity cost (the cost of attracting a less talented individual in the overrepresented group is higher because that individual is better suited to another occupation).
The problem of gender barriers continues in the scientific workplace and extends to rich countries, as exemplified by the MIT study on science in US academia. The telling finding of the study was that that marginalization of women increased over time with career development. Junior women faculty believed that family-work conflicts affected their careers differently from those of male colleagues, but did not feel lack of professional support. Many tenured women faculty felt excluded from a significant role in their departments. Marginalization implied differences in salary, space, awards, resources, and response to outside offers. Women received less despite professional accomplishments equal to those of their male colleagues. The study also found that the pattern repeats itself in successive generations of women faculty.83
Indicators of private agricultural R&D investments In 2000, of the $40 billion in total global agricultural R&D spending (in 2005 PPP dollars), the private sector accounted for 41%, but most of this research was performed by private companies in high-income countries. Private firm expenditures on agricultural R&D in low- and middle-income countries represent a mere 2% of the total public and private expenditure in agricultural R&D compared to the corresponding share of 39% of private firm expenditures in high-income countries. The authors assert that the role of the private sector is likely to remain small given weak funding incentives for private research and the fact that many private-sector activities in developing countries focus solely on the provision of input technologies or technological services for agricultural production that are produced in the developed world.84 For example, the
82. Beintema, "Participation of Female Agricultural Scientists in Developing Countries."
83. Massachusetts Institute of Technology (MIT), Study on the Status of Women Faculty in Science at MIT (Cambridge, MA: MIT, 1999).
84. Beintema and Stads, Measuring Agricultural Research Investments; Pardey et al. (2006).
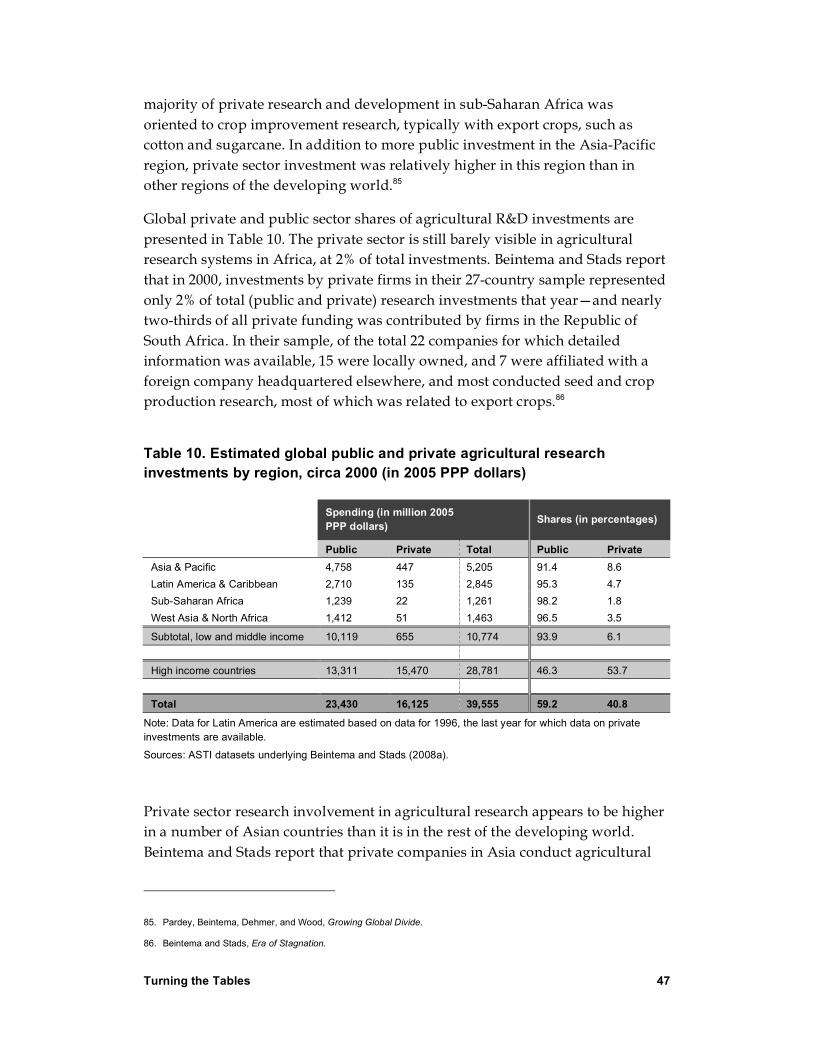
Turning the Tables 47
majority of private research and development in sub-Saharan Africa was oriented to crop improvement research, typically with export crops, such as cotton and sugarcane. In addition to more public investment in the Asia-Pacific region, private sector investment was relatively higher in this region than in other regions of the developing world.85
Global private and public sector shares of agricultural R&D investments are presented in Table 10. The private sector is still barely visible in agricultural research systems in Africa, at 2% of total investments. Beintema and Stads report that in 2000, investments by private firms in their 27-country sample represented only 2% of total (public and private) research investments that year—and nearly two-thirds of all private funding was contributed by firms in the Republic of South Africa. In their sample, of the total 22 companies for which detailed information was available, 15 were locally owned, and 7 were affiliated with a foreign company headquartered elsewhere, and most conducted seed and crop production research, most of which was related to export crops.86
Table 10. Estimated global public and private agricultural research investments by region, circa 2000 (in 2005 PPP dollars)
Spending (in million 2005 PPP dollars) Shares (in percentages)
Public Private Total Public Private Asia & Pacific 4,758 447 5,205 91.4 8.6 Latin America & Caribbean 2,710 135 2,845 95.3 4.7 Sub-Saharan Africa 1,239 22 1,261 98.2 1.8 West Asia & North Africa 1,412 51 1,463 96.5 3.5
Subtotal, low and middle income 10,119 655 10,774 93.9 6.1
High income countries 13,311 15,470 28,781 46.3 53.7
Total 23,430 16,125 39,555 59.2 40.8
Note: Data for Latin America are estimated based on data for 1996, the last year for which data on private investments are available.
Sources: ASTI datasets underlying Beintema and Stads (2008a).
Private sector research involvement in agricultural research appears to be higher in a number of Asian countries than it is in the rest of the developing world. Beintema and Stads report that private companies in Asia conduct agricultural
85. Pardey, Beintema, Dehmer, and Wood, Growing Global Divide.
86. Beintema and Stads, Era of Stagnation.
Turning the Tables 48
research, and fund public agricultural research, either by outsourcing their research needs to govern R&D or through commodity levies paid by farmers. In a sample of 11 countries (excluding China and India, for example), Bangladesh, Laos, Nepal, Sri Lanka, and Vietnam had the lowest private-sector involvement; the highest were Indonesia and the Philippines. In contrast to sub-Saharan Africa, with the exception of Laos and Nepal, donor dependency is low. Funding sources also differ significantly across countries, and new mechanisms for financing public agricultural R&D are apparent. Internally generated income has become increasingly important to both China and Indonesia through commercial activities, provision of research services, sales of seed and plantation crops, and contract research.87
The agricultural R&D investment gap As noted in the section titled “Vacillating public commitments to agriculture,” the structure and strategic direction of agricultural R&D in the 20th century meant that even countries who could not invest could benefit substantially from spatial and temporal spillovers in technology. The thesis of Pardey et al. is that this technology transfer will no longer be feasible, for two essential reasons.88 The first is that the research agenda in rich countries has shifted away from the interests of the world’s poorest people. In a book published nearly 10 years ago, Alston, Pardey, and Smith documented the changing landscape of investments in agricultural productivity among richer countries. They expressed concern about the reduced investments in the type of applied research that generates relatively rapid productivity gains.89 Subsequently, Pardey et al. reported that in many rich countries, toward the end of the 20th century, a) public and private roles shifted and b) support for publicly funded agricultural research slowed, especially for near-market, applied, productivity-enhancing research—which is exactly what is still needed in many developing countries.90 With respect to staple food crops, Pardey, Alston, and Piggott assert that poor countries may no longer be able to depend as they have in the past on spillovers of new agricultural technologies and knowledge from richer countries. Many of the major and minor crops grown
87. Beintema and Stads, Diversity in Agricultural Research Resources.
88. Pardey, Beintema, Dehmer, and Wood, Growing Global Divide.
89. Julian Alston, Philip Pardey, and Vince Smith, Paying for Agricultural Productivity (Baltimore: Johns Hopkins University Press, 1999).
90. Pardey, Beintema, Dehmer, and Wood, Growing Global Divide.
Turning the Tables 49
by the world’s poor farmers also remain under-researched and thus less productive.91
The second reason is the structure of agricultural R&D in rich countries, which both shapes and responds to the evolving research agenda.92 While the private sector has assumed an increasingly prominent role in funding agricultural R&D, the implications of this shift are not necessarily positive for poorer countries. Changes in the institutional composition of agricultural R&D not only results in a heavier focus on basic (“upstream”) as compared to applied (“downstream”) research, but to a concentration of intellectual property and integration of product development in “life-science” corporations. Research by Pray, Fuglie, and Johnson, conducted in eight countries in Asia, documents the considerable private sector interest in developing agricultural technologies for China, India, and Brazil, where many of the larger, technology-intensive multinationals have established research stations. Relatively little private sector effort is directed to technology transfer and adaptation in sub-Saharan Africa.93
According to Pardey et al., excepting a few countries, the gains of developing countries in scientific and technological capacities have slowed relative to the pace achieved in the 1960s, 1970s, and earlier. The authors demonstrated that aside from a handful of larger countries, such as Brazil, China, and India (Annex 2), many developing countries, especially in Africa, face serious funding and institutional constraints that inhibit the effectiveness of local research and development. The authors also identify variability in research funding and an overemphasis on short-term projects as cause for concern.94
Shifting investment policies, shifting research agendas, and a shifting funding base lead to variable and uncertain commitments to agricultural research, which is counterproductive for scientific progress. Today’s policymakers will need to grapple with the consequences of investment decisions made in previous decades. Fuglie examined patterns of growth in agricultural TFP through 2006. In developed countries, resources are being withdrawn from agriculture but TFP growth continues at historical levels. The performance of developing country agriculture has been dominated by strong and sustained productivity growth of a few large countries, especially Brazil and China. Sub-Saharan Africa is an exception, where little to no growth has occurred. He concludes that while
91. Pardey, Alston, and Piggott, Too Little, Too Late.
92. Pardey, Beintema, Dehmer, and Wood, Growing Global Divide.
93. Carl Pray, Keith Fuglie, and Daniel Johnson, “Private Sector Research,” in R.E. Evenson, P. Pingali, and T. Paul Schultz (eds.), Handbook of Agricultural Economics, Vol. 3, Agricultural Development: Farmers, Farm Production and Farm Markets (Amsterdam: Elsevier, 2007).
94. Pardey, Beintema, Dehmer, and Wood, Growing Global Divide.

Turning the Tables 50
countries that have established effective agricultural R&D institutions have been able to sustain TFP growth in their agricultural sectors despite the withdrawal of resources, many countries have not. Countries that failed to establish minimally effective agricultural research and extension institutions continue to suffer from very low agricultural productivity, falling further behind over time.95
95. Keith Fuglie, “Is a Slowdown in Agricultural Productivity Growth Contributing to the Rise In Commodity Prices?" Agricultural Economics (forthcoming).
Turning the Tables 51
Policy implications
To achieve food security goals, mitigate and adapt to climate change, new, larger, more predictable investments in agriculture are needed from donors, national governments, farmers, and where appropriate, the private sector. Oxfam recommends that donors, national governments, and private sector investors place agriculture at “center stage.” Despite diverging views, the bulk of the historical evidence supports the perspective that in poor countries whose economies and employment depend to a larger extent on agriculture, agricultural growth is and will remain pro-poor. There are important exceptions to this generalization, and some are clearly related to poor governance or lack of government attention to deep, underlying social inequalities.
At the same time, leaving everything to the private sector and the market is not enough. With the help of donors, national governments must commit public resources to agriculture. Because opportunities for profitable investments by private sector investors remain limited in poor countries, and the potential for research spillovers from richer countries is dwindling, the public sector and voluntary sector must play stronger roles. Even in richer nations where private sector investments have grown over time as a share of total investments, the public sector addresses strategic niches in order to ensure that the public good attributes of agriculture and in particular, research and development, continue to be produced as is required to maintain a healthy agricultural economy. Further, the world’s rural poor will not earn their share of the benefits from agricultural growth without public commitment to establishing the institutions and policies that mediate the social consequences of technical change. Impacts on rural inequality and land use are examples in point.
Investments in agriculture must be greater, more predictably committed over a longer time frame, and used more wisely. More should be invested in agricultural research now—reversing the declining trends of the past few decades. Cutting edge, long-term research appears even more crucial now that the inherent risks of agricultural production are compounded by risks associated with threatened ecosystems and the uncertainty of climate change. The poor are always more vulnerable to risk, and agricultural research will not be sufficient to address their needs. Thus, public investments in agricultural research must be complemented by investments in infrastructure, education, and health, as well as rural development in general, including nonfarm enterprise and employment that offer exit opportunities. Although not explored in this paper, it is evident that spending more money does not imply that it is better spent. Public investors
Turning the Tables 52
should also be accountable. Donor investments need to be responsive to and supporting of country priorities. Donors need to work with effective states or where states are ineffective, civil society. Related working papers in this series will explore these last two points in more detail.
Turning the Tables 53
Annex 1. Three agricultural investment leaders: China, India and Brazil
Emergent in a changing global economic order, China, India, and Brazil lead the developing world in agricultural investments. Each occupies a large share of total cropped area in its respective geopolitical region. However, 29% of Brazil’s arable land, 37% of India’s, and over half (57%) of China’s, is unfavorable for agriculture.96 In addition, all three nations battle poverty and inequality, and are still categorized as lower middle income by the World Bank.
The institutional organization of agricultural R&D Historically, India’s has been a powerful, publicly funded research system. Organized as a federal-state system, variation by state and agroecology occurs within a framework of certain common policies. India’s is “one of the largest and most complex agricultural research systems in the world, with more than a century of organized application of science to agriculture” where “a proactive government policy,” combined with steady support from bilateral and multilateral donors, generated “an institutionally diverse research system.”97 The Green Revolution of the 1960s and 1970s in wheat and rice was its most famous success story. Now, that system faces the challenges of natural resource degradation and food safety, added to the old challenge of persistent poverty.
Participation of private companies and nonprofit organizations in agricultural research has expanded. For example, the private sector now supplies half of all certified seed, half of all fertilizer, and most of the pesticides and farm machinery. The fact that rainfed areas require more location-specific research to adapt technologies was officially recognized in an eco-regional approach to
96. Kate Sebastian, “Technical Annex: Mapping favorability for agriculture in low and middle income countries: technical report, maps and statistical tables,” in Melinda Smale and Emily Alpert, “Making Investments in Poor Farmers Pay: A review of evidence and sample of options for marginal areas,” Oxfam America Research Backgrounder number 1, 70-105 (Boston: Oxfam America, 2009).
97. Suresh Pal and Derek Byerlee, “India: The Funding and Organization of Agricultural R&D—Evolution and Emerging Policy Issues,” Chapter 7 in P. Pardey, J.M. Alston, and R.R. Piggott (eds.), Agricultural R&D in the Developing World (Washington, DC: IFPRI, 2006): 155.
Turning the Tables 54
planning and organizing agricultural research, introduced in 1978, which divided the country into 126 agro-climatic zones, each with a station to carry out applied and adaptive research relevant to the zone. With support from the World Bank, the approach now includes participatory identification of research programs and use of a multi-institutional and multidisciplinary systems perspective.98 Hall et al. report significant private sector research and development capability is emerging through three types of public-private interactions (private distribution of public technologies, private purchase of public research services and technologies, and public-private collaborate research).99 However, case studies suggest that they are not meeting their potential in large part because of legacy of an earlier institutional model.
In India, real public funding of agricultural research and development displays an upward trend from 1961 through 2000.100 Since the 1980s, the government has provided strong incentives in terms of tax exemptions on research expenditures and venture capital, and liberal policies on imports of equipment needed for research. Most public funding is in block grants. Competitive funding is gaining in popularity, but research priorities are not well defined, the number of proposals is larger, and the success rate is low. The central government (the World Bank is a big source of these funds) provides 52% of public funding for agricultural research and development in India. States play a strong role in funding, having distributed a funding share comparable to the federal share over the forty-year period. Annual block grants from the state governments to the state agricultural universities are the second major source of funding, and private funding of research in public organizations is negligible.101
Brazil’s agriculture benefits from the research programs of private firms as well as research conducted in state and federal programs. The major plant breeding programs are those of the Brazilian Agricultural Research Corporation (EMBRAPA), established in the mid-1970s, which maintains federal crop research programmes in different regions of Brazil.102 EMBRAPA is the largest agricultural R&D agency in Latin America,103 5,400 of the region’s 19,000 public
98. Ibid: 163.
99. Andrew Hall, A. R. Sulaiman, N. Clark, M.V.K. Sivamohan, and B. Yoganand, “Public-Private Sector Interaction in the Indian Agricultural Research System: An Innovation Systems Perspective on Institutional Reform,” in D. Byerlee and R. Echeverria (eds.), Agricultural Research in an Era of Privatization (Wallingford, UK: CABI Publications, 2002).
100. Pal and Byerlee, “Funding and Organization of Agricultural R&D,” 171.
101. Ibid.
102. A.F.D. Avila, R.E. Evenson, S. de Silva and F.A. de Almeira, “Brazil,” in R.E. Evenson and D. Gollin (eds.), Crop Variety Improvement and Its Effect on Productivity: The Impact of International Agricultural Research (Wallingford, UK: FAO and CABI Publishing, 2003).
103. Stads and Beintema, Investment and Capacity Trends.
Turning the Tables 55
agricultural researchers are found in Brazil, and they are the most qualified (nearly two-thirds have PhDs). Agricultural R&D in Brazil is organizationally complex, encompassing numerous federal and state government agencies, higher-education institutions, nonprofit institutions and private enterprises. Nonetheless, the public sector is still the predominant provider of R&D in Brazil, and government agencies have accounted for close to two-thirds of the country’s agricultural R&D expenditures over the past three decades.104 Although an increasing amount of the agricultural technologies appear to have been provided by private sector, few resulted from private research conducted in Brazil. Over the years, EMBRAPA has had a number of loans from the IDB and the World Bank, most of which were for capacity strengthening; state agency funding has been increasingly reliant on funding from nongovernment sources (foundations). Competitive funding mechanisms, a relatively new instrument for disbursing research resources, have been deployed in Brazil for some time.
In China, Fan et al. argue that further reform of the public system is needed to improve its efficiency.105 The organizational structure remains administrative rather than based on agroecological criteria. A new focus has been privatization, especially as the demand for agricultural technologies has gradually moved off the farm with rising incomes. Reform is not easy—downsizing staff often requires additional compensatory funds, raising salaries of remaining staff, and supporting retirees. Huang et al. conclude that successful commercialization of research products, which is a key part of the proposed reform package, will depend on much broader reforms of the extension, seed, and pension systems.106
In their book comparing agricultural and rural reforms in China and India, Gulati and Fan conclude that agriculture-led growth in China has reduced poverty much faster than India’s reform and liberalization of the manufacturing sector. They note that “initial conditions” (life expectancy, egalitarian access to land) predetermined some differences between the two countries. The decline in rural public investments that resulted from “fiscal profligacy and rising subsidies on fertilizer, power, water, and price support” was also blamed for slower growth in India from 1997. Still, agricultural input subsidies have continued “unabated” in India. These are costly and less effective in promoting growth than investments in agricultural research, education, and rural roads. Gulati and Fan also argue that subsidies in India discouraged the agricultural diversification from which China is now benefiting. Finally they cite the rapid growth of rural
104. Ibid.
105. Fan et al. (2006)
106. Jikun Huang, Ruifa Hu, Carl Pray, and Scott Rozelle, “Reforming China’s Agricultural Research System,” Chapter 13 in D. Byerlee and R.B. Echerverría, Agricultural Research Policy in an Era of Privatization (Wallingford, UK: CABI International, 2002).
Turning the Tables 56
enterprises in China, and underscore the need for rural education to spearhead rural non-farm enterprise opportunities. In terms of governance, they describe India as a “debating society” and China as a “mobilizing society.”107
Indicators of investment in agricultural R&D China, India, and Brazil also lead in terms of agricultural research investments. Each has successful research institutions in which governments and donors have invested substantially during the past century, although the organizational structures of these systems differ. In 2000, public agricultural R&D expenditure in the three countries combined accounted for 44% of total spending in low- and middle-income countries, which was an increase from the 35-percent share in 2000. Recent data show that agricultural research investments continued to grow in recent years. Thus, the combined share of the three countries in the overall total is expected to have increased since 2000. Investment growth in India and China have been consistently higher, while the number of full-time scientists has declined during the past decade in China and risen only slightly in India. Consequently, the upward trend in innovation resources per scientist from 1991 is pronounced in China and India, especially compared to other low- and middle-income countries. Changes in research technology, expressed in a changing capital to labor ratio, probably underlay at least part of this trend—reflecting the fact that these institutions strive to keep abreast—if not supersede—the pace of scientific progress in the richer world.
107. Ashok Gulati and Shenggen Fan (eds.), The Dragon and the Elephant: Rural Development and Agricultural Reforms in China and India (Baltimore: Johns Hopkins University Press, 2007).
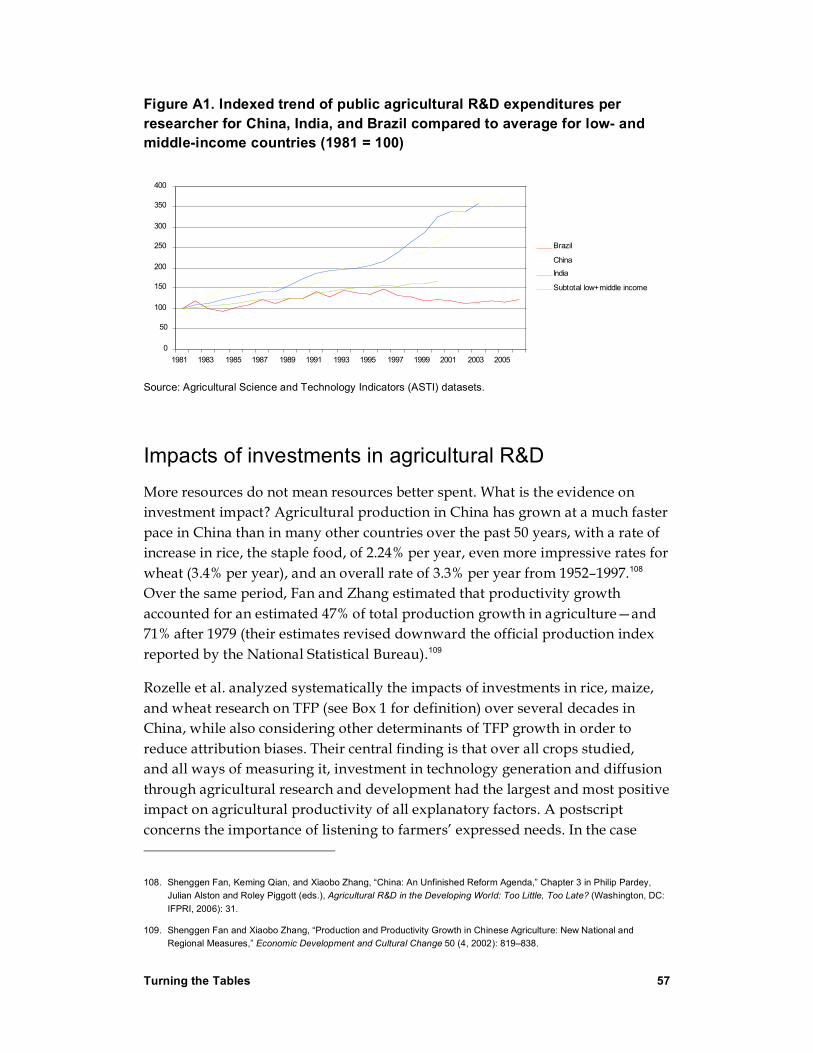
Turning the Tables 57
Figure A1. Indexed trend of public agricultural R&D expenditures per researcher for China, India, and Brazil compared to average for low- and middle-income countries (1981 = 100)
0
50
100
150
200
250
300
350
400
1981 1983 1985 1987 1989 1991 1993 1995 1997 1999 2001 2003 2005
Brazil
China
India
Subtotal low+middle income
Source: Agricultural Science and Technology Indicators (ASTI) datasets.
Impacts of investments in agricultural R&D More resources do not mean resources better spent. What is the evidence on investment impact? Agricultural production in China has grown at a much faster pace in China than in many other countries over the past 50 years, with a rate of increase in rice, the staple food, of 2.24% per year, even more impressive rates for wheat (3.4% per year), and an overall rate of 3.3% per year from 1952–1997.108 Over the same period, Fan and Zhang estimated that productivity growth accounted for an estimated 47% of total production growth in agriculture—and 71% after 1979 (their estimates revised downward the official production index reported by the National Statistical Bureau).109
Rozelle et al. analyzed systematically the impacts of investments in rice, maize, and wheat research on TFP (see Box 1 for definition) over several decades in China, while also considering other determinants of TFP growth in order to reduce attribution biases. Their central finding is that over all crops studied, and all ways of measuring it, investment in technology generation and diffusion through agricultural research and development had the largest and most positive impact on agricultural productivity of all explanatory factors. A postscript concerns the importance of listening to farmers’ expressed needs. In the case
108. Shenggen Fan, Keming Qian, and Xiaobo Zhang, “China: An Unfinished Reform Agenda,” Chapter 3 in Philip Pardey, Julian Alston and Roley Piggott (eds.), Agricultural R&D in the Developing World: Too Little, Too Late? (Washington, DC: IFPRI, 2006): 31.
109. Shenggen Fan and Xiaobo Zhang, “Production and Productivity Growth in Chinese Agriculture: New National and Regional Measures,” Economic Development and Cultural Change 50 (4, 2002): 819–838.
Turning the Tables 58
of rice, they find that increase in TFP “often appear to come less from yield increases than from other productivity-enhancing traits demanded by farmers.”110
Crop genetic improvement has been an expressed national priority for India from the early 1900s; in the sequence of 5 year plans that succeeded independence, agriculture was emphasized by the 1960s.111 India benefited from the high-yielding semi-dwarf varieties of wheat bred by Norman Borlaug and adapted by Indian scientists, under a special project of the Rockefeller Foundation that became part of CIMMYT; and from the high-yielding semi-dwarf varieties of rice bred by IRRI, in the Philippines. India was also the central location of the breeding program of the FAO where early semi-dwarf varieties were developed. The success of the wheat and rice varieties in India in 1968–1975 became known as the Green Revolution, but the period that followed, from 1975– 2000, is actually more important; during that period, the Indian population doubled but food production more than doubled.112
Examining the partial productivity impact of rice, wheat, maize, sorghum, and pearl millet improvement from 1965 to 1995, McKinsey and Evenson found that adoption of modern varieties drove the adoption of tubewell irrigation by farmers and groups of farmers. The share of modern varieties in total yield growth ranged from 41% to 84% and accounted for two-thirds of the productivity impacts for all crops combined. Apart from their contribution through adoption of modern varieties, the impacts of irrigation, extension, and markets was minimal. The contribution of fertilizer use to yield improvement was evident for rice, wheat, and maize, but not for sorghum and pearl millet. They estimate that taking labor productivity and machinery per unit land into account, the share of modern varieties in TFP growth was roughly 50–55%.113
Despite the erratic record of economic growth in Brazil over the past decades, Avila et al. state that “the agricultural sector in Brazil has been its most consistent sector.” The authors examine the impact of research on wheat, rice, maize, beans, potatoes and cotton from 1985 to 1998, by state.114 They find that “for all crops in Brazil over the period studied, improved varieties accounted for roughly 50% of
110. Scott Rozelle, Songquin Jin, Jikun Huang, and Ruifa Hu, “The Impact of Investments in Agricultural Research on Total Factor Productivity in China,” Chapter 18 in R.E. Evenson, and D. Gollin (eds.), Crop Variety Improvement and Its Effect on Productivity: The Impact of International Agricultural Research (Wallingford, UK: CABI Publishing, 2003): 381.
111. James McKinsey and Robert Evenson, “Crop Genetic Improvement Impacts on Indian Agriculture,” Chapter 19 in R.E. Evenson and D. Gollin (eds.), Crop Variety Improvement and Its Effect on Productivity: The Impact of International Agricultural Research, (Wallingford, UK: CABI Publishing, 2003).
112. Ibid.
113. Ibid.
114. Avila, Evenson, de Silva, and de Almeira, “Brazil.”
Turning the Tables 59
the increased crop yields actually realized. The share of actual yield increases accounted for by variety improvement varies across crops from 18 to 78%.”115 In the Brazilian case, most of the improved varieties are crossed in Brazil, with limited contributions from the international agricultural research centers.
115. Ibid 422.

Forty percent of the people on our planet—more than 2.5 billion—now live in poverty, struggling to survive on less than $2 a day. Oxfam America is an international relief and development organization working to change that. Together with individuals and local groups in more than 100 countries, Oxfam saves lives, helps people overcome poverty, and fights for social justice. To join our efforts or learn more, go to oxfamamerica.org.
Headquarters 226 Causeway Street, 5th Floor Boston, MA 02114-2206 (800) 77-OXFAM
Policy & advocacy office 1100 15th Street, NW, Suite 600 Washington, DC 20005 (202) 496-1180
oxfamamerica.org © 2009 Oxfam America Inc. All Rights Reserved. Oxfam America is a registered trademark of Oxfam America Inc., and the Oxfam logo is a registered trademark of Stichting Oxfam International.