tutorial psgic - sermnsermn.uab.cat/wp-content/uploads/2016/03/tutorial-psgic-1.pdf · tutorial...
TRANSCRIPT

TUTORIAL psGIC
2D-DIAG FROM 1D HOMODECUPLED
1. To begin, import your 2D homo or heteronuclear spectrum and your 1D
homodecoupled 1H spectrum into Mnova 10.1 software.
2. For to reconstruct the 2D DIAG from 1D pure shift spectrum, it’s
necessary to use the make2D script (Figure 1). This script is offered by
Mnova (please contact us so we can send you this script).
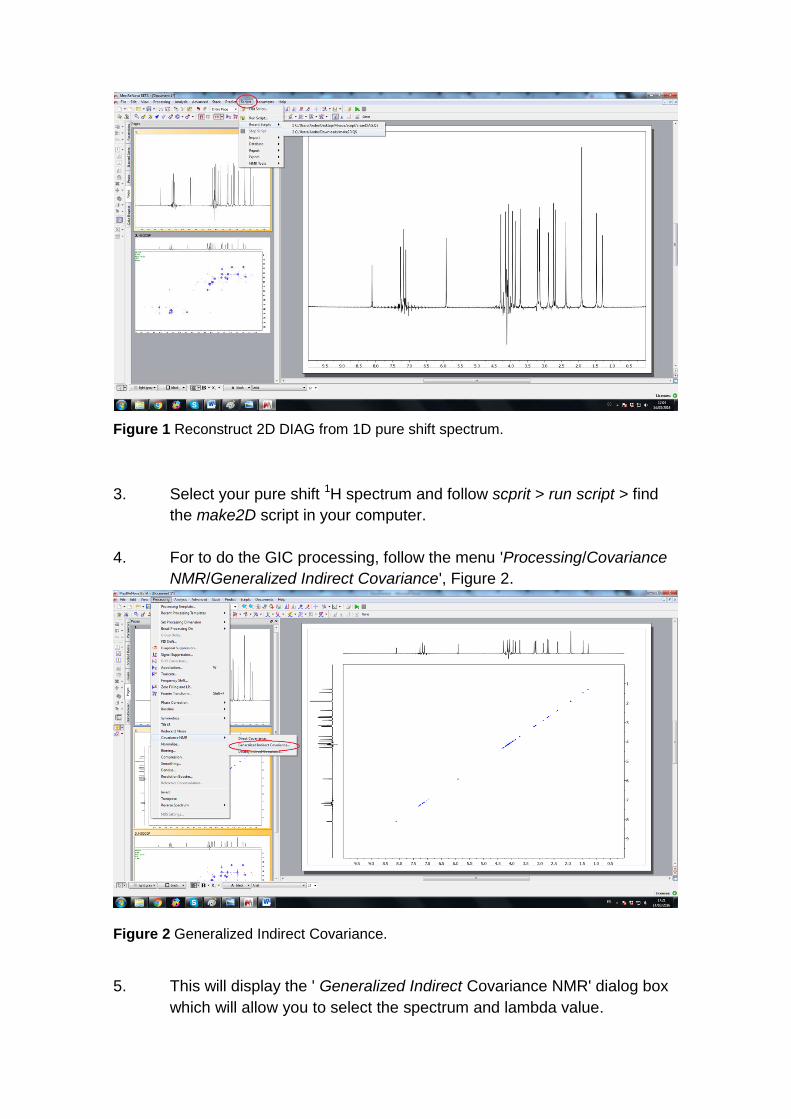
Figure 1 Reconstruct 2D DIAG from 1D pure shift spectrum.
3. Select your pure shift 1H spectrum and follow scprit > run script > find
the make2D script in your computer.
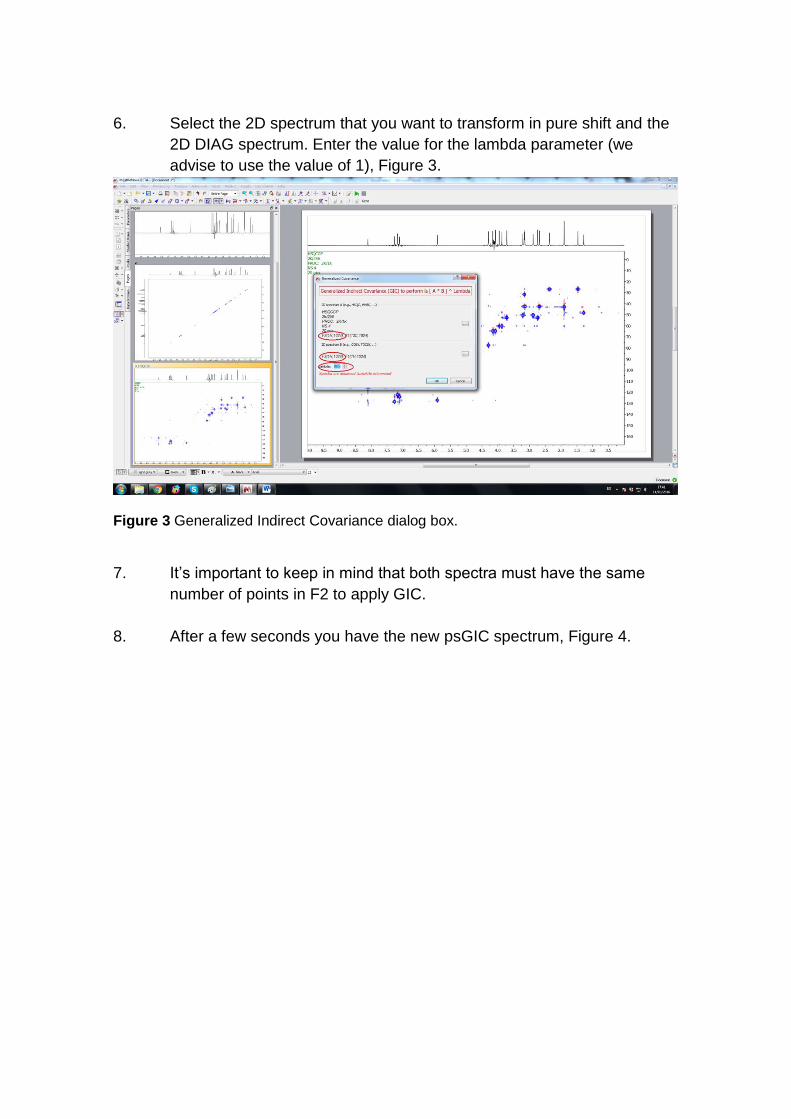
4. For to do the GIC processing, follow the menu 'Processing/Covariance
NMR/Generalized Indirect Covariance', Figure 2.
Figure 2 Generalized Indirect Covariance.
5. This will display the ' Generalized Indirect Covariance NMR' dialog box
which will allow you to select the spectrum and lambda value.
6. Select the 2D spectrum that you want to transform in pure shift and the
2D DIAG spectrum. Enter the value for the lambda parameter (we
advise to use the value of 1), Figure 3.
Figure 3 Generalized Indirect Covariance dialog box.
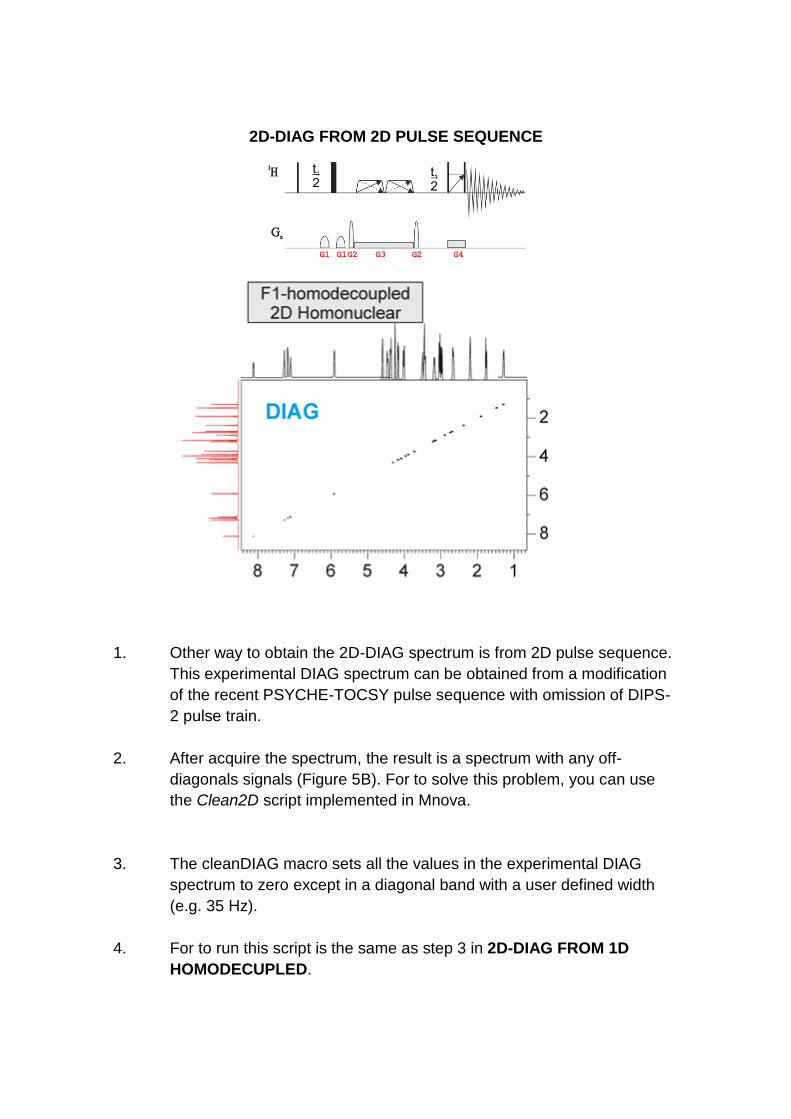
7. It’s important to keep in mind that both spectra must have the same
number of points in F2 to apply GIC.
8. After a few seconds you have the new psGIC spectrum, Figure 4.
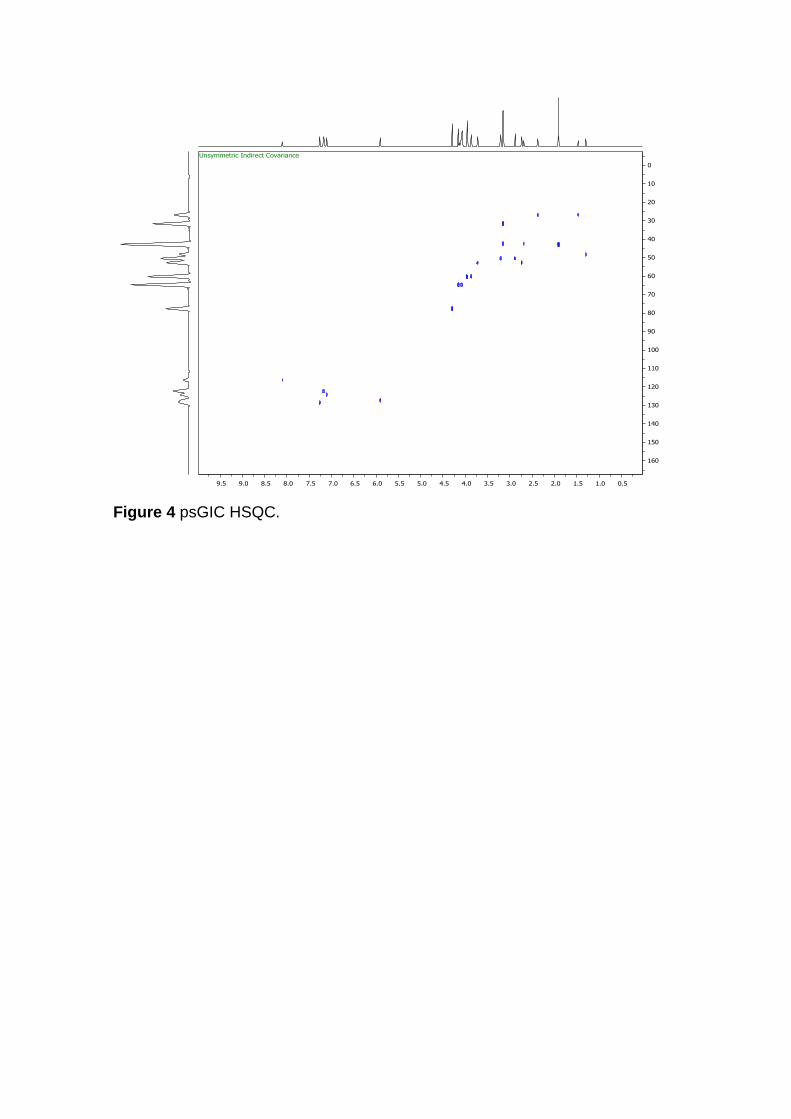
Figure 4 psGIC HSQC.
2D-DIAG FROM 2D PULSE SEQUENCE
1. Other way to obtain the 2D-DIAG spectrum is from 2D pulse sequence.
This experimental DIAG spectrum can be obtained from a modification
of the recent PSYCHE-TOCSY pulse sequence with omission of DIPS-
2 pulse train.
2. After acquire the spectrum, the result is a spectrum with any off-
diagonals signals (Figure 5B). For to solve this problem, you can use
the Clean2D script implemented in Mnova.
3. The cleanDIAG macro sets all the values in the experimental DIAG
spectrum to zero except in a diagonal band with a user defined width
(e.g. 35 Hz).
4. For to run this script is the same as step 3 in 2D-DIAG FROM 1D
HOMODECUPLED.

Figura 5: 5A) Pulse sequence used for the DIAG experiment; B-C) Experimental results showing the removal of any off-diagonal signals in the experimental DIAG spectrum by the Clean2D script implemented in Mnova. The script is executed with a customized multiplet width factor. The experimental DIAG spectrum in B) was recorded using a double frequency-swept chirp pulse length of 30 ms applied simultaneously to a weak gradient of 1.5 G/cm and with a flip-angle of β=20º. C) DIAG spectrum without off-diagonals signals.
5. After to run the Clean2D script, it’s possible to see the difference between
the dimension (Figure 6). Because of this, it is advisable to use Clean 2D
script.

Figura 6: Comparison between the B) internal F1 and C) internal F2 projections in the D) 2D cleanDIAG spectrum of strychnine (see details in Figure 5). The enhanced high resolution obtained along the F1 dimension in DIAG will be projected along the detected F2 dimension of regular homo- and heteronuclear NMR spectra.
If you have any doubts do not hesitate to contact us!