two-dimensional urban flood simulation: fukuoka … · simulation model to the fukuoka flood...
TRANSCRIPT
Two-dimensional urban flood simulation: Fukuoka flood disaster in 1999
H. Hashimoto & K. Park Department of Civil Engineering, Kyushu University, Japan
Abstract
Short-time heavy rains occurred in Fukuoka City, Japan on June 29, 1999. As a result, the Mikasa and Sanno-Channel rivers overflowed their banks and the flooding water moved down roads to the railway station known as ‘Hakata-eki’. This area is a dense city centre with many houses and office buildings. The purpose of the present study is to develop a two-dimensional flood simulation model in dense urban areas. The flood simulation model of Hashimoto et al. (Overland flood flow around the JR Hakata-eki station from the Mikasa and Sanno-Channel river in Fukuoka city on June 29, 1999, J. JSNDS 21-4, pp. 369–384, 2003 (in Japanese)) is introduced. The model considers the effect of the high density of buildings and houses on the flood flow in momentum and continuum equations. The momentum equations include two kinds of resistance terms. One is due to bottom shear stresses and the other due to drag forces on the buildings and houses. The continuum equation includes the area density of buildings and houses as their effect on flood flow. This flood simulation model is applied to the Fukuoka flood disaster in 1999. The behaviour of the flood flow from the rivers is computed for various values of the roughness coefficient for the Manning equation and drag coefficient for buildings and houses. The value of 0.043 is suitable for Manning’s roughness coefficient and that of 2.05 for the drag coefficient. Keywords: urban flood, flood flow simulation, Fukuoka flood disaster, risk management.
1 Introduction
There are many crowded urban areas in Japan. These urban areas sometimes have experiences of serious flood disasters. In such flood events, local
www.witpress.com, ISSN 1743-3541 (on-line)
© 2008 WIT PressWIT Transactions on Ecology and the Environment, Vol 118,
Flood Recovery, Innovation and Response I 59
doi:10.2495/FRIAR080061
governments need to predict flood behaviour several hours in advance and lead inhabitants in dangerous areas to safe places at the earlier stage. In the prediction of flood behaviour, we usually use the two-dimensional simulation model for overland flood flows (Iwasa et al., [1]). However, land use in urban areas becomes complicated. In particular, centres of big cities are composed of many houses, office buildings, roads, railway stations and so on. The land use must be incorporated into the simulation model. Several works have been done on the two-dimensional simulation models of flood flow in urban areas (e.g. O’Brien et al. [2]; Fukuoka et al. [3]; Inoue et al. [4]; Suetsugi and Kuriki [5]; Toda et al. [6], Haider et al. [7]). However, there are less works that exactly estimate the effect of many houses and buildings on the flows. In order to estimate the effect of houses and buildings on the flood flows, Hashimoto et al. [8] introduced the concept of area density of houses and buildings in flood simulation. Using this concept, they proposed a two-dimensional simulation model for overland flood considering the effect of the high density of buildings and houses on the flows. In the present study, firstly we review the two-dimensional urban flood simulation model proposed by Hashimoto et al. [8]. This simulation model includes two kinds of resistance terms in the momentum equations; one is due to bottom shear stresses and the other due to drag forces on the buildings and houses. The bottom shear stresses can be expressed by the Manning equation and the drag forces by the drag coefficient. Therefore the appropriate choice of the Manning and drag coefficients becomes important. Secondly, we apply the simulation model to the Fukuoka flood disaster in 1999, and compute the behaviour of the flood flow from the rivers for various values of the roughness coefficient of the Manning equation and the drag coefficient of houses and buildings. Finally, from the comparison between the computed time varying flow depth for the various coefficients and the measured peak flow depth, we discuss the appropriate values of these coefficients.
2 Review on the two-dimensional urban flood simulation model proposed by Hashimoto et al. [8]
2.1 Basic equations
Hashimoto et al. [8] proposed the momentum and continuity equations for overland flood flows in urban areas in the form: x-direction momentum equation
( ) ( ) ( ) ( )ρ
τλ x
xzhgh
yVM
xUM
tM 01 −
∂+∂
−−=∂
∂+
∂∂
+∂
∂ (1)
y-direction momentum equation ( ) ( ) ( ) ( )
ρτ
λ y
yzhgh
yVN
xUN
tN 01 −
∂+∂
−−=∂
∂+
∂∂
+∂∂ (2)
continuity equation of flood water
( ) sink1 qryN
xM
th
−=∂∂
+∂
∂+
∂∂
− λ (3)
www.witpress.com, ISSN 1743-3541 (on-line)
© 2008 WIT PressWIT Transactions on Ecology and the Environment, Vol 118,
60 Flood Recovery, Innovation and Response I

where M = x-direction component of flow flux; N = y-direction component of flow flux; U = x-direction component of depth-averaged velocity; V = y-direction component of depth-averaged velocity; h = flow depth; λ = area density of houses and buildings; τ0x = x-direction component of resistance stresses; τ0y = y-direction component of resistance stresses; ρ = density of flood water; r = effective rainfall intensity; qsink = drainage discharge per unit area. Flow flux M and N are given by
( )λ−= 1UhM (4) ( )λ−= 1VhN (5)
In the case of the Fukuoka flood disaster, the inundation area has the value of λ = 0.316 on average. Therefore, we can see that area density λ of houses and buildings play a major role in the basic equations.
2.2 Resistance terms
We consider two kinds of resistance terms in the momentum equations; one is due to the shear stresses on the bottom and the other due to drag forces on the houses and buildings. They can be expressed as
( )ρ
λρ
τ xDdN
h
VUUgnx ++
−=3/1
22210 (6)
( )ρ
λρ
τ ydy DN
hVUVgn
++
−= 3/1
2220 1 (7)
22
2VUUACD Dx +=
ρ (8)
22
2VUVACD Dy +=
ρ (9)
where Nd = number density of houses and buildings; n = Manning’s roughness coefficient for bottom roughness condition; Dx = x-direction component of drag forces on the houses and buildings; Dy = y-direction component of drag forces on the houses and buildings; A = projected area of inundated part of a house or a building in the flow direction and CD = drag coefficient. The projected area A can be given by
LhdA = (10) where dL = length scale of the inundated house or building in the direction perpendicular to the flow and the gravity.
3 Application of the urban flood simulation model to Fukuoka flood disaster in 1999
We apply the simulation model to the Fukuoka flood disaster on June 29, 1999. In the early morning on that day we had short-time heavy rains in Fukuoka City.
www.witpress.com, ISSN 1743-3541 (on-line)
© 2008 WIT PressWIT Transactions on Ecology and the Environment, Vol 118,
Flood Recovery, Innovation and Response I 61
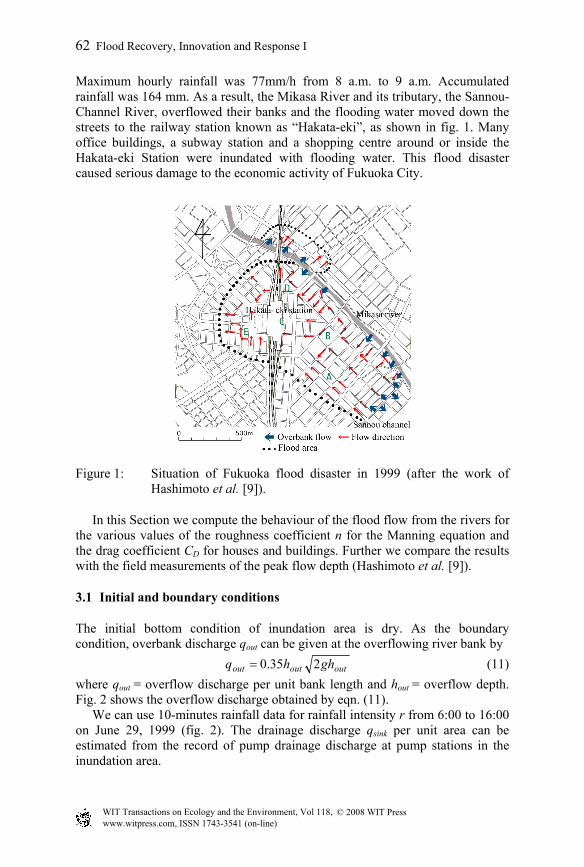
Maximum hourly rainfall was 77mm/h from 8 a.m. to 9 a.m. Accumulated rainfall was 164 mm. As a result, the Mikasa River and its tributary, the Sannou-Channel River, overflowed their banks and the flooding water moved down the streets to the railway station known as “Hakata-eki”, as shown in fig. 1. Many office buildings, a subway station and a shopping centre around or inside the Hakata-eki Station were inundated with flooding water. This flood disaster caused serious damage to the economic activity of Fukuoka City.
Figure 1: Situation of Fukuoka flood disaster in 1999 (after the work of Hashimoto et al. [9]).
In this Section we compute the behaviour of the flood flow from the rivers for the various values of the roughness coefficient n for the Manning equation and the drag coefficient CD for houses and buildings. Further we compare the results with the field measurements of the peak flow depth (Hashimoto et al. [9]).
3.1 Initial and boundary conditions
The initial bottom condition of inundation area is dry. As the boundary condition, overbank discharge qout can be given at the overflowing river bank by
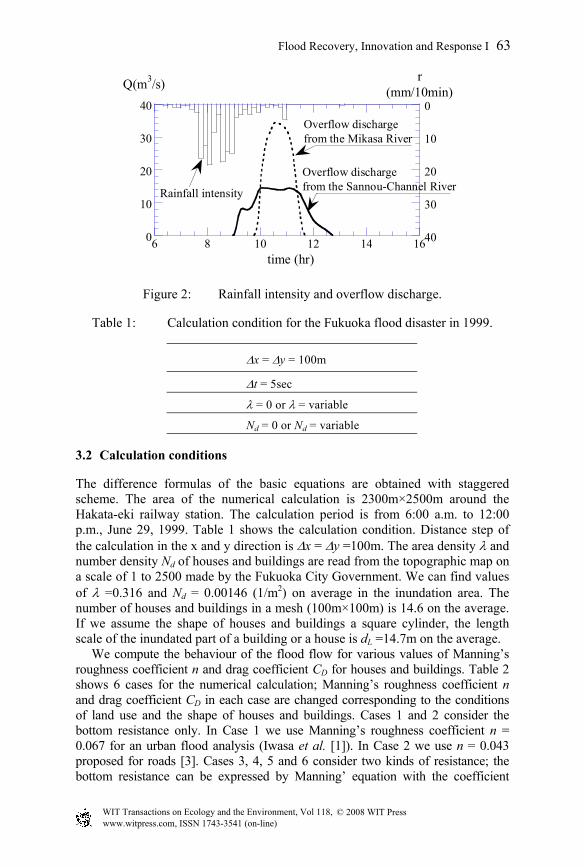
outoutout ghhq 235.0= (11) where qout = overflow discharge per unit bank length and hout = overflow depth. Fig. 2 shows the overflow discharge obtained by eqn. (11). We can use 10-minutes rainfall data for rainfall intensity r from 6:00 to 16:00 on June 29, 1999 (fig. 2). The drainage discharge qsink per unit area can be estimated from the record of pump drainage discharge at pump stations in the inundation area.
www.witpress.com, ISSN 1743-3541 (on-line)
© 2008 WIT PressWIT Transactions on Ecology and the Environment, Vol 118,
62 Flood Recovery, Innovation and Response I
0
10
20
30
40 0
10
20
30
406 8 10 12 14 16
Overflow dischargefrom the Mikasa River
Rainfall intensity
r(mm/10min)Q(m3/s)
time (hr)
Overflow dischargefrom the Sannou-Channel River
Figure 2: Rainfall intensity and overflow discharge.
Table 1: Calculation condition for the Fukuoka flood disaster in 1999.
∆x = ∆y = 100m
∆t = 5sec
λ = 0 or λ = variable
Nd = 0 or Nd = variable
3.2 Calculation conditions
The difference formulas of the basic equations are obtained with staggered scheme. The area of the numerical calculation is 2300m×2500m around the Hakata-eki railway station. The calculation period is from 6:00 a.m. to 12:00 p.m., June 29, 1999. Table 1 shows the calculation condition. Distance step of the calculation in the x and y direction is ∆x = ∆y =100m. The area density λ and number density Nd of houses and buildings are read from the topographic map on a scale of 1 to 2500 made by the Fukuoka City Government. We can find values of λ =0.316 and Nd = 0.00146 (1/m2) on average in the inundation area. The number of houses and buildings in a mesh (100m×100m) is 14.6 on the average. If we assume the shape of houses and buildings a square cylinder, the length scale of the inundated part of a building or a house is dL =14.7m on the average. We compute the behaviour of the flood flow for various values of Manning’s roughness coefficient n and drag coefficient CD for houses and buildings. Table 2 shows 6 cases for the numerical calculation; Manning’s roughness coefficient n and drag coefficient CD in each case are changed corresponding to the conditions of land use and the shape of houses and buildings. Cases 1 and 2 consider the bottom resistance only. In Case 1 we use Manning’s roughness coefficient n = 0.067 for an urban flood analysis (Iwasa et al. [1]). In Case 2 we use n = 0.043 proposed for roads [3]. Cases 3, 4, 5 and 6 consider two kinds of resistance; the bottom resistance can be expressed by Manning’ equation with the coefficient
www.witpress.com, ISSN 1743-3541 (on-line)
© 2008 WIT PressWIT Transactions on Ecology and the Environment, Vol 118,
Flood Recovery, Innovation and Response I 63
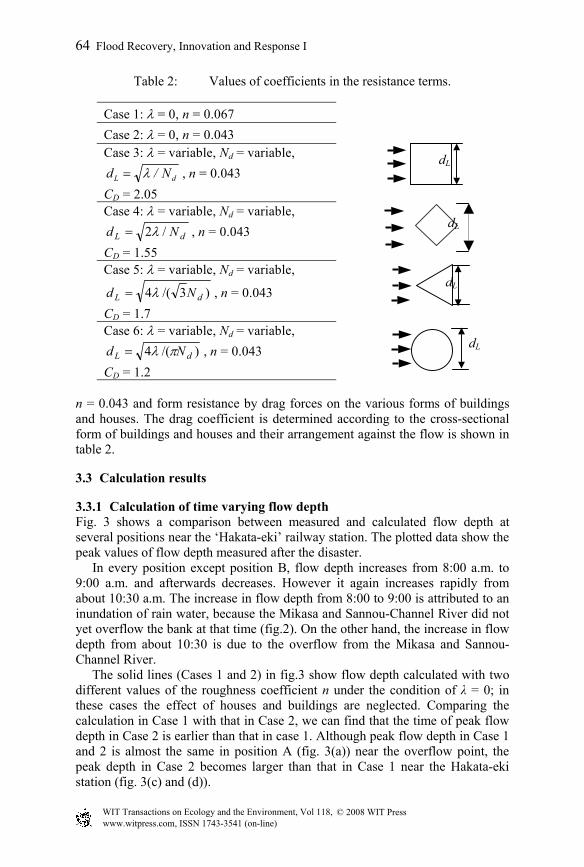
Table 2: Values of coefficients in the resistance terms.
Case 1: λ = 0, n = 0.067 Case 2: λ = 0, n = 0.043 Case 3: λ = variable, Nd = variable,
dL N/d λ= , n = 0.043 CD = 2.05 Case 4: λ = variable, Nd = variable,
dL Nd /2λ= , n = 0.043 CD = 1.55 Case 5: λ = variable, Nd = variable,
)3/(4 dL Nd λ= , n = 0.043 CD = 1.7 Case 6: λ = variable, Nd = variable,
)/(4 dL Nd πλ= , n = 0.043 CD = 1.2
n = 0.043 and form resistance by drag forces on the various forms of buildings and houses. The drag coefficient is determined according to the cross-sectional form of buildings and houses and their arrangement against the flow is shown in table 2.
3.3 Calculation results
3.3.1 Calculation of time varying flow depth Fig. 3 shows a comparison between measured and calculated flow depth at several positions near the ‘Hakata-eki’ railway station. The plotted data show the peak values of flow depth measured after the disaster. In every position except position B, flow depth increases from 8:00 a.m. to 9:00 a.m. and afterwards decreases. However it again increases rapidly from about 10:30 a.m. The increase in flow depth from 8:00 to 9:00 is attributed to an inundation of rain water, because the Mikasa and Sannou-Channel River did not yet overflow the bank at that time (fig.2). On the other hand, the increase in flow depth from about 10:30 is due to the overflow from the Mikasa and Sannou-Channel River. The solid lines (Cases 1 and 2) in fig.3 show flow depth calculated with two different values of the roughness coefficient n under the condition of λ = 0; in these cases the effect of houses and buildings are neglected. Comparing the calculation in Case 1 with that in Case 2, we can find that the time of peak flow depth in Case 2 is earlier than that in case 1. Although peak flow depth in Case 1 and 2 is almost the same in position A (fig. 3(a)) near the overflow point, the peak depth in Case 2 becomes larger than that in Case 1 near the Hakata-eki station (fig. 3(c) and (d)).
dL
dL
dL
dL
www.witpress.com, ISSN 1743-3541 (on-line)
© 2008 WIT PressWIT Transactions on Ecology and the Environment, Vol 118,
64 Flood Recovery, Innovation and Response I
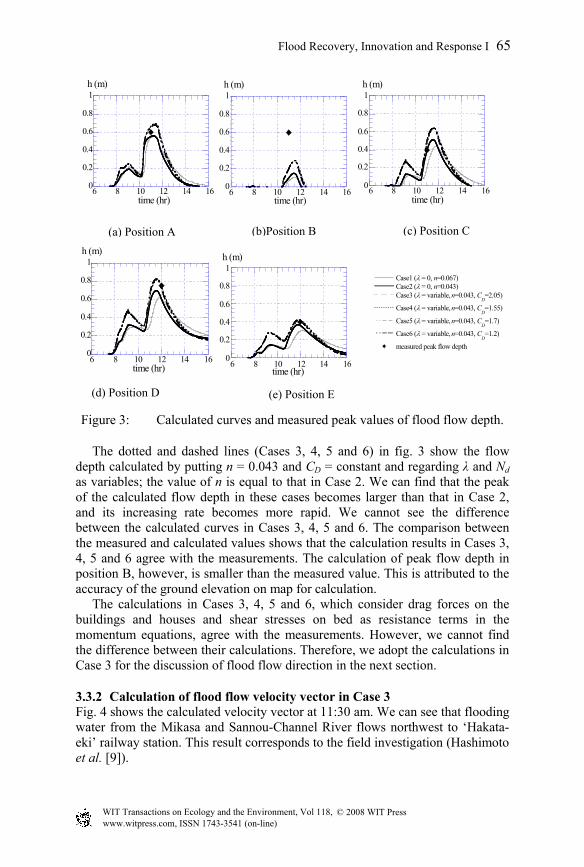
Figure 3: Calculated curves and measured peak values of flood flow depth.
The dotted and dashed lines (Cases 3, 4, 5 and 6) in fig. 3 show the flow depth calculated by putting n = 0.043 and CD = constant and regarding λ and Nd as variables; the value of n is equal to that in Case 2. We can find that the peak of the calculated flow depth in these cases becomes larger than that in Case 2, and its increasing rate becomes more rapid. We cannot see the difference between the calculated curves in Cases 3, 4, 5 and 6. The comparison between the measured and calculated values shows that the calculation results in Cases 3, 4, 5 and 6 agree with the measurements. The calculation of peak flow depth in position B, however, is smaller than the measured value. This is attributed to the accuracy of the ground elevation on map for calculation. The calculations in Cases 3, 4, 5 and 6, which consider drag forces on the buildings and houses and shear stresses on bed as resistance terms in the momentum equations, agree with the measurements. However, we cannot find the difference between their calculations. Therefore, we adopt the calculations in Case 3 for the discussion of flood flow direction in the next section.
3.3.2 Calculation of flood flow velocity vector in Case 3 Fig. 4 shows the calculated velocity vector at 11:30 am. We can see that flooding water from the Mikasa and Sannou-Channel River flows northwest to ‘Hakata-eki’ railway station. This result corresponds to the field investigation (Hashimoto et al. [9]).
(a) Position A (b)Position B (c) Position C
0
0.2
0.4
0.6
0.8
1
6 8 10 12 14 16time (hr)
h (m)
0
0.2
0.4
0.6
0.8
1
6 8 10 12 14 16
h (m)
time (hr)0
0.2
0.4
0.6
0.8
1
6 8 10 12 14 16time (hr)
h (m)
0
0.2
0.4
0.6
0.8
1
6 8 10 12 14 16
h (m)
time (hr)0
0.2
0.4
0.6
0.8
1
6 8 10 12 14 16
h (m)
time (hr)
Case1 (λ = 0, n=0.067)Case2 (λ = 0, n=0.043)Case3 (λ = variable, n=0.043, C
D=2.05)
Case4 (λ = variable, n=0.043, CD=1.55)
Case5 (λ = variable, n=0.043, CD=1.7)
Case6 (λ = variable, n=0.043, CD=1.2)
measured peak flow depth
(d) Position D (e) Position E
www.witpress.com, ISSN 1743-3541 (on-line)
© 2008 WIT PressWIT Transactions on Ecology and the Environment, Vol 118,
Flood Recovery, Innovation and Response I 65
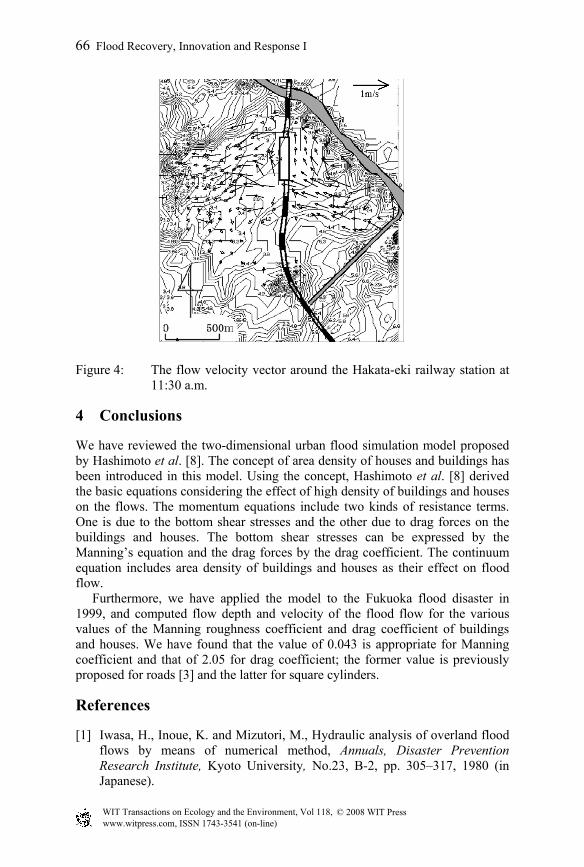
Figure 4: The flow velocity vector around the Hakata-eki railway station at 11:30 a.m.
4 Conclusions
We have reviewed the two-dimensional urban flood simulation model proposed by Hashimoto et al. [8]. The concept of area density of houses and buildings has been introduced in this model. Using the concept, Hashimoto et al. [8] derived the basic equations considering the effect of high density of buildings and houses on the flows. The momentum equations include two kinds of resistance terms. One is due to the bottom shear stresses and the other due to drag forces on the buildings and houses. The bottom shear stresses can be expressed by the Manning’s equation and the drag forces by the drag coefficient. The continuum equation includes area density of buildings and houses as their effect on flood flow. Furthermore, we have applied the model to the Fukuoka flood disaster in 1999, and computed flow depth and velocity of the flood flow for the various values of the Manning roughness coefficient and drag coefficient of buildings and houses. We have found that the value of 0.043 is appropriate for Manning coefficient and that of 2.05 for drag coefficient; the former value is previously proposed for roads [3] and the latter for square cylinders.
References
[1] Iwasa, H., Inoue, K. and Mizutori, M., Hydraulic analysis of overland flood flows by means of numerical method, Annuals, Disaster Prevention Research Institute, Kyoto University, No.23, B-2, pp. 305–317, 1980 (in Japanese).
www.witpress.com, ISSN 1743-3541 (on-line)
© 2008 WIT PressWIT Transactions on Ecology and the Environment, Vol 118,
66 Flood Recovery, Innovation and Response I

[2] O’Brien, J. S., P. Y. Julien and W. T. Fullerton, Two-dimensional water flood and mudflow simulation, J. Hydraulic. Engng., ASCE, 119(2), pp. 244–261, 1993.
[3] Fukuoka, S., Kawashima, M., Matsunaga, N. and Maeuchi, H., Flooding water over a crowded urban district, Journal of Hydraulic, Coastal and Environmental Engineering, JSCE, No.491/II-27, pp. 51–60, 1994 (in Japanese).
[4] Inoue, K., Toda, K., Hayashi, H., Kawaike, K. and Sakai, H., Study of inundation flow model in urban area, Annuals, Disaster Prevention Research Institute, Kyoto University, No.41, B-2, pp. 299–311, 1998 (in Japanese).
[5] Suetsugi, T. and Kuriki, M., Research on application for flood disaster prevention and simulation of flooding flow by means of new flood simulation model, Journal of Hydraulic, Coastal and Environmental Engineering, JSCE, No.593/II-43, pp. 41–50, 1998 (in Japanese).
[6] Toda, K., Inoue, K., Murase, S. and Ichigawa, Y., Modeling of overland flood flow due to heavy rainfall in urban area, Annuals, Disaster Prevention Research Institute, Kyoto University, No.42, B-2, pp. 355–367, 1999 (in Japanese).
[7] Haider, S. Paquier, A. Morel, R. and Champagne, J.-Y., Urban flood modelling using computational fluid dynamics, Water & Maritime Engineering, 156, pp. 129–135, 2003.
[8] Hashimoto, H., Park, K. and Watanabe, M., Overland flood flow around the JR Hakata-eki station from the Mikasa and Sanno-Channel river in Fukuoka city on June 29, 1999, J. JSNDS 21-4, pp. 369–384,2003 (in Japanese).
[9] Hashimoto, H., Matsunaga, K. and Nanri, Y., Flood disaster in Fukuoka city on June 29, 1999, J. JSNDS 20-1, pp. 43-58, 2001 (in Japanese).
www.witpress.com, ISSN 1743-3541 (on-line)
© 2008 WIT PressWIT Transactions on Ecology and the Environment, Vol 118,
Flood Recovery, Innovation and Response I 67