two sections—section two railway earnings · july 1 to may 31____ 15.302 8,387 3.067 2.270 ......
TRANSCRIPT

TWO SECTIONS—SECTION TWO
RAILWAY EARNINGSSECTION OF THE
COMMERCIAL & FINANCIAL CHRONICLECopyrighted in 1911 according to Act of Congress, by WILLIAM B. DANA COMPANY, in office of Librarian of Congress, Washington, D. C.
VOL. 93. NEW YORk, SEPTEMBER 23, 1911. NO. 2413.
THIS entire publication is devoted to a presentation of the reports of earnings and ex-
penses of United States railroads for the latest month (July) and for the fis-cal year to date, including said month. The table embraces every steam operating
railroad in the country which is obliged to make monthly reports to the Inter-StateCommerce Commission at Washington—about 900 roads or systems, altogether—comprising,roughly, 240,000 miles of road. Whether a road earns $1,000 a month or $10,000,000, itwill be found in the list. Leased lines not operating their own road do not make returns.
Sworn Returns. The figures are a transcript of the sworn returns on file at Washington.They have the further advantage of uniformity of method and classi-
fication. Every company is obliged to make up its return on the same basis and in thesame way as every other company.
The "Chronicle" has always made a specialty of weekly and monthlyEarn
Specialty. ings reports of railroad earnings, and for forty years. or more its weekly
Our and monthly summaries have been everywhere accepted as authorita-tive. The present publication is in continuation of this work and to aid the Inter-StateCommerce Commission in the one direction in which lies its chief usefulness—the fieldof publicity. By our own unaided efforts we succeeded in collecting returns covering200,000 to 205,000 miles, out of a possible 225,000 to 235,000 miles. The action of theCommerce Commission enables us to give the remaining mileage, all except that incon-sequential portion the operations of which are confined wholly Within State boundaries.
These Inter-State Commerce returns also make it possible for us toFull Details. take one further step in advance, namely to present the details of boththe revenues and the expenses. Besides reporting total gross earnings, we show separately
the passenger and the freight revenues. In the case of the expenditures we report the
outlays for both maintenance of way and maintenance of equipment as well as the traffic
and transportation expenses. We also show the revenue from outside operations, grossas well as net. Lastly, we give the miles of road on which earnings are based. To getin all these facts, we have had to extend the figures for each road across two pages.
The cents we have necessarily been obliged to discard altogether, andCents Discarded. if in any case the results should happen to vary a dollar, one way or theother, from exact proof, the reason for the variance will be found in that circumstance.
The matter contained in this, extra and novel publication is entirelyFormer Returns additional to the comprehensive reports of earnings we have beento be Continued, furnishing in the "Chronicle" from week to week. Large numbers ofcompanies have long supplied monthly statements of their own. Some of these differ inessential respects from the returns required by the Inter-State Commerce Commission.These statements we will print in the future as in the past just as received, and in the weekin which they appear. We shall also continue our weekly figures of earnings. But inaddition to all this we shall issue once a month—say about the 20th—this special publica-tion devoted entirely to the Inter-State Commerce returns and confined exclusively to them.
As in the case of our numerous other Supplements or "Sections," all ofOnly For which are expensive publications, the 'Railway Earnings Section"Subscribers. will be furnished only to "Chronicle" subscribers. These will receiveit free of charge, one copy going with each subscription. It will be impossible to obtaincopies in any other way, as none will be printed for general sale.
WILLIAM B. DANA COMPANY, PUBLISHERS,NEW YORK
CHRONICLE BUILDING FRONT, PINE & DEPEYSTER STREETS
Digitized for FRASER http://fraser.stlouisfed.org/ Federal Reserve Bank of St. Louis
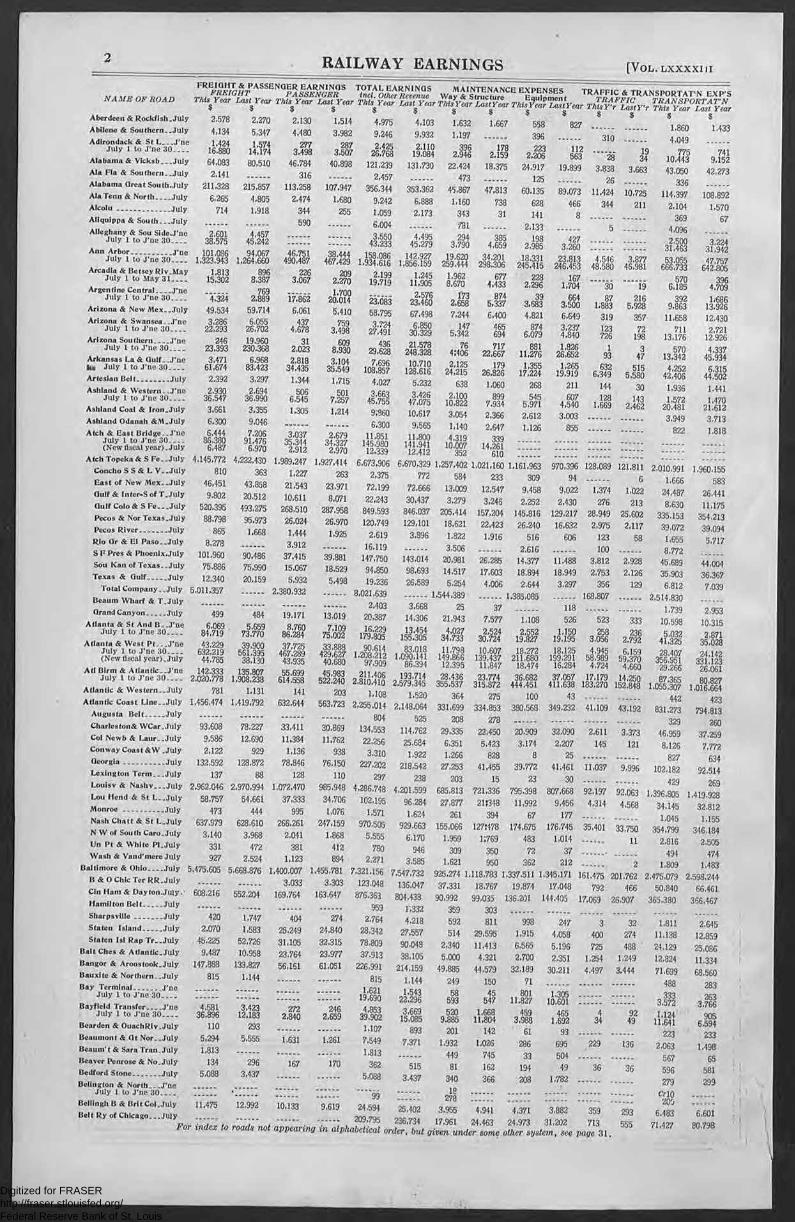
2 RAILWAY EARNINGS [VoL. LXXXXIIIFREIGHT & PASSENGER EARNINGS TOTAL EARNINGS MAINTENANCE EXPENSES TRAFFIC & TRANSPORTAPN EXP'SFREIGHT PASSENGER incl. Other Revenue Way 8c Structure Equipment TRAFFIC TRANSPORTAT'NNAME OF ROAD This Year Last Year This Year Last Year This Year Last Year This Year Last Year This Year Last Year ThisY'r LastY'r This Year Last Year$ $ $ $ $ $ $ $ $ $ $ $ $ $Aberdeen & Rockfish _July 2,578 2,270 2,130 1,514 4,975 4.103 1.632 1,667 558 827 1,860 1.433Abilene & Southern__July 4.134 5,347 4,480 3,982 9,246 9,932 1,197 396 310 4,049Adirondack & St L___J'ne 1.424 1.574 277 287 2.425 2,110 396 178 223 112 19 775 741July 1 to J'ne 30__ _.. 16,880 14,174 3,498 3.507 26,768 19,084 2.946 2.159 2,206 563 28 34 10.443 9,152Alabama & Vicksb__ _July 64,083 80,510 46.784 40.898 121,239 131.730 22,424 18,375 24,917 19,899 3,838 3.663 43,050 42.273Ala Fla & Sou thern 1457
_ _July 2,141 316 473 125 26 336Alabama Great Sou th.July 211.328 215.857 113,258 107,947 356,344 353,362 45.867 47.813 60.135 89,073 11.424 10,725 114.397 108,892
61
Ala Tenn & North _ _ _ _July 6,265 4,805 2.474 1.680 9,242 6,888 1,160 738
8 466 344 211 2.104 1,570Alcoiu July 714 1,918 344 255 1.059 2,173 4 2
6.004 343 31 8 369 67Aliquippa & Sou th _ _
2,133 1 _July 590 181 5 4,096Alleghany & Sou Side.J'ne 2,601 4,457 3,550 4.495 294 385 198 427 2.500 3,224July 1 to J'ne 30_ ___ 38.575 45,242 43.233 45.279 3,790 4,659 2,985 3,260 31.463 31,942Ann Arbor J'ne 101,086 94,067 46.751 38.444 158,086 142,927 19,620 34,201 18.331 23,813 53,055 47.757July 1 to J'ne 30__-- 1,323,943 1,264,660 490.487 467,429 1,934,616 1,856.159 259,444 298,306 245.415 246,453 666,733 642,805Arcadia & Betsey Riv_May 1,813 896 226 209 2.199 1,245 1,962 677 228 167
43N8 46:E
570 396July 1 to May 31____ 15.302 8,387 3.067 2.270 19,719 112:950756 8.670 4,433 2,296 1.7041.700
30 19 6,185 4.709Argentine Central__ __J'ne 769 173 874 39 664 87 216 392 1,686July 1 to J'ne 30__ -- 4,324 2,889 17.862 20.014 23.083 23,460 2.658 5.337 3.683 3.500 1,883 5.928 9.863 13.926Arizona & New Mex_ _July 49,534 59,714 6,061 5.410 58,795 67.498 7,244 6.400 4.821 6,649 319 357 11,658 12,430Arizona & Swansea _ _J'ne 3,286 6,055 437 759 3.724 6.850 147 465 874 3.237 123 72 711 2,721July 1 to J'ne 30____ 22,293 26.702 4.678 3,498 27,491 30,329 5,342 694 6.079 4,840 726 198 13,176 12,926Arizona Sou thern____J'ne 246 19,960 31 609 436 21,578 76 717 881 1.826 1 3 570 4,337July 1 to J'ne 30_ _ __ 23,393 230,368 2,023 8.930 29.628 248,328 4;406 22.667 11,276 26,652 93 47 13,342 45,934Arkansas La & Gulf __J'ne 3.471 6.968 2.818 3.104 7.696 10,710 2,125 179 1,355 1,265 632 515 4,252 6.315it July I to J'ne 30____ 61,674 83.423 34,435 35.549 108,867 128,616 24,215 26,826 17,224 19,919 6.349 5,580 42.406 44,502Artesian Belt July 2,392 3,297 1,344 1,715 4,027 5,232 638 1.060 268 211 144 30 1.936 1,441Ashland & Western _ _J'ne 2,930 2.694 506 501 3.663 3.426 2.100 899 545 607 128 143 1,572 1.470July 1 to J'ne 30_ ___ 36.547 36.990 6,545 7.257 45,755 47,075 10,822 7,934 5.971 4,540 1.669 2.462 20.481 21,612Ashland Coal & Iron_July 3.661 3,355 1.305 1,214 9:860 10.617 3.054 2,366 2,612 3,003 3,949 3,713Ashland Odanah &M_July 6,300 9,046 6.300 9.565 1.140 2.647 1,126 855 822 1,818Atch & East Bridge_ J'ne 6.444 7,206 3,037 2,679 11,851 11,800 4.319 339_
July I to J'ne 30 _ _ _ _ 86,380 91.476 35.344 34,327 145,980 141.941 10,007 14.261(New fiscal year) July 6,487 6.970 2,912 2,970 12,339 12.412 352 610Atch Topeka & S Fe_ _July 4.145.772 4,222,430 1,989,247 1,927.414 6,673,906 6.670.329 1.257.402 1,021,160 1,161,963 970,396 128,089 121.811 2,010:6969 1 1,960,155Concho S S & L V_ _July 810 363 1.227 263 2,375 772 584 233 309 94 6 16
583East of New Mex_July 46,451 43,858 21,543 23.971 72,199 72.666 13,009 12.547 9,458 9,022 1,374 1.022 24,487 26,441Gulf & Inter-Sot T_July 9.802 20,512 10,611 8,071 22,243 30.437 3,279 3.246 2,252 2,430 276 213 8,630 11,175Gulf Colo & S Fe_ July 520.395 493,275 268,510 287,958 849,593 846,037 205.414 157,204 145.816 129,217 28.949 25.602 335.153 354,213Pecos & Nor Texas_July 88.798 95.973 26.024 26.970 120.749 129.101 18,621 22,423 26,240 16.632 2,975
2,1517 397 5.7173.912 2,616 2
39,094Pecos River July 865 1,668 1.444 1.925 2,619 3.896 1,822 1,916 516 606 3 0
772
8 1.655
8.Rio Or & El Paso_ _July 8,278 16.119 3,506
120
SF Pres & Phoenixauly 101,960 90,486 37,415 39,881 147.750 143,014 20,981 26.285 14.377 11,488 3.812 2,928 45.689 44.004Sou Kan of Texas_ _July 75,886 75,990 15,067 18.529 94.850 98,693 14,517 17.603 18,894 18.949 2,753 2.126 35,903 36,367Texas & Gulf July 12,340 20,159 5,932 5.498 19,236 26.589 5,254 4,006 2.644 3.297 356 129 2,5164:883120 7,0398,021,639 1.544,389
Total Company_ _July 5.011,357 1.385,085
2,380,932 168,807Beaum Wharf & T_July 2.403 3,668 25 37 118 1.739 2,953Grand Canyon July 499 484 19.171 13,019 20,387 14.306 21.943 7.577 1,108 526 523 333 10,598 10,315Atlanta & St And B__J'ne 6.069 5.659 8.760 7.109 16.229 13,454 4.027 2,524 2.552 1,150 258 236 5.032 2.871July 1 to J'ne 30---- 84.719 73.770 86,284 75,002 179.805 155,305 34,733 30,724 19,827 19,195 3,056 2.792 41.325 35,028Atlanta & West Pt_ _J'ne 43.229 39,900 37,725 33,888 90,614 83,018 11.798 10,607 18,272 18,125 4,945 6,159 28,407 24,142July 1 to J'ne 30_ __ _ 632.219 561.395 467.289 429,627 1,208.212 1,090,141 149.866 139,437 211,680 199,291 58,989 59.370 356.951 331.123(New fiscal year)_July 44.785 38.130 43,935 40,680 97,909 86.394 12,395 11,847 18,474 16,284 4,724 4.660 29,266 26.061Atil3irm & Atlantic-J'ne 142,333 135,807 55,699 45,983 211,406 193,714 28.436 23.774 36,682 37.057 17,179 14,250 87,365 80.827July I to J'ne 30__-- 2.020.778 1,908,238 614.558 522.240 2,810.410 2.579.345 355.537 315.872 444,451 411.638 183.270 152.848 1.055.307 1,016,664,520
Atlantic & Western_ _July 781 1.131 141 203 1,108 1 364 275 100 43 442 423Atlantic Coast Line-July 1,456.474 1.419,792 632.644 563,723 2,255,014 2,148.064 331,699 334,853 380.568 349,232 41,109 43,192 831,273 794,813Augusta Belt July 804 525 208 278 329 260Charleston& WCar_July 93,608 78.227 33.411 30,869 134,553 114.762 29,335 22.450 20.909 32.090 2.611 3.373 46.959 37,259Col Newb & Laur_ _July 9.586 12,690 11.384 11.762 22,256 25,684 6,351 5,423 3,174 2,207 145 121 8.126 7,772Conway Coast &W _ 938 3.310 1.922 1,266July 2,122 929 1,136 828 8 25 827 634Georgia July 132,592 128,872 78,846 76,150 227,202 218,542 27,253 41.455 39,772 41,461 11,037 9,996 102.182 92,514Lexington Term _ _ _July 137 88 128 110 297 238 203 15 23 30 429 269Louisv & Nashv _ _ _July 2,962,046 2.970,994 1,072,470 985,948 4,286,748 4,201,599 685,813 721,336 795,398 807.668 92,197 92,063 1,396,805 1.419,928Lou Hend & St L_July 58.757 54.661 37,333 34.706 102.195 96,284 27,877 21;348 11,992 9,456 4.314 4.568 34,145 32,812Monroe July 473 444 995 1,076 1.571 1,624 261 394 67 177 1.045 1.155Nash Chatt & St 1-July 637,979 628,610 266.261 247.159 970,505 929,663 155,066 127;478 174,675 176.745 35.401 33,750 354,799 346,184N W of South Caro_July 3,140 3.968 2.041 1,868 5,555 6,170 1,959 1:76948 11 2,816 2,505Un Pt & White PI_July 331 472 381 412 780 946 309 350
73 1.012 347
494 474Wash & Vand'mere July 927 2,524 1,123 894 2.271 3.585 1.621 950 362 212 2 1,809 1.483Baltimore & Ohio----July 5.475.605 5,668,876 1,400,007 1,455,781 7.321.156 7,547.732 925,274 1,118,783 1,337,511 1,345,171 161.475 201,762 2.475.079 2,598,244B & 0 Chic Ter RR_July 3,033 3.303 123.048 136.047163,647 876,363 804.438
37.331 18.767 19,874 141473,00438 17,076992 466 50.840 66,461Cin Dam Sc Day. ton.July •• 608,216 552.204 169.764
959 1,332 26,907 365.380 366,46790.992
Hamilton Belt July 359
99% 136,201
420 1,747 274 1764 4,218 32 1.811 2.645Sharpsville 404 592 811 998 247 3
JulyStaten Island July 2,070 1,583 25.249 24,840 28,342 27,557
78,809 90,048 514 29,595 1,915 4,058 400 274 11,138 12,859Staten Isl Rap TrJuly 45,225 52,726 31.105 32,315 2,340 11.413 6,565 5,196 725 488 24.129 25,086Bait Ches & A tlan tic . July 9,487 10,958 23,764 23.977 37.913 38,105 5.000 4,321 2,700 2,351 1,254 1,249 12.824 11,334Bangor & Aroostook_July 147,888 133,827 56,161 61,051 226.991 214,159 49.885 44.579 32,189 30,211 4,497 3,444 71c2.r6219309 68.560
815 1,144Bauxite & Nor them _ _July 815 1,144
1.621 1.543 249 150 71
801 1,305 488 283
3.572 3.7219.690 22.296
92 1.:
Bay Terminal J'ne 58 45July 1 to J'ne 30_ _- - 593 547 11,827 10,601
246 4.853 3,66949 11,641 6.950954
Hayfield Transfer_ _J'ne 4,581 3,423 272
391..910027 15.085
459 465 4July I to J'ne -do_ ___ 36.896 12,183 2,840 2.659 520 1.668
9,885 11,804 3.988 1,692 34Bearden & OuachRiv_July 110 293 893 201 142 61 2336:: .229 136 2.063 1,498
Beaumont & Gt Nor_ _July 5,294 5.555 1,631 1,261 71..58419, 7.371 2861,932 1.026Beaum' t & Sara Tran _July 1.813 449 745 33 504 567 65Beaver Penrose & No_July 134 296 167 170 362 515
5,088 3,437
81 162 194 49 36 36 596 581Bedford Stone July 5,088 3,437 340 366 208 1.782 279 299Belington & North_ _J'ne 18July 1 to J'ne 30_ ___ 99 278 20'..)Bellingh B & Bri t Col _July 11,475 12.992 10,133 9,619 24,594 25.402 3.955 4.941 4,371 3,882 359 293 6,483 6.601Belt Ry of Chicago_ _Jul y 209.795 236.734 17,961 24.463 24,973 31,202 713 555 71.427 80,798For index to roads not appearing in alphabetical order, but given under some other system, see page 31.
Digitized for FRASER http://fraser.stlouisfed.org/ Federal Reserve Bank of St. Louis

SEPT., 1911.] RAILWAY EARNINGS 3
NAME OF ROAD
TOTAL EXPENSES NET OUTSIDE OPERATIONS TAXESincl. General Exp. FROM RAILROAD Gross Revenue Net Revenue Current PreviousThis Year Last Year This Year Last Year This Year Last Year This Year Last Year Year Year
$ $ $ $ $ $ $ $ $ $
FINAL NETCurrent PreviousYear Year$ $
MILESend of M.mthThis LasYear Year
Aberdeen & Rockfish_July 4.974 4.702 1 -599 196 180 -194 -779 54 54Abilene & Southern_ _July 6,916 4,944 2,330 4.987 500 250 1,830 4.737 96 57Adirondack & St L_ J'ne 1,640 1.203 784 907 41 30 743 877
July I to J'ne 30_ ___ 19,110 13,676 7,657 5.408 557 276 7.100 5,132 3 3Alabama & Vicksb_ _ _July 99.894 89.408 21.344 42,322 840 309 193 48 4,600 4.390 16.937 37.981 142 142Ala Fla & Southern_ _July 1,158 1,298 50 1,248 15 15Alabama Great South.July 240,537 265.378 115,807 87,984 2,566 2,628 666 -503 14,748 12,122 100,392 75,358 309 309Ala Tenn & North__ July 4.927 3.489 4,314 3,398 169 100 4.145 3.298 72 38Alcolu July 854 107 205 2,065 51 51 153 2.013 29 29Aliquippa & South__ _July 7,211 -1,207 188 -1,396 4 - - --Alleghany & Sou Side.J'ne 3.001 4.045 549 450 37 37 511 412
July I to J'ne 30- - - 38,360 39.996 4,872 5.283 451 451 4.420 4.831 1 1Ann Arbor J'ne 102,799 117,679 55.286 25.247 14,797 10.350 -2.068 -1.509 13.300 12,330 39,917 11,407
July 1 to J'ne 30___. 1,305,368 1,298,768 629.249 557.391 158,907 170,493 -8.185 -31,041 167,826 147,967 453.235 378,383 291 291Arcadia & Betsey Riv.May 2,875 1,301 -675 -55 100 127 -776 -183
July 1 to May 31_ _ _ _ 20.052 11,505 -333 399 1,131 1,112 -1,465 -713 21 21Argentine Central J'ne 1,156 3,822 -1,156 -1.245 125 125 -1.281 -1.370
July 1 to J'ne 30___ _ 24.056 35,475 -972 -12.014 2.712 83 1.480 1.500 -2.369 -13.514 15 15Arizona & New Alex_ _July 26.323 27,637 32,472 39.860 2,100 2,434 30,372 37.425 108 108Arizona & Swansea_ _J'ne 1.959 6.806 1.764 44 1.764 44
July 1 to J'ne 30_ _ _ _ 29.737 19.659 -2,245 10,669 -2.245 10.669 21 21Arizona Southern-- ----no 1.679 7,386 -1,243 14,192 -1,243 14,192
July 1 to J'ne 30__ 32,847 100,257 -3,219 148.070 -3,219 148.070 20 20Arkansas La & Gulf_ _J'ne 9.816 10.003 -2,120 707 617 605 -2,737 102
July 1 to J'ne 30__ _ - 110.220 117,051 -1,363 11.564 5.472 4,982 -6.836 6.582 61 61Artesian Belt July 3,627 3.006 400 2.165 160 160 240 2,005 42 42Ashland & Western_ _J'ne
July 1 to J'ne 30_ _ _ _4,90844,293
3.39740.481
-1.2451,461
296,593 1.461 1.009
-1,609-2
-45.584 22 22
Ashland Coal & Iron_July 10.183 9,600 -322 1,017 700 700 -1,022 317 22 22Ashland Odanah &M_July 3.273 5,569 3,027 3,995 111 89 2,915 3.906 33 33Atch & East Bridge_ _J'ne 16,119 7.581 -4.268 4.219 636 653 -4,904 3.565
July 1 to J'ne 30_ _ _ _ 38,095 36.345 107.885 105,596 7,686 7,798 100,198 97.797 0.35 0.35(New fiscal year) July 1.628 1.742 10,710 10,670 636 653 10.074 10.016 0.35 0.35Atch Topeka & S Fe_ _July 4,704,615 4,209,833 1,969.291 2,460,495 270.446 277.523 1,698,844 2,182.972 7,612 7.549Concho S S & L V_ _July 2,971 1.078 -595 -305 333 83 -929 -389 61 17East of New Mex_ _July 50,719 51.440 21.480 21,225 3,916 3,934 17.563 17.291 227 227Gulf & Inter-S of T_July 15,244 18,164 6.998 12.272 694 666 6.304 11,605 71 71Gulf Colo Sc S Fe_ July 749.016 696,569 100.576 149,467 35,761 32,325 64,815 117,142 1.537 1.518Pecos & Nor Texas_July 91,551 84.726 29.197 44,375 3.446 2.449 25,751 41,925 296 225Pecos River July 4,383 8.489 -1,763 -4.592 179 208 -1,942 -4.801 54 54Rio Or & El Paso_ _July 16.006 113 787 -674 20 --S F Pres & Phoenix.July 90,221 89,788 57.529 53.226 4.333 100 53,196 53,126 364 364Sou Kan of Texas_ _July 76,333 79,414 18,517 19,279 1.980 2,486 16.536 16.792 124 124Texas & Gulf July 16,455 15,533 2,780 11.055 700 520 2.080 10,535 97 97
Total Company_ _July 5.817.514 2.204.123 322.575 1.881.544 10.463 -- --Ileaum Wharf & T_July 1,764 3,110 638 558 119 110 518 448 2 2Grand Canyon July 34.533 19,124 -14,145 -4.817 1,033 1,049 -15,179 -5.866 64 66
Atlanta & St And EL _J'ne 13.662 7,404 2.567 6,050 1,837 300 729 5,750July 1 to J'ne 30_ _ _ _ 111,878 96,924 67.927 58,381 7,337 3,200 60.589 55,181 82 82Atlanta & West Pt_ _ _J'ne 68.445 63.934 22,168 19.083 1,468 1.556 113 187 8,519 8,164 13.763 11.106
July 1 to J'ne 30__- - 833.062 778,971 375,149 311,169 18,358 17,944 2.132 860 59,338 55.809 317,944 256.220 92 92(New fiscal year) _July 69,651 62.969 28,258 23,425 1.551 1,436 221 164 5.189 4,409 23.290 19.180 92 92
Ati Birm & Atlantic-Xne 178.117 164.114 33,288 29.600 10.500 10.000 22.788 19,600July 1 to J'ne 30_ _ _ 2,147.817 1,999,956 662.592 579.389 131,145 123,265 531,447 456.124 661 661Atlantic & Western_ _July 1.237 981 -128 538 20 19 -148 519 9 9Atlantic Coast Line_ _July 1,657.473 1.590.649 597,541 557,415 107.000 90,000 490.541 467.415 4.499 4.491Augusta Belt July 538 539 266 -13 65 71 200 -85 3 3Charleston& WCar_July 103,842 98,847 30,711 15.915 5.000 4,475 25.711 11.440 340 340Col Ncwb & Laur_ _July 19.900 17.387 2,355 8.297 900 900 1.455 7,397 75 75Conway Coast& W_July 2.184 1,516 1.125 405 90 100 1,035 305 32 32Georgia July 187,311 191,838 39,891 26,704 2,100 2.183 37.791 24,521 307 307Lexington Term_ July 656 315 -358 -76 13 13 -371 -90 3 3Louisv & Nashv_ _ _July 3.058.607 3,132.050 1,228,141 1,069,548 30.771 31,666 -3.319 -11,545 161,507 148,950 1,063,313 909.053 4.644 .590Lou Hend & St L_ _July 81.638 70,244 20.557 26.040 680 601 352 186 3,000 2,666 17,910 23.560 199 199Monroe July 1,373 1,727 197 -102 87 90 110 -193 10 10Nash Chat( & St L_July 744,745 709,363 225,759 220,300 7,746 6.423 -2.166 73 23,816 22,287 199,777 198,087 1.255 1,255N W of South Caro_July 5,893 5,917 -337 253 300 300 -637 -46 71 71Un Pt & White PI_July 937 921 -157 25 34 35 -191 -10 13 13Wash & Vand'mere July 4,004 2,957 -1,732 627 90 75 -1.822 552 41 40
Baltimore & Ohio_ _ _ _July 5,075.457 5,423,890 2,245,698 2,123,842 155,384 164,085 -25.229 -11.805 240.997 209,571 1,979,471 1,902.465 4.433 4,434B & 0 Chic Ter RR _July 112,878 105,898 10,169 30.148 4.159 4,188 904 960 18,206 18,558 -7,132 12.551 77 89Cin Ham & Dayton.July 629.974 660.325 246.388 144,113 35.320 26,889 211.068 117,223 1.014 1.036Hamilton Belt July 359 303 599 1,028 1 599 1.026 2 2Sharpsville July 3.768 4,096 -1,004 121 75 75 -1.079 46 17 17Staten Island July 15,170 48.241 13.171 -20,684 8,407 7.890 5.601 5,289 1,250 • 1,250 17,522 -16.644 12 12Staten Is! Rap Tr_ _July 36,587 45,501 42,221 44.546 25.516 27.545 16.227 7.252 3.700 3.250 54.749 48,549 10 10
Bait Ches & AtiantIc_July 22,425 20,046 15,487 18,058 93.653 106,939 19,674 29.927 2.182 2,182 32.980 45,803 87 87Bangor & Aroostook_July 173,236 157.688 53.755 56,470 9.250 1,500 44.550 54,970 627 599Bauxite 6c Northern July 735 558 79 585 188 37 -108 548 2 2Bay Terminal J'ne 1,332 1,823 288 -279 Cr280 Cr217 569 -62
July 1 to J'ne 30- - 17.661 16,502 2,028 5.793 676 739 1.352 5,053 1 1Bayfield Transfer_ _ _J'ne 2,369 3.314 2,484 354 25 23 2.459 331July 1 to J'ne 30-- 28,681 23.013 11,221 -7.928 306 279 10.914 -8.207 15 15Bearden & OuachRiv_July 719 694 388 199 40 40 348 159 14 14Beaumont & Gt Nor.. July 4,998 4.191 2.550 3.180 300 300 2.250 2.880 48 33Beaum't & Sara Tran_July 1,811 1.465 1 -1.465 40 34 *-39 -1,500 10 22Beaver Penrose & No_July 956 872 -593 -356 60 -653 -356Bedford Stone July 869 2,492 4,218 945 363 330 3,855 614 2 2Belington 6c North_ J'ne 134 -134 32 -167
July 1 to J'ne 30_ 1,221 -1.121 429 -1,551Bcllingh B & Brit Col_July 16,849 17.303 7.744 8,099 1,500 1.260 6.244 6,839 62 62Belt Ry of Chicago Ju y 120.898 143.314 88.897 93,420 5,500 5,000 83.397 88,420 21 21
For index to roads not appearing in alphabetical order, but given under some other system, see page 31.
Digitized for FRASER http://fraser.stlouisfed.org/ Federal Reserve Bank of St. Louis

4 RAILWAY EARNINGS [V()L. I.X X N 1 , 1
FREIGHT & PASSENGER EARNINGS TOTAL EARNINGS MAINTENANCE EXPENSES TRAFFIC & TRANSPORTAT'N EXP'SFREIGHT PASSENGER incl. Other Revenue Way & Structure Equipment TRAFFIC TRANSPORTAT' NNAME OF ROAD This Year Last Year This Year Last Year This Year Last Year ThisY Year Last Year This Year Last Year This Y'r LastY'r This Year Last Year$
Bennettsv & Cheraw_J'ne 4,615July Ito J'ne 30 _ 66.443
Bernice & N W July 1,914Bessemer & L Erie_ July 858,483Big Falls July 169Big Sandy & Cumb July 5,072Gig Stone G & Pow V_J'ne 142
July 1 to J'ne 30._ _ _ 1,550Birmingham & Atlan_JulY 391Birmingham & S E July 1.308Birmingham South...MY 51,003Blooms. & Sullivan July 5.182Bly Burdette & M R-JulY3.114Bly Leachv & Ark So_J'ne 6.839
July 1 to J'ne 30__ _ _ 85.592Bodcaw Valley July 886Bonlee & Western _ _ _July 244Boston & Maine July 1.960.673Maine Central July 460.335St Johnsb & L Ch_ _July 17,885Sullivan County _ _ _July 25.857Vermont Valley _ _ _July 25,447York Harb& Beach.July 2,218
Boyne C Gayl & Alp_July 16,122Bradford & West Pa_July 591Bridgeton & Saco Riv.July 2.109Brimstone R & Canal _July 9.226Brinson Railway July 8.070Brownst & Mid' town _J'ne 28
July 1 to J'ne 30 -__ 465Bucksport & Elk Riv_J'ne 2,140
July I to J'ne 30_ _ - 21.411RR_ ..Buffalo & Susq _J'ne 137.538
July 24 to J'ne 30_ __ _ 1,538,332(New fiscal year) July 126,903
Buffalo & Susq Ry J'ne 52.109July I to J'ne 30_ _- - 542.319(New fiscal year) July 40.446
Buffalo Att & Arcade_J'ne 2,223July 1 to J'ne 30__ - - 30.142(New fiscal year)_July 2,443
Buff Creek & Gauley _July 2,591Buff Roch &Pitts_ _ -Elle 644.989
July Ito J'ne 30- --- 7.748.178(New tlscal year)_July. 677,723
BurrsFyBrown&Ches.July 2,568Butler County July 8.993Butte Anacon & Pac_July 72.842Butte County July 15,275Cache Valley July 87Caddo & Choctaw_ _July 2.595Cal Ham & S E' JulyCalumet Western_ __ _JulyCanadian Pac Lines in U SCanPacRy in Maine J'ne 33,719
July Ito J'ne 30____ 749.204Duluth So Sh & AtI.July 164.002Mineral Range-- -July 54.427Minn St P & S S M_J'ne 1.147.637July 1 to J'ne 30- - - - 15.157,875(New fiscal year)-July 1,353.831
Newp't & Richford_J'ne 10,806July Ito J'ne 30-- 130,668
Carolina & N W July 21.433Carolina & Western_ _July 569Caro Clinch & Ohio ..July 136.008CaroClinch&OofSC_July 5.663
Central Indiana July 9.694Central New England.JulY 196.369Central of Georgia_ - -J'ne 510.745
July 1 to J'ne 30- -- 8.308.918(New fiscal year) July 535,713
Loulsv & Wadley_ J'ne 919July Ito J'ne 30- - - 20.445(New fiscal year) _July 906
Wadley Southern. July 2.891Wrightsv & Tenn- -July 7,862
Central RR of N J--
- -J'ne 1.686.697July 1 to J'ne 30- - - - 18.742.449(New fiscal year)_July 1.317.294
Central RR of Pa JulY 3,132Central Ry of Arkan J'ne 2,835
July 1 to J'ne 3O__ - 44.134Central Vermont_ J'ne 243.447, July 1 to J'ne-30._ - 2.654.911
(New fiscal year) July 214.361Centralia Eastern_ _J'ne 1.391
July 110 J'ne 30- _ _ . 24,955Charles City Western .J'ne 220
July 1 to J'ne 30_Charleston Term Co_ July
Charlotte liar & Nor-Jut., 18.120Charlotte Mon & Col .J'ne 683
July 1 to J'ne 30_ --- 13.793Chattahoochee Valley July 3.833Chesapeake & Ohio_ _July 2.068,228Chesapeake Western.July 4,158
$
2,67262,436
2.796
807,134298
4.519
861.157
671
48.680
3856,327
55.231
3.181
1161,873.812
403.37916.10423.160
20,791
1,402
17,683
1.005
2,121
2.008
5.915
23298
2,49224.887
31.792
2.17127,3071.741769
707,3567,562.259605.870
3.932
4.830
83.614
16.446
1,575
2.391
29.839695,370
191.180
53.372
1.479.89617.510.4261,334,040
9,262121.088
18,975
503
82.141
4.421
10,814176.430
522.3457,961.474616,594
50718,271
634
2,327
6.958
1.552.05718,077.0811.279.721
8.356
4.17930.705
220.0782,513.000153.189
1.88024.319
5.016
65713.147
4,751
2,040.4753.626
$
81911,873
37,50423
608253
5,146
593152
219
2.667
2791,181
1691.553,698
367.390
11.444
16.030
15,596
5,466
2.042
2,183
5,57260
831
8.92299.1309.3299,020
110,93711,979
8409.733943455
88,4851,065,983117.888
252681
10.665
2.650
7
15.733337,450
101.041
2.165
485.4984.971.488567,967
4.65152,251
10.271
7315,939
1.493
2.413
31.646
295.6043.484,389364.908
4946.630625
3,348
11.276
413,9234.733.074600.276
2.692278
4,723
94,9081,045.301108.905
1012.192
655
2.634
2012.006
2.148
531.103
2.284
$
-18210.666
42.01927
380365
5,395
462
1,058
231,585,504
365.422
10,410
14,776
13.803
4.980
1,730
2,406
4.954
76859
1.992
7047.808773
301
87.577986,369113.236
294384
10,377
• 3.900
204
18,354298.865
105.8972.377
483.9645,071.988527,170
4.29749.703
9,265
4916,956
1.4842.246
32.485
255.3063.025.846315.281
4336.177572
3.444
9.748
380.4174.464.027483,020
2.157363
3.546
90.2711,022.275
99,529
781.460
1,773
1742,049
1,289536.574
2,547
8
7.75082.782
1.914
904.726218
5.767422
7,066
1:244771 6
58.2218.266
'3.175
7.20687,845
886
414
3.817,240
885.451
33,080
44,044
42.950
7.900
20,559
591
4,914
9,226
14,636
8048.438
2,20021,613
151.308 1,702.657
140.820
63.334682,13054,5573.982
50.0124,0823.061
762,1529,134.402822.232
2,8929.862
88,621
18,912
131
2,595
3.434
396
55,3751,171.496
280.33558.713
1,757.42421.568.6402.050,158
17,491213,682
33.552
751
157,123
7,53112.705
241.093
889.82512.907.788
978.127
1.48228,7201.663
6.974
20,620
2.239.86824.799,2342.024.392
6,117
3.20050.378
379.6064,006.433351.987
1.56027.924
875
5.66221.554
95316.682
6.1662,717.588
6.918
$
97875.100
2.796
859.514350
4.962481
6.910
1.395
57.240
3856,428
58.494
3,181
139
3.751.230
826,54729.14639.707
36.556
6,580
22.0231.005
5.223
2.07511.761
1,10712,407
2.49224,947
35.239
3.48842.7363.125
1.098
838.8178,936.116758.904
4.5445235
99.780
21,029
2,217
2,391
3.705
462
54,2801,080,735
311.98258.133
2.095,45223,922,0681,989.934
15,596186,563
29,869
667
103.814
6,44513.641
222.594
861.57412.052,7561.008.018
1.05325.8971,314
6.460
18,073
2.087.19823.851,5111,854.798
10,872
4.69335,164
330,5323.800.957274,328
2.00525.894
5.8587,074
90416.202
6,431
2.688.6946.582
$ $
2.419 68311.540 8.467
542 805
82.445 83.520
408 400
2.475 780118 97
1.577 1,220
316 258
355
7,747 11.0381.848
357 5541,084 1.240
11,732 8,907301 858
209 17607.417 501,761202.112 152.7588.917 8.1354.196 10.0996.991 3.9171,523 1,4805,249 4.002267 396555 642
504 1,6541.593 1.101110 439
1,659 3.055402 471
2.334 4.21520,679
28.9.689230 49 4.3186.396
79.8255,8841.391 1.381
13.619 14,9171,767 1.1811.017 173
176.072 200.3621,148.663 1.220,190
135.281 100.128
408 6892,717 2,0048,918 11.201
2,080 1,743
250 40584 242
213 533
31,376 32,499313,001 255.118
48.562 39.92310.186 29.069
240.509 278.1052,359.609 2.515.737232.940 230.5153.643 9.055
46.349 75.416
6,778 6.3281.010 290
10,968 10.000
478 6034.055 3.96836,809 63.400127.992 170.447
1.745,023 1.892.225133.891 140,537
643 6906.947 4.193936 382
3.069 2.1323.777 2,854
247.663 218,8642,498.265 2.109.224206.012 194,330
1,538 1,269928 846
8,416 7,746
39.822 41.969453.504 431.65141,386 44,157
417 3194.166 3.367
5
2.575 1.2647.536 2.721
392 2053,447 2.616
1.020 975339.700 346.2271.476 1.244
$
3923.870
484
131.785
173
32053650
84208
11.405526
159883
8.844
79
485.933
95.030171
5,235
5.356
3,853
54
498
1,181
1.632212
3,402
8172
30.003 327.680
27.146
31.016 342.507
28,529
2.1817.572324
370
171,5071,767.456
127.973
150
2.44416.615
1.566
20123 1,025
14.010181.119
26.966
9.066271.511
3.159.183269,202
1.02017.297
2.910121
19.938
85
3.23019.153
165.0652.182.966203.3618718
1.348101
970
3.433
344.7173.733.031308.410
633
5207.630
56.339606,51844.452
56728
14
287
2.948
451,240
408
486,442
478
$ $ $
1,309 5.318 Cr1.8884.445 8,979 710648 58 25
113.518 9.415 9.254113
329
43 1.333
52 95 140
84
15.676 302 s 164
18
244 1 894 125
5.144 2,336 1.22174
125
430.626 44.927 49.550110.210 8,169 8.474
141 136 1884,692 104 123
3,055 94 111
35 224,353 165 199
61
421
1.547 930 8781,820 470 97
90 2,328
91 211
21 2 : 33571 9.538 1.483 648
751 8.525 484
273 12 693,125 454 705212 219 20242
132.231 10.626 13.2741.857,016 131.403 120.168
113.805 10.496 14.403
418 40 37
1,355 1 18,658 640 560
1,268 199 81
62 100
1.4856
7.775 6.042 5.647176.983 58.561 55,524
29.951 11,357 10,269
10.301 476 453247,853 54,567 53,892
2.239.637 543.463 553,2983.34,325 44.437 39,078
1,137 815.415 1.053
4.587 763 703
105
22.927 5.205 5.01276 848 766
3.528 557 67921.074 1.045 1.184
187.281 '37,752 38.6422.036.096 397.613 377.013180.124 34.146 32,449
9D 333 218147 25 33
1,285 240 2652.860 706 568
358.588 31.191 37.0633.858.863 364.132 346.674319.599 32,246 31,178
1.113 284 2751.481 13 8.637 610
972.304 8,017 10.1987697488 86.253 101.14440.267 7,109 7.614
122 34 345 78
156
125 1,023 371 444
27 2.019
772 105 126
469.116 59.486 58.289380 219 231
$
2.19827.266
658
193.774182
1.383193
3.167
826
687
19.2411,822
752
21:3E
107
2811.671.283
313.22214.449
17.763
16.195
2.683
5.336135
1.924
1.010
3.999
3834.798
3475.608
50.444621.59449.298
22.635
2:82t.R2
1.22116.6131.6101,176
219.4672.933.141
247,119
5401,708
87.649
4.364
535
1.499
17
35,196516.032
97.805
28.725633,211
8,140.994663.203
7,930134,989
11.342
301
32.490
2.335
6.45965.838
305.4284,199,246336.936
6098.108615
4.446
10.247
597.7497,103,640601.813
2.4821.731
9.1119.898176
153.3751.7776..008651
473
440
2,852
857..54581966
2,256
804.958
2.136
$
2.43620.009
919205.201
183
1.101
2.9961
833
27.568
312
1:(9)14g511
143
1.527,026
305,58012.953
15.40312,862
2.784
5,135246
1,871
1.187
3.887172
4.534
3424.534
12.678
1,34916.5541.054827
246,6242,551.197242,166
1.4691.418
39.995
4.445
536
1,225
24
23.148452.453
103.808
29.167
652,3107.444.799638,752
18,882143,457
11.465151
24.294
2.228
6.26875.541
289,7213,684.768315.437
6107.813626
3.296
6.889
575.5136.450.53851677..245724
2,810
2.668
108.2961.5458..312112.586
604
•
2.222
25:5456013
2,077
780.2692.151For index to roads not appearing in alphabetical order, but given under some other systeM, see page 31.
Digitized for FRASER http://fraser.stlouisfed.org/ Federal Reserve Bank of St. Louis

SEPT.. 191 1 .] RAILWAY EARNINGS 5
NAME OF ROAD
TOTAL EXPENSES NET OUTSIDE OPERATIONS TAXESFINAL NET
incl. General Exp. FROM RAILROAD Gross Revenue Net Revenue Current Previous Current Previous
This Year Last Year This Year Last Year This Year Last Year This Year Last Year Year Year Year Year
$ $ $ S $ $ $ $ $ $ $ $
MILESend of MonthThis LastYear Year
Bennettsv & Cheraw_J'ne 11,022 1,846 —3,271 —867 7 337 —3,279 —1.204
July 1 to J'ne 30_ _ - - 55,404 36.814 27,378 38,286 1,789 1.544 25.588 36,741 33 34
Bernice de N W July 1,831 2,472 82 323 82 323 26 26
Bessemer & L Erie July 425,936 419.853 478.790 439.660 7.000 7.000 471.790 432.66(Y 203 204
Big Falls July 849 723 —631 —372 26 26 —657 —398 15 21
Big Sandy & Cumb_ _July 4,294 2,333 1,472 2,628 147 104 1,325 2.524 24 17
Big Stone G & Pow V_J'ne 419 382 3 99 48 43 —45 55
July 1 to J'ne 30____ 6.524 6.431 541 479 583 525 —42 —46 4 4
Birmingham & A tlan_July 1,671 1,615 —423 —220 83 83 83 83 167 167 —507 —304 22 22
Birmingham & S EJuly 1,609 —133 75 —208 7
Birmingham South _ _July .41,102 56.123 17.119 1,117 2.196 1,618 14.922 —501 41 36
Blooms. & Sullivan__ July 4,856 3,410 238 3,171 29 --.-
Bly Burdette & M R_ _July 1,395 1,111 1,780 —725 88 78 1.692 —803 20 20
Bly Leachv & Ark So_J'ne 4,835 4,840 2.370 1,587 665 863 1.704 724
July 1 to J'ne 30_ _ _ 50,191 36,384 37.654 22,110 1,765 1,413 35.888 20.697 49 37
Bodcaw Valley July 637 1.677 248 1.503 17 17 230 1.485 24 24
Bonlee & Western_ July 773 386 —358 —246 11 5 —370 —252 11 5
Boston d.e Maine July 1890,544 2,593,547 926.695 1,157.682 70.375 54.709 22.003 12,180 172.235 160.666 776.463 1.009.196 2.224 2.242
Maine Central July 641,074 598,956 244,376 227.590 23.101 25,820 —1,941 2.276 41.311 36,376 201.124 193.490 1,165 1,179
Si Johnsb & L ChJuly 24.422 21,974 8.668 7,172 800 800 7.858 6.372 125 125
Sullivan County_ _ _July 27.462 30.657 16,581 9,050 2.600 2.700 13.981 6,350 26 26
Vermont Valley_ _ _July 28,781 20,111 14,169 16.445 1,600 1,400 12,569 15.045 24 24
York Harb& Beach.July 4,242 4,287 3,658 2,293 90 75 3.568 2,218 11 . 11
Boyne C Gayl & Alp_JulY 15,688 14,642 4.870 7,380 1.200 1.200 3,670 6,180 100 92
Bradford de West Pa_July 457 704 134 301 10 8 124 293 8 8
Bridgeton & Saco Riv.July 3,116 3.074 1.797 2.149 70 55 1.727 2.094 21 21
Brimstone R & Canal _July 3,850 5.405 5,376 —3.330 110 125 5.256 —3.455 7 7
Brinson Railway July 8.437 7.378 6,198 4.382 600 500 5,598 3,882 77 72
Brownst de Mid' town_J'ne 733 727 71 379 4 136 67 243July 1 to J'ne :RI__ — 10.195 10,247 —1,756 2,160 169 301 —1.925 1.859 2 2
Bucksport & Elk Riv_J'ne 76 905 1.435 1.586 172 157 1.263 1.428
July 1 to J'ne 30_ _.. 8.122 8,961 13,491 15,985 2,028 • 1.848 11.462 14.137 8 8
Buffalo & Susq RR_ _ _J'ne 110.115 41.192 2.600 38.592
July 24 to J'ne 30_ _ _ _ 1.347.404(New fiscal year)_July 114,912 29.404
355,25325,907 5,835
29.2702,600 670 3E:E 5.164
265265
---269
Buffalo & Susq Ry J'ne 63,289 44 85 31 1:400 —1.323
July 1 to J'ne 30- -- -(New fiscal year) _July
Buffalo Att & Arcade_J'ne
752.73458,647
5,069 3.473
—204: 04 0690
—1,086
389 —429 64 —10
15
18729
1,400
100 100 --5-891:.5710°8662-84
9191
July 1 to J'ne 30_ _ _ - 41,313 37,936 8.699 4.800 1,200 1.500 7.499 3.300 27 27
(New fiscal year)_July 4.244 2.732 —161 393 100 100 —261 293 27 27
Buff Creek de Clauley_July 2,724 1.438 337 —340 100 100 237 —440 18 8
Buff Roch & Pitts ___J'ne 593.253 605,571 168.899 233.246 3,692 1.681 —973 —2.954 16.000 37.095 151.925 193.196
July 1 to J'ne 30_ _ _ - 6,145,855 5,903,904 2,988.546 3,032.212 18,868 17,064 —1.989 —2.354 212.000 i::,095 2.774.557 2.841.762 572 566
(New fiscal year)_July 537,687 484.039 284.544 274,864 1,757 1.961 399 —517 17,000 16.000 267.944 253.346 572 566
BurrsFyBrown&Ches.July 1.518 2.979 1.381 1,564 70 60 1,311 1.504 11 16
Butler County July 7,189 5.064 2,672 171 72 62 2,600 109 37 33
Butte Anacon & Pac_July 66,234 72.431 22.386 27,348 2000. 2.500 20.386 24,848 46 46
Butte County July 8,710 9,263 10.201 11.766 eoo 242 9,600 11.524 31 31
Cache Valley July 909 10,404 —777 —8.186 8 99 —786 —8.195 10 10
Caddo & Choctaw.... July 1.436 1,236 1,158 1,155 37 24 1,121 1,130 13 12
Cal Ham & S n July 3,298 3,528 135 176 30 28 105 147 7 7
Calumet Western July 231 557 165 —95 416 502 —251 —597 3 3
Canadian Pac Lines in U SCanPacRy in Maine J'ne 90.019 72.756 —34,644 —18,475 27.895 5,716 —62.539 —24.191
July 1 to J'ne 30_ _ _ 1,107.316 978.520 64,180 102,214 82.895 60,716 —18.715 41,498 233 233
Duluth So Sh & AtI.July 197,138 195.458 83,197 116.524 7,574 7.857 2.513 3,054 18.000 18.000 67.710 101.578 612 604
Mineral Range July 51,960 72.552 6.752 —14,418 3,500 3.500 3,252 —17,918 127 127
Minn St P&SSM_J'neJuly 1 to J'ne 30_ _ _ _(New !heal year) _July
1.239.53114.699.8101,251.037
1.281.26313.725.2461,180.442
517,8926,868.830799.121
814,188 38.636 38.476 13.975 12.70310.196.822 403.937 413.335 105.409 124.311
809.492 43,527 45.381 17.319 21.464
124.3191.246,074125,714
125.7521.274,827118.052
407.5495.728.164690,726
701.1399,046,306712.903
3.7693.769
3.5323.534
Newp' t & Richford_J'ne 12,945 29,075 4.546 —13.479 .
1.879 570 2.666 —14.049
July 1 to J'ne 30_ -- 202,768 234,290 10,914 —47,726 7,379 6,070 3,534 —53,797 21 21
Carolina & N IV July 23.746 24.910 9.805 4.958 1.000 975 8.805 3.983 133 133
Carolina & Western.. _July 1.433 547 —681 119 23 . 14 —705 105 15 10
Caro Clinch & Ohio.. July 76.459 70.558 80.664 33.256 74 74 6.000 5.500 74,738 27.756 238 236
CaroClinch&OofSC_July 4.085 4,112 3.446 2.332 500 200 2.946 2.132 17 17
Central Indiana July 15.431 15,531 —2.725 —1.889 1.687 1.341 —4,413 —3.230 127 127
Central New England.July 125.558 164,168 115.535 58.426 954 79 9.000 9.000 106.614 49.426 276 277
Central of Georgia_ _ _J'neJuly 1 to J'ne 30_ _ _ _
674.1169.020.092
728.2538.474,910
215,7093.887.695
133.321 8.799 8.249 7.474 6.8603.577.845 95.102 86.636 77,856 69:771
57.227560.135
45.204540,619
165.9563,405.426
94.9773,106.997 1.915 1.915
(New fiscal year) July 744.813 704.987 233,313 303,030 9.712 8.334 8,212 6,%0 47,400 44,900 194.126 265.080 1.915 1.915
Loulsv & Wadley_ _J'neJuly 1 to J'ne 30___ _
1.56518.364
1,65914.799
—8210,355
—60511,097
99689
49579
—1829.666
—65410.517 10 10
(New fiscal year)_July 1,832 1.293 —168 20 60 46 —229 —25 10 10
Wadley Southern_ _July 9,184 7.412 —2,209 —952 472 404 —2,682 —1,357 90 90
WrIghtsv & Tenn.._July 19,744 14.649 875 3.424 199 75 199 75 1,133 950 —58 2,549 105 105
Central RR of N J J'ne 1.278,685 1,252,307 961,182 834,891 188.112 172,281 31.400 —269.375 Cr186.717 97.848 1.179.301 467.667
July 1 to J'ne 30_ _ _ .. 14.198,995 13.268.482 10,600.239 10,583.028 1.873.370 1.790.113 75.286 —93.171 769.681 1,174.924 9,905.844 9.314.932 633 667
(New llscal year)_July 1,188.769 1.151,381 835,623 703.417 258.527 235,144 94.823 82.963 94,033 95,982 836.413 690,398 671 667
Central RR of Pa_ _ _ _July 5,362 5.827 755 5,044 26 25 --125 --57 282 280 346 4,706 30 30
Central Ry of Arkan J'ne 3.194 5.211 6 --518 367 174 --361 --692
July 1 to J'ne 30_--- 38,476 34.277 11,902 886 35 35 1,333 1,054 9.568 —132 13 13
Central Vermont _ _ J'ne 232.047 240,206 147.558 90,325 2.116 2,143 755 1.074 13.596 10,110 134.717 81,289
July 1 to J'ne 30_ - - - 3.027,672 2,862.128 978.761 938.828 21,012 23,163 6,611 9.068 138,213 121.393 847.159 826,503 411 411
(New fiscal year)_July 254.298 211.530 97.689 62,798 2.464 2.464 754 1.200 11,750 10,116 86.693 53.882 411 411
Centralia Eastern J'ne 1.151 1,176 408 829 49 70 359 759
July 1 to J'ne 30___ 12,810 12,757 15,113 13,136 937 1,253 14.176 11,883 9 9
Charles City Western_J'ne 793 82 82
July 1 to J'ne 30_12 __. _
Charleston Term Co July 6,719 4,472 —1,056 1,386 4.585 3,931 --6.634 —2,754 1,400 1.100 —9.091 —2.467 1 /
Charlotte Her & Nor_July 20.274 7,271 1,279
.
—196 542 653 737 —850 95 95
Charlotte Mon & Col _J'neJuly 1 to J'ne 30__ —
1.18312.856
82613.143
—2293,827
783,058 --57
es789
74766
—2952.981
32.292 18 18
Chattahoochee Valley July 4.190 4,317 1.976 2,113 150 150 1.826 1,963 32 32
Chesapeake & Ohlo...Ju,y 1.757,281 1,713.156 960,306 975,538 39,087 37.590 1.552 291 93.100 80.540 868.759 895.289 2.241 2.223
Chesapeake Western_July 4.873 5,062 2,044 1.519 121 277 100 247 317 293 1,827 1.474 40 40
For index to roads not appearing in alphabetical order, but given under some other system, see page 31.
Digitized for FRASER http://fraser.stlouisfed.org/ Federal Reserve Bank of St. Louis

6 RAILWAY EARNINGS [VOL. LxxxxiiiFREIGHT & PASSENGER EARNINGS TOTAL EARNINGS MAINTENANCE EXPENSES TRAFFIC & TRANSPORTAT'N EX P'SFREIGHT PASSENGER incl. Other Revenue Way & Structure Equipment TRAFFIC TRANSPORTAT'NNAME OF ROAD This Year Last Year This Year Last Year TMs Year Last Year This Year Last Year This Year Last Year ThisY'r LastY'r This Year Last Year$ $ . $ $ $ $ $ $ $ $ $ $ $ $Chesterfield & LancJ'ne 3.170 2.995 704 701 4.269 3,934 400 397 272 403 13
5July 1 to J'ne 30 _ ___ 67.818 58.397 10.520 9.074 82.178 70.983 7.381 7.225 3,448 4.242 134 71
181:3 1.2264784 18.9431Chestnut Ridge July 1,843 . 1.764 279 212 3.418 2.465 565 928 1,047 165 139 122 1,706 1,322Cheswick & Harmar J'ne 1.220 4,964 1.220 4,964 707 447July 1 to J'ne 3')__-- 39,950 45.240 39.950 45,240 4,517 4,166 56Chicago & Alton July 828,209 708,076 395.901 374,220 1.314.900 1,170.991 198.301 136.909 182.093 187.536 36.583 38,067 421,022 409.501Chic & Calumet Riv.._July 2,881 3,790 2,881 3,790 152 1,102 376 229 1.320 1.840Chic & Ill Midland_ _ _July 9,599 1,397 1,323 1,104 11,996 2.661 564 577 1.213 1,053 130 164 2,676 1.782Chicago & Ill West__J'ne 12,765 19,218 30 86 13.100 19.554 1,452 1,644 7.117 3,847 109 118 3,775 5.184July 1 to J'ne 30__.. - 151.125 161.742 674 1.058 158.030 166.404 14.401 12,102 57.758 37,101 1,510 2.198 52.406 42,414(New fiscal year)_July 10.762 19,189 27 88 11,292 19.796 1,224 1,249 5,495 3.625 32 135 2.415 5.869Chicago & Lake Sup_June 249 252 157 195 485 514 318 87 30 154 239July 1 to J'ne 30_ _ _ _ 3.063 2,804 1.930 1,943 5,840 5.480 1,160 1,103 461 863 3 3.739 3,245(New fiscal year) July 109 204 202 209 478 492 122 87 393 276Chic & North West_ _July 3,694,364 3.968,213 1,862,277 1.837.436 6,118.555 6.404,222 881,150 1.038,368 765.201 663.574 122,894 125.711 2,380,048 2.463.182Chic St P M & Om_July 641.099 754.901 423.957 423,038 1,150.936 1.269,954 236.499 247.611 151,277 147,029 28.541 25,710 457,274 449,404Macoupin County_ _July 27,829 31,447 27.967 31.530 5.032 8,567 27815661 3.901 Pierre & Ft Pierre_ _July 3.597 3,670 1.502 1.976 5.202 5.733 72 85 192 62
4,559 4,9101.625 1.510
2
Pierre R C & N W_ _July 13,692 18,646 18,380 25.492 34.986 46.017 5,552 8.722 990 136 14 13.510 14,255Wyoming & N W_ _July 22,274 27,503 8.219 11,554 32,322 41,268 6,680 5,040 2,171 910 319 437 8,295 12.584Ch :t & Wabash Vail_ _July844 1,025 19 37 876 1,067 1,645 560 416 209 46 130 539 513Chic Anamosa & Nor_July 1,165 970 361 347 1,657 1,500 445 371 119 653 422Chic Burl & Quincy ..July 4,308.418 4.270.179 2.085,814 2.207,136 7.042,050 7,087,570 1.179.300 1.481.796 1,260,462 1.330.776 150.142 137.740 2.193,653 2.302,673Quincy Om & K C_July 40.798 30.616 20,534 19,363 66.801 55,313 21,912 18,611 9,850 6,733 1,292 1,301 23.190 24,912Chicago Great West; _July, . 648.779 614.018 276.790 257.522 1,010.126 951,436 109.546 112.468 162.270 145.322 45.020 47.890 407,150 377,40Chic Indiana & Sou_ _July 240.593 211.604 27,213 27,495 274,860 246.505 50.112 44,896 55.940 52.206 7.185 8,697 110,078 101.112Chic Intl & Louisv- - -J'ne 344,712 349.413 129,858 123,107 526,493 522,151 69,215 68.492 78.076 76,268 17.050 18,417 182.960 186.876July 1 to Inc 30....-- 4,054.115 4,063,422 1.576.659 1,449.074 6.186,878 6,020.241 799.007 792.967 878.721 822.784 201,556 175,640 2.193,183 1,973,814(New fiscal year) _July 352.503 339,980 142,602 141.947 543.908 528.187 75,228 70.972 75.727 70.876 18.185 18,736 178,335 177,909Chicago Mem & Gulf _J'ne 8,911 3,599 2,139 1,070 11,962 6,147 3.621 850 1.898 207 260 4,354 1,671July Ito J'ne 30-- 122,210 55,266 21,881 14,328 157,680 83.778 26.153 13.064 15,858 5.110 375 318 41,005 22.819Chic Milw & Gary ._ _ _July 21.027 16.140 15 67 21.350 16.782 7.765 15,362 5.257 4,531 1,371 1.206 10,466 8,572Chic Milw & St Paul-.July 3.135,090 3.450.123 1,370,034 1,397,894 5.044,537 5,341,535 766,645 767.996 697.747 675.676 99,812 95.788 2.035.444 2,142.299Chic Mil & Pug Sd_July 1,066.018 1,1001,105 238.541 118.347 1,343,653 1.142,071 77.007 37.093 114.036 122,898 54.002 25,974 461,974 377,289 ' 2,627 4,455
Gallatin Valley_ _ _ _July 3,828 6.554 544 795 50 Tacoma Eastern_ __July 30.896 37,810 14,612 16.407 48,065 56.267 8.396 10,963 9.411 1,142 717 659 16,039 13.275WhSulS& YellowPk July 4,130 757 5.079 496 250 1.182Chic Peoria & St L_ __July 97,441 96.954 35.909 28.038 140.112 130,961 18.443 24.926 25.219 28,825 7.561 6.682 58,835 55.612Chic St P M & 0m_ __July 641.099 754,901 423,957 423.038 1.150.936 1,268,954 236.499 247.611 151.277 147.029 28,541 25.710 457,274 449.404Chicago Short Line__J'ne 1.295 2.457 7.991 9.570 915 1.383 1.781 1,688 68 60 3.327 4.665July 1 to Inc 30....._ 24,852 31.872 1132.0 21.7902 127.139 9,012 10.894 28.9
2,702
1.51577 18.197 840 503 61,533 56,6294
Chic Terre H & S E_ _ _July 119.616 19.758 23,831 41,419
241,18. :972305075:043
Ch W Pullman & Sou _July 17.056 19.172 314 2.662 2.774 2.760 96 71 29..538503 10.952
2,850730
Chic Ziegler & Gulf _ _J'ne 570 13 37 666July I to 'Joe 30_ _ _ - 2.803 40 25 1.994 251 112 (New fiscal year)_July 844 844 71 485961 1.233 197 293
Chippewa Val & Nor_July 854 1,123 107 110 114 88 25 326 305Cimarron & Nor Wes t.July 2.380 2,591 140 235 2,689 3.083 1.968 1.425 337 273 735 661Cin Bluffton & Chic.. _July 2.189 2.595 2.467 2,239 5.091 5.226 1,055 1.191 851 695 99 156 2.809 2,300Cin Fiemingsb & S E_July 2.050 1,242 697 696 2.951 2.146 343 248 68 82 73 58 805 830Cin Ham & Dayton_ _J'ne 601,823 595.855 136,223 146.340 836,580 831.021 90.211 192,626 139,512 157,696 15,593 34,439 346,978 364,322Juiy 1 to J'ne 30_ _ _ _ 6.904.048 6.757.319 1,659.051 1,682,030 9,570,281 9,446.524 834.461 1.465.360 1,702.726 1.666,090 268,323 282.277 4.340.891 3.876.400(New fiscal year)_July 608.216 552,204 169,764 163.647 876,363 804.438 90.992 99.035 136.201 144.405 17.069 26,907 365.380 366.467Cin N 0 & Texas Pac _July 563,165 567.868 149.044 136,539 753.261 743,153 74.643 79.186 131,622 110.574 19.470 20.525 222.394 223.468Cin Burns & Cumb_July 1.263 1.121 1,441 1.263 203 118 63 723 615Harriman & N B. __July 8.370 8.034 502 453 9.272 8.900 2,007 3.865 308 1.13140 25 Cr5 1.968 1.569Clarendon & PittsfordJuly 6,248 5.358 6.248 • 5.358 2,794 1.684 103 153 2,415 1.885Clev Cin Chic & St L_July 1.608.301 1.404.542 775,236 759.960 2.594.186 1376,080 285.581 419.101 347,071 433.939 96.610 103,905 939.428 1.049,806
10.569603 1.163
Clinton & Okla West_J'ne 1,155 Dr1203 561 607 1.838 Dr584 197 857 221 2July 1 to J'ne 30.._-- 23.257 32.603 14 721
193 7,571
Coal & Coke July 47.286 43,975 16,717 17,029 2,691
66,624 63,429 15.299 12.555 146..451733 14.983 1.053 864 18.101 16,55719 1.038 1,671
Colfax Northern July 1.743 3.166 541 746 2.325 3,974 1,113 697 3.837 487 1Colorado & So East_ _July 7,427 9.770 7,439 9,787 591 1.756 708 1.054 212 284 2.224 3,138Colorado & Southern.July 441.000 556,341 170.183 192,773 655.249 790.037 89.868 136,325 127,374 153.911 12,320 13.727 194,160 257.065Col Sp & Crip C D_ _July 39.887 • 42.014 17.850 17,540 59.306 61,010 9.788 9.627 7,935 7,897 2.673 1.946 17.699 17,318Ft W' th & Den C'y _July 205,106 231.473 142.829 153.198 369.034 403.662 28.054 61.083 55.191 68,025 8.899 8,258 113,629 132,944Wichita Valley_ _ _ _July 23,205 29.487 19.573 25.109 46,663 58.320 6.111 11,326 5.467 4.067 568 470 20.064 22.776Total Company-July 709.198 859,315 350,435 388,620 1,130,252 1.313.029 133.821 218,361 195,967 233,900 24.450 24.401 345.552 430,103' Trinity & Brazos V July 74,332 72,267 37,137 34,239 117,213 109.365 26.902 31.081 25.675 34.535 12.163 7,402 61.781 68,777Colo & Wyoming_ _ _ _July 23.653 26.552 3,130 4,294 61,417 64,775 8,862 9.878 10.438 9,678 32 511 19,998 19.451Colorado Midland_ _ _ _July 103.652 93.181 35,307 43.855 155,398 157.345 25.557 26,877 27,372 34,459 6,845 5,649 62.469 64,544Columbia & Pug Sd_ _July 35.542 43.432 5,572 6,354 46,501 55.406 7,168 9.309 6.192 8.638 151 228 12.000 12.725Coium Newb 6c Laur_July 9.586 12.690 11.384 11.762 22,256 25.684 6,351 5.423 3.174 2.207 145 121 8,126 7.772Columbus & South_ _July 1,047 502 352 608 1.509 1.218 549 300 309 8 300 480 241Connec ting Terminal _JulyCopper Range J'ne 49.155 51.717 13,197 12,086 66.889 71.212 16.532 14,204 5.977 5.271 1,593 1.559 20,028 22.422July 1 to J'ne 30.- - - 521.880 562.323 128.022 136.804 698.582 747.860 118.752 122.629 68.936 26,223 19.000 17.716 252,931 245.368Cornwall
11..614175
July 12,304 13,611 3.542 3.476 16,908 18.327 1,635 2.471 1.592 1.948 122 55 3.464 3.792Coudersport & Pt All_JulY 6.937 6.459 3.930 4.168 11,175 10.846 2.781 3.358 3,285104 246 Craig Mountain J'ne 1,294 264 1,703 276 187July Ito J'ne 30... 5.846 1,346 2,221 7687.672Cranberry Lake July 1.767 1,652 575 606 2.648 2,417 350 458 485 92 Crane July 4,239 3,393 4,241 3,393 140 128 629 521 Cripple Creek Central—
Fior & Crip Creek_ _July 23,338 24.736 11.452 11,219 35.809 36.896 3.223 6,258 3,434 3,501 1,633 1.265 ' 11.348 11,257Midland Terminal_ _July 12,840 13.570 6,153 6.253 19,542 20,332 3,351 3,369 1,872 1.908 879 681 61..714140 61;006181Crooked Crk RR & C_J'ne 1.700 1,741 167 54 2,038 2.583 334 530 152 290 July 1 to J'ne 30 . _ _ .. 23.933 20.230 927 979 27.776 27,253 5,199 6.017 1,896 3,342 15,042 11.911Crosbyten 1,440 -Southp'Is _July 746 650 40 23 32 919Crosset Railway July 4.181 6.038 4.577 6.038 1.942 1,061 179 681 60 1.451Crystal River July 2.159 2,074 921 602 6,143 5,740 861 740 407 931 9 67 738 837Cumberland & Penna_July 66,413 71.296 2.522 2.024 71.017 75.419 6,812 8,063 22,807 23,095 240 375 19.970 21.761Cumberland Valley_ _July 166,755 189.390 57,766 57.395 235,535 256,525 44,267 29,713 29.062 32,289 4,875 4,578 72,454 77.561For index to roads not appearing in alphabetical order, but given under some other system, see page 31.
Digitized for FRASER http://fraser.stlouisfed.org/ Federal Reserve Bank of St. Louis

SEPT., 1911 RAILWAY EARNINGS 7
NAME OF ROAD
TOTAL EXPENSESincl. General Exp.This Year Last Year
NETFROM RAILROADThis Year Last Year
OUTSIDE OPERATIONS TAXESGross Revenue Net Revenue Current Previous
This Year Last Year This Year Last Year Year Year
FINAL NETCurrent PreviousYear Year
MILESend of MonthThis Last
$ $ $ Year Year
Chesterfield & Lanc__J'ne 2.634 2,534 1,634 1,399 283 150 1,351 1.249July I to J'ne 30-__ 36.912 37.118 45,265 33.865 2.600 1,813 42.665 32.052 38 38
Chestnut Ridge July 4,374 2,811 -956 -345 40 30 -996 -375 13 10Cheswick & Harmar J'ne 755 534 464 4.430 25 15 439 4,415
July 1 to J'ne 30.___ 5,058 5.551 34,892 19,688 300 180 34.592 39,508 4 4Chicago & Alton July 870,733 806,109 444.167 364,881 11,398 11,993 -3,016 -4,807 36.500 37.300 404,650 322.774 1.025 998Chic & Calumet Riv July 2,800 3,803 81 -12 225 75 -143 -87 1 1Chic & Ill Midland July 5,670 4,489 6,326 -1,828 530 450 5,796 -1278 25 25Chicago & Ill WestJ'ne 13,682 12,269 -581 7.285 500 325 -1,081 6.960
July 1 to J'ne 30_ _ 142,348 111,430 15,681 54,974 6,000 3,900 9,681 51.074 14 14(New fiscal year) _July 10,617 12,444 675 7,351 950 500 --274 6.851 14 14
Chicago & Lake Sup_June 503 333 -18 181 4 4 -23 177July 1 to J'ne 30__ _ 3,474 5,298 366 181 53 51 312 129 3 3(New fiscal year) July 572 368 -94 123 4 4 -98 119 3 3
Chic & North West.. July 4,274,880 4,439,531 1.843.675 1,964.690 72.283 61.357 -506 -2.239 275.000 262.000 1.568,168 1,700.450 7.754 7.629Chic St P M & Om_July 906,751 901,330 244,184 367,623 13,906 14,966 1,356 398 60,728 57.294 184.812 310,727 1,743 1,738Macoupin County_ _July 12,125 17.444 15.842 14,086 585 585 15.257 13,501 23 23Pierre & Ft Pierre July 2.022 1,778 3,180 3,954 1,250 1,335 1,930 2.619 2 1Pierre R C & N WJuly 22.681 24,183 12,305 21,834 3,750 3,325 8.555 18,499 165 165Wyoming & N W....July 17,966 19,307 14.356 21,960 2,850 2.500 11,506 19.460 147 147
Chic & Wabash Vali _ _July 2,802 1,590 -1,926 -523 227 187 -2.153 -710 35 37Chic Anamosa & Nor July 1,261 1.325 395 175 112 121 283 54 19 19Chic Burl & Quincy_ _July 4,977,884 5,438.413 2,064,166 1.649.157 61,491 63,790 -20,550 -11.946 264.412 250.454 1,779,203 1,386.756 9.074 9.024
Quincy Om & K C_July 58,703 54,085 8.101 1,228 3,000 3,000 5.101 -1.771 262 262Chicago Great West_ _July 757,991 717,630 252.135 233,806 7.600 8.701 -870. -.282 _33,037 32.822 218,228 200,701 .1.49.6 JAE-Chic Indiana & Sou_ _July 232.138 217,333 42,722 29,172 2,078 1,985 370 es- 13,900 13,575 29.192 15,923 329 329Chic Ind & Loulsv J'ne 366.192.' 368,601 160.301 153.550 20,945 25,153 139.356 128.396
July I to J'ne 30_ 4,257,162 • 3,948,135 1,929,715 2,072,106 268,445 268,653 1.661.270 1.803.452 616 615(New fiscal year)_July 361.029 • 353.445 182,879 174,741 22,500 22,500 160.379 152.241 616 615
Chicago Mem & Gulf _J'ne 10.542 3,214 1.419 2,933 157 107 1.262 2.826July 1 to J'ne 30_ _ 93,280 48.699 64,399 35,078 2,284 1,284 62,115 33.794 52 31
Chic Milw & Gary_ _ _July 26,258 31,674 -4,907 -14.892 2.000 2,222 -6.907 -17.114 128 128Chic Mil w & St Paul _ _July 3,690327 3,773,548 1,354,410 1,567,986 153,396 155.443 11,523 23.885 239.106 216,040 1,126,827 1,375,831 7.511 7,511
Chic Mil & Pug Sd_July 722,659 572,754 620.993 569,317 87,451 53,206 23,087 3,352 79,334 37,833 564,747 534.836 2,058 1,521Gallatin Valley__ July 6.125 528 430 98 52 - --Tacoma Eastern_ _ _July 36,264 27,523 11,801 28,744 11,379 8.933 178 4,458 2.100 2.501 9,879 30,701 91 87WhSul S& Yellow Pk July 2,033 3,046 150 2,896 22
Chic Peoria & St L__ _July 115,627 121.681 24,485 9.280 4,300 4,500 20,185 4,780 255 255Chic St PM & Om July 906.751 901,330 244,184 367,623 13.906 14,966 1,356 398 60,728 57,294 184,812 310,727 1.743 1,738Chicago Short Line J'ne 6.852 8,514 1.138 1.056 190 214 948 841
July I to J'ne 30____ 101,227 94,772 30,675 32,367 2,044 1,808 28,630 30,558 11 11Chic Terre H & S E_ _ _July 103,869 38,893 515 -166 8.700 30,026 353Ch W Pullman & Sou_July 13.394 17,289 3.662 1.883 182 95 3,479 1.788 10 10Chic Ziegler 8c Gulf. __J'ne 733 -163 57 311 -220 -311
July 1 to J'ne 30___ 4,832 276 -2,029 -276 1.148 1,190 -3.178 -1.467 1 1(New fiscal year)_Jul-y 602 241 57 183 1
Chippewa Val & Nor_July 705 729 256 503 256 503 19 19Cimarron 8c Nor West.July 3,180 2,512 -348 571 -348 571 35 26Cin Bluff ton & Chic_ _July 5,478 4,953 -387 272 625 604 -1.012 7-331 51 51Cin Flemingsb & S E_July 1,371 1,300 1.580 845 25 23 1,554 822 5 5Cin liam & Dayton. J'ne 611,541 775.747 225,039 55,274 38,625 19,285 186.413 35.988
July 1 to J'ne 30- - 7,398.588 7.587,296 2,171,693 1.859,227 378,976 308.761 1,792.716 1.550,466 1.014 1.036(New fiscal year) July 629,974 660,325 246,388 144,113 35.320 26.889 211.068 117,223 1.014 1,036
Cm N 0 & Texas Pac_July 465,310 450,894 287,950 292,259 6,065 4.429 158 -313 21.800 21,500 266,309 270.446 337 337Cin Burns & Cumb_July 1,075 758 366 504 67 67 299 437 1 1Harriman & N E.._ _July 4,543 6.819 4.728 2.080 450 450 4,278 1,630 19 19
Clarendon & PittsfordJuly 5.313 3,722 934 1,635 167 177 766 1,458 20 17Clcv Cin Chic & St L_July 1.726,562 2.066.495 867.623 309.584 33.509 29,541 -2,542 -12.896 90,000 82,000 775,081 214.687 2.009 1,982Clinton & Okla West-J'ne 1,551 2.744 287 -3,329 287 -3.329
July I to J'ne 30_ _ • 23,635 8.968 8.968 21 21Coal & Coke July 53,329 47,165 13,295 16,264 12,940 13.700 '10.986 11,272 3,500 3,500 20.781 24.036 197 197Colfax Northern July 6,213 3,266 -3,888 708 146 141 -4,034 566 13 13Colorado & So East_ _July 4.981 7,909 2.458 1,878 135 130 2,323 1,748 20 20Colorado & Southern_July 445.462 582,673 209.786 207.364 5,514 12.681 -1.455 -2,197 24,700 24.700 183,631 180.466 1,194 1.248
Col Sp & Crip C D_ _July 41,383 39.392 17,922 21,618 1,996 2,027 15,925 19,591 74 74Ft W' th & Den C'y _July 218,018 284.184 151.015 119.477 3,284 3,344 -1,277 -3,656 12.500 10,000 137.238 105,821 454 454Wichita Valley_ July 34,299 40.763 12,363 17.556 2.000 2,546 10.363 15,010 256 256Total Company_ _July 739.162 947.012 391,086 366,015 8,798 16,025 -2.732 -5.853 41,196 39.273 347.157 320,888 1,978 2,032
Trinity & Brazos V July 135,763 151,255 -18,549 -41,889 3.500 3,500 -22.049 -45,389 462 462,Colo 8c Wyoming_ _ _July 41.378 41,361 20,039 23,413 1.500 1.500 18,539 21,913 54 54Colorado Midland_ _ July 127.514 137,128 27,883 20,217 3,288 4,214 -206 383 8,000 8.500 19,676 12,101 337 337Columbia & Pug Sd_ _July 26.845 32,065 19.655 23,340 2,416 3.171 17,239 20,169 55 57Colum Newb & Laur_July 19,900 17,387 2,355 8,297 900 900 1,455 7,397 75 75Columbus & Sou th _July 1,519 975 -10 243 10 13 -21 229 22 22Connecting Terminal_July 8.084 7.250 -333 -1.000 1,102 984 -1,435 -1,985 3 3Copper Range J'ne 46.073 45.826 20.816 25,385 2,970 8,110 17,845 17.275
July I to J'ne 30_ __ 486,362 439,908 212,220 307,952 55,926 53,086 156,293 254,866 131 128Cornwall July 7,596 9,044 9,312 9,283 500 550 8.812 8,733 12 12Coudersport & Pt All_July 6,190 7.280 4,984 3.566 200 200 4,784 3.366 39 39Craig Mountain J'ne 1.363 339 6 333
July 1 to J'ne 30____ 7,740 -68 37 -105 5Cranberry Lake July 1.975 1.821 673 595 87 68 586 529 6 6Crane July 2,342 2.588 1,888 805 95 50 1.803 755 3 2Cripple Creek Central-nor & Crip Creek.. _July 23.745 23.810 12,064 13,085 1,297 1.317 10.766 11,768 54 54Midland Terminal- _July 12,827 12,880 6.714 7,452 698 709 6,016 6,742 29 29
Crooked Crk RR & C_J'ne 2,256 1,865 --218 718 292 762 -511 -43July 1 to J'ne 30-__ 22.475 21,783 5.300 5.469 2.898 3,170 2.401 2,299 17 17
Crosby ten-Southp'Is _July 1,169 270 270 38 38Crosset Railway July 6.545 5,695 --1,967 343 19 19 -1,987 -323 18 15Crystal River July 2,180 2,706 3,962 1033 600 800 3,362 2.233 16 16Cumberland & Penna_July 53,001 56,300 18.016 19,118 166 83 97 17 3.100 2.800 15.013 16.336 32 32Cumberland Valley. July 157,847 149.846 77.688 106.678 1.406 1,370 585 187 5.141 4,915 73.132 101.949 162 162
For index to roads not appearing in alphabetical order, but given under some other system, see Inge W.
Digitized for FRASER http://fraser.stlouisfed.org/ Federal Reserve Bank of St. Louis

8 RAILWAY EARNINGS [VoL. LXXXXIII
NAME OF ROAD
FREIGHT & PASSE NGER EARNINGS TOTAL EARNINGS MAINTENANCE EXPENSES T RAFFIC & TRANSPORTAT'N EXP'SFREIGHT PASSENGER incl. Other Revenue Way & Structure Equipment TRAFFIC TRANSPORTAT'NThis Year Last Year This Year Last Year This Year Last Year This Year Last Year This Year Last Year ThisY'r LastY'r This Year Last Year$ $Dans,/Ille & Mt Mor__J'ne 1,659 1,586 ' 1,125 937 2.944 2.705 898 840 467 3.342 52 46 1.020 1.143July 1 to J'ne 30._ _ _ 24.253 21.551 13.474 12.751 40.302 36.636 12,376 8.651 3.853 7,423 542 520 14.290 11353(New fiscal year) .July 1,101 1,363 1,139 1,080 2.470 2.697 1.290 1,017 219 247 41 46 949 • 809Dardanelle & Russell_July 1.915 974 436 397 2,506 1,508 435 390 73 10 1.130 1.047Dardan Ola & South _J'ne 549 1,008 748 595 1,372 1.680 359 336 60 85 27 52 615 631July Ito J'ne 30____ 13,887 12.500 8.894 6.009 23.735 19.718 9.028 3,153 2.691 2,719 562 405 8.737 7.696Day R I & Northwest.July 4.480 6.273 1,700 1,866 1,218 938 2.620 3.056Dayton & Union J'ne 4.078 3,256 6.378 8.118 12,241 13.005 2.218 1,951 1,298 1,260 221 286 5.263 5.003July 1 to J'ne 30._ 46.254 60.521 81.744 82.747 148,453 162.556 21.994 38.603 14,504 16,384 4,789 3,372 61,511 59,348Dayt Lebanon & Cin_J'ne 2,256 3,339 1,290 887 3.705 4.738 1,678 943 553 478 120 132 2,621 1.746July 1 to J'ne 30___ 45.755 32,396 13,820 9,084 62,176 43.570 16.058 11,401 8.512 7,777 1,125 2.322 25.648 22.258De Queen & Eastern_July 524 2,436 527 675 1,200 3,217 212 663 337 493 108 40 754 567Deering S W Ry July 3.398 1,154 99 4.591 2,055 1,323 534 1,156 647 98 16 1,881 473Delaware & Eastern_July 5.425 5,669 2,302 2,411 8.261 8,561 3,366 2.242 1,308 1.976 166 178 3.469 3.653Delaware & Hudson_July 1.362.091 1,237,455 338.368 312.774 1.767,439 1.607.011 107.564 122,873 237,236 222,529 23.251 34,540 582.892 550.420Cooperst'n & Ch V_July 3,034 2,679 2,051 2.198 5.512 5.356 3.002 676 78 119 2,394 2.356Greenw & Johnson_July 4.764 5,660 916 1.395 5.981 7,317 1,625 902 171 144 63 49 1,940 3.031Del Lack & Western_July 2.104,687 2.056,779 748,439 749.484 3.062,893 3,007.936 487,689 396.362 462.016 400,023 70.218 68.121 868.492 837.967Lack & Montrose. .July 416 525 2,272 2.043 2.862 2.741 718 1.154 23 20 56 54 1,342 1.296Sussex July 6.898 8.657 6,756 8,507 16,407 20.026 6,518 5,097 228 209 282 274 7,062 6,653Syrac Bing & N V. _July 44,621 44.682 36,427 34.189 93.292 90,321 18.680 9.879 5.803 5,360 2,808 3.406 28,910 28.832Delray Connecting July 9,390 9.262 2.905 3.464 1.952 1.275 4.370 4,593Dents Run J'ne 125 303 195 181 16 23 135 135July 1 to J'ne 30_ 3,462 4.574 2.268 2,286 293 574 1,628 1.650Deny & Rio Grande_ _July 1,371.778 1.420,913 520,246 537,730 1,977.615 2,049.725 275.938 268.431 341.241 286,222 61,004 53.359 662.677 621.785Boca & Loyalton_July 9.884 11,949 1,383 2,183 11.689 14,861 2,583 2,248 1,513 2.222 3,108 3.768Rio Grande South. .July 30,497 38,502 10.852 12,661 44,930 54.772 13.991 12,339 2,675 5,445 177 220 13.774 15.597Western Pacific. _ _July 299.603 107.718 422.084 66.128 32.382 29.720 162.080Denver Boulder & W_July 3,236 6,463 6,834 8,263 10,518 15 149 2,233 2,779 1,099 1,349 405 668 4,462 5,956Deny Laramie & N W.July 3.126 2,986 4,612 31489 8,267 7.284 1.206 855 1.162 599 1,019 1,277 3.439 4,163Denver N W & Pac__July 46,259 42.690 62.677 641138 114.101 111,199 14.614 16,827 15.123 14,774 3.221 4,058 26.307 28,187Depue & Northern___July 1.846 1.531 536 65 196 10 50 51 624 603Des Moines Union.. _J'ne 30,709 30.222 2.945 3.612 1,712 512 13,608 13.998July 1 to J'ne 30 382.010 373.395 50,905 42,509 11,312 7.811 168.691 161.409Des Moines Western_J'ne 1.579 4.189 109 636 1.293 737July 1 to J'ne 30_ 27.424 23.544 7.031 7,955 12,743 8.615Detroit & Mackinac_ _July 54.470 63.747 38.186 35,077 99,020 105,296 17.063 12.200 16.094 13.544 3.017 2,125 31.807 32,634Del & Tol Shore Line_July 70,939 51,363 71,169 51.530 10.358 8.262 4.051 4,304 1.436 2.009 20.793 15.854Detroit Terminal _ __ _July 7.161 6.724 1.131 956 8 41 3.409 4.406Det Tol & Ironton _ July 103.604 125.847 15,513 15,653 128,945 151,371 29,510 26,453 14,522 28.161 2.748 3.044 61.577 80.541Ann Arbor J'ne 101,086 94,067 46.751 38.444 158.086 142.927 19.620 34,201 18,331 23.813 4.546 3.877 53,055 47,757July 1 to J'ne 30_ _ _ 1,323,943 1,264.660 490.487 467.409 1,934,616 1,856,159 259,444 298,306 245.415 246,453 48,580 46,981 666.733 642.805Manistiq & L Sup_ _July 4,952 10.933 881 780 7,810 13.894 1,587 2,103 557 323 42 5 2.690 3,115Doniph Ken & Searcy July 4,518 1,796 4,523 1,769 694 364 245 194 2 43 1.542 1.171Dry Fork July 1.738 16,398 3,229 3.297 20.991 20,090 2.796 3.476 974 1.052 4,890 5.069Duluth & Iron Range_July 872.939 1,158,249 22.365 24.608 907,456 1.195.053 117,261 105,010 58,004 66,670 1,257 882 135,009 172.188Dul Missabe & Nor_ _ _July 981.400 1,936,228 43,747 43.407 1,036.292 1,989,082 107,470 97.977 73,528 108.466 2,503 1.495 143,878 227,364Duluth R L & Winn_ _J'ne 44.556 29.776 12,139 7,766 57.943 38.568 14,893 12,334 9.786 6.646 363 175 15.259 11,680July 1 to J'ne 30...— 473.951 365.531 125,620 105.739 617,286 486,560 101.724 77.794 102.598 78.886 4,304 2,793 219,042 158,514Duluth So Sh & AtI July 164,002 191.180 101.041 105.897 280,335 311,982 48.562 39.923 26.966 29.951 11.357 10.269 97.805 103.808Dunbar&Wausaukee_J'ne 1,496 1.116 1 1,496 1,118July Ito J'ne 30.... 19.810 19.099 8 23 20,318 19,622
Durham & Southern_J'neJuly 1 to J'ue 30_
20,596297,361
30.865 2,974 2,510321.009 25.987 24,107
25,220335,621
34,940357,116
4.71937,803
6.29137.050
2.89021,471
48118.782
455 4086.614 4.585
5.74867.384
5.48167.208(New fiscal year) .July 20,030 20,415 2.744 2.348 25.417 25,200 3.563 2.680 1,541 1,421 476 444 5,336 5.430Durham Transporen_July 1,641 2,767 1.958 2.967 496 669 168 188 851 540E Broad Top RR & C_J'ne 20.197 16.216 2,122 2.152 22,770 18.886 1.850 1.973 2,256 2.287 4 4,058 3.520July 1 to J'ne 30_ _ _ 217.383 206,565 28.190 26.155 250.570 237,620 20.946 21.179 28.919 27.792 94 243 45.853 43.327(New fiscal year)_July 19.314 14,212 2,744 2.493 22,481 17.160 1.982 2,035 1,999 2.441 22 18 3,885 3,314East Carolina J'ne
July 1 to J'ne 30_ _3.529
62.2172,924 627 66358,632 9,486 9.507
4.33674.986
3.82071,125
85824.885
3.36323,682
70610.990
548 15.636 170 25
84520,374
1.62023.665E Jer RR & Terminal Joe 2,116 2.183 2.300 199 454 610 454 1.095 1.063July 1 to J'ne 30.... 24,263 30.216 26,528 4,280 4.376 5,853 5,461 14,502 10,190EastJordan & South _J'ne 7.610 6,679 491 461 8.168 7.231 2.544 3.019 577 435 116 86 1,369 1.144July 1 to J'ne 30.._ 85.200 77.439 6.940 7.666 93.324 87.089 24.013 27.532 11,319 7,597 1.172 1,340 22.568 23.496EastSt L Connecting_July 36.521 33,052 5.810 4.222 3.323 4.332 244 198 14,538 15.587E Tenn & W Nor Car_July 16,270 13.594 4.732 4,265 21.609 18.537 1.920 2,794 2,121 2,310 100 99 4,365 4.292Eastern Kentucky...Jtily 2.860 2.462 1.206 1.004 4,389 3.772 2.195 1.557 561 757 12 1.552 1.255Eddystone & Del Riv_July 348 398 348 398 12 36 86 170 176El Dorado & Wesson_J'ne
July 1 to!J'ne 30_ __ _3.860
40,8724.030 489 871
37.608 5.455 5,4974,693
47,2285,171
44,076999
4.188789
3,9531,1651,601 194
20470 204
1.1346,744
1.4116.795El Paso & S W Co.. _July 416,895 467.689 81.464 84.244 527.069 584.959 64.677 84.259 87.570 70.576 12,673 11.039 152.157 165.889Morenci Southern __July 5,428 5.411 559 595 6.589 6,683 2.355 581 789 904 6 18 3,901 4,369El Paso
Southern_- __J'ne
July 1 to J'ne 30----1,883
20,9351.831
19,1711.883
20.9351.831
19,171 171.08912.608
9078.305Eldorado Mar & S/W_J'ne 663 324 987 649 27 10 443July 1 to J'ne 30_ 4.980 2.503 7.483 4,018 569 113 4,532Elgin Joliet & East. July 684.358 693.504 8 5 726,050 739.765 64.665 126,364 129.681 149,966 3,820 3.797 215.447 228.612Emporium & Rich V_July 1.792 2.101 14 21 1.981 2,257 379 274 550 877 35 487 1.045Eng & Clear Lake__ _ _July 1.016 188 16 1.204 16 237 50 24 24 380 90Erie July 2.989.090 2.780.211 923.323 928,530 4.228.559 4,004.106 520.823 439.302 725.430 671.485 86.302 123,432 1.286.330 1,272.548Chicago & Eric__ _ _July 282.236 274.187 63.834 74.169 384.919 382.980 54,270 50.878 82,431 88.968 20,033 20.645 184.942 166.760Total Company_ _July 3.271.326 3.054.398 987,157 1.002.699 4.613,478 4,387.086 575.093 490,180 807.861 760,453 106,335 144.077 1.471,272 1.439.308Bath & tlammonds.July 1,016 1.005 2.133 1.668 3.461 2.967 832 522 93 19 6 1.467 1,325New Jersey & N V_July 11.412 12.368 57.681 53,498 72.390 68.684 9.114 11,183 3.145 2.759 283 3.338 29.541 24.588N V Susq & West_ _July 161.623 144,699 57.781 63,127 245,883 234,209 32.931 28,093 24.034 25.256 1,162 4.490 87.596 85.442Wilkes-Barre ec B. .July 59.326 49,822 776 681 60.190 50.513 16.318 12.353 7,524 5.455 249 3.277 19,826 18.210Erie & MichlRy& Nav.J'ne 3.851 5.136 38 57 4.093 5.841 224 44 11,342 1.998 31 73 1,516 4.054July 1 to J'ne 30_ _ _ _ 33.936 52.198 607 778 38.172 60.529 610 336 28.909 15,847 552 570 25,372 33.658(New fiscal year)_July 4,974 6.688 88 94 5,589 7,603 17 2.198 1,264 57 63 3.020 3.543Escanaba & LakeSup July 11.657 17,862 940 1.599 17.303 28,419 7.189 13.727 2.978 2.053 3.823 5.531Fairchild & Nor East_July 960 1,357 531 512 1.670 2.080 615 1.800 103 228 651 705Ferdinand Railway_ _July 797 697 233 251 1.033 950 177 214 158 77 13 13 528 498Fernwood It (lull... _July 6,943 6.829 1.875 1.544 9.449 8.760 2.835 1.699 1.309 960 134 79 2,748 1.730For:index to roads not appearing in alphabetical order, but given under some other system, see page 31.
Digitized for FRASER http://fraser.stlouisfed.org/ Federal Reserve Bank of St. Louis

SEPT., 1911.] RAILWAY EARNINGS 9
NAME OF ROAD
TOTAL EXPENSES NET OUTSIDE OPERATIONS TAXESind. General Exp. FROM RAILROAD Gross Revenue Net Revenue Current PreviousThis Year Last Year This Year Last Year This Year Last Year This Year Last Year Year Year
FINAL NETCurrent PreviousYear Year
$
MILESend of MonthThis LastYear Year
Dansville & Mt Mor_ _J'neJuly 1 to J'ne 30_- -(New fiscal year) July
2,50133,1593,205
5,57031,3902,158
4437,142—734
—2,8655,245538
951.148
117
1031,244
117
3475.993—852
—2.9694.000421
1414
1414
Dardanelle & Russell _July 1,648 1,593 857 —85 50 50 807 —135 5 5
Dardan Ola & South_J'neJuly 1 to J'ne
1.18422,394
1,28215,096
1871,340
3984,622
2031,110
365989
—16229
323.632 15 15
Day R I & Northwest-July 5,869 5,942 —1,389 330 1.700 1,575 —3.089 —1.244 49 49
Dayton & Union J'neJuly 1 to J'ne 30_ _ _ _
9.383107,803
8.839123,555
2,85840,650
4,16539,000
7167.343
4335,656
2,14133,306
3.73233,344 47 47
Dayt Lebanon & Cin_J'neJuly 1 to J'ne 30____
5,15853,859
3.55246.231
—1.452'8,317
1.186—2,660
2863.005
2242.490
—1.7395.311
962—5.151 30 30
De Queen & Eastern July 1,876 2,857 —675 359 390 390 —1,065 —30 27 27
Deering S W Ry July 4.861 1.942 —269 113 41 —311 113 23 8
Delaware & Eastern_July 8,920 8,599 —659 —37 778 775 —1.438 —813 45 45
Delaware & Hudson_July 996.296 973.966 771,143 633,045 7.716 6,580 536 142 44,000 40,000 727,679 593.188 851 819
Cooperst'n & Ch V_July 5.675 3,351 —163 2.004 —163 ,2.004 15 23
Greenw & Johnson_July 3.910 4,361 2,070 2.956 274 400 1,796 2,556 21 31
Del Lack & Western_July 1,950,232 1,756,507 1,112.661 1,251,428 255,216 246.505 16.879 —2,108 143,500 118,500 986,041 1.130,670 930 930
Lack & Montrose_ July 2,196 2,596 666 145 45 45 621 100 10 10
Sussex July 14,433 12,627 1,974 7,399 1.338 1.333 636 6,066 30 30
Syrac Bing & N V.. _July 58,461 49,934 34,830 40,387 6,220 5,500 28,610 34.887 80 80
Delray Connecting_ _ July 9,732 9,711 —342 —449 331 348 —674 —797 15 15
Dents Run J'neJuly 1 to J'ne 30........
3976,419
3826,752
—272—2,956
—79—2,177
62194
79L11
—335—3.151
—158—2,388 6 6
Deny & Rio Grande_ July 1,390,793 1,279,087 586.821 770.637 51.582 50.467 4,621 3,136 70.000 70.000 521.443 703.774 2.555 2.553
Boca & Loyal ton_ July 7,612 8,728 4.076 6.132 600 650 3,476 5.482 48 48
Rio Orande South_ _July 32.701 35,484 12,229 19,287 2.800 2,600 9.429 16,687 179 179
Western Pacific_ _ _July 310,533 111,550 17.257 —2.866 14,350 94,334 934 ----
Denver Boulder & W_July 9,203 12,172 1,315 2.977 —18 —48 300 300 996 2.628 46 46
Deny Laramie & N W.July 7,774 7,554 492 —269 645 217 —152 —486 56 56
Denver N W & Pac_ _July 61,897 68.432 52,204 42,766 3.000 3,000 49.204 39.766 214 214
Depue & Northern_ _ July 1.457 788 388 742 15 25 373 717 0.72 0.72
Des Moines Union_ _ _J'neJuly 1 to J'ne 30_ __ _
19,193249,599
19,589246,437
11.515132,411
10,632126,958
4.47549.485
3.61441.319
7.03982,925
7.01785.638 5 6
Des Moines Western JoeJuly 1 to J'ne 30_ _ _ _
1.41720.436
1,72517.621
1616,987
2.4635.922
2082,524
1822,181
—464,463
2,2803.740 1 4
Detroit & Mackinac _ _July 70,684 63.038 28.336 42,258 5,975 3.002 2,312 671 8.541 8.624 22,107 34.305 358 360
Det & Tol Shore Line_July 38.434 32.251 32,734 19,279 3,960 3.978 28.774 15.301 78 76
Detroit Terminal _ _ _ _July 4.549 5,403 2,611 1.321 500 500 2.111 820 13 9
Det Tol & Ironton __July 114.089 144.131 14.855 7,240 160 —45 —52 7.527 6.712 7.292 476 441 441
Ann Arbor J'neJuly 1 to J'ne 30_ ___
102.7991.305,368
117.6791.298.768
55.286629,247
25,247 14,797 10,350 —2.068 —1.509557,391 158,907 170.493 —8.185 —31,041
13.300167,826
12,330147,967
39,917453,235
11.407378.383 291 291
Manistig & L Sup_ July 5,695 7.217 2,114 6.676 614 616 1.499 6.059 68 68
Doniph Ken & Searcy July 3.079 2,020 1.444 —250 78 41 1,365 —291 27 6
Dry Fork July 11.026 10,701 9,964 9.388 -..---- 305 356 9,658 9,032 30 30
Duluth & Iron Range _July 322.042 353,410 585.413 841,642 13,505 15.312 6,361 6.874 36,706 48,258 555.069 800.259 190 167
Dul Missabe & Nor_ _ July 339,977 446.708 696.314 1.542.374 13.458 16.830 8,394 12.988 45.294 80,236 659,414 1,475.125 328 293
Duluth R L & Winn_ _J'neJuly 1 to J'ne 30__
41.897445.707
32,146334.136
16,046171,578
6,422152.423
2.31725.431
1.44219,393
13.728146.147
4.979133.030 92 92
Duluth So Sh & A tl_ _July 197.138 195.49t 83.197 116.524 7.574 7.857 2,513 3.051 18,000 18.000 67.710 101,578 612 604
Dunbar&Wausaukee_J'neJuly 1 to J'ne 30_ _ _ _
83210.290
8229.882
66410,028
2969.739
74869
70822
5909.159
2268.917 13 13
Durham & Southern_J'neJuly 1 to J'ne 30_ _ _ _(New fiscal year) July
15,219149.56812.674
13,539140.60511.271
10,000186,05312.742
21.400216,51013.949
7208.3401.637
4044.842620
9.280177.71311.104
20.995211,66713,309
5858
5858
Durham TransporenJuly 1,526 1.499 431 1.167 12 12 419 1,455 21 21
E Broad Top RR 6c C.J'neJuly 1 to J'ne 30_ _ - _(New fiscal year) July
9.959117.0159,855
9.371113.2989,511
12.811133.55512,626
9.514124,3217,649
1.7375.037400
393.260300
11.073128.51712.226
9.553121.0617.349
4646
4646
East Carolina J'neJuly 1 to J'ne _
3,05865,165
6.12776,052
1.2779.820
—2.306 •—4,92768825
68825
1.2098.995
—2.375—5.752 38 38
E Jer RR & Terminal AnteJuly 1 to J'ne 30_ _
2.08827,149
2.26123,382
943,066
39 7,260 8.2631.6453,146 98.245 83.462 15.ffl 13.807
2002.250
1651.980
71516.548
1.51914,974 0.48 0.48
East Jordan & South _J'neJuly I to J'ne 30_ _
4,81260.124
4.92260.897
3.35633.200
2.30826,191
3934.722
7474.651
2,96228.478
1.56021.539 30 30
East St L Connecting_July 26,130 26,107 10,390 6.944 229 244 108 135 7.643 1,33 2.856 5.742 3 3E Tenn & W Nor Car_July 9,476 10.491 12.133 8.046 450 487 11.683 7.558 34 34
Eastern Kentucky_ _ July 4.695 4,002 —306 —229 115 110 —421 —339 36 36
Eddystone & Del Riv_July 276 315 71 82 20 21 51 61 0.70 0.72
El Dorado & Wesson_J'neJuly 1 to J'ne 30.---
3.29812.703
2,62511,545
1.39434.525
2,54632,530
47573
23276
1,34633.951
2,52332.253 10 10
El Paso & S W Co_ _ July 339.074 353.850 187.994 231,108 1.968 1.563 —1.586 —508 21,075 19.360 165.332 211.244 901 901
Morenci Southern. July 7.884 6.512 —1,295 170 253 273 —1,548 —102 17 17
El Paso Southern_- -
_J'neJuly 1 to J'ne 30_ _ _ -
1.08912,608
9078.323
7948.327
92310.848
44539
47570
7507.788
87610,278 0.44 0.44
Eldorado Mar & S W_J'neJuly 1 to J'ne 30____
1.1959.572
—208 —2.089
107847
—316 —2.936 5 --
Elgin Joliet & East_ July 428.707 521.314 297,343 218,450 16.725 15.400 280.618 203.050 831 780
Emporium & Rich V_July 1.453 2,297 528 —40 41 41 486 —81 13 13
Eng & Clear Lake_ _ July 642 164 561 —148 21 21 540 —169 10 15
Erie July
Chicago' & July
Total 'Company _ _July
2,702.182
351,4023.053.584
2.579.145335,842
2,914,987
1.526,376
33.5161,559,892
1,424.961 286.119 288.166 44.347 12,664
47.1381.472,099 286,119 288.166 44,347 12,664
86.41710,938
97.355
86.41710.93897.355
1..484,303, 22.578
1;506.884
1,351.208
36,199,
1,387.407
1,995
2692.264
1,959,,269
2,228
Bath & Hammonds.July 2,413 1.871 1.047 1.095 142 142 • 905 953 10 10
New Jersey & N Y_July 42,945 44.332 29.444 24.352 1,250 1.250 28,194 23.102 47 47
N V Susq & West_ July 149.631 147,763 96.252 86.445 11.272 10,081 1.744 —5,222 11.733 11.316 86.264 69.906 152 152
Wilkes-Barre & E July 44,698 40,267 15.491 10.246 416 425 15.074 9,821 92 90Erie & Mich Ry& Nav.J'ne
July 1 to J'ne 30_ _ _ _(New fiscal year) .July
10,02762.05.874
6.98960,1995.664
—5,933—24.367
—285
—1,148329
1,939
2832.375197
1812.269190
—6.21;—26,742
—483
—1.329—1.939
1.74988
88
Escanaba & LakeSup.July 16.458 23,877 845 4.541 1,100 1.220 —254 3.321 127 127
Fairchild & Nor East_July 1,610 2.938 59 —857 107 107 —47 963 38 38
Ferdinand Railway_ July 957 805 76 145 27 61 48 84 7
Fernwood ec Gulf. _ _ July 9.650 6,958 —201 1.802 128 131 —329 1.670 31 31
For index to roads not appearing in alphabetical order, but given under some other system, see page 31,
Digitized for FRASER http://fraser.stlouisfed.org/ Federal Reserve Bank of St. Louis

10 RAILWAY EARNINGS [Vol, Lxxxxiii
NAME OF ROAD This
FREIGHT 6c PASSENGER EARNINGS TOTAL EARNINGS MAINTENANCE EXPENSES TRAFFIC & TRANSPORTAT'N EXP'SFREIGHT PASSENGER incl. Other Revenue Way & Structure Equipment TRAFFIC TRANSPORTAT'NYear Last Year This Year Last Year This Year Last Year This Year Last Year This Year Last Year ThisY'r LastY'r This Year Last Year$ $ $ $ $ $ $ $ $ $ $ $ $ $Fitzgerald Oc & Brox _J'ne
July I to J'ne 30 _ - --978
26,0912.15933,260
3338203
87611.346
1,36235,540
3.27247,187
2.67322.355
8329,363
2286,098
3885,264
6746
1181.426
57919.876
2,04923,976
Flint River & N E_ _ _ _July 2.350 3,706 668 618 3.156 4,233 1.133 949 67 543 76 167 589 615Florida July 1,913 1,724 1.939 1.334 4,739 3,611 2,901 925 267 582 131 167 1,600 1:333029Florida Central July 4,836 7.888 370 640 5,382 8.648 1,816 784 251 156 216 258 907
1
Florida East Coast__ _July 116.965 114.005 82.274 67,355 228.685 213.829 50.027 42.306 50.731 41.799 3.754 5.040 93.485 91.427Fonda Johns & Glov_July 19,558 19,272 71,579 70,562 95,746 93,880 8,528 6.414 3,465 3,706 1,987 1.360 22,899 23,124Fordyce Sc Princeton_J'ne 3,093 1,135 3.120 1.135 2,272 595 478 440 2
71g311July I to J'ne 30_-_- 32.851 29.980 33,172 29.980 8,298 9.994 5.543 7,198 32 6 6.9
9Ft Smith &Western_ July 27.710 32.229 18.541 17.678 49,547 52.960 13.215 12,710 11.380 11.935 1.349 1.146 16.515 17; 81'4643
St I El Reno & W_JulY 3.039 7.164 788 1.369 4,265 9.035 1.613 2,279 296 360 125 186 2.066 2.313FourcheRiv Val & I T.J'ne
July 1 to J'ne 30._ _ _4.82760.848
4.68768.436
951.163
1131.043
4.92862.110
4,81569,555
9819.433
8897.796
2753.700
1.1315.246
1 68 32 11. E, 12.684
1.309
Franklin & Abbeville_July 2,718 2,361 534 433 3,223 2,908 1,910 741 331 1,261 329 302 1,690 1,761Freco Valley July 2.334 3.100 2,334 3.100 751 757 229 473 25 --- 415 655Gainesville Midland_ _July 5.940 4,810 4.048 3.920 10.652 9.214 2.036 1.628 1.561 1.239 398 201 4.276 4.467Galesb & Great East_July 748 558 263 220 1,011 778 98 321 1.018 9 323 441Galv Beaum & N EJ'ne 905 1.589 905 1,589 104 104 122 110 50 50 927 1,097July 1 to J'ne :to.... 14,898 13.233 14.898 • 13.233 1,254 1,254 1,127 1.482 600 675 13.014 10,201Galv Hous & Hender_July 10.796 12.185 19,618 17,820 32.947 32.951 3.983 4,164 2.390 2.544 1.199 1.326 14,241 11.224Galveston Wharf Co_July 7.836 6.929 8,340 7,169 1,967 1.064 983 363 4.378 3,644Genesee & Wyoming_July 12,047 11,431 76 59 12.145 11.498 923 1.174 827 373 151 353 1.591 1,544Georges Valley July 408 615 199 219 712 1.003 182 258 35 2 418 462Georgetown & West.July 17,006 14,433 3.575 3.472 21,719 19.320 4.842 5.543 6,048 4,272 166 202 7.530 6.602Georgia July 132.592 128,872 78,846 76,150 227.202 218.542 27.253 41.455 39.772 41.461 11,037 9.996 102.182 92.514Georgia & Florida.. .July 36,346 21,047 26.359 20.528 65.933 43.634 8,822 6,450 6,788 9,308 3,053 2,690 27,387 20,288Oa Coast & Piedmont.J'ne
July 1 to Joe 30_ _ _ _4,411
60.5794.578
53.8891,750
24.7242.125
24.7347.324
91.4697,510
• 84.640954
19.0431.582
21.5561.025
11,145833
11.379230
2,146163
1.7312.848
31.7612.289
30.267Georgia Fla & Ala,.. July 24.675 17.686 16,930 15.160 44.741 35,737 5.697 6.393 5.416 5.695 1,206 1,102 17,013 12,262Georgia Northern_ _ _ _July 11,901 11.180 6.593 5,261 19.711 17.601 2.995 3.359 1.561 1.566 550 494 3,819 3,233Georgia South & Fla_JulY 92,195 103.110 73.577 65.373 191.400 191.990 20.285 20.190 35,937 40.427 6.469 5.997 76,372 76,840Georgia S NV & Gulf _ _July 4.704 3,386 3.363 3,025 8.505 6,892 983 1,040 589 796 314 204 3.030 3,093Gideon & No Island_ _July 4.760 4.4054.760 4,495 638 694 171 340 158 80 2,349 713Gould Sou Western. .J'ne 1,542 3.266 145219 1,761 3,486 401 644 2 26 670 599July 1 to J'ne 30_ _ _ _ 24.185 34.692 2.807 2,715 27.456 37.598 6.582 6,684 2,172 2.280 467 10.291 10,560Graf ton & Upton_ _ _ _July 6,465 7.800 1,225 1,241 7,690 9.332 3.229 1.574 47 139 2,401 2.752Grand Rapids & Ind_July 198.474 231.561 193,271 183.725 426.534 448.106 44,530 72.304 62,205 70,271 11,923 15,494 175,430 195.554Grand Tr of Can in U 5—
Atkin & St Lawr...July 59,754 44.010 32,738 28,504 103,912 81.496 32.989 20,401 21,977 23,901 4.455 4,864 45,227 40.790Central Vermont_ _ _J'ne 243.447 220.078 94.908 90,271 379,606 330,532 39.822 41.969 56.339 72,304 8.017 10.197 119,916 108,296July 1 to J'ne 30____ 2.654.911 2,513.000 1.045.301 1,022,275 4.006,433 3,800.957 453.504 431.651 606.518 697,288 86.253 101.144 1.777.085 1.545,312(New fiscal year)_July 214,361 153,189 108.905 99,529 351,987 274.328 41.386 44,157 44,452 40.267 7.109 7.614 153.375 112,586Champ! & St Lawr_July 606 243 272 246 937 686 55 7 127 2,048 55 36 1.225 899Ch Det &Can OrTr_July 30,543 15.081 21.950 19.007 64.585 43.163 23,228 10,406 15.197 8.450 2,005 2,015 29.857 27,017Cin Sag & Mack_ __July 11,258 6,376 6,293 3,751 19,099 11.248 3,901 3,777 3,747 2,316 1.225 722 11.353 7.772Det Ur VI & Milw__July 93.391 41.202 63,881 57.698 179.320 121.486 23.426 16,150 26.670 15,640 7,163 6.835 79,197 74,414Grand Trunk West_July 299,512 190,194 222.492 196.148 560,254 420,516 66.292 34.616 83,141 71,600 20,369 19.955 215.087 175.804Lewiston & Aub_ _ _July 574 502 1.161 1,134 1.886 1.755 484 372 290 2,099 160 180 1,602 2.768Michigan Air Line_July 7.655 4,333 3.978 3.011 13.183 8,769 4.762 4,093 4,573 2,258 1.074 1.058 7.805 5,777Pontiac Oxf & Nor_July 6,717 5,059 7.533 5,472 16,698 12.286 7,611 5.199 3,406 2,300 1.052 1,102 7,471 5,641St Clair Tunnel _ _ _ _July 24,064 17,176 711 4.813 1.044 1.408 4.785 4.750Tol Sag & Musk. _ _July 6.714 3.100 4,223 3.263 12.028 7.599 11.792 3.617 2.035 830 781 674 6,303 5,885U S & Canada July 2.980 2,608 471 447 3.711 3.303 987 257 1,530 4.207 299 184 1.013 1.174
Granite Cy & E St L_ _July 2,301 6,829 259 767 641 745 104 104 1.181 3.134Great Northern July 3,953,819 4,066,480 1,410,258 1,387.474 5,745.918 5.792.461 960,420 1,342.232 641,009 659.154 89,780 86.336 1.418.306 1.511,541Farmers Or & Ship_July 2,446 2.403 2,287 1,687 5.554 4.821 2,563 1.150 369 255 33 26 2.310 2,086Minneapolis West_July 3,469 3.181 337 630 212 163 1,548 1.613
Great Southern J'ne 1,849 5,013 972 2.194 3.132 7,437 470 315 264 32 104 97 971 1,544July 1 to J'ne 30... - 42,557 62.884 15.409 26,248 61.526 92.538 6.121 7,238 4.106 3,607 1.110 1.044 13.998 13,453Green Bay & West _ _ _July 25.223 25,326 16.458 17.121 46.248 47.964 14.673 11.594 7.353 5.509 407 349 16,391 15.948
Ahnapee & West July 3,028 3,347 5.669 4.260 9.584 8.501 2.063 2.150 817 498 75 100 2.343 2.134Iola & Northern_ _ _Jttly 104 310 201 137 351 503 34 45 112 28 553 360Kcwaun Or II & W_July 7.360 6,980 3,918 3.861 12,116 11.829 250 735 1,976 2,156 75 105 3.397 2.044
Greenville & Knoxv__J'ne 1.100713 1.173 693 2.354 1.500 819 252 570 40 • 196 2.355 751July I to J'ne 30_ _ _ _ 13.122 11,209 12.386 9.758 26.691 22,965 8.715 4.735 1.072 1.080 108 337 13.045 10.820Griffin Mag & W July 497 254 2,049 1,916 1,356 1.032 570 237 792 687Grove Lufkin & Nor_ _July 1,836 3,734 945 1.246 3,050 5,239 1.928 851 546 346 67 118 1.087 1.324Gulf & Sabine River_ _J'ne 36.701 16.924 450 404 34.796 15,481 2.135 1,755 7,371 4,099 28 84
1403,0073M6
2.780July 1 to J'ne 30____fiscal year) _July
140,1593,494
110,9414,707
5,249399
3,809429
145,2294.687
113.4465.'362
20,3352.902
18.4481.339
44,0053,341
22.1681.973
1404
4 Ill(
New
Gulf & Ship Island.. _July 106.924 105,274 39,224 36,191 156,501 151,726 23.446 19.979 33.150 25,696 1.570 2,324 44,585 46.419Gulf Line Railway_ _ _J'ne 6,962 6.008 3.023 2,550 10.364 8.951 2,480 1.886 203 2.051 655 663 3.947 3,295July I to J'ne 30_ __- 103,341 119.781 39.680 38.911 149.388 163.674 27,849 23.890 11,200 16,266 8,589 4.676 48.942 49,731Gulf Texas & West_ _J'ne 2,186 2.757 1.851 2.180 4.571 5,165 1.994 1.399 1.430 368 530 221 3,785 2,310July 1 to J'ne 30____ 55,443 33.147 24.534 10,874 85,287 44.816 26.523 12.526 7.989 4,360 5.405 1.4477 45:489185 525319:70Hampshire Sou thern_J'ne 4.291 2,081 1.946 666 6.590 2.896 1,826 2,454 1.021 137 50
5 2 2
July 1 to J'ne 30_ _ __ 39.701 3,657 14.024 1.715 56,994 5.527 25.300 4,380 6.437 173 471 222 21,575 3,972(New fiscal year)_July 3.672 2.526 1,554 1,267 5.590 3.956 1.940 2.814 436 361 22 31 1,804 1,326Hampton & Branchv_J'ne 1.528 936 122 79 1.650 1.015 480 104 86 374 381July 1 to J'ne 30.... 21.990 21.896 1,466 1.438 23.456 23.335 6.317
4.8445
2,128171 5.390 4.734Hannibal Connecting_July 5,999 6.901 8.544 10.383 383 873 69404 66 431 2.297 3,471Hayne & Montgom___J'ne 226 270 303 338 569 659 162 156 55 73 397 30,3July 1 to J'ne 30___- 5.677 4.986 5,132 4.695 11.456 10.291 3.346 2,871 733 617 39 5,024 4.57,'(New fiscal year)_July 250 312 437 329 740 683 128 203 62 22 362 38'Hazelhurst & Sou E_ _July3.763 2,721 24 13 3.788 2.735 126 165 148 257 9 20 910 984Hillsboro & N E July 730 720 357 366 1.185 1.197 186 3023 4,073 3 659 343Hocking Valley July 476.028 521.035 85,800 83,785 604.457 660.192 103,061 74.612 93,330 103,439 8.269 0,053 171.727 204,627Holton-Interurban July 1.649 1,543 1.150 1.279 3.264 3.097 168 193 353 346 15 1.818 1.174Hoosac Tun & Wilm_July 5,822 4,403 2,180 2.324 8.522 7.169 1.130 1,019 750 835 2,395 1.995tfooverhurst & S W_ _July 2.351 2,143 2.351 2.143 930 378 148 157 711 495tious & Brazos Vall__J'ne 955 559 380 324 1.643 1.105 367 654 252 189 15 30 675 698July 1 to J'ne 30____ 11.592 8.474 3.982 4.282 19.705 15,516 8.249 9.421 2.728 1,313 244 411 8.909 7,683Hous & Texas Cent. July 314,041 315.491 160,392 143.059 509,493 493.132 93.948 68,964 64.284 61,781 18.974 17,359 202,382 207.678
For index to roads not appearing in alphabetical order, but given under some other system, see page 31,
Digitized for FRASER http://fraser.stlouisfed.org/ Federal Reserve Bank of St. Louis

SEPT., 1911.] RAILWAY EARNINGS 11
TOTAL EXPENSES NET OUTSIDE OPERATIONSincl. General Exp. FROM RAILROAD Gross Revenue Net Revenue
NAME OF ROAD This Year Last Year This Year Last Year This Year Last Year This Year Last Year
$ $ $ $ $ $ $ $
Fitzgerald Oc & Brox _J'ne 3,513 3,997 -2,151 -724July 1 to Yoe 30_-_- 52,793 47 ,513 -17.330 -326
Flint River 6c N E_ _ _ _July 2.055 2,785 1.100 1.448Florida July 5,437 3.451 -698 159Florida Central July 3,427 2,819 1,954 5,828Florida East Coast_ _ _July 206.243 190,659 22,442 23.170Fonda Johns & Glov-JulY 42,392 40.142 53,354 53,737 12,467 12.689 2,621 2.936
Fordyce & Princeton_J'ne 4,737 1.450 -1.616 -314July 1 to J'ne 30_ _ _ _ 23.451 28.185 9.720 1,794
Ft Smith & Western_July 45.462 45.961 4,084 6,999 524 85 124 28
St L El Reno & W _July 4.651 5.665 -386 3.370FourcheRiv Val & I T-J'ne 2,676 4,012 2.251 803
July 1 to JJoe 30-- -- 30,956 30,454 31,153 39.101
Franklin & Abbeville_July 4,478 4,238 --1,255 --1,329
Freeo Valley July 253 1.2142,081 1,886Gainesville Midland_ _July 9.355 8,979 1,296 234
Galesb & Great East_July 897 -504 -1181,516
Galv Beaum & N E J'ne 1,279 1,437 -373 152July 1 to J'ne 30_ _ _ _ 16.895 14,373 -1,997 -1,140
Galv Hous & liender_July 23.198 20,564 9,749 12,387Galveston Wharf Co_July 7.848 5,196491 1,972Genesee & Wyoming_July 4.373 4,134 7.772 7,363Georges Valley July 716 783 -3 220Georgetown & West_JulY 19.772 17,485 1,946 1.835Georgia July 187,311 191.838 39,891 26.704Georgia & Florida_ _ _July 50,844 42.763 15,089 870Gs Coast & Piedmont.J'ne 5,650 5.332 1,674 2.178
July 1 to J'ne 30_ _ _ _ 70.874 71,252 20.594 13,388Georgia Fla & Ala.._ _July 33,967 29,568 10.774 6.168 2,195 2.153 --468 593Georgia Northern_ _ _ _July 11,500 11,856 8,210 5.744Georgia South & Fla July 147,707 152,067 43,693 39,923Georgia S W & Gulf July 5,647 5.719 2,857 1,172Gideon & No Island_ _July 3,587 1,916 1,172 2.488Gould Sou Western ._J'ne 1,130 1,620 630 1,865 9 9
July 1 to J'ne 30____ 21,070 20,643 6.386 16.955 37 -6
Graf ton & Upton.. _ _ _July 6,046 4.856 1.644 4,475
Grand Rapids & Ind_July 308,427 367,799 118.107 80.306 3,373 3.347 --913 --1,048
Grand Tr of Can in U 5-Allan & St Lawr_ _July 107.523 93.255 -3.711 -11,759
Central Vermont_ _ _J'ne 232.047 240,206 147,558 90,325 2,116 2,143 755 1.074July 1 to J'ne 30_ __ _ 3,027,672 2,862,128 978,761 938.828 21,012 23,163 6.611 9.068(New fiscal year) _July 254,298 211,530 97,689 62,798 2,464 2,464 754 1.200
Champl & St Lawr_July 1,515 3.030 -578 -2,344
Ch Pet & Can OrTr-July. 71,614 49.373 -7,029 -6.210
an Sag & Mack_ July 20.996 15,072 --1,897 --3,824
Pet Or ll & Milw _ _July 140.547 117.179 38,772 4.307 961 459 -38 30
Grand Trunk West_July 397,213 313.992 163.041 106,524 8,307 7,501 -276 --509
Lewiston & Aub July 2.641 5,538 -754 -3,782
Michigan Air Line_July 18.903 13,917 -5,720 -5.147Pontiac Oxf & Nor_July 20,024 14.751 -3.325 ' -2,464
St Clair Tunnel_ _ _ _July 6,542 10,972 17,522 6,203
Tol Sag & Musk_ July 21,428 11,509 -9,399 -3.914
U S & Canada July 4,938 5,940 --1,226 -2,637
Granite Cy & E St L_ _July 2,465 5,057 -163 1,772
Great Northern July 3.205.738 3.698,485 2,540.179 2,093,976 104.850 116,859 14.365 26,616
Farmers Or & Ship_July 5.616 3.856 -62 964
Minneapolis West_July 2.123 2,432 1,346 749
Great Southern Yoe 2,116 2.577 1,015 4,860July 1 to J'ne 30- 28,735 29.055 32,790 63,482-
Green Bay & West. July 40.316 34,843 5,932 13,121
Ai-mance & West_ _July 5,583 5,118 4,000 3.385
Iola & Northern_ _ _July 735 434 -383 68
Kewaun Or B & W_July 6,252 6,458 5,864 5.370
Greenville & Knoxv__J'ne 4,137 1,409 -1.733 4,1908 1July 1 to J'ne 30. _ __ 24,758 18,857 1.933
Griffin Mag 6c W_ _ _ _July 2,925 2.239 -875 -323
Grove Lufkin & Nor_ _July 4.085 3,133 -1.035 2,106
Gulf & Sabine River_ _J'ne 15.361 11,195 19,434 4,286July 1 to J'ne 30...._ 110,859 76,374 34.370 37.072(New fiscal year) _July 9,666 5,639 --4.978 223
Gulf& Ship Island July 110.128 102.986 46,373 48,739
Gulf Line Railway_ . _J'ne 8.514 8,750 1.850 201
July 1 to J'no 34)____ 109,253 113.430 40,135 50,243
Gulf Texas & West_ _J'ne 8,535 5,330 -3.964 -164July 1 to Joe 30_ . 96.456 42.932 -11,169 1,883
Hampshire Southern_J'ne '
6.037 5,402 553 --2,505July 1 to J'ne 30- ,-62.680 9,339 -5,685 -3,811(New fiscal year) July 4.936 4.909 653 -952
Hampton & Branchv_J'ne 1,121 683 529 332July 1 to J'ne 30_--- 13.140 12.387 10,316 10.948
Hannibal Connecting_July 3,719 5.713 4,824 4,670
Hayne 6c Montgom_ _J'ne 615 537 --46 122July 1 to J'ne 3-0_ ..... 9,104 8.124 2,352 2.166(New fiscal year)_July 553 615 187 67
Hazelhurst & Sou E. _July 1,194 1.429 2,593 1,305
Hillsboro 6c N E July 978 4,815 206 --3,6I8
Hocking Valley July 391,365 404,020 213,092 256.171
Holton-Interurban July 2,806 2,169 457 928
Hoosac Tun & Wilm_July 5.106 4,765 3,415 2,404
Hooverhurst & S W July 2,103 1,303 248 840
Hous & Brazos Vail.. _J'ne 1.436 1,726 207 -620July 1 to J'ne 30____ 22.149 20,689 -2.444 5.172
H 1.705 ous & Texas Cent- _July 401,066 376,926 108.426 116.206 -1.458
TAXESCurrent PreviousYear Year$ $
100 2006.652 2, 200
77 70
297 297
240 240
15.500 13.731
3.333 3.416
176637
36502
4,500 4.700
70065° 23071. 91 153
946233 133
80 87
400 40065 65
6 680 80
2.800 2.700
1.284 1,254
230 240
11 7
500 3752,100 2,183
3.112 1,700
354 3544.249 4.249
2.000 1.560
556 540
9,407 8.598
380350
99 811.036 599
45 43
23.010 24,748
6,658 8.452
13,596 10.110138,213 121.39311.750 10,116
36 38
2.647 2.661
1.045 1.315
2.879 3.009
31.635 31,697
268 253
859 871
440 1.320
2.452 2.415
945 949
271 297
178 138
299.674 319,050
833 635
138 127
278 1692.893 2,441
2,119 2,086
237 220
12 12
475 450
65 65784 784
43 43
150 150
7575
5.037 5,074
410 6906.803 6.760
4644.973 250
2418014 14
39 39459 469
107 59
18 827217 33
33 18
32 28
16 15
40.415 27,900
208 138
171 130
50 46
cr9a381 Cr81901
17.833 17.079
FINAL NETCurrent PreviousYear Year$ $
-2,251 -924-23.983 -2.526
1,023 1,378
-995 -138
1,714 5,588
6,942 9.438
52.641 53,257
-1,792 -3519.083 1,292
-291 2,327
-1.036 2,670
2.131 64929,216 38,154
-1,488 -1.462
173 1.127
896 --165
-569 -183
-380 145-2,077 -1,220
6.949 9,687
-792 717
7,542 7.123
-15 212
1,446 1.460
37.791 24,521
11.976 -829
1.319 1.82316.344 9.138
9.243 4.014
7.654 5,20434,286 31,325
2.477 822
1,172 2.488
531 1.7935. 349 16,349
1,599 4.432
94,183 54.501
-10,370 -120,211
134.717 81.289847,159 826.50386.693 53.882
--614 --2,382
-9,676 -8,871
-2,942 -5,139
35,854 1.328
131,129 74,317
--1,022 -4.036
-6.579 -6,019
-3,766 -3,785
15.070 3,788
-10,345 -4,863
-1.497 -2,935
-342 1,634
2.254,870 1,801,542
-895 329
1,207 621
73729,897 61:049?
3.812 11.034
3.763 3.165
-395 55
5.388 4,920
-1.848 251.148 3,324
-919 -367
-191:318559 41:9 56
34,295 37,072-4,978 223
41,336 43,665
1.439 48933,331 43,483
-4,428 -164-16.142 1.633
529 -5,865
639 966
490
-7-1.:
9.856 10,478
4,717 4,610
-84 90
2,134 1,829153 49
2,561 1,277
189 -3.634
172,677 228.271
249 789
3,244 2.273
198 794
125 --702-3.427 6.073
89,134 99.126
MILESend of MonthThis LastYear Year
23 40
23 23
58 58
47 47
583 583
86 86
22 22
221 221
42 42
14 14
51 51
22 22
74 74
10 10
17 17
50 50
11 11
16 16
8 8
101 101
307 307
351 326
84 84
192 186
68 68395 395
35 35
21 21
25 25
19 19
587 587
166 166
111 111
1 1
60 60
52 52
190 190
347 335
5 5
105 105
100 100
2 2
116 116
22 22
6 6
7,344 7,274
66 66
2 2
30 30
225 225
34 34
4 4
36 36
23 2251
25
36 36
32 2633 26
307 307
77 77
74 74
3388 3825
26 26
' 6 6
9 99 9
24 24
5 5
351 650
18 10
25 25
6 6
20 20789 789
For index to roads not appearing in alphabetical order, but given under some other system, see page 31,
Digitized for FRASER http://fraser.stlouisfed.org/ Federal Reserve Bank of St. Louis

12 RAILWAY EARNINGS [VOL. LXXXMII
FREIGHT & PASSENGER EARNINGSFREIGHT PASSENGER
NAME OF ROAD This Year Last Year This Year Last Year
Hunt & Bd Top Mtn_ _July 34,123 33.735 5,993 6,943Idaho & Wash North_July 37,935 58,791 18,274 24,923Idaho Northern Ltd....J'ne 3.120 6,343 3,230 3.454
July 1 to J'ne 30_ _ _ _ 56.216 60.283 34.602 38.608Idaho Southern July 1,151 2,591 987 1,697Illinois Central July 3.258,881 2.963,368 1,178,577 1.093.984Omaha B'd'g & Ter.J'neJuly 1 to J'ne 30
Yazoo & Miss Vall_July 467,455 436,391 209.676 187,701Illinois Northern J'ne
July 1 to J'ne 30_(New fiscal year) July
Illinois Southern J'ne 33,675 40,269 4.579 3,841July 1 to J'ne 30...409.450 301.464 53.700 52,442(New fiscal year)_July 36,871 41,351 4,780 4,816
Illinois Terminal July 15,785 13.318 374 350Indiana Northern_ _ _ _J'ne
July 1 to J'ne 30_ _--(New fiscal year) .July
Internat & G t Nor th_July 353,953 466,180 197,244 175,194
Inter-State July 5.067 5.163 1.889 1,870Iowa Central July 190.601 180,044 51,706 50,037Ironton July 23.331 33.518 191 394Ivoryd & Millcrk Val _July 5.043
Jamest Chau & L 13. J'ne 7,375 7,673 1.720 1.464July 1 to J'ne 30____ 78,289 73,862 16,251 17,879(New fiscal year) July 9,021 6,740 2.299 1.956
Jefferson & No West_July 1,122 2.739 13Jonesboro Lake Cy&EJ'ne 5,636 8,247 4.700 4,867
July 1 to J'ne 30_ _ _ _ 100.418 102,863 63.080 61.644Kan Glen Jean & E_ _July 5.089 2.613 1,207 584Kanona & Prattsbgh_J'ne 709 617 406 498
July 1 to J'ne 30_ _ _ _ 14,585 10.209 5,431 5,193(New fiscal year)_July 468 515 383 304
K C Clin & Springf _ _July 20,393 16.805 11.095 10.963Kan City Mex & Or _J'ne 90,922 98.119 27.578 35.524
July 1 to J'ne 30_--- 1,328,193 1.259.605 410.633 410.189Kansas City Sou th _ _ _July 517.709 612.717 146,415 142,326Arkansas Western _July 1,395 2,046 1.471 1,369
Kansas City Term_ July •
Kansas Southwest _ _ _J'ne 1,951 2,542 787 1.152July 1 to J'ne 30__-- 30,658 45,958 10.497 13,361
Kelleys Creek & N W_J'ne 1.558 1.641 9 9July 1 to J'ne 30____ 18,543 16.589 256 63
Kentucky & Tenn_ _ _J'ne 17,690 16.288 312 253July 1 to J'ne 30.--. 110.896 87.666 3,708 2,616
Kentucky Highlands..July 3.876 2,010 684 401Kentucky Midland_ _ _July 547 199 67Kentwood & Eastern_July 16.404 16.963 1.177 1.648Kentwood Orb 6c SW July 6.195 8.288 141 374Keokuk & Ham Bdge.July
Keweenaw Central_July 1.119 951 3.877 5.108Kinder Ec Nor West_ _J'ne 984 98
Mch 1 to J'ne 30_ _ 7.668 246(New fiscal year)_July 226 79
Kinston 6, Snow Hill_July 491 464 466 342Kishacoquillas Vali _ _J'ne 616 626 561 492
July 1 to J'ne 30_ 8.449 8.722 6,377 • . 5,868Kittanning Run RR_ _July 333 459Klamath Lake J'ne 5,550 4,777 228 238
July 1 to J'ne 30-_-- 29,117 22.274 1.770 1.908Knoxv Seviev & E'n_July 1,863 1.280 2,444 1,986
La Crosse & S E J'ne 2,578 1,618 3,608 3,687July I to J'ne 30-_ 28.844 28.431 41.268 39,743
La Salle & Bureau Co_July
Lacka & Wyom Vall_July 5,645 5.448 48.874 50.462L Champlain & Mot._ _July 12,882 18.489 106 81LCharlesRy& Nav _July 1.505 2.477 . 'Lake Erie & Ft W J'ne
July 1 to J'ne 30_
Lake Erie & Western_JulY 333.745 307.423 95.072 92.043Lake Shore & Mich S_July 2.421,145 2.469.459 1.181.929 1,111.229L Superior & Ishpem..July 14.167 31.051 1,056 592LakeTahoe Ry& Nav_J'ne 2,061 1,912 6,581 7.367
July I to J'ne 30-_-- 8.194 16.036 30,654 30.322Lakeside & Marbleh_ _July 8,642 8.474 148 138Lancaster & Chester_July 3.179 3,130 1.780 1.575Lanc Oxford & Sou. .July 1,080 972 1,226 1.346L'Anguille River_,_ _July 364 795Lara Hahn's Pk & P_July 6,848 3.487 2.907 2.619Las Vegas & Tonop_ _July 7.321 6.756 3,611 2,918Laurel Railway July 3,392 6.673 524 574Lawndale Ry & Ind- _July 754 610 250 160Lawrenceville Br'ch J'ne 176 178 225 133
July 1 to J'ne 30---- 5.849 6,274 1.906 2.064Leavenworth & Top_ _J'ne 1,953 1,900 986 1,186
July 1 to J'ne 30.... 25,635 23.763 13.691 14.313Leetonia July 2.195 491Lehigh & Hud River_July 91.130 3.860 3,985Lehigh & New Eng July
16505:220601
84.171 1.010 1.310Lehigh Valley J'ne 3.117.700 2.736.800 456.290 416,932
July 1 to J'ne 30W.31,842,825 30,579,596 4.548,029 4,330.172(New fiscal year)_July 2,472.447 2.276.894 512.862 493.757
Lexington & Eastern_July 29.611 27.778 15.212 11.271Liberty-White July 6.968 6.252 1,570 1,805Licking River J'ne 936 1.641 150 108
July 1 to J'ne 30 - - 16.963 16.803 2,201 1,773
TOTAL EARNINGSincl. Other RevenueThis Year Last Year$ $
41,823 42,07657.874 85.229
7.017 10.81598.504 108,489
2,456 4,483
5,090.538 4.677.441
17.843 12,925177.582 159,095730.559 671,02529,029 26,444259.685 269,53921.096 22,19839.277 46.052
481.242 373,89143.082 47.63416,438 14.576
962 1,41822,201 20.0851,098 1.011
596,580 692.3797,318 7,532
256,135 242,89023.522 33,913
4,971 5,043
9.690 12,378102.246 99.13012.019 9,305
1.135 2.73911.422 14,304177,859 178,674
6,465 3,391
1.443 1,35023,357 18,0431,048 1,081
35,351 31,828
127,427 141,5181,848.479 1.747.940
751,089 837,977
3,164 3.722
27.935 28,550
3.302 4.38547,433 66,5541,568 1.65118.799 16.65218.155 16.584
117.037 94.052
4.590 2,411752 73
17.971 19,0856,389 8,715
5,867 3.608
5.155 6,235
1.0827.974353
1.011 864
1.255 1.19915.844 15.456
348 4745.951 5.24132.437 26,3454.514 3.7966,322 5,522
73.463 72,0981,364 1.584
55.893 57,532
15,349 21.5711,505 2,4771,292 1.150
13.868 15.482453.932 426.378
4.121.042 4.029.89215.702 32,8758.877 9.53040.904 48.663
8,867 8,702
5.248 4.9532.410 2,426
364 795
10.064 6.531
12.011 10.948
3.927 7,3081.040 805439 348
8,200 8.783
3,971 4.06354,818 54,921
2.401 505
111,122 96,672
67,181 86.860
3,687,671 3,252,34637.697,402 36.167,3983,091,656 2.876,217
47.414 40.9858.542 8.0611.168 1.75019.713 18.578
MAINTENANCE EXPENSES T RAFFIC & TRANSPORTAT'N EXP'SWay & Structure Equipment TRAFFIC TRANSPORTArNThis Year Last Year This Year Last Year ThisY'r LastY'r This Year Last Year
6.767 6.014 5,763 4,482 560 287 10.775 12,2057,914 9.242 7.235 8,983 2.064 2,205 24,724 23,8675.284 1.965 317 1.616 97 128 1,782 4,13729,240 16,124 8.085 8.197 917 1,089 24,671 29.963
276 431 534 466 180 210 1,543 2,018781.216 761,986 1.098,333 1,012.757 122,801 120,564 1.828.664 1.537.022
164,053 177,238 112,586 127,612 15,181 13,892 262.877 242,0693.967 1.121 2.928 1,828 264 211 16,316 14.17316.007 13,334 30,452 • 25.337 2,401 2.440 140.056 127.7981,069 1,694 2.209 1.924 188 186 10.792 10,33810,783 4,278 6,926 4.834 1.420 1.237 15.358 12,889106,085 79,316 76.691 53,051 14,475 9,626 180,749 128.9716,068 9.087 5,928 5.353 1.451 969 15,604 13.6925,997 2,018 2.400 2.208 655 296 4,128 3,986
82 296 26 25 649 9271,808 2.585 543 6.810 9.652 6.9839 22 178 426 612
106,610 151.851 97.060 111,507 17,588 18,648 294,235 281,954820 885 1,319 1.559 8 2.948 3.120
37.235 36.158 49.223 48,341 7,100 7,309 109.837 106.7192,041 2.908 2,584 2,710 264 263 6,797 9.109604 899 451 303 62 1,500 4.278
2.188 1.626 820 2,550 154 609 6.466 9.06420,692 21.791 8,725 15,192 2,121 1,444 67,110 71,1031.883 1,783 487 614 73 456 6.634 5,806462 841 554 433 5 322 371
3,588 2.192 3,518 2.602 365 278 3,849 64823.702 25.833 22.107 21,295 3,979 3.514 58,977 55.9911.435 852 473 379 1,704 927543 381 57 193 961 1.1215.039 7.275 584 1,245 8,893 8.909925 899 224 38 927 790
9.788 5,398 1.227 2.654 537 345 9,429 12.79625.980 41.474 36.368 22.568 8.891 6.763 72,734 84.472377.804 385.452 395,812 285,096 96,283 65,459 879.726 813,43877,355 88,493 108.634 114,228 27,430 23,984 276,379 287,11
838 998 1 45 45 1.287 1.4823,236 3.950 5,290 9.290 17,368 16.0761,503 2,234 948 276 90 184 1,477 1.63316.610 22.866 4.987 4.763 1,171 1,475 20.064 22.163321 505 69 144 1.003 9694.873 3.579 1.204 1.670 20 2,546 12,060 7,943
2,094 1,558 1,334 5.226 5,515 1,38020.799 12,698 18.861 19,777 607 21,739 7.942444 159 199 114 1.353 788725 204 34 223 67
3.918 3.263 3.320 2.830 41 4,232 5.304885 1,315 1.257 1,054 25 1,986 2.480126 248 769 306 219 228 225 524 2.791 2,757494 183 153 442
2,592 413 278 2.291233 43 25 241646 313 83 39 8 6 731 896472 426 71 22 458 284
6.176 5.730 508 464 38 20 4,542 4.400229 297 142 398 413932 1.478 133 240 15 963 1.064
9.144 11.168 2.292 2.478 1 92 6.089 6.675749 1.152 289 478 63 68 1,297 1,282
1,554 302 420 2.237 127 143 3,777 1,32710.632 9.631 5,490 6.267 1,657 1.596 28,011 28,361610 272 103 456 589
4.724 4,830 5.883 6,537 774 838 15.344 16.4543.081 3.933 3.199 2,414 4.181 5.708212 818 124 298 72 150 682 1,111302 479 71 Cr158 484 526
1.545 1.797 920 1,100 8 28 5.680 5.63760.146 75.585 63.846 88,692 14.179 17.215 177.295 162.527
488.205 693.086 570.850 591,226 99,886 125.558 1,230.238 1.393.8183.666 7,235 6.632 8.930 158 75 5,143 8.2251,445 1.368 762 513 470 192 2.182 2.266-9.173 7.718 3,479 3.176 2.180 1,869 13,490 15,124684 955 736 1.052 80 40 2.335 2,300
2.142 2.222 654 224 82 58 1.481 1.331868 680 33 213 17 32 963 1.007137 124' 31 37 185 453
180 551 620 27 172 800 1.9452.853 2.945 2.438 2.697 1,004 1.139 5,617 6.911458 557 709 488 1,529 190131 150 225 118 14 3 416 398451 77 9 38 491 404475 1.407 467 632 8 15 5,339 5,015
2.500 1.684 109 943 25 25 2,774 2.03137.458 40,123 5.462 2,753 320 320 29.412 25,8041.016 958 549 305 1.085 404
14,539 17.169 19,144 13.377 1162 1,279 39.068 34.19512,102 10,084 11.161 8.754 867 963' 19.142 20.492
284.881 179.528 416.555 608,352 101,102 85.820 1,036.264 890.7083,620.176 3.462.903 6.003.286 5,995,810 1010.675 918.720 11,979.278 10.593.565356,334 349.661 495,463 486.668 83.231. 90.005 981.493 908,54811.461 12.593 7.660 5,661 543 437 9.124 8.440
796 1;662 1,705 1,894 21 41 2.837 2.523971 874 77 195 825 83510.419 9,212 2.981 3,223 201 220 10.698 9.923
For index to roads not appearing in alphabetical order, but given under some other system, see page 31.
Digitized for FRASER http://fraser.stlouisfed.org/ Federal Reserve Bank of St. Louis

SEPT.. 1911.1 RAILWAY EARNINGS 13
NAME OF ROAD
TOTAL EXPENSES NET OUTSIDE OPERATIONS TAXESincl. General Exp. FROM RAILROAD Gross Revenue Net Revenue Current PreviousThis Year Last Year This Year Last Year This Year Last Year This Year Last Year Year Year
$
FINAL NETCurrent Previous
Year Yon'$
MILESend of MonthThis LastYear Year
hunt & Ild Top MtnJuly 27,352 26,268 14.470 15,808 2.000 2,000 12.470 13,808 70 70
Idaho & Wash North July 43,745 46,608 14,129 38,621 3,000 3,000 11.129 35,621 111 102
Idaho Northern Ltd. ..J'ne 8209, 8,505 -1,192 2,310 641 165 -1,833 2,144July 1 to J'ne 30_ 71,208 62,801 27,295 45.687 5.920 4,044 21,374 41,643 58 58
Idaho Southern July 2.714 3.381 -258 1.101 302 302 -560 798 24 24
Illinois Central July 3.963.882 3,534.227 1,126,656 1,143,214 37,673 34,128 -10.734 -6.131 230,522 198,000 885,399 939.082 4.755 4.552
Omaha B'd'g & Ter-J'ne 782 822 17.060 12.103 3.153 1,777 13,906 10,325July I to J'ne 30_ _ _ _ 9,583 9.725 167.999 149.369 16,807 13,455 151.191 135.914 9 9
Yazoo & Miss Vall_July 579.437 583,460 151.122 87,564 610 593 -286 -559 38,000 33,000 112,836 54.005 1.371 1.371
Illinois Northern J'ne 21,075 16.441 7.954 10,003 579 682 7.375 9,320July 1 to J'ne 30_ ___ 196.809 174,997 62,876 94,542 8,609 5,580 54.267 88,962 5 5
(New fiscal year) July 15.257 15.069 5,839 7,129 583 685 5.255 6.443 5 5
Illinois Southern J'ne 37,364 26,149 1.913 19.903 1.500 1,500 413 18.403July I to J'ne 30_ ___ 409.330 300,605 71,912 73,285 18,000 17.949 53,912 55.336 136 136(New fiscal year)_July 31,317 31.739 11.765 15,894 1.500 1,500 10,265 14,394 136 136
Illinois Terminal_ July 14,224 9,540 2.214 5,036 378 232 1.836 4,703 18 18
Indiana Northern_ _ _ _J'ne 796 1,250 165 167 55 64 110 103July I to J'ne 30 12,042 16.379 10.158 3,705 665 773 9,492 2,931 0.75 0.75(New fiscal year) July 614 635 483 375 56 55 427 319 1 0.75
Internat & Ut North_July 539,185 585.596 57.395 106,783 2,079 -322 -142 20,000 20.000 37,072 86,640 1,159 1.159
Inter-State July 6.103 6.513 1,214 1.019 550 475 664 544 27 24
Iowa Central July 211.505 207.153 44,630 35.736 9,623 9,779 35,007 25.957 558 558
Ironton July 13,287 16,592 10.235 17.321 700 600 9.535 16,721 12 12
Ivoryd & Millcrk Val_July 3,336 7,753 1,634 -2,710 87 95 1,546 -2,805
Jamest Chair & L EJ'ne 10.463 14,743 -773 -2,364 400 400 -1,173 -2,764July 1 to inc 30 108.632 118.332 -6,386 -19,201 4,800 4,800 -11,186 -24.001 33 33(New fiscal year) July 9.763 9.421 2,255 -115 400 400 1.855 -515 33 33
Jefferson & No West_July 1.396 1,710 -261 1,029 25 25 -286 1,054 31 30
Jonesboro Lake Cy&EJ'ne 12.771 3,781 -1.349 10,523 1,569 3.784 -2,918 6,738July I to J'ne 30____ 122.994 117.504 54.864 61.170 12,380 12.773 42,484 48.396 87 87
Kan Olen Jean & E_ _July 3.688 2.234 2,776 1,157 157 153 2.619 1,003 14 8
Kanona & Prattsbgh_rne 1,608 1.702 -164 -352 90 90 -954 -442July I to J'ne 30_ __ _ 15.443 17.794 7.914 249 1.080 1,080 6,834 -830 11 11(New fiscal year) July 2,099 1,734 -1.051 -653 90 90 -1,141 -743 11 11
K C Chin & Springf July 22.871 22.791 12,480 9,037 2,000 2.000 10.480 7,037 154 154
Kan City Mex & Or_ _J'ne 152,495 163.299 -25,068 -21,781 6.750 6,762 -31,818 -28,543July I to J'ne 30____ 1,845.206 1.633,822 3,272 114.118 66,361 78.842 -63,089 35,276 764 740
Kansas City South _ _ _July 518,673 541.045 232,415 296.931 34,611 29,476 197.804 267.454 827 827
Arkansas Western_July 2,478 2,712 685 1,010 569 566 116 443 32 32
Kansas City Term_ July 26.975 30.211 959 -1,661 1,515 4,280 -555 -5.941 10 10
Kansas Southwest_ J'ne 4.291 4,617 -989 -232 460 515 -1.449 -747July I to J'ne 30____ 46.104 54,570 1,329 11.984 5.103 7.014 -3,774 4.969 60 60
Kelleys Creek & N W_J'ne 1,393 1.619 175 31 25 103 149 -71July I to J'ne 30-- 18,176 16.641 623 11 774 1.242 -150 -1,230 5 5
Kentucky & Tenn__ _J'neJuly I to J'ne 30-__
9.71069,164
9.45857.049
8,44547,873
7.12637.002
263483
0-64155
8,181 7.19047,389 36.847 10 10
Kentucky Highlands_July 2,206 1,248 2.383 1,162 35 23 2,348 1.139 7 7
Kentucky Midland July 1.104 446 -352 -372 53 36 -405 -409 7 7
Kentwood & Eastern_July 12.304 12,212 5.667 6,873 177 150 5,489 6.722 54 54
Kentwood Orb & SW July 4,369 4,903 2,019 3,811 60 60 1,959 3,751 14 14
Keokuk & Ham Uwe-July 1,237 1,478 4.630 2,129 360 360 4,270 1,769 2 2
Keweenaw Central.._ _July 4,280 4,169 874 2.066 85 86 789 1,980 39 39
Kinder & Nor West_ _J'ne 1,775 -692 -692Meh I to J'ne 30 7.695 279 279 10(New fiscal year)_July 668 -312 -312 10
Kinston & Snow Hill_July 1,469 1,255 -457 -390 42 39 -499 -429 14 14
KishacoquIllas Vali_ _J'ne 1.351 944 -95 255 21 21 -117 233July I to J'ne 30____ 14.517 13.626 1.327 1,829 259 259 1.068 1.570 9 9
Kittanning Run RR- July 829 712 -480 -238 7 6 -488 -244 4 4
Klamath Lake J'ne 2.358 3.057 3,592 2.183 115 112 3.477 2.070July 1 to inc 30____ 20.753 24.123 11.683 2.222 1.380 2,350 10,303 872 24 24
Knoxv Seviev & E'n_July 2.630 3,118 1.884 678 100 81 1,784 576 30 30
La Crosse & S E J'ne 6,162 4,194 160 1.328 336 452 --176 875July I to J'ne 30____ 49,688 48,745 23.774 23,353 3.833 3.910 19,940 19,442 40 40
La Salle & Bureau Co_July 1,321 1.011 43 573 85 76 -41 497 6 6
Lacks & Wyom Vall_July 28.023 29,920 27.869 27.611 123 161 -300 -297 27.569 27,314 22 22
L Champlain & Mor_ _July 10.874 12.433 4,474 9,137 600 600 3.874 8,537 7 7
L Charles Ry & Nay _ _July 1,891 3.032 -385 -554 -385 -554 20 20
Lake Erie & Ft W J'ne 906 861 385 288 28 27 357 261
July I to J'ne 30_ _ _ _ 8.317 8.748 5.550 6,734 346 463 5,204 6,271 0-50 0.50
Lake Erie & Western _July 327.262 357.472 126.670 68.905 19.868 18.829 106.802 50,075 886 886
Lake Shore & Mich S_July 2,459.396 2,891,230 1.661.645 1.138.662 53,347 50.578 2.249 -3.293 135.000 147.956 1.528.894 987,411 1.662 1.662
I. Superior & I shpem _July 17,994 25.397 -2,291 7.478 2,267 2,480 -4,558 4,997 24 24
LakeTahoe Ry& Nav_J'ne 5,545 4,989 3.332 4,541 26.025 34,357 -1,952 5.050 150 150 1,228 9.440July I to J'ne 30__ 34,573 34.391 6,331 14.272 185.188 192,047 27,859 39.246 1.906 1.819 32.284 51.699 16 16
Lakeside & Marbleh _ _July 3,901 4.539 4.966 4,162 1.066 435 3.900 3.727 6 6
Lancaster & Chester_July 4.895 4,332 352 621 199 181 153 439 28 28
Lanc Oxford & Sou July 2,072 2.114 338 311 91 105 246 206 28 28
L'Anguille River_ _ _ _July 984 1,159 -620 -364 14 12 -634 -376 1 1
Lara Ifahn's l'k & P_July 1.432 3,161 8,631 3,369 225 225 8.406 3.144 54 54
Las Vegas & Tonop_ _July 13,278 15,248 -1,266 -4.300 41 41 41 41 1.651 2,201 -2.876 -E.460 200 196
Laurel Railway July 3.084 3,279 892 4.029 134 120 758 3,908 18 18
Lawndale Ry & Ind-July 831 694 209 111 20 20 189 91 11 11
Lawrenceville Bech_ _J'ne
July I to J'ne 30____951
6.480520
7.300-5111,719
-1721,483
20253
21253
-531 -1931.466 1,229 9 9
Leavenworth & Top- _J'ne
July 1 to J'ne5.56674,801
4,83871.185
-1,595-19,982
-775-16,264
4655.113
5256.550
-2,060 -1,300-25,095 -22.814 56 56
Lectonia July 2.825 1.841 -424 -1.335 500 50 -474 -1.385 25 25
Lehigh & Dud River_July 80.414 69,603 30.708 27,069 3.500 3.100 27.208 23.969 96 96
Lehigh & New Eng_ _July 46.118 43.249 21,063 43.610 1.500 1.500 19.563 42.110 169 169
Lehigh Valley J'ne 1,923,789 1,837.382 1.763.882 1,414.964 110,735 186,930 -21,640 -18.950 78.576 66,161 1.663,665 1,329,852July 1 to J'ne 30- -(New fiscal year) July
23.407,3181.984.053
21,684,1471,898,185
14.280.0841.107,603
14,483,250978,032
1,894.885177,739
1,983.776191,498
-320,170-28,147
-146.333-45,336
1.145.476105,200
1,106,76192,200
12,814,43713,230,155974,255 840.495
1.4291.429
1.4331,433
Lexington & Eastern_July 30,514 28.781 16.899 12.203 110 85 110 50 1.000 1.000 16.010 11.253 96 93
Liberty-White July 6,013 6,671 2,528 1,389 185 185 2,343 1,204 43 43
Licking River Poe 1,886 1.953 -718 -203 34 34 -752 -237July -1 to J'ne 30_ ___ •• . 25.452 23.717 -5.739 -5.138 408 408 -6,147 -5,547 32 32
For index to roads not appearing in alphabetical order, but given under some other system, see page 31.
Digitized for FRASER http://fraser.stlouisfed.org/ Federal Reserve Bank of St. Louis

14 RAILWAY EARNINGS [VoL. Lxxxxm.FREIGHT & PASSENGER EARNINGS TOTAL EARNINGS . MAINTENANCE EXPENSES TRAFFIC & TRANSPORTAT'N EXP'SFREIGHT PASSENGER incl. Other Revenue Way & Structure Equipment TRAFFIC TRANSPORTAT'NNAME OF ROAD This Year Last Year This Year Last Year This Year Last Year This Year LastYear This Year Last Year This Y'r LastY'r This Year Last Year$ 3 $ $ $ $ $ $ $ $ $ $ $ $Ligonier Valley July 5.959 7.332 6,145 4.346 12,453 12.001 2.142 2.968 782 735 50 53 3.301 3.393Lime Rock J'ne 6.840 7.516 6.944 7.460 1.113 1.065 466 764 1.470 1.628July 1 to J'ne 30_ _ _ _ 74.979 81.163 77.977 83,867 12,833 12.904 7.517 9.241 18.298 17.278(New fiscal year)July 7,584 6,320 7,592 6.418 1,338 1,283 697 559 1.766 1,493Linville River ____ __JulY 998 1.303 394 274 1.447 1.631 390 699 18 20 631 575Litchfield & Madison_July 12.644 21.686 12.879 22.013 1,444 5.271 5,255 8.530 355 190 2.100 3.967Little Kanawha J'ne 1,274 1.156 874 1.144 2.519 2,659 1.509 1.599 56 137 1,731 1.689July 1 to J'ne 30_ _ _ 15.165 18.322 11.084 20.087 31,739 43.184 17.239 23.713 1.279 3.530 21,088 22.399Little River J'ne 3,199 2,164 880 402 4,198 2.783 767 823 1,243 323 1.516 1.423July 1 to J'ne 30_ _ 30,430 21.100 5.792 4.373 36.901 26.431 5.234 6.557 6.628 2.583 13.380 9,917Little Rk Maum & W_July 3.895 4,047 198 208 4,475 4.537 612 617 437 466 25 25 1.546 968Live Oak Per & Gulf _July 6.070 8,517 1.368 2,096 8.065 10.966 2.295 2.096 1.896 2.340 149 193 2.272 2.618Livingston & S E__July 490 1.507 98 228 588 1.736 280 212 16 498 1,062Long Island July 240.066 251.122 057.136 866,120 1,243,364 1.164,864 125.757 102.853 101,317 109.100 20.680 22.672 402,993 394.831Lorain & Southern_ _ _July 686 599 686 599 376 337 115 196 491 496Louisiana Railway_ _ _July 7.569 8,304 7.569 8.304 708 1.099 634 917 3.455 3.275Louisiana & Arkan_ _July 77,828 92,981 18,385 15.818 100.738 113.377 25,664 20.546 17.931 15.445 2.387 2,471 29,229 23.707Louisiana ec N W_ _ _ _July 11,325 14.507 5,104 5.778 17,665 21.505 5,086 2.963 2.856 1.651 456 463 7.250 7,612Louisiana & Pacific_ _J'ne 13.454 20.586 56 8 13,885 20.850 1.272 1.786 3.563 1.553 935 856 5.576 5.911July 1 to J'ne 30__ _ _ 225,067 215.705 535 471 228,319 220.985 21.862 19.833 23.117 14.967 10.845 10,535 77.179 63.655Louisiana Central_ _ __July 11.109 12.116 17,013 18.673 6.806 6,989 3.962 3.582 327 346 4.173 4,625
La RY 6c Nay Co_ _ _ _July 102.265 90.698 25.317 21.562 137.621 122.969 18.544 24.854 11.852 14,193 5.373 4.787 51,724 53.272Louisiana Southern_ _J'ne 5.090 5.759 1,221 1,336 6.582 7,932 2.755 4.095 1.073 1,350 2.617 2.465July 1 to J'ne 85.534 68.956 16,297 16.974 106,588 91,398 19.798 28.540 19,846 16.463 34,552 29,041Louisville & Nashv_July 2,962,046 2.970,994 1,072,470 985.948 4,286.748 4,201.599 685.813 721.336 795.398 807.668 92,197 92.063 1.396,805 1,419.928Louisv Hend & St L_July 58.757 54.661 37,333 34.706 102.195 96.284 27.877 21.348 11.992 9.456 4,314 4,568 34.145 32,812Lou New Alb & Cory _J'ne 1.822 966 748 759 2.758 1.879 1,241 :,33 10 21 612 380July 1 to J'ne 30._ 15,626 13,065 10.400 10.060 28.128 25.043 3.636 2.997 119 55 5,702 4,792Lowv & Beaver Riv_ _July 1.697 1,593 1.105 1.123 3,687 3.619 541 610 143 166 1,032 978Luehrmann & West_ _July 16 31 16 31 , 25 25 10 15 25 25Macon & Birmingh'm_J'ne 4.272 5.705 3.920 3.487 8.843 9.805 3.220 842 1.873 1.413 460 764 4.131 6.703July 1 to J'ne 30_ _ _ _ 47.949 96.054 48,997 44.417 154.995 148.087 37,394 32.635 20.272 19,324 9.123 10.742 59,955 58.690(New fiscal year) _July 5.204 6.317 5.002 4,741 10,890 11,579 2.471 3.825 1,825 1,357 439 1.068 4.372 4,904Macon Dublin & Sav_J'ne 16.206 17.774 9,850 8.056 27,406 26.978 5.138 5,305 5.238 4.365 2.765 2,697 11,385 9,999July 1 to J'ne 30_ _ 319.595 285.428 130.996 114.356 468.011 418,463 72.558 49,619 57.565 51,064 34,664 31,348 146,289 132,286(New fiscal year) July 17.611 16,391 11,283 9.452 30.475 27.015 5,634 6.833 5.021 5.131 2,974 2.370 12,005 9,607Madison Southern_ _ _May 1,659 2.128 1,659 2.128 33 2 335 24 50 50 559 697July 1 to May 14,979 12.401 14.979 12.401 725 202 1,589 341 550 550 6.972 4,995Maine Central July 460.335 403.379 367,390 365 422 885.451 826.547 202.112 152.758 95.030 110.210 8.169 8.474 313.222 305.580Malvern & Free° Vali _July 3,348 3.494 3.612 3.758 209 429 2,022 847 978 1,258Manchester & Oneida.July 916 1.025 606 774 1,722 2,105 321 352 25 4 109 86 838 997Manila & Sou West_ _J'ne 1.021 661 41 48 1.063 700 218 133 15July 1 to J'ne 30_ _ _ _ 9.562 8.211 548 410 10.110 8.622 1.995 1,889 220 591 Manistee & Or Rap_ _July 5.195 5.410 624 711 6,021 6,132 2,068 1.743 1,146 1.334 222 243 2.782 2.758Manistee & No East _ _July 35.398 25.165 13.250 10.477 50.805 37,348 7.957 11.022 8.493 5.174 1,006 901 16.378 13,469Manistee & Repton__J'ne 908 142 1.116 545 85 770Manitou & Pike's Pk_July 180 107 28.275 24,112 29.762 25.466 2.916 1.518 937 1,497 4.649 3.883Mansfield Ry & TransJ'ne
July 1 to J'ne 30_-__2.05424.639
5.11625.617
2201,815
1011.209
2.31226,763
5,21726,826
5068.844
3876.053
8602.192
477 1,200
1.0017,411
2568,868
Manufacturers' Ry_ _ _July 4.268 4.974 1,591 1.173 287 283 3.509 3.751Manufacturers' Junc _July 1.802 1,680. 8.975 8.840 2.405 1.554 978 1.336 48 56 2,829 4.371Mfrs Ry Co of St L_ _July 24.999 22,944 2.181 3.406 2.460 1.587 130 115 5,252 4.712Marietta Col & Clev _ _July 4.025 3.441 2.453 1.732 6.926 5.490 3.366 4.190 1.054 1.683 243 292 2.323 3.312Mann Tomah & W_ __July 2,480 2.973 304 383 2.814 3.385 397 5.475 648 393 64 69 536 1,175Marion & Rye Valley _July 5,004 5,872 328 315 5.455 6.543 1,235 1,761 430 1,387 954 1.554Marshall & East Tea July 9.387 16.302 2.585 2,568 13,072 19.528 4,892 3,582 1.946 2,041 262 281 5,588 6,332Maryland & Penna. _July 16.130 15,478 12,240 13,097 34.086 34.015 10.945 4.478 4,210 4.405 666 570 12.973 12.149Maryland Electric_ _ _ 3.906 3.376 16.712 14,044 21,819 18.853 3.167 2.755 2.817 2.780 348 331 9,547 9,106July 1 to J'ne 30_ _ 39.250 41.264 160,568 149,931 211.812 203.441 31,529 34.587 40.128 36.362 3,991 4,809 111.933 104,369Mattoon J'ne 2,461 2.806 224 238 2.788 3,124 806 930 129 101 1.778 1,477July 1 to J'ne 30_ 23.490 28.266 2,902 3,074 27,368 32.317 5.409 4.719 1,222 1,901 12.453 15,185McCloud River July 48.677 60,387 3,235 2,833 52.633 63.958 6.651 6,061 5.136 6,873 28 81 9.536 11,026Mem Dallas & Gulf _July 7,208 9,775 2.616 2.737 10,506 13.877 1,148 2.349 1,130 1,832 239 362 2,726 5.329Michigan Central__ July 1.409.104 1,460.596 763,181 805,537 2.390.212 2,511,882 243.880 399,855 236.001 340,377 80,243 71,072 910,361 951.142Midland Valley J'ne 60.615 39.781 37.226 29.332 104,244 74.376 Cr6.915 16.308 19.304 18.369 3,341 2.146 36,391 27(254July 1 to J'ne 30_ _ _ _ 857,760 942,393 418,457 335,923 1,352,607 1,348,080 227,740 223,668 210.422 252,350 29,077 23,385 404,387 382,154(New fiscal vearI_July 69.231 46.682 35.209 32.607 111.632 84,104 25.067 21.276 21.020 23,122 3,400 1,846 36.009 27,423Mill Crk & Little Run_July 983 1.382 983 1,382 65 276 113 118 482' 491Millers Creek July 382 294 228 160 3,266 1.488 83 19 364 235 2.068 614Milner & North Side, _July 1.538 1.443 552 1.002 2,245 2.489 423 450 19 45 109 163 1,293 1.409Mineral Pt & North _ July 5.435 5.835 856 893 6.643 7,006 1,276 129 674 841 117 67 2.933 2,684Minneap & Rainy R- July 7.437 25.229 797 556 8.621 26.068 2.697 4,089 1,303 2.566 2,623 7.705Minneapolis & St L_ _July 212,577 265,236 119.053 118.283 361.311 413.569 36,879 47.335 48.014 49.707 9.750 11.684 155,177 155.528Minneapolis Eas tern .July 4.621 4,291 237 528 191 184 1,228 1.938Minn Red I & Manit_July 5,261 1.632 1.041 955 6,522 3.177 889 679 437 382 1.731 809Minn St P& S S MJ'ne 1.147,637 1.479.896 485,498 483.964 1.757.424 2.095,452 240.509 278.105 271.511 247.853 54.567 53.892 633.211 652,310July I to J'ne 30_ _
(New fiscal year) _July15.157.8751,353.831
17.510.4261,334,040
4.971,488567.967
5.071.988527,170
21.568.6402,050.158
23.922.0681.989,934
2.359.6092,940
2.515.737230,515
3.159.183269,202
2.739.637234,325
543.46344,437
553.29839,078
8.140.994663,203
7,444.799638,752
Miss Ark & Western-111eJuly 1 to J'ne 30___
1,82823,222
18.60721,695
1.82823,222
18.60721.695
3272.963
2653,260
1783.615
544 5.179
2584,878
4654.637
Mississippi Central—July 45,705 49.282 16.073 16.339 68.620 70.823 7.217 8.157 12.405 11.881 911 1.210 15,278 15,279Mississippi Eastern_ July 4.607 6.434 353 200 4,000 6,687 1.517 1.989 960 537 39 25 1.223 1,843Miss Hill City & W_ _July 1.314 621 556 679 2.158 1.462 810 425 27' 1 981 499Miss R & Bonne Ter_ July 50,208 52.367 9.493 10.026 65.951 66.899 8,220 9.430 6.965 8.720 1,110 843 19.815 21.053Mo & Ill Bdge 8c Bel t _July 3,906 5.280 143 199 4.083 5.572 222 528 128 771 .819 842Missouri & Louislana.July 6.484 6.383 428 162 6,951 6.593 1.794 369 1.766 2,061 15 2,206 2.470Missouri & Nor Ark_ _July 36.899 44.027 32.325 27.679 75.025 76,209 15.874 24.272 11.523 12,840 2.351 1.978 28.104 30.728Missouri Kan & Tex _ _July 888.192 866,474 383,512 392,444 1,370.943 1.347,229 236.199 216.069 210,492 232.113 32,405 33.442 437.815 492,089Mo Kan &T of Tex _July 355.572 374.861 312,606 302.831 719.264 726,266 225.992 146.361 114.177 78,150 24,026 24.337 429,709 349.232Texas Central July 29.398 26.548 29,033 34,270 64.455 66.983 9.408 15,222 10,744 8.631 1,461 1.380 26.241 26.445Total Company_ July 1.273,162 1.267.883 725,151 729,545 2.154,662 2.140.478 471.599 377,652 335.413 318.894 57.892 59,159 893.765 867,766
Missouri Okla ec Gulf _July 43.741 25.218 10.830 11.472 56.701 38.717 9.206 10.604 13.845 10.520 3.012 2.076 23,421 22.261Mo Oki &Gulf olTeauly 3.313 364 3.778 370 801 149 2,191
For index to roads not appearing in alphabetical order, but given under some other system, see page 31.
Digitized for FRASER http://fraser.stlouisfed.org/ Federal Reserve Bank of St. Louis
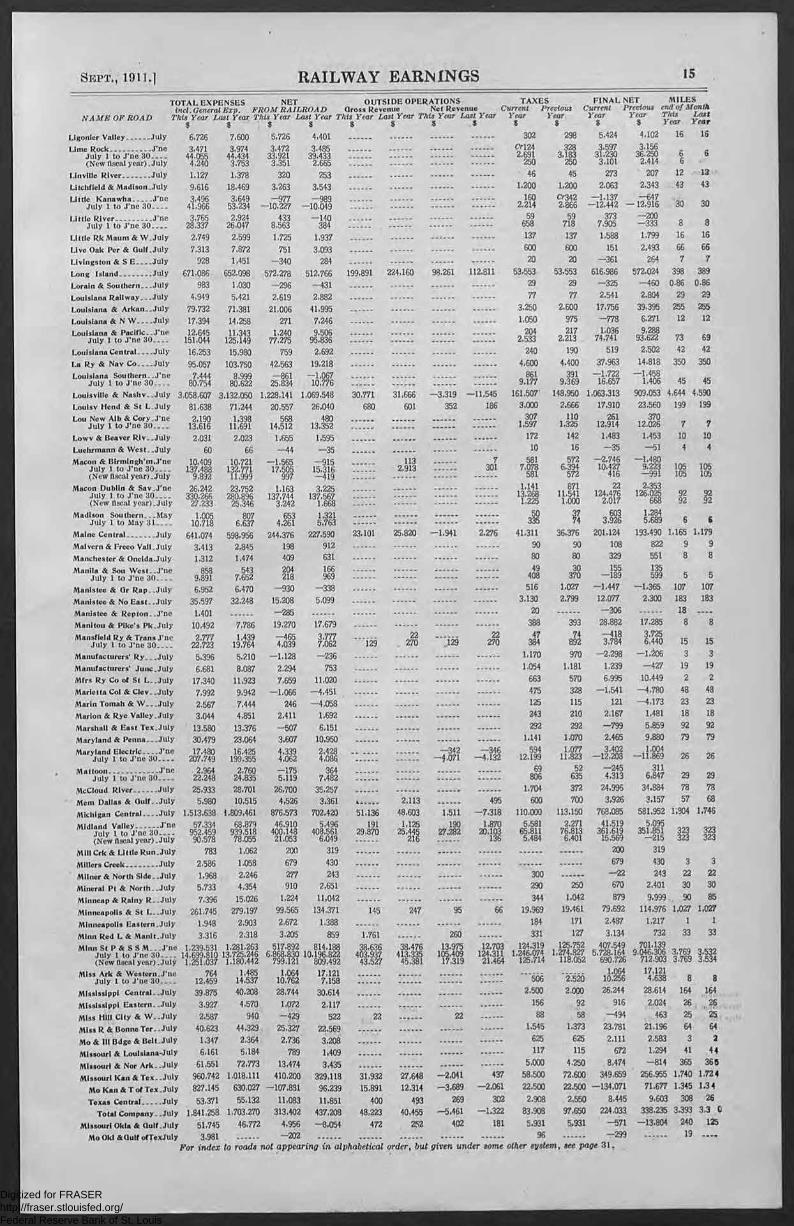
SEPT., 1911 RAILWAY EARNINGS 15
TOTAL EXPENSES NET OUTSIDE OPERATIONS TAXESincl. General Exp. FROM RAILROAD Gross Revenue Net Revenue Current Precious
NAME OF ROAD This Year Last Year This Year Last Year This Year Last Year This Year Last Year Year Year$ $ $ $ $ $ $ $ $ $
FINAL NETCurrent Previous endYear Year This$ $
MILESof Month
LastYear Year
Ligonier Valley July 6,726 7.600 5,726 4,401 302 298 5.424 4.102 16 16
Lime Rock J'neJuly 1 to J' -Joe 30- - -
3.47144.055
3,97444.434
3.47233.921
3.48539.433 2.691
3283. 183
3,59731.230
3.15636.250 6 6
(New fiscal year)_July 4,240 3,753 3,351 2,665 250 250 3.101 2.414 6
Linville River _ July 1,127 1.378 320 253 46 45 273 207 12 12
Litchfield & Madison_July 9.616 18.469 3.263 3,543 1.200 1.200 2,063 2,343 43 43
Little Kanawha J'ne 3,496 3.649 —977 —989 160 0'342 —1.137 —647July Ito J'ne 30____ 41.966 53,234 —10,227 —10.049 2.214 2.866 —12.442 — 12.916 30 30
Little River J'ne 3.765 2,924 433 —140 59 59 373 —200July 1 to J'ne 30....._ 28,337 26,047 8,563 384 658 718 7,905 —333 8 8
Little Rk Maum & W_July 2.749 2,599 1,725 1.937 137 137 1.588 1,799 16 16
Live Oak Per & Gulf_July 7,313 7.872 751 3,093 600 600 151 2,493 66 66
Livingston & S E July 928 1,451 —340 284 20 20 —361 264 7 7
Long Island July 671.086 652.098 572,278 512,766 199.891 224,160 98.261 112.811 53.553 53,553 616.986 572,024 398 389
Lorain & Southern__ _July 983 1,030 —296 —431 29 29 —325 —460 0-86 0-86
Louisiana Railway July 4.949 5.421 2,619 2.882 77 77 2,541 2.804 29 29
Louisiana dc Arkan July 79,732 71,381 21.006 41,995 3.02550 2.600 17.756 39.395 255 255
Louisiana & N W _July 17,394 11,258 271 7.246
1.0
975 —778 6,271 12 12
Louisiana & Pacific _ _J'ne 12.645 11.343 1,240 9,506 204 217 1.036 9.288July 1 to J'ne 30_ _ _ _ 151,044 125.149 77.275 95.836 2,533 2.213 74.741 93.622 73 69
Louisiana Central _ _July 16,253 15,980759 2,692 240 190 519 2.502 42 42
La Ry & Nay Co July 95.057 103.750 42.563 19.218 4.600 4,400 37,963 14,818 350 350
Louisiana Southern_ _J'ne 7,444 8.999 —861 —1,067 861 391 —1.722 —1,458July 1 to J'ne 30____ 80,754 80,622 25,834 10.776 9.177 9,369 16.657 1.406 45 45
Louisville & Nashv July 3,058,607 3,132,050 1,228,141 1.069,548 30,771 31,666 —3.319 --11,545 161,502 148,950 1,063,313 909,053 4,644 4,590
Loulsv Hend & St L_JulY 81.638 71.244 20.557 26,040 680 601 352 186 3,000 2,666 17,910 23.560 199 199
Lou New Mb & Cory _J'ne 2,190 1,398 568 480 307 110 261 370July 1 to J'ne 30____ 13.616 11.691 14.512 13.352 1.597 1,325 12.914 12,026 7 7
Lowv & Beaver Riv July 2,031 2,023 1.655 1.595 172 142 1.483 1.453 10 10
luehrmann & West_ _July 60 66 —44 —35 10 16 —35 —51 4 4
Macon & Birmingh'mane 10.409 10.721 —1.565 —915 113 7 581 572 —2,746 —1.480July 1 to J'ne 30....... 137.488 132.771 17,505 15,316 2.913 301 7,078 6,394 10,427 9.223 105 105(New fiscal year) July 9,892 11,999 997 —419 581 572 416 —991 105 105
Macon Dublin & Sav_J'ne 26,242 23.752 1,163 3,225 1,141 871 22 2.353July 1 to J'ne 30..___ 330.266 280.896 137,744 137.567 13.268 11,541 124.476 126.025 92 92(New fiscal year)_July 27,233 25,346 3.242 1,668 1.225 1.000 2,017 668 92 92
Madison Southern. MayJuly Ito May 31
1,00510,718
8076536.637 4.261
1.3215,763
50335
3774
6033, 926
1.2845.689 6 6
Maine Central July 641.074 598,956 244.376 227,590 23.101 25.820 —1.941 2.276 41.311 36.376 201.124 193.490 1.165 1.179
Malvern & Free° Vali _July 3.413 2.845 198 912 90 90 108 822 9 9
Manchester & Oneida.July 1.312 1.474 409 631 80 80 329 551 8 8
Manila & Sou West_ _J'ne 858 543 204 166 49 30 155 135July 1 to J'ne 30...._ 9.891 7,652 218 969 408 370 --189 599 5 5
Manistee & Or Rap_ _July 6,952 6.470 —930 —338 516 1.027 —1.447 —1,365 107 107
Manistee & No East_ _July 35,597 32,248 15.208 5.099 3.130 2.799 12,077 2.300 183 183
Manistee & Repton J'ne 1,401 --285 20 --306 18
Matiltou & Pike's Pk _July 10.492 7.786 19.270 17,679 388 393 28,882 17.285 8 8
Mansfield Ry & Trans J'ne 2,777 1,439 —465 3.777 22 22 74 --418 3,725July Ito J'ne 30_ ... ..
Manufacturers' Ry_ _ _July
22.723
5.396
19,764
5.210
4,039
—1.128
7,062
--236
129 270 ,129 270
1f10
892
970
3.784
—2.298
6,440
—1.206
15
3
15
3
Manufacturers' Junc _July 6,681 8,087 2,294 753 1.054 1.181 1,239 —427 19 19
Mfrs Ry Co of St L July 17,340 11.923 7.659 11,020 663 570 6,995 10.449 2 2
Marietta Col & Clev _ _July 7.992 9.942 —1.066 —4.451 475 328 --1.541 —4.780 48 43
Mario Tomah & W JulY 2.567 7.444 246 —4.058 125 115 121 --4,173 23 23
Marion & Rye Valley_July 3,044 4.851 2.411 1.692 243 210 2.167 1,481 18 18
Marshall & East Tex_JulY 13.580 13.376 —507 6.151 292 292 —799 5,859 92 92
Maryland & Penna. _ _July 30.479 23,064 3.607 10.950 1.141 1.070 2.465 9.880 79 79
Maryland Electric J'ne 17.480 16.425 4.339 2.428 —342 —346 594 1,077 3.402 1.004July 1 to J'ne 30---- 207.749 199.355 4,062 4.086 —4.071 —4.132 12.199 11.823 —12.208 —11,869 26 26
Mattoon J'ne 2.964 2,760 —175 364 69 52 —245 311July t to J'ne 30....... 22,248 24.835 5.119 7.482 806 635 4.313 6,847 29 29
McCloud River July
Mem Dallas & Oulf July
25.933
5,980
28,701
10,515
26.700
4,526
35.257
3.361 . 2 .113 495
1.704
600
372
700
24,996
3,926
34.884
3.157
78
57
78
68
Michigan Central...- ..July 1,513.638 1.809.461 876.573 702.420 51,136 48.603 1,511 --7,318 110,000 113.150 768.085 581,952 1.304 1.746
Midland Valley J'ne 57.334 68.879 46.910 5,496 191 1.125 190 1.870 5,581 2,271 41.519 5,095July 1 to J'ne 30____ 952.459 939,518 400.148 408,561 29,870 25,445 27.282 20.103 65.811 76,813 361.619 351,851 323 323(New fiscal year)_July 90.578 78,055 21,053 6.049 216 136 5.484 6.401 15,569 --215 323 323
Mill Crk & Little Run _July 783 1.062 200 319 200 319
Millers Creek July 2.586 1.058 679 430 679 430 3 3
Milner & North Side_ _July 1.968 2,246 277 243 300 —22 243 22 22
Mineral Pt & North_ _July 5.733 4,354 910 2,651 290 250 670 2.401 30 30
M imleaP & Rainy R_ _July 7.396 15.026 1.224 11.042
Minneapolis & St L. _July 261.745 279.197 99,565 134,371 145 247 95 66 19.969 19.461 79.692 114.976 1.027 1.027
Minneapolis Eastern_July 1.948 2.903 2,672 1,388 184 171 2,487 1,217 1 1
Minn Red I. & Manit_July 3.316 2,318 3,205 859 1.761 260 331 127 3,134 732 33 33
Minn St 1,e, s s M J'ne 1,239.531 1.281,263 517.892 814.188 38.636 38.476 13.975 12.703 124.319 125.752 407,549 701.139
July I to J'ne 30.- - - 14.699.810 13,725.246 6,868,830 10.196.822 403,937 413.335 105.409 124.311 1.246.074 1.274,827 5.728.164 9.046.306 3.769 3.532(New fiscal year)_July 1.251,037 1.180.442 799,121 809,492 43,527 45,381 17,319 21.464 125,714 118.052 690.726 712.903 3,769 3.534
Miss Ark & Western_J'ne 764 1.485 1,064 17,121July 1 to J'ne 30_ _ __. 12.459 14,537 10.762 7,158 506 2.520 10.256 4.638 8 8
Mississippi Central.. July 39.875 40,208 28.744 30,614 2.500 2,000 26,244 28.614 164 164
Mississippi Eastern_ _July 3.927 4.570 1.072 2.117 156 92 916 2,024 26 . 26
Miss 11111 City & W.. July 2.587 940 —429 522 22 22 88 58 --494 463 25 25
Miss R & Bonne Ter.. July 40.623 44,329 25.327 22.569 1,545 1,373 23,781 21.196 64 64
Mo & Ill Ildge dc Belt _July 1.347 2,364 2.736 3.208 625 625 2.111 2,583 3 2
Missouri & Louisiana-July7896.161 5.184 1409, 117 115 672 1.294 41 44
Missouri & Nor Ark.. _July 61,551 72,773 13.474 3,435 5.000 4.250 8.474 —814 365 365
Missouri Kan & Tex _ _July 960.742 1,018.111 410.200 329.118 31.932 27,648 —2,041 437 58.500 72.600 349,659 256,955 1.740 1.724
Mo Katt Sc T of Tex_July 827.145 630,027 —107.831 96.239 15.891 12.314 —3.689 —2.061 22,500 22.500 --134,071 71,677 1.345 1.34
Texas Central July 53.371 55,132 11.083 11.851 400 493 269 302 2.908 2.550 8.445 9.603 308 26
Total Company_ .July 1.841.258 1,703.270 313,402 437.208 48,223 40.455 --5.461 —1.322 83.903 97,650 224.033 338,235 3.393 3.3 0
Missouri Okla dc Oulf _July 51.745 46.772 4.956 —8.054 472 252 402 181 5.931 5.931 --571 —13.804 240 125
Mo Okl & (I u I f otTexJuly 3.981 —202 96 —299 19 ____
For index to roads not appearing in alphabetical order, but given under some other system, see page 31, .
Digitized for FRASER http://fraser.stlouisfed.org/ Federal Reserve Bank of St. Louis

16 RAILWAY EARNINGS LxxxxiiiFREIGHT & PASSENGER EARNINGS TOTAL EARNINGS MAINTENANCE EXPENSES TRAFFIC & TRANSPORTAT'N EXP'SFREIGHT PASSENGER incl. Other Revenue Way & Structure Equipment TRAFFIC TRANSPORTAT'NNAME OF ROAD This Year Last Year This Year Last Year This Year Last Year This Year Last Year This Year Last Year Thisrr LastY'r This Year Last Year$ $ $ $ $ $ $ $ $ $ $ $ $ $Missouri Pacific Ry__J'ne 1,330,432 1,415,157 419,774 435.383 1.953.892 2,055,346 987,253 273,332 521,526 313.445 78207..028005 60,963 1.211.835 829.459July 1 to J'ne 30_ -- - 17,246,925 24,208,771 4,574.765 12.213.847
4.700,352 4.272.037StL Iron Mt & Sou_J'ne 1.481,810 1.520,105 526,126 474.953 2,170,887 2,168.663 626.117 348,014 431,593 314.024 74.687 59.766 1.015.615 612,750July 1 to J'ne 30_ _ _ . 20,382,287 19,367,143 6.217.498 5,431,579 28,567.820 26,916,890 4,409,366 3,991.719 4,011.483 3,724,132 683,694 675,141 10.531.561 8.386,1744.8780
22.745.4087 120,729 2,227,450 1.442.209Total Company_ _J'ne 2.812,242 2,935,262 945.900 910,336 4,124,779 4,224.009 1.613,370 621.346 953,119 627,469 141510.7July 1 to J'ne 30_ __ . 37,629,212 10.917,850 52.776,591 8,984.131 8.283.520Arkansas Central_ _July 3.836 2.709 3,270 2,922 7,685 6,128 1,427 1,442 1.083 978 70 58 2.638 2,709Natchez & South_ _J'ne 186 290 —2,599 2.008 105 2.219 1 48 15-- 4,831 4,462 37.839 34,996 4,858 15.179
60 4.088 1.312July 1 to J'ne 30-_ 753 2,496 440 3 71 21.146 15.147Missouri Southern_ _July 10.186 13,135 1,212 1,036 12.186 15,043 1.564 .2.401 690 948 27 56 2,912 4.533Mobile & Ohio July 640,561 600.800 126.377 118,843 896.703 838,271 116.564 110.188 159.646 158.499 32,747 33.156 328.167 311,506Monongahela July 88.282 106,814 2.355 3,275 91,914 111.453 19,582 38,818 9,607 8,858 218 233 19,367 25,537Monongahela Connec_July 66,248 76.079 6,821 9.024 8.990 11,760 306 308 30.054 40.227Monroe & Southwest_July 3,299 3.551 34 3.333 3.551 791 702 1.312 367 1.232 1,179Monson- July 568 616 382 1.299 996 200 224 205 123 250 250 310 410Montour
July
July 14,651 10.040 1.477 1.346 16.604 11.988 3,309 4.365 1,049 794 100 100 2.503 2.498Montpelier & Wells R.July 14,397 12,469 5.732 6.735 22,595 21.348 3.062 5,768 1.943 1.475 293 275 6,520 6,301Moscow Cam& San A.J'ne 353 973 103 81 473 1.113 188 796 89 317 15 9 248 342July I to J'ne 30_ _ _ _ 7,697 13,369 966 920 9.027 15.107 3.607 3,817 1.497 1.179 149 227 3,518 4,227Moshassuck Valley _ _ _J'ne 2,292 3,031 51 44 2,447 3.242 864 491 222 488 151 144 1,540 1.639July 1 to J'ne 30___. 40,173 45,954 595 703 40.877 47,441 8.103 9.040 4,226 4,634 2.043 1.959 17.559 21.367Mt Airy & Eastern_ _ _J'ne 791 758 96 76 982 905 124 130 186 140 406 379July 1 to J'ne 30— - - 3,890 8.210 619 1.171 4.997 10,226 774 2,313 617 1.326 1.932 3,789Mt Hood RR July 5.431 5,510 1,891 1,544 7,451 7,125 339 90 149 118 1,295 1.400Mt Hope Mineral_ _ _ _July 2,464 2,515 2,464 2.515 658 5,152 260 386 653 744Mt Jewett Kin & Rit_July 3,218 2.821 825 851 4,205 3.821 1.445 2.200 781 328 45 30 1.549 1,787Mt Penn Gravity- - --July 5 6.118 6.507 6.123 6,647 203 214 112 203 1.638 1.643Mountain Central _ _ _ _J'ne 1.154 1.468 301 451 1,575 1,993 371 440 381 208 485 559July 1 to J'ne 30__ _ _ 11,388 17,619 3.912 4.029 16.224 22.710 5.342 7,637 3.621 3,319 12 6.727 7.669(New fiscal year)July 1.395 1.112 291 370 1.764 1,559 295 759 173 239 486 588Mun Mar & So East_ _July 33.881 41,541 7,304 8,077 45.439 52,603 7.520 7.977 4.180 5,066 363 252 10.530 13.347Muscatine Nor & Sou_July 4,225 5.450 1,248 964 5,520 6,533 1.306 1.265 442 712 147 189 2,546 3.977Nacogdoches & S E__J'ne 597 837 128 480 47040 1,595 1,253 1.1744.1 17027 296 724 0 7.799
July 1 to J'ne 30- - - _ 10.665 12.448 758 322 18.456 15.558 8,758 4,260 2.933 3Narragansett Pier__ _J'ne 3.549 2.096 3,806 3.149 7.589 5.657 1,145 668 2.383 2,567 31 39
7:: 3,650
July 1 to J'ne 30____ 21.215 22.216 32.015 30.924 56.616 57.016 7,572 8.804 8,176 6,996 772 734 30.193 28.171Nashv Chatt & St L ._July 637.979 628.610 266,261 247.159 970,505 929,663 155.066 127,478 174.675 176.745 35.401 33,750 3541..729962 3461..128646Nelson & Albemarle_ _July 3,417 3.153 580 535 4.111 3.733 150 713 231 73 Nevada-Cal-Oregon __July 16.093 15.837 9,949 13.998 28.284 32,380 5.552 5.949 3.276 3.140 812 544 5,545 5.294Sierra & Mohawk _July 1,351 516 1.983 427 21 6 863Nevada Central inc 5,287 4.260 1,385 1.315 7,293 6.015 907 6.078 672 2,838 1.069 1.981July I to J'ne 30---- 54.086 38.399 21.393 15.572 84,614 60.096 12.903 40.013 9.265 18.837 18,630 17.796Nevada Oppperl3elt_J'ne 1.723 818 3,353 2,529 590 5 2763,520
158 172 153 117:. ,c7953 849July I to J'ne 30____ 17,821 722 1.266
12.233 37,922 3.202 1.804 Nev Co Narrow Gage inc 4,624 6,848 6.363 5.664 11.632 13.330 3.044 833 1.371 1.438 111 35"July 1 to J'ne 30_ _ — 62,062 64,301 56,200 54,709 127.410 128.481 27.963 13,289 17.885 15,603 494 31.771 32.660 35 3.116 2.868
Nevada Northern_ _ _ -rile 115,010 125,682 12,634 11.964 130.767 141.329 80.975 10,509 13,932 15,352 748 342 19.453 22,211July I to inc 30_ ___ 1,286.649 1.292.374 138,690 170.486 1,468.005 1,511,309 162.640 87.223 167.672 145.953 4,724 4.222 311.299 300.223(New fiscal year)__ _July 110.872 112,876 11,061 12.965 124,992 129,847 14.142 13,893 14,629 14.743 333 321 25,385 25.655New Castle & Ohio R_J'ne 1,658 1,066 1,658 1.066 ..__ 152 132 229 274 504 319July 1 to J'ne 30____. 11.466 13,493 11.466 13.493 3.189 2.032 2.372 1,624 5.407 4.189NJ Indiana & Illinois July 4,023 3,091 107 103 4,205 3,276 511355 2,024 155 24 36 974 821New Mexico Central_ _July 4,066 2,948 1,925 2.794 6,731 6,440 1,340 1.729 1.495 3,271 521 320 2,647 3.104New Mex Midland__ _July 2.607 1.691 27 50 2,635 1.742 485 727 159 162 1,012 879New On & Nor East _ _July 192,052 197.367 53.673 55.311 265.202 271,031 25.506 29.752 51,678 43.242 9.983 9.273 97.405 89.993New Orl Great Nor th _J'ne•• 104.825 106.444 29.816 31.258 143.388 144,858 16.968 19,421 16.068 11.824 3,846 2.670 42.297 54,807July 1 to J'ne 30_ __ _ • 1,196,438 1,054.474 369.220 354.709 1.698.723 1.497.649 245.559 241.638 231.195 189.035 36,847 28,534 495,078 389.592(New fiscal year) _July 91,324 100,356 31.488 36.362 131,704 147.521 18.906 20.844 17.178 19.123 2.656 2,884 42,305 35.241New Orl Mobile & Ch_July 96,704 85,979 33.524 27,837 140.166 122.909 23,745 20,391 14,625 8.347 2.872 2.688 45,226 42,755N 0 Natalbany & Nat July 17.475 13.932 677 539 18,955 14.593 1,981 3.259 3.510 4.242 76 3.885 3.762New Riv Hoist dc W_July 1,223 704 549 334 1,850 1.092 945 329 9 31 15 402N Y et Pennsvivania_July 4,331 4,660 2,645 2,709 7.722 7.944 2,754 2,503 441 682 3,283 3.414797N V Auburn & Lans__J'ne 1.532 1.701 4.152 4.370 6,220 6,563 471 510 416 399 55 207 2.654 2.828July 1 to J'ne 30_ _ 20.755 19,922 46,890 44.281 74,596 69.958 6,238 5.993 7,833 5,521 1,431 1.260 38.058 35.701N V C & Hudson Riv_July 4.678.642 4,262,991 3,173,135 3,101,738 8.725,589 8.235,339 1,204.457 1,240,089 1,154.398 1,356.215 224.688 219.151 3.062.554 2.988.028Chic Ind & South_ _July 240,593 211.604 27.213 27.495 274,860 246.505 50.112 44,896 55.940 52.206 7,185 8.697 110.078 101.112Chic Kalam & Sag_July 2,780 5.900 6.231 6.628 17,884 18.862 3.078 2.441 2.477 1.664 551 582 4.258 4.485Cincinnati North_ _July 69.864 70.039 24,878 25,730 101.533 101,752 24.853 20,522 21,867 20.442 2,888 2.934 38.058 37.513Clev Cin Ch & St L_July 1.608.301 1.404.542 775.236 759.960 2.594.186 2.376.080 285.581 419,101 347.071 433.939 96.610 103,905 939.428 1,049,806Det & Charlevoix_ _JMY 6,931 7,181 1,041 878 8,206 8,327 2.483 2.168 610 805 5 60 8.976 2.495Dunk All Val & P_ _July 13.934 15,090 8.850 9.735 26,701 28.574 7,025 7,618 895 5,086 460 2,053 10.593 12,505Fulton Chain 267 352 51 July 248 1.475 1,173 2.002 1.707
Indiana Harb Belt-July 194,261 172,208 20.586 42.709 26,281 24,331 2.575 23:592367 8891:F1 zF1Kanawha & Mich_ _July 238,041 228,870 32,842 31,400 276.640 266.196 38.309 40.499 44.855 47,273 2.540Kankakee & SenecaJuly 3,509 2.466 1.648 1.920 5.656 4,767 3,721 2,565 617 621 600Lake Erie & West_July 333.745 307,423 95.072 92,043 453.932 426.378 60.146 75.585 63,846 88,692 14.1791 17,215 17%5945 1622:5277L. E Alliance & W_ _July 44.947 49.092 4,717 4,498 51.080 55,136 15.483 24.496 7,009 7,350
,
2.815 17.994 17.835Lake Shore $c Nt S_Julv 2,421,145 1469.459 1,181,929 1,111,229 4,121.042 4.029,892 488.205 693.086 570,850 591.226 99,886 125,558 1.230,238 1.393,818L Falls&Dolgeville_July 5,581 5,171 2,284 2,363 8,138 7,842 1.086 1.193 281 306 88 85 3.202 1.980Louisv dc Jeff B'ge_Julv 11,331 13,961 623 681 13,678 16.420Michigan Central_ _July L409,104 1.460,596 763,181 805,537 2,390.212 2,511.882 243.880 399,855 236,001 340,377 80,243 71.072 910.361 951.142Mt Gilead Sh Line-July 154 360 212 213 428 606 439 85 28 31 558 467N Y & Ottawa July 12,025 11.376 3,071 3.976 16,192 16.578 3.931 8.427 2.613 Cr3,692 583 603 6.570 10.370N Y Chic dc St L July 694.676 682.943 171,255 173.359-' 901.761 888.969 130.733 115.970 91,448 99.321 47,162 49.778 358.471 351,658Peoria & Eastern.. July 176,963 188.902 59,479 58.441 255.791 268.617 44,322 44.591 35,332 45,861 6.991 8.023 104.331 110,347
38Pittsb & Lake Erie_July 1,194,283 1,328,024 153,256 165.345 1,389.945 1,528,575 150.055 163,453 132,537 138,034 17.821 13.587
3051.436
3
1.6Raquette Lake_ _ _ _July .• 983 945 5,235 5.516 6,804 7.049 1.854 849 13 47 30Rutland July 160.079 143.760 116,591 114,011 313,005 293.333 44,209 44,207 60,067 38.339 8.723 7,107 116,761 100.145St Lawr & Adiron_July 24,763 27,524 29,240 32.714 56,845 61.791 9.148 4,228 1.610 2.616 423 344 29.961 18.411Toledo & Ohio Cent July 352.832 371.933 62.319 60.062 442.587 '462.975 60.062 50,813 57,176 52.324 7,421 7,630 148.754 138.267Zanesville & West_July 32,000 31,471 4,596 4,773 37.670.' 137.466 7,513 9,547 4,721 6,455 848 631 14.616 14.425N,Y Chic & St Louls_July 694.676 682.943 171,255 173,359 901,761 888.969 130,733 115.970 91,448 99,321 47,162 49,778 358.471 351.658...... ,j, .gi For index to roads not appearing in alphabetical order, but given under some other sgstem, see page 31.
Digitized for FRASER http://fraser.stlouisfed.org/ Federal Reserve Bank of St. Louis

SEPT., 1911.] RAILWAY EARNINGS 17
NAME OF ROAD
TOTAL EXPENSES NET OUTSIDE OPERATIONSincl. General Exp. FROM RAILROAD Gross Revenue Net RevenueThis Year Last Year This Year Last Year This Year Last Year This Year Last Year
S $ $ $ $ $ $ $
TAXES FINAL NETCurrent Previous Current PreviousYear Year Year Yeas,'$ $ $
MILESend of Month
YearThisr
Year
Missouri Pacific Ry_.J'neJuly 1 to J'ne 30_ ___
2.985,32522.748,880
1,540,065-1,031.433 1.459,891
515,281 5,54079,804
6.463 -4.930 -35.528
-2,874 73,508978,008
102.444-1,109,872446.354
409.962 3,916 3383
StL Iron Mt & Sou_J'ne 2,244,337'71,406.191 -73,449 762.471 7.428 15.090 -7.804 2.807 127.290 83,654 -208.545 681,624July Ito J'ne 30- - -- 20,581.056 17.618.362 7,986.764 9.238,527 102.391 105.376 -50,554 --52,224 1.005.780 894.998 6.930.430 8,351,304 3,313 3.287
Total Company_ _J'ne 5,229.662 2,946,256-1.104.882 1.277,752 12,968 21,553 -12.734 -67 200,798 186,098-1,318,417 1.091,586July 1 to J'ne 30
Arkansas Central__July
43,329.936
5.800
9,446,655
5.691 1.885 436
182,195 -86.082 1.983.788
500
7,376,784
430 1,385 6
7,229
46
7,170
46
Natchez & South_ _J'ne 4,519 3,836 -7,119 -1,828 73 29 -7.192 -1.857July 1 to .J'ne 30._ -- 29.524 34.857 8,315 138 424 400 7.891 -261 2 2
Missouri Southern_ _July 6.216 9,192 5,970 5.851 300 136 5.670 5,714 53 53
Mobile & Ohio July 668.006 645,894 228.697 192.377 1.348 1,706 -1,629 -2,206 24.595 23,660 202.473 166.510 1.114 1,114
Monongahela July 50,738 75,414 41.176 36.039 1.900 2.065 39,276 33.974 64 64
Monongahela Connec.July 48,779 63,896 17.468 12.183 1,972 1.416 15,496 10.766 6 6
Monroe & Southwest_July 3,406 2.474 ---72 1,077 132 59 -204 1.017 17 17
Monson July 1.051 1,140 248 -143 13 13 234 -157 6 6
Montour July 7.551 8.334 9.053 3.653 200 150 8,853 3,503 13 13
Montpelier & Wells R-July 12.437 14.839 10,157 6,508 833 792 9,324 5.715 49 49
Moscow Cam& San A-J'ne 749 1.665 -275 -552 20 8 -296 -560July 1 to J'ne 30___ 11,529 11.998 -2,501 3.109 329 316 -2.830 2.792 7 7
Moshassuck Valley J'ne 3,578 3,528 -1,131 -285 52 70 -1,184 -356July 1 to J'ne 30___ _ 41.472 46,272 -594 1,168 632 619 -1,227 549 2 2
Mt Airy & Eastern__ _J'ne 515 1.22667 -320 78 78 -10 -398July 1 to J'ne 30____ 4,130 10.885 866 -659 547 936 319 -1,595 19 19
Mt Hood RR July 4.483 3,359 2.967 3.766 168 122 2.799 3,643 22 22
Mt Hope Mineral July 1,667 6,390 796 -3.874 156 154 640 -4.029 4 4
Mt Jewett Kin ec Rit_July 3,989 4,531 215 -709 33 15 182 -724 32 32
Mt Penn Gravity _ _ _ _July 2,203 2,365 3,920 4,282 59 59 3.860 4,223 8 8
Mountain Central------no 1,283 1.252 292 741 1,892 1.078 599 369 10 20 882 1.090July 1 to J'ne 30____ 16,588 19.962 -363 2.747 1,892 1.078 599 369 230 240 5 2.877 13 13(New fiscal year)_July 16,980 1,624 784 -64 10 20 774 -84 13 13
Mun Mar & So East_ _July 23.605 27.520 21.834 25,083 2.475 2.183 19.358 22.900 132 132
Muscatine Nor & Sou_July 5,576 5,919 -56 614 236 225 -293 389 42 42
Nacogdoches ec S E J'ne 2,677 1.301 -1.082 -48 80 75 -1.162 -123July 1 to J'ne 30_ _ 21.594 17.904 -3.137 -2,345 955 900 -4,092 -3,245 19 14
Narragansett Pier _ _J'ne 6,417 7.244 1,171 -1.586 208 203 962 -1.789July 1 to J'ne 30____ 47.489 45,722 9.126 11,294 1.528 1,382 7.597 9.912 8 8
Nash,/ Chatt & St L _July 744,745 709,363 225,759 220,300 7.746 6.423 -2.166 73 23.816 22,287 199,777 198,087 1.255 1,255
Nelson & Albemarle_ _July 1.916 2,307 2.195 1,426 130 126 2,064 1,299 16 16
Nevada-Cal-Oregon July 17,192 17.338 11.091 15.042 1.821 1,199 9,269 13.843 184 184
Sierra & Mohawk _July 1,379 603 252 351 36 - -- -
Nevada Central J'ne 3.163 11,365 4,129 -5.349 350 364 3,779 -5,713July 1 to J'ne 30___
Nevada Copper Belt.. _J'neJuly 1 to J'ne 30....
47.805
4.11933.413
83.938 36.809
1.730 -7654.508
-23.842
798
4.20901.94
91
4,528 32.519
146 -8563.414
-28.370
652
93
31
93
14
Nev Co Narrow Gage J'ne 9.065 6.122 2,566 7,207 430 481 2,136 6.725July 1 to J'ne 30._ _ _ 90.005 72.236 37,405 56.244 5.160 5,321 32.245 50.922 20 20
Nevada Northern J'ne 119.193 52.304 11,574 89.025 5,400 3,224 6.173 85,800July 1 to J'ne 30 689.628 581,266 778,377 930,042 58.908 36.969 719,469 893,072 165 165
(New fiscal year)_ July 58.263 58,852 66,723 70.995 4,500 3,121 62,223 67.873 165 165
New Castle & Ohio R _rue 914 748 744 317 38 38 705 278July 1 to J'ne 30... _ 11,460 7.989 5 5,503 463 463 -457 5.040 3 3
N J Indiana & Illinois July 4.100 1,922 104 1,354 200 190 -95 1.164 11 11
New Mexico Central_ _July 6.556 9.056 174 -2,616 650 867 -476 -3,484 115 115
New Mex Midland_ _ _July 2.034 2.281 601 -539 601 -539 11 11
New On & Nor East_ _July 196,890 182.448 68.312 88,582 2,027 2.025 -278 -354 9,250 8,250 58,783 79.977 195 195
New Orl Great North J'ne 86,100 93.121 57,288 51.736 91 115 -123 -158 2000, 2,450 55.164 49,127July 1 to J'I1C 30_ _ _ 1.076,705 906,698 622,017 590,950 1,273 1,389 -1.056 -986 23,510 14,400 597.450 575,563 282 275(New (Ism! year) July 87,810 82.379 43,893 65.142 130 93 -4 -86 2,000 1.250 41,889 63,805 2,82 275
New On Mobile ec Ch _July 94,361 81,472 45,804 41,437 -54 4.492 3.698 41,257 37,738 404 404
N 0 Natalbany & Nat July
New Riv Hoist & W_July
9.826
1,550
11,377 9,128
982 300
3.215
110
100
138
100 9,028
89 161
3.115
20
22
20
22
20
N Y 6c Pennsylvania_July 7,193 6.879 529 1.065 242 242 286 822 56 56
N V Auburn & Lans J'ne 4.146 4,911 2,083 1,651 256 465 1,827 1.187July 1 to J'ne 30___ _ 60,774 56.052 13.822 13,905 3.006 2,963 10,816 10.941 40 40
N V C & Hudson Riv _July 5.901.428 6,051,684 2,824,161 2,183.655 392.811 362,758 1.569 -43,333 414,371 391,091 2.411.358 1.749,229 3,591 3,587
Chic Ind & South_ _July 232.138 217.333 42.722 29,172 2,078 1,985 370 326 13.900 13.575 29,192 15.923 329 329
Chic Kalam & Sag_July 10,952 9,820 6.932 9.042 1.116 1.119 5,815 7.922 44 55
Cincinnati North _ _July 90.412 84,264 11,121 17,488 4,700 4,500 6.421 12,938 245 247
Cley Gin Ch ec St L_July 1,726,562 1066,495 867,623 309,584 33,509 29,541 -2,542 -12,896 90,000 82,000 775,081 214.687 2,009 1,982
Det ec Charlevoix_ _July 12.254 5.854 -4,047 2.473 582 680 -4,630 1.793 43 43
Dunk All Val & P_ _July 19,442 27,726 7,259 848 1,828 1.512 5,431 -664 90 90
Fulton Chain July 881 172 1.121 1,534 156 965 1,534 2 2
Indiana Harb Belt_July 145.668 164,676 48.593 7,532 9.335 7.244 4.209 1,816 5,500 5,500 47.302 3.848 108 113
Kanawha & Mich_ _July 175.157 173,775 101.482 92,420 124 -10 -8 9,057 7,644 92.414 84.767 175 175
Kankakee ec SenecaJuly 6.872 5.999 -1,216 -1,232 750 750 -1.966 -1,982 42 42
Lake Erie & West_July 327.262 357.472 126.670 68.905 19.868 18,829 106,802 50.075 886 886
L E Alliance & W_ _July 42.035 53,170 9,045 1,965 4,020 2.000 5,025 -34 87 87
Lake Shore & M S_July 2.459,396 2,891,230 1.661.645 1,138.662 53.347 50,578 ? 2.249 -3.293 135.000 147.956 1.528,894 987.411 1.662 1.662
L Falls& Dol geville _July 4.710 3,826 3,428 4,015 -20 4 3,408 4,010 13 13
Louisv & Jeff B'ge_July 2 2
Michigan Central_ _July
Mt Gilead Sh Line_July
N Y & Ottawa July
1.513,638
1,028
14,536
1.809,461 876,573
585 -600
16,218 1,656
702,420
20
359
51.136 48,603 1.511 -7.318 110,000
33
274
113.150 768.085
33 -633
78 1.382
2581-.9512
281
1,8042
69
1.7462
69
N V Chic & St L_ July 644.389 631,088 257,372 257.881 5.672 5.446 -1.343 -2.243 39.000 34.500 217,028 221.137 561 559
Peoria dc Eastern July 197.596 215,391 58,194 53,225 10.500 10,000 47.694 43.225 351 351
Plttsb & Lake Erie_July 630,830 678,422 759,115 850,153 1.044 871 -365 -464 30.000 27,200 728,750 822,488 215 191
Raquettc Lake_ 3.306 2,526 3,497 4,522 152 3,345 4,522 24 24
Rutland July 236.266 195,271 76,738 98,062 12,702 11.213 64.036 86.849 468 468
St Lawr & Adiron_July 43,527 26,299 13,317 35,491 550 388 12.767 35.103 65 65
Toledo & Ohio Cent July 282,144 259.121 160.443 203,854 1.051 -992 20.343 14,929 139,106 188,924 440 444
Zanesville & West_July 28,556 31.888 9.114 5,578 1,650 1,214 7,464 4,363 89 89
N V Chic & St Louis July 644,389 631,088 257,372 257.881 5.672 5,446 -1,343 -2.243 39.000 34.500 217,028 221.137 561 559
For index to roads not appearing in alphabetical order, but given under some other system, see page 31.
Digitized for FRASER http://fraser.stlouisfed.org/ Federal Reserve Bank of St. Louis

18 RAILWAY EARNINGS [VOL. Lx_xxxin
NAME OF ROAD
FREIGHT & PASSENGER EARNINGS TOTAL EARNINGS MAINTENANCE EXPENSES TRAFFIC & TRANSPORTAT'N EXP'SFREIGHT PASSENGER incl. Other Revenue Way & Structure Equipment TRAFFIC TRANSPORTAT'N
This Year Last Year This Year Last Year This Year Last Year This Year Last YearThis Year Last Year ThisY'r LastY'r This Year Last Year$ $ $ $ $ $ $ $ $ $ $ $ $ $
NYNH& Har tford -July 2.314,405 2.417.566 2.408,311 2,391,887 5.197,708 5.269.633 572,453 636,451 583.134 564.133 30,506 22,084 1,940,013 1,925 .807Central New Eng- -July 196,369 176.430 31,646 32.485 241,093 222.594 36.809 63.400 19.153 21,074 1.046 1.184 65.838 75,541N Y Ont & West__ ..July 586,518 609.213 302,141 288.540 932.512 941,455 122.135 104,784 152.678 112.868 10.030 14,125 302,322 290.123Union Freight July 10.489 10.379 10.557 10,389 726 868 959 541 50 52 4.296 4,339Wood River Brch_ _July 490 530 427 414 1,027 1.035 128 161 7 1 252 641
N V Ontario & West_July 586.518 609,213 302.141 288.540 932.512 941.455 122,135 104.784 152.678 112,868 10,030 14.125 302,322 290,123N V Phila & Norfolk _July 244,835 291,068 40.241 38.121 306,393 353.243 36.123 32,724 53.833 50.615 4,979 5,144 116,782 128.385N 1' Susq & Western_July 161.623 144.699 57.781 63.127 245.883 234.209 32.931 28.093 24.034 25,256 1,162 4.490 87.596 85.442Nez Perce & Idaho._ _July 1,626 854 2.660 785 38 1.068Niagara Junction_ __ _July 5,504 5.682 5.571 5,973 286 1,277 314 314 1.174 1.670Nittany Valley July 246 1,407 246 1.407 88 516 27 6 253 320Noland Land & Trans July 630 595 108 120 2 325 533Nod & Ports Belt L_ _July 15,691 16,092 3.252 2.233 1,385 1.454 4,640 6,002Norfolk St Western_ _ _July 1550.652 2.436,550 399,494 382.249 3,053,712 2,914,363 401,117 388,381 584.268 551,202 52.147 45.761 863.651 879,217Norfolk Southern_ __ _July 139,607 133,524 87.936 76.780 255.052 230,927 30.433 32,527 30,449 26,106 5,314 4,824 85,005 70,973North & South Caro_ _July 4,485 3,657 3,740 2,805 8.538 6.722 1.776 1,111 188 214 146 49 3,013 2,447Nor Louisiana & Gulf July 1,051 1.776 191 90 1,243 1,998 472 959 453 579 10 10 807 1,176North Shore J'ne 131 175July 1 to J'ne 30_ 42 42 1,828 105 8 1.000 2,085Northampton & Bath July 15.306 18,768 379 454 18,732 22,246 1,325 939 2.327 2.547 231 220 10.519 10,633Northamp & Hertf'd_July 316 858 118 93 502 1,023 122 327 1Northern Central_ ___July 682.400 698,576 207.729 207.108 948,918 965.093 127.832 140.013 190.745 184,525 15,546 16.950 479.729 453.811Northern Pacific July 3.220.044 3.926.434 1,667.235 1.907.803 5,232,852 6,247.336 845.417 1,002.989 716.666 729,689 99,877 96,566 1,581.404 1,848.484Big Fork&IntFa]ls_July 6,059 2.721 3,064 2,087 9,900 5.464 964 3,548 283 414 34 30 1.940 2,179Minnes & Internat_July 35,978 34.967 21,549 20.015 61,789 60,864 11,331 12,816 9.083 • 5.269 281 353 18.151, 19.677Pt Townsend Sou. July 1.421 1.492 1.457 1.799 4,015 4,236 903 570 411 383 25 50 1.11251 1.267
Northwestern Coal__ _July 3,946 2,160 526 251 174 160
1.6
767Northwestern Pacific J'ne
July 1 to J'ne 30_ _ _ _(New fiscal year)_July
109,1641,358.562121.308
111,4141,254,554123,105
197.6271.758,343254,737
179.3821,665.153235,988
327,6083,369,859
397,899
311,3953,167,805381.437
48.839591.52448.590
33,060536.47343.193
37,502 35,192502,244 409.07838.973 36.382
5.44838,0763,950
3.58833.5013.268
105.1341.254.986
114,327
102.2351,098.039105,110
Norwood & St Lawr_July 8,135 7.166 1,195 1,125 10.189 9,099 784 315 1,271 845 20 68 2,612 2,656Oak Or & Geo'town_ _July 4.329 584,329 58 1.137 591 165 309 1,102 219Ocala & Southwest. July 2.362 3,654 2,362 3,654 481 600 578 26 120 142 437 533Ocilla Pine & Vald___J'ne
July 1 to J'ne 30--.433
5.521438
5.968433
5,521438
5.968117
1.37179
1,59333 33402 386
25300
25511
25310
25511
Ocilla Southern J'neJuly 1 to J'ne 30_ _(New fiscal year) _July
3.27635.7412.854
86622.5901,665
1.1898,2401.114
4174.893543
4,82747.7474.355
92931,7072,524
9785.411596
552.902232
440 7823.575 1.817293 232
5071230
Crll34540
1.43212.1881,240
Cr1.2996.193655
Ohio & Kentucky_ _ _ _July 6.228 5.869 2.058 1,578 8,579 7,792 919 1.299 616 367 163 155 1,762 1,606Ohio Riv & Columbus July 1,462 437 677 409 2.238 996 903 817 287 456 51 53 1.289 751Ohio Riv & Western_July 6.211 5,648 9.104 9.191 16.942 16,514 6,206 5,709 2,349 2,105 50 70 4,271 3,936Oklahoma Central_ _ _July 13,488 9.032 4,592 4.372 18.814 14.605 5,201 4.364 3.216 2.339 538 576 6,146 6,071Okla K & M Inter-Ur_July 1,268 1,175 406 605 1.674 1,780 140 145
854 51
27 621 539Ontonagon July 753 269 753 269 96 166 396 1071. 533 429Oregon St Eureka.. J'ne
July 1 to J'ne 30____26.673210,229
19,445170.413
3.65838,570
3,36635,408
30,793253,845
22.926209.111
11.09559.354
5.93856.696
1,592 3.32823,451 29.745
1071,038
931,032
5.68160.479
5.47359.094
Oregon & Southeast_ _July 2.390 3.116 827 1.146 3.348 4,387 1,341 514 327 233 617 781Osceola Lit Riv & W_J'ne
July 1 to J'ne 30_ .._ -549
6.391680
7,677549
6,391680
7,67768
2.420125
2,363 2.377 3,52807 609138 441,365Ouachita & Northw_ _July 10,547 15,338 10,551 15,338 2,496 2,006 1,437 1,648 111 354 2,678 3,311Ouachita Valley J'ne
July 1 to J'ne 30-- -3,98372.655
5.56652.715
95731
126764
4.07973.386
5,69255.605
1.15918.212
2.18325.842
4,272 374 12.810 7.667
67613,644
1,90820.115
Overton County July 1,913 2,722 617 578 2,704 3.506 448 751 206 201 1 1 790 892Owasco River July 2,979 2.269 101 905 769 990 17 16 1,372 1.310Pacific & Eastern__ J'ne
July 1 to J'ne 30_ ___2.38111,860
1,0618,040
1,59412.404
1.08510,136
4,40726.257
2,18418.597
1,5089.809
3021,202
257 10 512 124 232
8585
1,43314,241
9137,805
Pacific & Idaho Nor_ _TheJuly 1 to J'ne 30_ ___
11,86396,526
8,48180.792
7,16471.895
7.56862.755
20.279180,746
17.048152,837
4,94350.377
1.45845.119
626 5318,511 5,788
2441,898
41,343
2.92341,823
3.01930,586
Pascagoula Northern_July 878 4,328 1,279 1.547 2,379 5,912 610 282 878 575 99 76 2.220 1.789Payette Valley July 1,612 549 1,678 724 3.363 1.509 731 424 139 5 1,055 859Pennsylvania-Lines East
Pennsylvania RR_ _July 8,747.796 9,080,376 3,099,729 2,988,019 12,721.057 12,918,395 1.424.999 1.831,316 2.467.492 2,344,532 180.056 206.125 4,626,122 4,573,746Bait Et Sparro P t 7.521 11.857 7,521 11,857 Cr256 Cr1,264 Cr363 590 200
July 1 to inc 30_ _ - - 105.901 116,559 105.901 116.559 21,018 21.247 Cr5,943 5.276 1,907 37 1.9B 3.1:B8Bait Ches & Atlan_July 9.487 10,958 23,764 23,977 37,913 38,105 5.000 4.321 2,700 2.351 1.254 1.249 12.824 11.334Cape Charles July 3,351 684 4,102 163 19 27 530 ------Cornwall & Leban_July 22,979 29.008 ,7,945 6,187 34,901 36.882 1.783 2.673 7,502 6,736 , 465 273 13.307 11.395Cumberland Valley July 166,755 189,390 57,766 57,395 235.535 256,525 44,267 29.713 29.062 32.289 4,875 4,578 72,454 77,561Long Island July 240,066 251.122 957.136 866.120 1,243,364 1,164.864 125.757 102,853 101.317 109.100 20,680 22.672 402,993 394.831Maryland Del & Va July 5,572 5.891 11,445 10.258 18,284 17,682 4,997 5.079 1,496 1,615 1,005 976 7.243 6,116N Y Phila & Norf - -July 244.835 291.068 40,241 38,121 306,393 353,243 36.123 32,724 53.833 50,615 4,979 5,144 116,782 128.385Northern Central_ _July 682.400 698,576 207.729 207.108 948.918 965.093 127,832 140.013 190.70445 184,525 15,546 16,950 479,729 453.811Pennsylvania Term July 33.600 270
2.3
15,452
Phila Bait & Wash _July 836,829 945,659 620.415 610.960 1.613,557 1,711.178 203.3278 258.13944 273,274 261.610 28.005 27,822 631,735 673,150Rosslyn Connect' g_July 941 1.244 , 946 1.253
7 1.4
175 147 3
6 . 15:403Union RR of Bait. _July 92.427 111,206 19,460 19,418 113.224 131,862 7.841 10,793 995 664 .;'127 1,W Jersey & Sea Sh_JulY 162.772 163.524 652,176 612.990 854.122 811.933 70,172 94.984 80.432 60,803 15.737 17.862 269.163 237,697
Lines West of PittsburghCin Leban & North July 30,078 30.806 5,020 4,662 38,216 37,783 7.427 10.370 5.103 6.284 826 1,109 13,081 13.932Clev Akr & Cincin_JulY 186,094 187,951 74.349 73.471 284,133 281.966 54.335 57.158 50.849 50,198 3,729 6,521 95.852 100.609Grand Rap & Ind_ _July 198,474 331,561 193.271 183,725 426.534 448.106 44,530 72,304 62,205 70,271 11.923 15.494 175,430 195.554Penna Company__ _July 3,281.967 3.661,974 805,667 769,258 4,428,883 4,777,553 513.343 644.214 768,522 769,719 69,701 86.703 1,424,510 1,603.422Pitts Cin ch & St L. July 2.153,585 2,078,086 712,463 718.564 3,209,997 3,146,314 586.000 497.492 640,875 598,317 62.644 77,704 1.088.174 1.228.559Vandalia July 516.023 536,175 224,803 201,246 836,427 820,338 173,271 135,794 153,634 161.715 29,616 29,293 303.761 344.630Waynesb & Wash_jruly 5,128 4,161 5.899 6.270 11,896 11,476 4,974 4.096 1.445 1,487 108 104 41..513259 4,014Wheeling Terminal July 4.266 3,448 937 874 635 1.453 15
4
1,250Penn Southern July 3,444 3.943 7.780 1,210 656 406 2,317Pa West&Ohlo R Con-July 261 296 261 296 50 26 38 15 165 248Peoria & Eastern..___July 176.963 188,902 59,479 58,441 255.791 268,617 44,322 44,591 35,332 45.861 6,991 8.023 104.331 110,347Peoria & Pekin Unlon Poe 5,509 5.069 3,079 2,249 67.919 77.530 10.209 16.225 7.840 7,307 71 30.796 35,689July I to J'ne 69,312 55.384 33.371 27.310 895,252 852,502 106.121 115.635 99,763 92,979 556 331 462.831 403,289
For index to roads not appearing in alphabetical order, but given under some other system, see page 31.,
Digitized for FRASER http://fraser.stlouisfed.org/ Federal Reserve Bank of St. Louis

NYNH & Harttord_JulY 3,264,907 3.290,651 1,932,801 1.978,981 181,063 179.847 115,979 112.134 300.000 343,000 1,748,780 1.748.116
Central New Eng. _July 125,558 164,168 115.535 58,426 954 79 9.000 9.000 106.614 49.426
N If Ont & West.- -July 602.542 536.551 329.969 404,904 23,412 20,425 4.065 —4,637 17.916 17.500 316.118 382,766
Union Freight July 6.478 6,244 4.078 4,145 575 650 3.583 3,495
Wood River Brch_ _July 549 966 478 69 46 46 431 22
N 'V Ontario & West_July 602.542 536,551 329.969 404,904 23,412 20.425 4.065 —4.637 17,916 17,500 316,118 382,766
N V Phila & Norfolk_July 223,601 227.245 82,792 125.997 7.500 6,850 75,292 119,147
N Y Susq & Western_July 149,631 147.763 96,252 86,445 11,272 10.081 1.744 —5.222 11.733 11,316 86,264 69.906
Nez Perce & Idaho_ _July 2.021 638 100 538
Niagara Junction July 1.997 3,403 3,573 2,569 375 356 3,198 2.213
Nittany Valley July 469 991 —223 416 15 15 --238 401
Noland Land & Trans July 518 694 111 —99 27 29 84 --128
Non f & Ports Belt L. _July 10.086 10,503 5.604 5,589 500 400 5,104 5.189
Norfolk & Western_ July 1.958.540 1.928,065 1,095.171 986.298 12,659 8.347 —2.260 —608 115.000 93.000 977.911 892.689
Norfolk Southern_ _ _ _July 165.004 148.648 90,047 82.278 12,522 9.718 1.721 4.167 7,500 6.100 84,269 80,346
North & South Caro_ _July 6.169 4.586 2,369 2.136 100 2.269 2.136
Nor Louisiana & Gulf July 1,924 2,889 —680 —891 53 46 —734 —938
North Shore J'ne 730 358 —730 —358 38 —769 —358July 1 to J'ne 30_ - - - 4,252 3.234 —4.252 —3.191 148 123 —4.401 —3,315
Northampton & Bath July 14,667 14,492 4.065 7.753 276 236 3,788 7.517
Northamp & Hertf'd_July 636 835 —133 187 22 22 —156 164
Northern Central__ _ _July 837.552 817,851 111.365 147,242 1,221 1,095 738 858 40.336 33.986 71.767 114.114
Northern Pacific July 3.329,498 3,764,665 1,903.353 2,482,671 180.886 199.334 41.679 67.645 261.643 281.130 1.683.390 2.269.186
Big Fork&IntFalls_July 3,406 6,441 6.494 —977 396 218 6.098 —1.195
Minnes & Internat_July 41,141 40.103 20.647 20.760 2,468 2.430 18,179 18.330
Pt Townsend Sou_ _July 2.757 2,439 1,257 1.796 624 600 632 1.196
Northwestern Coal_ _ _July 2,063 1,410 1,882 749 3.308 3.308 —839 —840 118 91 925 —182
Northwestern Pacific J'ne 206,429 184,012 121,178 127.383 15,000 10.539 106.178 116.843July 1 to J'ne 30 2,498.058 2.191,736 871.800 976,069 137.700 129.899 734.100 846.169(Ne fiscal year)_July 215,392 197.020 182.506 184.417 12,714 10.500 169.792 173.917
Norwood & St Lawr_July 5204. 4,473 4,984 4,626 819 1,805 --12 969 200 125 4.772 5.471
Oak Or & Geo' town. _July 2.731 1.471 1.598 —1,412 65 63 1,533 —1.475
Ocala & Southwest. .July 2,105 2.037 257 1.616 257 1.616
Ocilla Pine & Vald J'ne 260 169 173 269 59 59 113 210July 1 to J'ne 30_ _ _ - 2,756 3,137 2,765 2,831 711 705 2.054 2,125
Ocilla Southern Foe 3,658 2.047 1.169 —1.118 128 305 1.041 --1.423July 1 to J'ne 30_ 26.820 14,493 20,927 17,214 1,539 934 19.387 16.280__ -(New fiscal year) .July 2,525 1,366 1,830 1,158 128 128 1.701 1.029
Ohio & Kentucky.. . _July 4.870 4.559 3.708 3.232 137 137 3.571 3,095
Ohio Riv 6c Columbus July 2,601 2.197 —362 —1.001 118 89 —480 —1,090Ohio Riv & Western_July 13.470 12.469 3.471 4,045 840 864 2.630 3.180
Oklahoma Central_ _ _July 16.398 14.733 2,415 —128 1.722 1.701 693 —1.829
Okla K & AI Inter-Ur_July 1,116 994 557 786 36 52 520 733
Ontonagon July 1.177 825 —423 —555 —424 —556
Oregon & Eureka_ __ _J'ne 18.863 15.207 11.930 7,719 2.464 500 9.466 7.219July Ito J'ne 30_ 149.023 151,250 104.821 57,861 8,586 6.000 96.235 51.861
Oregon & Southeast. _July 2.842 2,205 506 2,181 81 69 424 2.112
Osceola Lit Riv & W_J'ne 260 594 289 85 14 274 85July 1 to J'ne 30_ _ _ - 7.674 8.492 —1,283 —814 --1,283 --814
Ouachita & Nor th w . _July 6.876 7,514 3,675 7,824 170 123 3.505 7,701
Ouachita Valley J'ne 7.461 5.949 —3.381 —256 Cr384 —3.381 127July 1 to J'ne 30.... 62,041 67,106 11,345 —11.501 840 715 10,504 --12.217
Overton County July 2,036 9.035 668 —5,529 100 100 568 —5,629
Owasco River July 2.471 3.411 507 --1,142 63 70 444 —1.212
Pacific & Eastern_ _ _ _J'ne 4.126 1.436 281 747 72 62 208 685July 1 to Yoe 30.... 28.960 12.178 —2.703 6.419 686 --3.513 5,733
Pacific & Idaho Nor_ _J'ne 9,385 5,697 10,893 11,351 Cr18°900 350 10,993 11,001July 1 to J'ne 30_ __ _ 110.542 91.150 70,203 61.687 4.995 6,121 65,207 55.565
Pascagoula Northern_July 4.054 2,961 —1.674 2,951 240 168 —1.914 2,782
Payette Valley July 2.250 1.617 1,113 —107 —13.143 17 17 1.095 —13.269
Pennsylvania—Lines EastPennsylvania RR. ,July 9.035.704 9,276.892 3,685,352 3.641,503 470.114 526.085 —121.162 —57.428 605.931 474.453 2.958.258 3.109,621
Bait & Sparrow Pt_J'ne 2.818 4,269 4.702 7,588 425 1.428 4.277 6.160July 1 to J'ne 30.. 57,442 61.627 48,459 54.931 3.653 3,565 44.806 51.365
Bait Ches & Atian_July 22.425 20.046 15,487 18,058 93,653 106.939 19.674 29.927 2,182 2.182 32.980 45.803
Cape Charles July 823 3.279 30 3.249
Cornwall & Leban_July 24,369 22.197 10,531 14.684 1,282 1.246 • 9.249 13.438
Cumberland Valley July 157.847 149.846 77,688 106,678 1,406 1.370 585 187 5.141 4.915 73.132 101.949
Long Island July 671.086 652,098 572.278 512,766 199,891 224.160 98.261 112.811 53.553 53.553 616.986 572.024
Maryland Del & Va July 14.959 14.085 3.324 3,596 85.784 80.443 22.300 16.427 606 606 25.018 19.418
N V Phila & Norf. _July 223.601 227,245 82,792 125.997 7.500 6.850 75.292 119.147
Northern Central. _July 837.552 817,851 111,365 147.242 1,221 1.095 738 858 40.336 33.986 71.767 114.114
Pennsylvania Term July 18.163 15,437 1.130 14.307
Phila Bait & Wash _July 1.171,039 1,253.680 442,518 457.498 50.697 48.151 391.820 409.347
Rosslyn Conneceg_July 1.384 2.533 —438 —1.279 77 74 —516 —1.354
Union RR of halt. _July 16.907 18.834 96.317 113.028 5.922 5.063 90.394 167.965
W Jersey & Sea Sh _July 446.197 421.370 407.924 390.563 13.165 14.429 —5.771 —8.709 23.473 23.000 378.679 358.853
Lines West of PittsburghCin Leban & North July 26.776 32.039 11.439 5.743 1.500 1.300 9.939 4.443
Clev Akr & Clncin_July 210.226 219,795 73.907 62.171 16,600 9.220 57.307 52.951
Grand Rap &Ind —July 308.427 367,799 118.107 80,306 3,373 3,347 —913 —1.048 23.010 24.748 94.183 54.501
Penna Company _- -July 2.862,189 3,190,610 1.566.693 1,586,942 60,698 52,942 —4,082 —8.645 173.949 161.965 1.388.662 1.416,332
Pitts an Ch & St L July 2.440.703 2,472,512 769,293 673,801 590 583 —1.237 —969 128.783 123.824 639.272 549.007
Vandalia July 680.558 691.260 155.869 129,078 27.401 27,758 128.468 101.320,
Waynesb & Wash_JulY 10.829 9.875 1.066 1.600 246 377 820
1:Wheeling Terminal July 3,184 3 .636 1,081 —187 970 950 111 —1137
Penn Southern July 5.261 2.519 86 2,432
Pa West&Ohlo R Con-July 253 290 8 6 8
60.5Peoria & Eastern___ -July 197,596 215 .391 58.194 53.225 10.500 10.000 47.694 43.225
,Peoria & Pekin Union J'neJuly I to J'ne 30...
52.568714.219
63.302655.073
15,350181,033
14.227197,429 49:120 44,800 111.912 113:62279
SEPT. 1911.] RAILWAY EARNINGS 19
TOTAL EXPENSES NET OUTSIDE OPERATIONS TAXES FINAL NET MILESincl. General Exp. FROM RAILROAD Gross Revenue Net Revenue Current Previous Current Previous end o Month
NAME OF ROAD This Year Last Year This Year Last Year This Year Last Year This Year Last Year Year Year Year Year This Last3 $ $ $ $ $ $ $ $ $ 8 $ Year Year
2,091 2.040
276 277
565 545
2 2
5 5
65 545
112 112
152 152
13 __
4 4
6 6
3 3
13 13
2.004 1.951
607 602
55 38
14 14
4 4
7 7
9 9
472 470
6.027 5.814
33 33
177 177
41 41
8 8
376 376403 37619 19
26 266 6
11 11
15E 15
25 25
24 24
111 111
135 131
4 4
15 15
30 3020 20
5 5
54 44
28 28
17 17
2 2
33 12
90 76
41 41
30 13
3.978 3.970
4 4
8: __ ...87
26 26
162 162
398 389
83 83112 112472 470
4 -. - -
713 717
3 3
9 9
355 353
45 453613 360
587 587
1,415 1.4151.467 1,468827 827
28 28
9 968 ....
1
0.75
753 351
18 18
For index to roads not appearing in alphabetical order, but given under some other system, see page 31.
Digitized for FRASER http://fraser.stlouisfed.org/ Federal Reserve Bank of St. Louis

20 RAILWAY EARNINGS [VoL. Lxxxxiii
MILNAME OF ROAD,...r.ii
FREIGHT & PASSENGER EARNINGS TOTAL EARNINGS MAINTENANCE EXPENSES TRAFFIC & TRANSPORTAT'N EXP'SFREIGHT PASSENGER incl. Other Revenue Way & Structure Equipment TRAFFIC TRANSPORTAT'NThis Year Last Year This Year Last Year This Year Last Year This Year Last Year This Year Last Year ThisY'r LastY'r This Year Last Year3 $ $ $ $ $ $ $ $ $ $ $ $ $Peoria Ry Term Co__July 2.589 3.361 6.501 6.540 14.732 15.076 1,743 1.159 1,850 2,447 118 37 9.127 9.651Pere Marquette July 789,935 807.522 449,792 449.496 1,360,877 1.372,509 170.372 166,933 194.045 186,226 37.843 48,015 590.084 557,610Perla Northern July 310 2,100 310 2.100 302 177 12 119 309 271Phila Bait & Wash_ _ _July 836,829 945,659 620.415 610.960 1,613.557 1.711,178 203.378 258.394 273,274 261.610 28,005 27.822 631.735 673.150PhIla Belt Line July 965 1.030 129 349 10 10 1.336 1,378Pickens RRJuly 563 340 488 565 1,139 975 237 338 62 89 38 32 478 440Piney Riv & Paint Cr_July 1.444 1.700 501 488 2.115 2,341 235 258 206 2.077 668 771Plttsb & Lake Erie_ _ _July 1.194,283 1.328,024 153.256 165,345 1,389,945 1.528.575 150.055 163,453 132.537 138,034 17,821 13.587 305,697 338.535Pittsb & Moon RunJuly 11,681 10,534 113 115 11.839 10,682 1.764 2,227 305 161 50 50 933 950Pittsburgh & Susq_J'ne 4.124 2,347 2.527 2.661 6,808 5.189 734 2.106 1,029 1.121 119 231 2.551 1,393July 1 to J'ne 30_ _ _ _ 25.048 27,551 33.711 35,115 60,624 63.816 12.431 32.726 12.495 16,792 1,282 1.001 23,353 19.874(New fiscal year)_July 1.723 1.816 2,815 3.404 4,656 5,296 402 1,389 838 1,102 66 108 1,894 2.110Pitts Alleg & McK R_J'ne 5.285 14.799 6.300 16,241 1,432 1,918 1.617 1,419 3,731 8.548July 1 to J'ne 30_ _ __ 107,821 125,350 128.401 143,931 18.498 23.724 20.180 12.653 79,376 79.647Pi t es Char & You gh _ _July 24.152 28.793 535 646 26,595 30,803 3,546 4.205 1,350 2,478 252 270 7.683 9,730Pitts Cin Chic & St L_July 2,153,585 2,078,086 712.463 718.564 3.209.997 3.146,314 586.000 497,492 640.875 598,317 62.644 77,704 1,088.174 1.228.559Pitts Shaw & North_ _July 86.146 96.323 9.209 10,027 97,144 107,637 14.758 24.553 22,261 27.457 1,108 993 29.554 37,029Pollock & Ang Val Tr July 1,938 2.929 1.988 2.979 473 624 299 493 780 953Port Huron Southern_July 1.245 1.368 140 146 12 102 607 620Portland & Southeas_J'ne
July 1 to J'ne 30_ _ __1.041
23.9041.988 46
5671 1,088
24,4721.990
7.9992.102 189
1.694106 75
1,1775, 5.Nli411
(Ne.v fiscal year)_July 2.739 1,836 60 14 2,799 1,850 1,216 979 276 7194
559Portland Terminal_ _ _July 3.111 100 8.626
c1r.210834
297 28 Cr1,150315Potato Creek July 2,168 2.220 232 571 2 1.397Potomac Fred & Pied July 3.786 3,256 780 794 4,711 4.194 790 1.098 178 438 20 20 1,173 1.077Prescott & Northw _ _July 15.674 11.191 884 630 16.923 11,971 1,202 1,493 1.117 518 923 154 3.778 4.149Quanah Acme & Pac_ July 9,324 11.625 1.619 1.797 11.968 14.485 1.160 2,154 1,156 796 228 2.857 3.108Rahway Valley Co_ __July 1,737 2015, 425 537 2,259 2.644 370 393 454 404 46 34 1.418 1.417Raleigh & Charleston_July 5.016 4.458 1.405 1,264 6.765 5.917 1.538 797 589 285 66 92 1.949 2.028Raleigh Sc Southport _July 8,372 7,082 5,058 4.096 14.058 .11.735 2.738 2,411 822 1,412 353 612 4,403 4.044Rap City In tlills&W_July 3.869. 2,468 2,287 2.359 6.567 6.543 3.218 665 545 581 105 261 2,201 2,486Raritan River duly 17,820 17,505 688 586 19.863 19.204 2.772 1.061 1:5790 1.214 260 424 4;075451 4.436Ray & Gila Valley _July 23.037 1.121 25,752 741
1 09
137
2
Reading Company—Atlantic City J'ne 66,331 59.319 132.614 114.884 207,904 182.037 35.993 52.159 19.067 17,707 3,160 1.961 90.589 80.825July 1 to J'ne 30-- __ 743.059 703,535 1.177,491 1.021,670 2.020.598 1,805.007 354,507 351.224 182.399 213,560 32.437 25.722 972,301 849,362(New fiscal year)_July 72.623 71.443 245.204 224.962 329,351 305.711 17.132 21,559 11.139 11.913 2.169 3,023 127,217 119.361
Catasau & Foglesv_July 13.094 25,883 167 152 13.539 26.453 1.704 1,320 1,653 177 5 5 3.619 4,254Central RR of N J J'ne 1.686.697 1.552.057 413,923 380,417 2,239.868 2.087.198 247.663 218.864 344.717 358,588 31,191 37,063 597,749 576.513July 1 to J'ne 30_ __ - 18.742.449 18.077.081 4.733,074 4.464.027 24.799,234 23,851.511 2.498,265 2,109.224 3.733,031 3.858.863 364,132 346.674 7.103.640 6.150.538(New fiscal year) _July 1.317,294 1,279.721 600.276 483,020 2.024,392 1.854,798 206.012 194.330 308.410 319.599 32.246 31,178 601.813 567.474Chester & Del Riv_July 13.196 13.287 15.368 15,732 1,226 2,629 3 3 4.877 5.636Gettysb 6c Harrisb_July 14.937 12.880 4.118 5.057 19.980 21.015 2.989 2.830 654 414 210 114 8.221 8.793Middiet'n & Humm July
Northeast Penn __Amy845
4.237
1.934
3.511
263
9.950
374
10.452
1,123
16.365
2.316
16.356452
2.947247
2.585 34 4 21.983146 7.093323Perkiomen July 48.137 53,166 9.027 9.187 58.762 64.046 4.331 3.366 125 379 14 14 15,169 14,400Phila & Ches Vail_ _Juiy 5,824 5.545 898 929 7.463 7.224 1.659 1,424 2 2 2.969 2.677Phiia & Read Ry July 2.552.844 2.480.167 663.362 626.724 3397,724 3.261.514 362.088 359,147 668,195 566,909 44.135 51.518 1.105,273 1,070,382Phila Newt & N Y_July 4,258 2.497 7,093 6,675 13.222 10.968 1.737 1.356 293 6 6 7.153 5.704Pickering Valley__ _July 429 465 720 842 2,404 2,642 5 2.502 1.079 1.054Port Reading July 66.711 58.054 69,065 68,340 10.637 8,540 187 1 30 30 ,19863 17,875Reading & Coln m . _July 16.903 17.092 10.911 10,735 29.722 29,773 5.077 7,096 350 680 78 88 14,104 13.552Rupert & Illoomsb_July 2.341 2,551 88 66 2,462 2.675 460 28 887 862Stony Creek July 5.648 6.804 533 300 6.446 7.382 1,890 711 2 2 2.214 2.253Tarnaq Hazle & No_July 1,404 1.893 1,404 1,893 413 109 1 1 581 559Williams Valley_ _ _July 1.140 1.116 1.008 1.304 2.317 2.629 679 597 40 24 1 1 1,323 966
Red River & Gulf _ _ July 2,741 2,055 172 112 2.469 2.561 147 337 55 75 411 326Red Riv & Rocky Mt_J'ne 75 931 75 931 416 128 638
July l to J'ne 30_ __ 8.769 11.825 8,769 11.825 3.226 5.412 1.192 2.452 6.647 5,829Reynoldsv & Falls cc...July 6.737 7,330 6.938 7.428 1.899 1.892 775 445 37 37 1,852 2.146Rich Freder & Potom-JulY 113,794 118,545 61,772 53.386 200.902 193.452 21,053 30,061 25,261 18.717 3.160 2,721 69.010 63,601Washington South _July 37,517 40.797 32.083 27,231 92,805 90.851 17.500 7.547 12,076 7,460 1,286 1.245 33.984 33.681
Rio Gran & EaglePass.rne 8,120 7,857 601 650 9.762 8,664 3.714 1,805 2,110 1,863 1.242 1,357July 1 to J'ne 30_ _ 98,514 114,919 7.726 8.243 112,343 124.938 24.566 24,537 21.980 27,631 15.959 15,058
Roanoke River J'ne 471 1.090 101 65 610 1.194 59 133 32 17 267 386July 1 to J'ne 30_ __ 11.164 9.578 1.224 906 12,852 10.940 947 1,059 328 106 3,333 3,603
Roaring Fork July 215 486 177 48 518 738 269 62 132 114 558 530Rock Island—
Chic R I & Gulf --July 144,896 129.449 55.410 61,305 216,170 205,532 35.941 45,261 15,775 15,621 10,582 8,202 77,511 82,051Chic R I & Pacific_JulY 2,837.942 2.985.190 1.685,397 1.740.598 4,854.587 5.038,586 828.782 865,834 740,222 648.438 161.149 155,926 1,954.339 L933;953300Morris Terminal_July 621 442 33 132 27 11 370 316
Total Company_ _July 2,982,838 3,114,639 1.740,807 1.801.903 5.071.378 5.244.560 864.756 911,227 756,024 664,070 171.731 164,128 2,032,220 2.015,897Rock Island Sou RR_ _July 1,232 540 6.559 6.488 7.848 7,091 462 266 311 220 82 115 2.010
Rock Island Sou Ry_ _July 5,489 922 9.903 1,045 15,460 1.969 2.1168 1,474 24 1,310 286 6,115 1,886Rockdale Railroad_ July 469 413 469 413 3 93 93Rockport Lang & N_ _July 561 523 155 96 838 703 283 217 3 17 287 251Roscoe Sny & Pac Ry July 1.643 3.962 988 2.894 3.046 7,281 2,254 1.170 1.417 207 54 26 1,927 1.971Rutland July 160.079 143.760 116.591 114.011 313,005 293,333 44.209 44,207 60,067 38.339 8.723 7.107 116,761 100,145Sabine & Eastern _July 634 685 634 685 175 507 36
2982 1381
Sabine & Northern_ _ _July 3,907 2,772 3,907 2.772 444 418 759 1,553 18 95 1.133 1,076Sacramento Val & E_July 586 10.151 325 630 999 10.901 353 750 210 190 718 1,421S aginaw & Ouach Rh, J'ne
July 1 to J'ne 30_ __ _836
7.491746
7,48331424
25329
8778,022
7807,915
1762.496
2402,436 1212,0341
St Johnsbury & L Ch_July 17,885 16,104 11,444 10.410 33,080 29,146 8,917 8,135 171 141 136 188 14.429 12.953St Joseph Valley July 1,493 947 2,721 2,374 4.395 3,571 692 799 403 486 40 42 1.905 1,672St Lawr & Adirond —July 24,763 27.524 29.240 32.714 56,845 61,791 9,148 4.228 1.610 2.616 423 344 29.961 18,411St Louis & Hann_ _ _ _July 15,871 10.609 6.054 6,047 23.396 18,101 7.614 6,187 2,518 2,514 227 217 15.559 6.512
_ _St Louis & O'Fallon July 13,974 35,802 300 300 14,364 36.192 1.157 2.205 3,068 6,140 89 95 2,033 3.305St Louis & San Fran_July 1.840.170 2.016,480 1,024,080 962.863 3,098.442 3.195.735 345.064 460.417 445.495 442,010 85,923 83,758 1.138.122 1,156.360Ft w & Rio Grande July 33.758 31.007 27,396 27.081 67,723 64,433 11,350 8,055 9,528 7,593 2.670 3,945 27.911 34,425Paris & tit Nor thJuly 13,381 5,588 4.123 3.958 18.337 10.326 4,691 1.315 1.900 858 122 226 3.778 5,897
l'or index to roads not appearing in alphabetical order, but given under some other system, see page 31.
Digitized for FRASER http://fraser.stlouisfed.org/ Federal Reserve Bank of St. Louis

SEPT., 1911.] RAILWAY EARNINGS 21
. TOTAL EXPENSESincl. General Exp.
NAME OF ROAD This Year Last Year8
NET OUTSIDE OPERATIONS TAXESFROM RAILROAD Gross Revenue Net Revenue Current PreviousThis Year Last Year This Year Last Year This Year Last Year Year Year
FINAL NET MILESCurrent Previous end of MonthYear Year This Last8 $ Year Year
Peoria Ry Term Co July 14.611 15.027 120 49 599 602 —478 —553 12 8
,Pere Marquette July 1024,944 993.806 335,932 378.703 40.582 41.035 —7.010 —584 56,212 59.209 272.710 318,909 2,331 2,328
Perla Northern July 701 567 —390 1.532 53 49 —444 1.482 9 4
Phila Bait & Wash_ _ _July 1.171.039 1,253.680 442,518 457,498 50.697 48.151 391.820 409.347 713 717
Phila Belt Line July 1.475 1,737 —510 —706 71 71 —582 —778 5 5
Pickens RR July 838 920 300 54 34 31 266 23 9 9
Piney Rh & Paint Cr_July 1,364 3.179 750 —837 79 79 671 —916 9 9
Pi ttsb & Lake Erie .. _July 630,830 678.422 759,115 850,153 1.044 871 —365 —464 30.000 27,200 728.750 822,488 215 191
Pittsb & Moon Run_July 3.430 3,765 8.409 6,916 175 125 8,234 6,791 5 5
Pittsburgh & SusqJ'ne 4,586 5.107 2,221 81 —9 111 47 2.100 34
July 1 to J'ne 30_ _-- 52.294(New fiscal year) July 3,327
74,7305,549
8.3291,328
—10.913 —195 —252 —37
1,336111
631111
6.7971.180
—11,544—364
1515
1515
Pitts Alleg & McK R_J'ne 9,021July 1 to J'ne 30____ 144.493
12,672125,553
—2.720—16,091
3.569 796 —1.31618.397 5,506 —1,564
3611.731
1191,122
—4.398—19.387
3,45017.275 1 1
Pitts Char & Yough _ _July 14.147 18.170 12,447 12,633 892 920 11,555 11.712 21 21
Pitts Cin Chic & St L_July 2.440,703 2,472,512 769,293 673,801 590 583 —1.237 —969 128.783 123.824 639,272 549.007 1,467 1,468
Pitts Shaw & North _ _July 71.475 95.169 25.669 12.468 1.585 1.578 24.084 10.889 240 240
Pollock & Ang Val Tr July 1.554 2,070 433 908 12 12 421 896 12 12
Port Huron Southern_July 988 1.123 256 244 39 42 217 201 3 3
Portland & Southeas_J'ne 2,304 2,620 —1,216 —630 20 20 —1.237 —651July 1 to inc :to 19.757(New fiscal year) July 2.316 1.869
4,714483 —18
20623 20
4,507459 —39
1818
1515
Portland Terminal_ __July 262 8.363 12,262 5,683 3,250 10,797 30
Potato Creek July 2.083 137 75 212 13
Potomac Fred & Pled July 2.574 2.965 2.136 1,229 200 166 1.936 1.062 37 37
Prescott & Northw July 7,778 6,828 9.145 5,143 299 252 8.845 4.890 41 41
Quanah Acme & Pee_ July 7.091 7,839 4.877 6.646 300 200 4.577 6.446 42 42
Rahway Valley Co_ _ _July 2.633 2.584 —373 60 392 380 —765 —320 10 10
Raleigh & Charlestonjuly 4.532 3.979 2,232 1.937 185 165 2.047 1.772 43 43
Raleigh & Southport_July 8,992 9,081 5,065 2.654 375 307 4.690 2.346 64 64
Rap City 81 Hills&W_July 6.436 4.982 131 1,560 125 125 6 1.435 33 33
Raritan River July 10.638 8.210 9,225 10.993 730 687 8,495 10.305 21 21
Ray & Ulla Valley July 5.299 20.452 225 20.227 6
Reading Company—Atlantic City J'ne 149.852 153,550 58,052 28.486 2,971 3,064 —4,101 —6.523 3.072 Cr23.312 50.878 45.275
July Ito J'ne 30 _ _ _ - 1,556.924 1,452,825 463.673 352,182 32.015 36.237 —59.164 —48.144 80.072 53,687 324,437 250.350 166 166
(New fiscal year) July 159.930 158.642 169.421 147,068 2.596 2.795 —4,071 —11.764 7.000 7.000 158,349 128,303 166 166
Catasau & Fogiesv_July 7,019 5,795 6.519 20,658 28 28 600 500 5.919 20.187 30 30
Central RR of N 1.278.685July I to J'ne 30— - - 14.198.995
1.252.30713.268.482
961.18210,600.239
834,891 188.112 172,281 31.400 —269.37510.583.028 1.873.370 1.790.113 75.286 —93.171
Cr186,717769.681
97.8481.174,924
1.179.3019.905.844
467.6679.314,932 633 667
(New fiscal year)_July 1.188.769 1,151,381 835,623 703.417 258.527 235,144 94.823 82.963 94.033 95.982 836.413 690.398 671 667
Chester & Del Riv_July 6,130 8,312 9.238 7.419 101 101 105 106 9.133 7.414 5 5
Gettysb & Harrisb_July 12.557 12.189 7.422 8.825 26 26 300 275 7.122 8.576 41 34
Middieen & Humm July 1.290 1.181 —167 1.135 1 1 8 18 —175 1,117 6 6
Northeast Penn _July 24.810 9.635 —8.444 6.720 88 88 200 200 —8.644 6.609 25 25
Perkiomen July 19,711 18.235 39.051 45.810 63 63. 1.250 1.100 37.801 44.774 38 38
Phila & Ches Vail_ _July 4.670 4,143 2,792 3.080 17 17 130 130 2.662 2.967 23 23
Phila dc Read Ry July 2,254,213 2,113,355 1,143.510 1.148.158 156,928 139,378 18.998 15.746 90.701 84,436 1,071,307 1.079.469 1,014 1,022
Phila Newt & N Y_July 8.921 7.382 4.301 3,585 61 32 300 300 4.001 3.318 21 21
Pickering Valley_ _ _July 1.087 3.560 1.316 —918 14 14 18 20 1,298 —924 11 11
Port Reading July 30.997 26.733 33.067 41.607 7,950 10.478 —1,678 —3,245 3.800 3.500 32,588 34,861 21 21
Reading & Colum_ _July 19,669 21.476 10.053 8.296 153 55 400 400 9.653 7.952 59 59
Rupert & Bloomsb_July 1.350 893 1.112 1.782 12 12 19 20 1.092 1.773 1 1
Stony Creek July 4.116 2.975 2.330 4,406 109 109 75 75 2.255 4,441 10 9
Tamaq Hazle & No_July 993 671 405 1.221 11 15 394 1.206 9 9
Williams Valley_ _ _July 2.049 1.646 268 932 3 3 56 55 212 930 11 11
Red River & Gulf _ _ _ _July 1,030 1,124 2,438 1,436 2.438 1.436 12 12
Red Riv & Rocky Mt_J'ne 72 1.257 2 —326 23 23 25 —349
July I to J'ne 30_ _ _ _ 12.079 14.570 —3.309 —2.745 279 279 —3.588 —3,024 1 1
ReYnoldsv & Palls Cr_July 4.968 4,716 1,969 2,711 94 94 1.875 2.617 25 25
Rich Freder & Potom_July 124.180 120.300 76.721 73.151 1.000 200 75.721 72,951 83 83
Washington Sou th _July 67,342 51,903 25,462 38.948 3.244 2.344 22.217 36.603 35 35
Rio Gran & EaglePassJ'ne 9.060 5,844 701 2,820 180 83 327 552 374 2.348
July I to Inc 30---- 76.136 77,273 36.206 47,665 581 1.468 366 204 3.933 6.663 32,633 41.206 28 28
Roanoke River J'ne 578 763 32 430 30 8 1 421
July I to J'ne 30-- 7,061 7,006 5,790 3,933 363 341 5.426 3,592 10 10
Roaring Fork July 1,035 845 —517 —107 35 40 —552 —142 12 8
Rock Island—Chic R I & Gulf _ _July 148.772 158,921 67,397 46,611 629 1,084 --348 --295 9.501 8.592 57.548 37.722 476 470
Chic R I & Pacific_July 3,823.900 3.738.608 1.030.687 1.299,977 43,868 37.873 --10.475 --10,322 206.774 237,550 813,437 1,052.104 7,551 7.395
Morris Terminal__ _July 456 486 164 --43 30 32 134 —75 3 3
Total Company_ _July 3,973,128 3.898.015 1.098.248 1.346.545 44,497 38,957 --10,823 --10,617 216.305 246,174 871.119 1,089.751 8.030 7.868
Rock Island Sou RR_ _July 3.702 3,367 4,145 3,723 4.146 3,723 18 18
Rock Island Sou Ry_ _July 11.478 2.373 3,981 --404 --39 500 600 3.442 —1,004 56 50
Rockdale Railroad _ _July 97 116 371 297 2 2 369 294 3 3
Rockport Lang lfs N_ _July 591 487 247 215 17 16 229 198 5 5
Roscoe Soy & Pac Ry July 6,238 3.946 --3,192 3.335 96 93 --3,289 3.241 49 49
Rutland July 236,266 195,271 76.738 98,062 12.702 11,213 64,036 86.849 468 468
Sabine & Eastern.. _ _July 573 1,020 60 --335 16 16 44 —352 6 6
Sabine & Northern_ July 2.439 3.524 1,468 --751 56 46 1.411 —801 39 39
Sacramento Val & E_July 1.867 2,937 --867 7.964 397 242 --1,265 7.722 15 15
Saginaw & Ouach Riv J'ne 389July Ito J'ne 30- - - - 5,649
3895,726
4872.372
3912,189
10120
10200
4772.252
3811.989 3 3
St Johnsbury & L Ch_July 24,422 21,974 8.658 7.172 800 800 7.858 6.372 125 125
St Joseph Valley July 3.157 3.085 1,238 486 300 200 938 286 43 43
St Lawr & Adirond_ _July 43.527 26,299 13,317 35.491 550 388 12.767 35.103 65 65
St Louis & Hann_ _ _ _July 28,840 16,127 --5.443 1,973 650 649 --6,093 1.323 103 103
St Louis & OTallon_ _July 7,594 13,221 6.769 22.870 1,350 750 5.419 22,120 8 8
St Louis & San Fran_JulY 2,115,228 2,242,590 983,213 953.145 154.715 112.585 828.498 840.559 4,731 4.731
Ft W & Rio Grande July 54,586 57.974 13.137 6,459 2,795 2.994 10.341 3.465 235 195
Paris & Ut North._July 11,328 8,968 7.008 1,358 375 375 6.633 983 16 16
For index to roads not appea ring in alphabetical order, but given-under some other:system, see page 31,
Digitized for FRASER http://fraser.stlouisfed.org/ Federal Reserve Bank of St. Louis

22 RAILWAY EARNINGS Lxxxxiii.
St L & San Fran (Con.)- $St L San Fr & Tex_July 54,520
Total CompanyJuly •1,941,829Chic & East III_ __ _July 870,144New On Tex & Mex July 69,898Beau Sour L & WJulY 32,804
Orange & N W __July 1.758Rio Grande July 407StL Brownsv&Mex July 85,358
St L R Mt ec Pac Ry_July 13.330St Louis Southwest_ _July 393,555St L SW Ry of Tex July 180,680
Total Company. _July 574,235Eastern Texas __ _July 3,992Paragould Sou E. _July 2,381Pine Bluff Ark Riv_July 1,212Stephenv N&S Tex _J'ne 3,556July 1 to J'ne 30- - - - 61683(New fiscal year)_JulY 4.200
St Louis Transfer__ JulySt Louis Troy & East_JulySt Marys & Kingsi'd_J'ne
July Ito J'ne 30_ _ _ _St Marys & Western_JulySt Paul & Des Moines JulySt Paul Bdge & Term _J'ne
July 1 to J'ne 30_Salem Falls C'y & W_J'ne
July 1 to J'ne 30_Salem Winona & So_ _JulySaline Bayou JulySaline River JulySalt Lake & Los Ang_JulySalt Lake & Mercur_ _JulySan Ant & Aran Pass_J'ne
July 1 to J'ne 30_ _ _ _July 1 to J'ne 30_ _ _ _
San Diego & Cuyam_JulySan Diego Southern_ _JulySan Luis Southern_ JulySan Ped Los A & S L_JulySandy Riv& Rang L. _J'ne
July 1 to J'ne 30_ _ _ _Sanford & Everglades J'ne
July 1 to J'ne 30_ _ _(New fiscal year) .July
Santa Fe Raton & E_ _J'neJuly 1 to J'ne 30_ _ _ _
Sardis & Delta JulySavannah & Statesb_JulySayan Augusta & N. _JulyScottdale Connecting_J'ne
July 1 to J'ne 30Seaboard Air Line_ JulySeattle Southeastern _J'ne
July 1 to J'ne 30_ _ _Sheffield & Tionesta_JulyShreve Hous & Gulf. _JulySib L Bistenau & Sou _J'ne
July 1 to J'ne 30_ __ _Sierra Ry of California J'ne
July 1 to J'ne 30_ _ _ -(New fiscal year)_July
Silver Peak J'neJuly 1 to J'ne 30_ _ _ _
Silverton J'neJuly I to J'ne 30_ _ _ _
Skaneateles Railroad _J'neJuly 1 to J'ne 30_ _ _ _(New fiscal year) _July
Sligo & Eastern JulySouth Buffalo JulySou Caro & Western_ _JulySouth Dakota Cent. JulySouth Georgia JulySouth Shore JulySouthern July
Alabama CH South _JulyAshev & Craggy MtJulyAugusta Sou thern_JulyBlue Ridge JulyCumberland JulyDanville & West.. _JulyGeorgia Sou & Fla_JulyHartwell JulyMobile & Ohio JulyNorthern Alabama_JulySou Ry in Miss.__ _JulyTallulah Falls JulyVirginia & Southw_July
Southern Iowa Trac _ _JulySouthern Pacific-
Arizona & East July 126,420Corvallis & East_ July 18.703Galv Han & S A__-July 5,38 ,655
For index to roads not appearing in alphabetical order, but given under some other system, see page 31.
FREIGHT & PASSENGER EARNINGS TOTAL EARNINGS MAINTENANCE EXPENSES TRAFFIC & TRANSPORTAT'N EXP'SNAME OF ROAD FREIGHT PASSENGER incl. Other Revenue Way & Structure Equipment TRAFFIC TRANSPORTAT'NThis Year Last Year This Year Last Year This Year Last Year This Year Last Year This Year Last Year ThisY'r LastY'r This Year Last Year$ $ $ $ $ $ $ $ $ $ $ $ $55,836 29.421
2,108,911 1.085,020799,834 264,40158,878 18,50730,774 6,4308,526 1,616
85772,854 54,60520,146 3,724417,447 116.342244.571 85.295662.018 201.6374,150 4941.800 2,0051,098 1,2162,396 2,778
50.331 24,9452.753 3,167
17,194 23.591242 160 274
2,599 2.290 4,1544,836 4,59628,092 39,676 16.436
11,914 9.571 3,029101,859 99,819 35.5312.878 1.415 891
2,222 2,053 4662,543 2.686 25,9502,354 4,030 349
209.058 21,555 93.6852,836.115 2.724.966 1.089,513159,248 173.302 115.1859.135 6,406 7,6279.158 4.832 9,3871.144 2.364
431,693 326,284 253.4227.166 6,588 4,27192.459 99,129 48,063
287 12114,903 11,173
234 621 76
129 72
3.455 2,857 4551,262 855 2023,315 2.632 2.240825 509 1,035
1.028.638 972.113 412,495
382.143 37322.492 4,2314,447 5,140 1,7342.113 2,067 945.615 4.092 29289,675 46.646 3.72326,110 26.781 10.801283.246 290.234 106.56229,336 25.755 11.727
494 686 2969.413 9,915 4.128
2,634 2.421 268
255 1.126 211.875 13.423 1,264
40,337 37.900 3.9902.373 2,822 3385,530 4,507 1723.484 29,608 1001,426 1.0328,518 13,873 6,44415,628 16,954 5,767
1702,869,437 3.037,208 1,532,617211,328 215.857 113,258
258 3446.300 6,288 4.6925.323 6,271 4,5212,466 1,837 70416.973 14.534 6.28192.195 103,110 73.577
567 585 452640,561 600,800 126,377
29,313 36.752 6,87334,427 32,447 33,4565,402 5,183 7,224
765 1,312
108,874 75,274 15,308
103,639 32,58318.635 22,797
491,154 267,209
13.038
305346
90,359 73,166 16,055 12,701 24,002 9.457 2.609 2.845 40.988 41,3831.006,940 3.274,861 3,343.660 377,160 482,488 480,925 459,918 91,324 90,774 1,210,799 1,238,065242,701 1,226,696 1.135,038 137.566 131,045 201.872 167,886 30,410 32.656 411,739 393,62013,269 95.120 78,732 18,040 16,381 11.341 11,222 3,975 5,415 44,904 36,0783,954 42,075 37.649 9,149 5.757 6,044 3,807 1,776 2,449 20.573 15,6442.080 5,093 12,829 2,677 2,762 855 2.008 268 824 5,639 4,398
1,398 258 148 30 47043.285 155.257 126,318 33,956 38.184 9.700 15,055 3,012 2,127 58,034 54,7134,822 18,375 26.438 6.616 5,761 5,933 5,090 774 761 5,720 7,296
112.334 536,136 553,992 40.150 61.663 96.408 96.543 23.968 24,221 137,015 152,14291.131 285.090 356,494 48.374 110,791 71,691 58.177 11.489 9,240 121,320 155.495
203,465 821,226 910.486 88,524 172.454 168.099 154.720 35.457 33.461 258,335 307,637598 3.816 5.220 913 863 142 93 91 97 1,393 1,451
1.838 4,827 4.351 1,906 2.120 105 104 37 81 1.813 1,6841,023 2,526 2,225 843 974 44 60 33 33 1,199 1.1521.586 6.914 4.388 3.461 1.705 242 1,114 176 202 4,610 2,037
,16,943 95,317 71,716 47,484 10,824 4,451 8,201 2.098 1,772 28,605 25.6932,024 8,062 5,233 2.685 3,056 397 279 256 130 4,151 2,397
30,996 27.556 2,788 2,018 3,614 1.504 203 157 15.050 14.95717,194 23.591 2.240 3.294 7,184 6,276 55 56 3.979 4,364
340 563 557 132 446 73 45 154 1422.752 7,299 5,650 1.376 1,325 1.065 572 1.774 1,6434.836 4.596 278 444 831 804 1,913 1,605
13,847 47,189 53.426 8,451 8,270 4.898 8,580 1.791 2,268 19,029 18,7489,596 8,912 3,418 711 1.428 1,159 4,221 4.222145.092 19,352 14,089 63.631
2.695 15.314 13,894 955 2,636 3.207 1,281 47 4,11625,712 142,310 134.328 24,411 28.665 20.681 15.160 38,403 45,042779 3,840 2.283 1,156 315 356 151 379 1,146 1,117
760 1,199 791 885 131 185 172 27793 2,722 1201 1,031 937 649 660 1.637 1,713
25.649 28,493 28.335 889 1,018 776 1.034 377 4,036 3,663 5,237205 2.861 4,237 516 1,090 678 238 22 1.268 1,506
78.304 322.744 312.461 119.376 65.913 Crll .329 62.182 4,859 4,548 118,906 117,055993.893 4.164,819 3.936.286 902.523 653.261 521.448 567.976 61,321 54.527 1.571.530 1,480,49995.427 294,872 287.965 67.247 48,650 39,887 41.613 5.473 4.798 111.434 109.8535.071 17,864 12,286 2,927 2.214 2.237 1,771 70 14 5,110 3,6137,423 19.547 13.239 3,000 1,947 2.291 1.783 321 351 6,034 5.025
1,722 2.947 252 124 296 246 39 93 1.152 772265,299 728.769 626,820 143,278 176.132 148,926 86.060 29,811 26,426 288,775 201.8444,509 12.622 12,374 1,885 2.477 1.159 368 21150.283 153.330 162.735 27.720 32.711 16.180 16,226 2.882
3.02645451:Mg 51:148
314 143 125 142 27 6 73815,1g 11,2A 83338
142 32066
83 15 15 8,9IE360
10,3391 .049
52 497 1.306 184 212 380 249 40 79 465 360344 6.625 6.291 1.146 1.026 2.460 2.464 432 209 5,428 3,02286 1.464 941 672 791 284 24 333 610
1,800 5.915 4.799 78 515 531 585 36 47 1,557 1,485390 1,861 900 538 208 855 10 612 250
1,9031,988
2.05018,767
7424.645
6596.741
35438 I8g 1 ,29714.123
1,21411,646
366,104 1.636.165 1.502,245 246,487 235,947 237,421 229.396 51.682 56.836 583.974 539,2142.236 375 635 39 576 161 3 13 659 302528 22.623 4.799 11.096 1.470 3.368 2.118 50 37 12,589 3.554
1.744 6.567 7,272 1,500 1.132 293 863 559 486 803 794235 2,548 2,348 299 250 282 329 41 49 421 524341 5,988 4,480 1.482 1,829 848 146 324 309 1,738 1,5073.112 94,526 50,598 19,352 19,853 6,065 6.033 3.667 3,555 20,780 16,605
10.197 38.605 39,007 8.391 18.873 4.182 Cr7,730 350 357 8.928 5,073113.472 409.960 425,314 102.459 98.346 32,693 27.348 4,365 4.V3 1E3835 89.96710,818 42,753 38,464 5.043 6,967 3,004 2,595 342 7.2399 919 1,183 445 113 120 657
81802
5,429 14.833 16.692 848 855 1,032 2.791 76 20 10,595 9,622136
2.464257
13.0231.28915.888
3003.767
1.0973.131
17530
147 731 9. 288 1 0g
2794.012
3.24248,056
3,23145,823
36012,209
5475.974
3074,701
2.123 8.254
920
1T.70P91.092
13.9371349 2.998 3,430 443 1.750 458 179 10 5,547 4.518 341 982 332 320 678 826150 47,658 69,599 6.191 8,497 4.705 6.496 195 200 20.543 31.419
2.466 288 77 82 1,8729,289 17.139 25.622 3,266 1,193 1,759 1,763 522
36,041 22,685 23,711 3,054 6,855 1,363 2.005 257 25971
34;2634 4 5:831211
170 31 26 91 6281.399.051 4.797.307 4,786,651 556.679 595,654 749.244 873.911 134.438 118.199 1,698,292 1,668,461107,947 356,344 353.362 45.867 47,813 60.135 89.073 11.424 10.725 114,397 108,892
258 344 8 8 9 9 132 2584,177 12,004 11,432 2.416 2.656 2.334 1,199 184 187 5,530 5,0884,343 10,799 11.304 1.944 2.011 1,364 855 160 183 4.900 4,397462 3.245 2,329 735 407 105 144 90 102 976 865
6,292 24,255 21,842 3,729 3.156 2.183 1.618 150 154 6.740 5.52265,373 191.400 191,990 20,285 20.190 35.937 40.427 6.469 5,997 76,372 76,840
488 1,086 1,142 179 170 156 68 3 - 776 817118.843 896,703 838,271 116,564 110,188 159.646 159.499 32.747 33.156 328.167 311,5066,081 37,390 44,030 5.197 6.938 4,783 7.628 166 129 17.150 20.325
30.139 75,525 67,894 24,507 23.764 8,365 5,671 2.041 2.387 33,370 32.8635,29912.929
14.704128,203
11,598
91.453
1.96716,182
1.55511,781
1.600
26.045692
21.19180
1.815106
1.407 3;68573745 3;22122552.235 1,609 40 37 1.633
3
33.009 168,323 145,571 18,521 27,532 10.455 11,937 2,631 1,746 44,296 37.85623,029 43.748 43,363 11.014 11.234 1.967 2.259 328 296 8.858 7.275229.287 826,420 762,196 109.652 129.464 127,597 128.030 27,932 29,637 310,228 299.126
Digitized for FRASER http://fraser.stlouisfed.org/ Federal Reserve Bank of St. Louis

SEPT., 1911.] RAILWAY EARNINGS 23
TOTALNAME OF ROAD
St L & San Fran (Con.)—
EXPENSES NET OUTSIDE OPERATIONS TAXESincl. General Exp. FROM RAILROAD Gross Revenue Net Revenue Current PreviousThis Year Last Year This Year Last Year This Year Last Year This Year Last Year Year Year
$
FINAL NET MILESCurrent Previous end of MonthYear Year This Last
$ Year Year
St L San Fr & Tex_July 88,196 69,776 2,163 3.389 1,360 1,304 802 2.084 243 132
Total Company_ _July 2,269,338 2,379,308 1,005,521 964,351 159.245 117.258 846,274 847.091 5,225 5.074
Chic & East 111___ _July 823,036 764,308 403,660 370.730 7,204 7,268 —2,048 —3.754 38,500 39.310 363,112 327,665 1.275 1,276
New Oct Tex & Mex July 84.646 76.143 10,474 2.589 1.882 10.474 706 264 264
Beau Sour L & WJuly 40.490 30.296 1,584 7,352 625 621 959 6.731 118 118
Orange & N W _ __ _July 9,803 12,224 —4.710 605 439 455 —5.149 149 61 61
Rio Grande July 937 460 75 385 22
StL Brownsv&Mex July 112.640 117,779 42,617 8,539 4,500 4.000 38.117 4.539 509 494
St L R Mt & Pac Ry_July 21,302 20.864 —2,927 5.573 —2.927 5,573 105 105
St Louis Southwest_ _July 319,844 356,000 216.291 197,991 2,656 3,594 —777 —682 19,564 18.933 195.950 178,376 796 773
St L SW Ry of Tex July 268,253 349.197 16,837 7.296 496 540 —257 —172 10,000 8.333 6,579 —1.209 703 703
Total Company_ _July 588,097 705.197 233,128 205.287 3,152 4.134 —1.034 —854 29,564 27.266 202,529 177.167 1,499 1,476
Eastern Texas July 2.873 2.789 942 2.430 200 200 742 2,230 30 30
Paragould Sou EJuly 4,158 4,281 669 69 292 270 373 —200 37 37
Pine Bluff Ark Riv_July 2,411 2,490 115 —265 174 174 —58 —439 31 31
Stephenv N&S Tex_J'ne 9.421 5,684 —2.507 —1.296 360 125 —2,868 —1,421July 1 to J'ne 90.145 51,952 5,171 19,764 3,034 1,363 2.136 18,400 75 43(New fiscal year)_July 8.182 6,298 —120 —1,064 200 125 —320 —1.189 75 43
St Louis Transfer__ July 23,113 19,995 7,883 7,560 933 950 6,950 6.610 6 6
St Louis Troy & East _July 15,510 16.169 1,683 7,421 900 900 783 6.521 25 21
St Marys & Kingsl'd_J'ne 461 743 101 —186 59 59 42 —245July 1 to J'ne 30_ 5,408 4.469 1,891 1,181 710 618 1.181 562 10 10
St Marys & Western_July 3.022 2,853 1,813 1,742 68 68 1.744 1.674 16 16
St Paul & Des Moines July 35,119 39,682 12,069 13.744 1,450 1.400 10,619 12.344 121 121
St Paul Bdge & Term_J'ne 9.518 6,384 78 2.527 316 43 316 43 396 356 —1 2.214July Ito J'ne 30..._ 100.954 44.138 4.265 4,265 5,941 90.747 21 21
Salem Falls C'y & W_J'ne 5,335 8,474 9.978 5,420 2,024 97 7.953 5,323July 1 to J'ne 91.603 97.673 50.707 36,654 4,002 2,157 46.704 34.497 64 64
Salem Winona & So_ _July 3,219 1,792 621 490 621 490 25 21
Saline Bayou July 1,144 1,398 —384 —199 46 43 —430 —243 16 16
Saline River July 3.602 3.352 —879 —1.150 46 55 —925 —1.206 19 19
Salt Lake & Los Ang_July 9,075 13,191 19.418 15,144 276 268 19.142 14,876 15 15
Salt Lake & Mercur_ _July 2.778 3.191 82 1.046 85 85 —2 961 12 12
San Ant & Aran Pass.J'ne 241.433 258,695 81,311 53,773 14.985 10.663 66.326 43,110July 1 to J'ne 30_ _July 1 to J'ne 30_ _ _
3.180.560233.550
2,865,309213,535
981.25861.322
1.070.97674.429
132,98511,000
111,1639.000
851,27350.322
959.81265.429
727727
727727
San Diego & Cuyam_July 11,124 8,202 6.740 4,084 503 200 6.240 3.884 25 25
San Diego Southern_ _July 12,814 10,058 6.733 3.181 560 440 6.173 2.741 49 50
San Luis Southern_ _ _July 2.157 1,821 —434 1,126 100 —534 1.126 31 15
San Ped Los A & S L_July 627,917 506,954 100.851 119,866 28,204 15,769 —2.506 —3,263 24,975 24,605 73.370 91.997 1.113 1,105
Sandy Riv& Rang L. _J'ne 8.333 7.615 4.288 4.759 191 143 4.096 4,615July 1 to J'ne 30.... 106,172 109.983 47.158 52.751 2.243 1.727 44,914 51.023 103 103
Sanford & Everglades J'ne 663 911 —349 —767 25 25 —374 —792July 1 to J'ne 30 10.388 11.133 4.943 137 300 125 4.643 12 10 5(New fiscal year)_July 465 1.074 —308 —978 25 25 —333 —1.003 10 5
Santa Fe Raton & E. .J'ne 1.371 1,013 —874 293 —874 293July 1 to J'ne 30_ 12,746 8.222 —6.120 —1.931 —6,120 —1.931 19 19
Sardis & Delta July 1.890 2,014 —425 —1,072 79 54 —504 —1,127 13 13
Savannah & Statesb_July 2,888 3.271 2,027 1.527 242 246 2,784 1,280 33 33
Sayan Augusta & N. _July 2.596 720 —735 179 220 —956 179 38 25
Scottdale Connecting_ftr2 2,085 1.918 —182 132 6 21 —188 110July 1 to J'ne 30-- 19.308 18.573 575 194 200 186 374 7 1 1
Seaboard Air Line_ July 1,171,513 1.106,270 464.651 395.974 9,547 5,394 150 —2.913 72.000 65.000 392.802 328.061 3.046 3.027
Seattle Southeastern _J'ne 2,022 605 214 —230 25 69 189 —299July 1 to J'ne 30_ _ 28,835 8.232 —6.212 —3.433 685 669 —6,898 —4.103 6 6
Sheffield & Tionesta_July 4.504 4,607 2,062 2.665 160 160 1,902 2.505 34 34
Shreve Hous & Gulf_ _July 1,143 1,250 1,404 1,098 30 40 1.374 1.058 10 10
Sib L 13istenau & Sou _J'ne 4,857 4.160 1.131 320 170 131 961 188July 1 to J'ne 30_ 55.464 51.066 39,061 —467 1.558 1.619 37,503 --2.086 28 28
Sierra Ry of California J'ne 23,851 18,030 14.753 20.976 1.500 1.120 13.253 19.856July 1 to J'ne 30..... 273,031 236.808 136.929 188.505 17,973 16,972 118.955 171.532 75 75(New fiscal year)_July 16,418 18,202 26.334 20,262 1.700 .1,538 24.634 18,723 75 75
Silver Peak J'ne 1,316 1.054 —396 128 75 100 —471 28July 1 to J'ne 30_ _ _ _ 13,697 14,527 1,135 2.164 683 1.272 452 892 17 17
Sil ver ton J'ne 962 2,519 —705 --1.229 63 96 —769 —1.325July Ito J'ne 30... _ 14,156 14,835 —953 1.052 763 1,153 —1,716 —100 17 17
Skaneateles Railroad _J'ne 2.224 4,106 1.018 —874 Cr45 213 1.063 —1.088July 1 to J'ne 30_ _ _ _ 35,251 31.966 12.804 13,856 1,395 1.511 11.409 12.344 5 5(New fiscal year) .July 2.451 3,170 547 259 116 130 430 128 5 5
Sligo & Eastern July 1,359 2.135 4.188 2,382 46 48 4.141 2,333 12 12
South Buffalo July 32.569 47,875 15,088 21,723 800 800 14.288 20.923 36 35
Sou Caro & Western_ _July 2.565 —99 50 —149 38 --
South Dakota Cent_ _July 11,384 9.381 5,755 16,240 900 800 4.855 15.440 102 102
South Georgia July 8,896 14,873 13.789 8.838 522 477 13.266 8.360 77 77
South Shore July 491 1,086 --491 —916 4 5 —495 —921 2 2
Southern July 3,284,186 3.394.096 1,513.120 1.392.555 68.536 95,196 —1.884 5.251 196.773 166.717 1.314.461 1,231,088 7.076 7.050
Alabama (It South_July 240,537 265,378 115.807 87.984 2,566 2,628 —666 —503 14.748 12.122 100.392 75.358 309 309
Ashev & Craggy MtJuly 154 276 104 68 21 22 82 46 4 4
Augusta Southern _July 11.057 9,717 947 1,715 500 503 447 1.212 82 82
Blue Ridge July 9,300 8.399 1.499 2.904 441 434 1.058 2.470 44 44
Cumberland July 2,114 1,731 1,131 598 24 24 1,107 574 12 8
Danville & West_ _July 13,653 11,211 10,602 10,631 1.174 950 9,427 9,681 83 83
Georgia Sou & Fla_JulY 147,707 152,067 43.693 39,923 9,407 8,598 34.286 31,325 395 395
Hartwell July 1.219 1.149 --133 —7 50 43 —183 —50 10 10
Mobile & Ohio July 668.006 645,894 228.697 192.377 1,348 1,706 —1.629 —2.206 24.595 23,660 202.473 166.510 1.114 1.114
Northern Alabama_July 28,142 35,947 9,248 8.083 2,589 2.420 6,659 5.663 112 112
Sou RY in Miss- —July 71.806 68.026 3.718 --132 5.216 4,592 --1.498 —4.724 280 280
Tallulah Falls July 8,005 6,025 6.698 5,573 400 275 6.298 5.298 58 58
Virginia & Southw _July
Southern Iowa Trac _
85,581
3,623
62,664 42.621
--1.387
28,788 4,560
220
4.357 38.061
—1.608
24,431 24204 .1.!
Southern Pacific—Arizona & East_ _July 85,026 82,408 83,296 63,163 1.151 185 4,700 4.718 78.782 58.444 354 315
Corvallis & East _July 23,189 21.834 20,558 21,528 1.750 1,666 18,800 19.862 140 140
Galv liar & S A. _ y 600,958 615.108 225.462 147,088 8,353 8,569 —5,165 —4,377 30.442 29.000 189.854 113,711 1.338 1,338For index to roads not appearing in alphabetical order, but given under some other system, see page 31.
Digitized for FRASER http://fraser.stlouisfed.org/ Federal Reserve Bank of St. Louis

24 RAILWAY EARNINGS [VoL. Lxxxxm.FREIGHT & PASSENGER EARNINGS TOTAL EARNINGS MAINTENANCE EXPENSES TRAFFIC & TRANSPORTAT'N EXP'SNAME OF ROAD FREIGHT PASSENGER incl. Other Revenue Way & Structure Equipment TRAFFIC 7'RANSPORTA7"NThis Year Last Year This Year Last Year This Year Last Year This Year Last Year This Year Last Year ThisY'r LastY'r This Year Last YearSouthern Pacific—Con.
$ $Hous & Tex Cent_ _July 314.041 315.491 160,392 143.059 509.493 493.132 93.948 68,964 64.284 61.781 18.974 17,359 202.382 207,678Hous E & W Tex_ _July 57,362 79,565 32,728 32.753 96.269 118,018 19.839 21.044 11.377 11,205 1,794 826 29.282 36,769Iberia & Vermilion _July 3,169 1,767 1,807 1,469 5,227 3,489 689 1.134 174 91 106 112 1.445 1,200Lake Charles & Nor July 5.254 9,570 2.295 2.856 7.995 12.912 2.955 1.656 750 527 35 51 2.907 3,379Louisiana Western_July ' 92,941 85,962 56,516 52.065 156.488 145,861 22.366 14.540 27.353 30,192 7.198 5.744 48.863 44,396Morgan's La & Tex July 214,162 210.710 106.497 97.076 338,638 327.619 48.463 50.894 51,061 54,896 12.982 9,990 134,116 126.558Pacific System_ _ _ _July 4.172,399 4,426.825 3.044.285 1142.710 7,731,470 8,116,575 1,067.720 947.957 878.623 989,695 172.473 171,170 2.102,277 2,066.247Texas & New Ori_ _July 185,233 201.889 90,812 88,667 2 .134 308,226 51.924 52,320 52,603 54.572 6.716 8,169 108,140 109.337Total Company_ _July 5,698,339 5,945,207 3.817.921 3.845.980 10.179,205 10.476.962 1,447,091 1,326,739 1.226.244 1,345.185 251,169 245,100 2,992.794 2,939.819Coos B R' burg & E _July 4.472 5.903 3.430 3.263 8,277 9.654 2.031 2.447 524 1.059 12 60 2.138 2,220Hearne & Bra Val_ _July 500 272 524 349 1,092 688 364 248 8 349 16 26 757 647Houston & Shreve_July 14,178 16,787 6.191 6.428 21,460 24,261 3.894 3,080 543 284 439 378 6,599 7,578Southern Ry & Navig July 417 418 50 1 100Southwestern Ry__ __July 1,673 719 353 784 2.173 1.643 757 449 177 102 78 35 1.177 1,170Spokane & Brit Col_ _July 1.324 1.109 173 89 1,537 1.277 2.722 2,896 940 2.815 23 30 1.050 1.358Spokane & Int Emp__May 25.656 43.776 51.845 59,979 82.139 109.235 15,266 34,221 8.938 7.246 1,383 2.559 76,689 28 010July I to May 3L..__ 377,982 431,738 566,220 648.429 997,945 1.137,450 155,285 206.806 106.399 64.409 21,379 21.631 313.522 305,753SpokaneInternati__ _July 34.859 62.896 23.879 23,083 64,099 90.597 16.953 19.269 5.503 5.005 2,098 2,058 22.688 24.768Spokane Portl & Seat J'ne 237,648 193.460 182.522 90,045 506.681 366.240 42,804 90,008 58.169 62,867 7.974 6,087 96.154 160,287July I to J'ne 3O- _ - _ 3.217.045 2,525,337 1.297,694 820.799 4.819.464 3,566.291 545.495 653,868 377,733 359.553 62,019 41.977 1,189,859 1.252.310(New fiscal year) July 218,852 263.831 180,888 85,898 422,538 363.058 41,976 54.245 39.504 22.054 6,478 3.414 101,070 117,534Stand & Hernando__ _July 6,601 6.145 167 155 7,582 7,440 2,289 1,424 1,968 1.225 2,193 2,309Stanley Mer & PhillipsJuly 6,371 6.674 600 593 7,192 7,508 2,307 1.428 4,620 3.534 168 126 3,285 4.931Staten Island July 2,070 1.583 25,249 24,840 28,342 27.557 514 29.595 1.915 4,058 . 400 274 11,138 12.859Staten Island R T__ _July 45,225 52,726 31.105 32,315 78,809 90.048 2.340 11.413 6.565 5.196 725 488 24.129 25,086Sugar Land J'ne 10.728July 1 to J'ne 30_ ___ 57,635
2.16033.531
60596
20 10.817 2,214 1.023 1,826 9,622 628249 58,889 35.303 7,091 15.622 20.144 10.458 1957262 17:5?,343s3 966
8,659(New fiscal year)_July 6,565 1.416 60 19 6,655 .1.476 1.205 475 1.144 1.175 10 750Sumpter Valley July 19.459 15,365 5,955 4.625 25.477 21.624 5.631 5.552 2.642 3.284 7.138 5.248Sumter & Choctaw_ _June 3,502 3.181 510 380 4.834 3,666 385 1.606 4.299 8.814 77 32 1.461 1.831July 1 to J'ne 30_ _ _ _ 50.178 46.643 6.880 4,721 59.973 53.263 9.958 12.006 17.266 13.694 686 194 18,136 16,092(New fiscal year) _July 3.618 4.172 732 635 5.105 4.952 1.077 269 1.608 1.126 70 51 1.246 893Sunset July 78.968 66.707 18,340 17,993 100.372 87,726 10.089 7.960 1.181 1,477 26 31 21.254 15.879Susquehanna & N Y_July 20,599 17.858 3.429 3,738 25.893 22.392 3.801 4.482 4,542 4.481 490 632 8.997 9.049Susq Blooms & Berw_July 7,779 10,470 1,411 1,611 9.339 12.344 1,321 2.185 484 667 2,670 3.471Sylacauga & Wetump July 2,602 1.945 2,602 1.945 510 687 661 686 1.721 1,737Tallassee & Montgom July 1.734 1.175 888 642 2.628 1.824 1.002 374 8 15 33 496 602Tampa & Gulf Coast_May 2,040 1,815 3,968 660 212 107 931July 1 to May 3L_ 20.940 11,397 32,566 7.412 1,126 1,105 9.379Tampa & Jacksonv _ _July 3.979 5.436 718 502 5.003 6,130 1.852 1.531 852 352 222 115 2.879 1,976Tampa Northern J'ne 8,014 9.081 2,750 1.936 12.056 12.702 3,845 1.245 2,351 3,364 168 116 3,355 2,752July 1 to J'ne 30_ _ _ _ 99.134 111,301 31,519 21.158 150,210 156,116 30,805 22,870 20.763 21,952 2,195 2.042 38.833 34.723Tenn & Cumb River_ _July 521 248 293 258 920 605 239 205 220 45 250 200 309 312Tenn & North Caro .July 3.181 3,548 1.717 967 5,010 4,562 1.360 678 142 63 9 13 1,913 967Tenn Ala & Ga July 5,801 2,818 9,701 4,849 1,793 1,026 4,255Tennessee Central _ _ _July 91,253 77.608 38,796 35,390 137.013 120.099 21,665 14,751 18.027 10.580 5.175 5.057 46,423 33,559Term RR Assn of St L July 238 272 197,324 198.399 34.079 24.779 25.336 16.344 585 613 68.405 76.404St L Mch Bdg & TerJuly 246 5.725 120.470 150.705 31,335 26.632 8.083 10.485 385 390 67.986 61.471Texas & Pacific July 702.544 719.362 344,100 348,737 1,115,716 1,133,015 147,897 173,941 244.265 299.415 21,763 18,075 493,101 523,214Denison & Pac Sub July 3.566 337 227 193 4,282 560 318 190 344 9 1.537 1.524Opelousas (I & N E_July 2,249 2.657 1.277 1.457 3,882 4,642 1,940 2,319 2.016 3.180 352 304 2,038 2,728W'd Min W & N W_July 4,988 4.329 5.670 5,630 11,685 10,886 1,108 1,462 504 1,559 118 191 2.692 2.696Tex Ark & Louislana_July • 309 145 186 263 522 442 154 294 267 12 450 349Texas City Terminal_July 6.967 8.977 182 171 9,920 9,973 472 501 1.330 564 327 167 4.870 4.413Texas Mexican July 14.292 15.943 6.811 5,332 23.647 23.161 5.641 6,618 207 626 516 447 10.479 10,391Texas Midland July 27,689 26,044 12.311 11,556 42.694 40,554 7,430 7.854 6.207 8.538 1.634 1.529 18,354 18,750Texas Okla & East__ _July 6,818 6077,554 2,281 1.982 133 3,874Texas Short Line_ __ _July 2.735 2,883 33 108 2.780 3,000 546 505 428 471 19 12 971 1,000Texas Southeastern_ _July 7,337 6.302 329 152 7.913 6.652 3.072 1,959 1.208 1.333 25 74 2.626 2,314Texas State July 1.812 1.917 801 695 2,676 2,616 1.468 412 654 137 29 38 1.271 795Thornton & Alexan _ _July 3,685 3.128 352 296 4,174 3.475 940 858 485 444 820 1,379Tidewater & Western July 5.698 5,266 1,152 1,145 7.583 7,183 2.853 1.952 855 1.179 97 96 2,113 2,123Timpson & tiend____J'ne 2,056 2,808 607 563 2.959 3.511 842 873 2.630 62 216 147 1,973 1,170July 1 to J'ne 30_ _ . 42.443 20.405 8.710 4.609 55,403 26.561 10,824 6.101 3.873 389 2,353 1,120 18.598 10,810Tionesta Valley July 15,853 15.076 1.335 1,271 17,359 16.506 3,138 3.687 2,959 1,756 230 156 5,863 6,016Toledo & Ohio Cent July 352.832 371.933 62.319 60,062 442.587 462.975 60,062 50.813 57.176 52.324 7.421 7,630 148.754 138,267Toledo Angola & W_ _July 2,031 539 1282.031 539 534 837 256223 . 32 466Toledo Peor & West_ _July 56,366 49,648 39.841 39,150 102.265 93,902 17.963 19.927 23,053 18.259 2,060 2,037 39.614 36,616Toledo St L & West _July 268.823 227.588 46.446 40,493 335.525 288,342 46,419 27.433 58,770 31.342 8.239 8.594 113.849 104.828
Chicago & Alton _ _ _July 828.209 708,076 395.901 374.220 1.314.900 1.170,991 198.301 136.909 182.093 187.536 36.583 38.067 421.022 409,501Toledo Southeast_ __ _July 1,852 1,379 1,852 1.37949 1.659 190 67 409 445Toledo Terminal July 24,656 21.681 3.163 5.867 5,236 4,381 179 163 12,133 15.974Tomahawk & Eastern July 938 1,254 78 106 1.039 1,376 361 680 150 169 21 23 208 387Tombigbee Valley__ _July 5.539 5.704 1.417 1.304 7.303 7.404 1.205 977 409 590 299 226 1,872 1.765Tonopah & doldfield_July 49.464 . 56,033 9.285 12,300 61.890 73,094 8,708 6,907 9.242 9,378 1,725 2.628 16,020 23,012Tonopah & Tidewater J'ne 5,052 25.657 4.845 6.043 21,601 33.409 4.596 4,067 2,294 2,716 1.893 2,200 r 6.518 9.118July Ito J'ne 30_ _ _ _ 241.316 326.090 54,215 76,484 317.424 421.529 51.902 74.518 22.372 34,791 23,081 27.567 102,900 127,353Bullfrog-Goldfield J'ne 4.642 8.831 2.111 2,409 7.412 11.911 1,792 1,965 17,173 1.414 915 1.103 3,379 4.081July 1 to J'ne 30_ _ __ 67.237 86,019 24.003 35.471 99,678 128,559 23.566 28.812 39.045 20,522 11,488 12.973 51.170 61,896Tooele Valley July 2,498 1,736 1.395 1.980 4,842 5,307 286 286 4.212 1,244 30 113 2,416 1.590Tray C Led & Manis_July 462 1.015 2,117 1.799 3.306 3.530 364 735 397 312 1,467 1,591Tremont & Gulf July 10.252 18.153 1,390 1.648 12.094 20.281 5.924 5.890 1,165 2,354
39 525,002 5.023Trinity Valley & Nor_J'ne 1.692 1,631 78 289 1.986 2.040 452 1.508 56 112 278 3: 372 645July 1 to J'ne 30_ _.... 14,166 29.262 1,242 2.515 15.961 31,991 9,214 11,208 1.559 3.563 309 409 8.153 9,109Trinity Valley Sou 1.146 1.195 134 137 1,361 1.415 313 433 78 30 10 645 651
_ _ _J'neJuly I to J'ne 30...._., 16,409 21,378 1.348 1,330 18,637 24.144 3,035 6,056 432 4,128 201 117 8.033 7.434Tuckerton July 3,891 3,155 4.183 4,148 8,587 8.108 1.256 2.087 609 209 3,281 2.005Tuscarora Valley_ _ _July 1.732
Tuskegee July 1,1621.3951.170
679
1.035
643 2.615 2.164 480 349 256 252189863 2.257 2,072 3 19 240
64 853
740
542
616Twin nu ttes J'ne 692July 1 to J'ne 30_ _ — 9.796
1.85272.062
13340
284 740 2.254 7 560 15 12 6.173 10.768 79.532 1.846 5.609 1.301 4.785 104 19035318
8.4891.4638.639Uintah July.' •' 21.072 • 28,164 1.936 1.295 23.713 30,140 7.679 3.819 5.071 3.879 55 87 5.827 5,293For index to roads not appearing in alphabetical order, bullgiven under some other sustem, see:pagepl.
Digitized for FRASER http://fraser.stlouisfed.org/ Federal Reserve Bank of St. Louis

SEPT., loll.] RAILWAY EARNINGS 25
FOTAL EXPENSES NET OUTSIDE OPERATIONS TAXESNAME OF ROAD incl. General Exp. FROM RAILROAD Gross Revenue Net Revenue Current PreviousThis Year Last Year This Year Last Year This Year Last Year This Year Last Year Yea YearSouthern Pacific--Con.
FINAL NET MILESCurrent Previous end of MonthYear Year This Last
$ Year YearMug & Tex Cent __July 401,066 376,926 108.426 116.206 1.705 --1,458 17,833 17,079 89,134 99.126 789 789Hous E & W Tex_ July 65,848 74,420 30.421 43,598 3,354 3,290 27,066 40,308 190 190Iberia & Vermilion_July 2,539 2.681 2.687 807 225 217 2,462 590 21 20Lake Charles & Nor July 6.881 5.866 1,114 7.045 71 55 1.043 6.990 65 65Louisiana Western July 112,527 101.909 43.960 43.951 2,507 2,307 678 493 6,154 6.077 38.484 38.367 207 207Morgan's La & Tex July 259,213 256,523 79,425 71.096 6,010 4,474 --2.811 —1.456 18.698 17.756 57.915 51,884 404 404Pacific System_ _ _ _Jtily 4,434.004 4,384,898 3.297.465 3,731.676 774,914 805.719 —21.211 16,263 301.144 275,053 2.975,109 3.472,886 6,214 6.147Texas & New Orl_ _July 228.434 233.574 66,699 74.651 9,869 9.759 —1.979 27 12,748 12.182 51.971 62,497 458 458
Total Company_ _July 6,219,685 6,156,147 3.959.513 4.320.809 804.509 830,828 —31,761 10,950 397,119 367,093 3.530.620 3,964,665 10.180 10.073Coos B R' burg & E_July 5.205 6.296 3.071 3.353 482 807 2.588 2.551 27 27Hearne & Bra Val_ July 1,216 1,378 —123 —690 76 76 —200 —766 20 19Houston & Shreve_July 11,999 11,843 9.461 12,418 687 819 8,774 11,598 39 39
Southern Ry & Navig July 151 266 2,785 --341 —74 12Southwestern Ry- - - -July 2,470 1,973 —297 —330 31 —13 108 92 —418 —422 29 29Spokane & Brit Col_ _July5.137 7,447 —3,599 —6,169 235 313 —3.834 —6.483 36 36Spokane & In! Emp_ _May 58,807 77,538 23.332 31.697 52.164 50,312 12,494 15.195 4,200 3,300 31,626 43.593July I to May 31- - - - 674,539 670,956 323,406 466,493 535.020 465,072 116,133 142.457 46.200 32.700 393,340 576,251 168 168Spokane Internatl_ _July 50,344 54,300 13.754 36,297 2,818 3.585 10,936 32.712 161 140Spokane PortI & Seat inc 215.389
July I to J'ne 30 2,322.127(New fiscal year)_July 199.991
324.7992,386,962204,527
291,2922.497.337222.547
41,4401.179.329158,531
9.48369,52210,417
6.14060,0496,209
90—3.7703,736
—1,703—3,970
672
42.200429.40042,200
21.800294.67521.800
24.1832,064.166184,084
17.937880.684 550137.404 550
429429
Stand & Hernando__ _July 7,754 6,267 —171 1,172 426 426 —598 745 33 29Stanley mer & PhillipsJulY 10.959 10.466 —3.766 —2,957 218 187 —3,985 —3.144 55 57Staten Island July 15.170 48,241 13,171 —20,684 8,407 7.890 5.601 5.289 1.250 1.250 17,522 —16,644 12 12Staten Island R T_ _ _July 36,587 45.501 42.221 44,546 25.516 27.545 16.227 7,252 3.700 3,250 54.749 48.549 10 10Sugar Land J'ne 10,471
July I to J'ne 30_ _ 42,565(New fiscal year) July 3,834
3,78039,2472.737
34516.3242,820
—1,565—3,944
1,260
2761,376100
1001.306100
6914.9472.720
—1.666—5.250 14
1,360 141414
Sumpter Valley July 15.936 17.336 9.541 4.288 609 423 8.931 3.864 81 62Sumter & Choctaw_ _June 6.624
July 1 to J'ne 30_ _ _ __July
48.099(New fiscal year) 4,245
26.34852 9.6.44402 11.873
859
--22.682—6.3782.511
4274.120
16 220
--7624
—39 3
1641.97593
1001.206164
—2.0329.922726
—22.782—7.585 172,350 17
2517
Sunset July 32,817 26,295 67.554 61.431 3.106 267 64.448 61.164 58 56Susquehanna & N V_July 18,778 19,594 7,114 2,797 350 400 6.764 2,397 79 79Susq Blooms & Berw _July 5,397 7,130 3,942 5.214 306 429 3,636 4.785 43 43Sylacauga & Wetump July 3.263 3,470 —661 —1.524 15 15 --676 —1.539 31 29Tallassee & Montgom July 1,535 1,050 1,093 774 102 94 991 680 6 6Tampa & Gulf Coast_May 2.241 1.726 1.726July 1 to May 31_ 23,764 8,801 8.801 21 ....Tampa & Jacksonv_July6,257 4.314 —1,254 1,816 283 283 —1.537 1.533 48 48Tampa Northern J'ne 10.638 8.084 1,417 4,618 1.000 0'778 417 5.396July I to J'ne 30..___ 103.631 92,962 46,579 63.153 12.000 7,376 34.579 55.776 60 60Tenn & Cumb River_ _July8351,143 —223 --229 17 17 --240 —246 15 15Tenn & North Caro_ _July 3.485 1,947 1.524 2,614 106 106 1,418 2.508 21 21Tenn Ala & Oa July 12,961 —2,989 768 —3.758 94 --Tennessee Central_ _ _July 106.175 71,357 30,838 48,741 4,211 3.980 26.626 44,761 293 298Term RR Assn of St L July 133,283 122.309 64,040 76,089 29.058 31.225 2.596 16.737 26,000 21.500 40,636 71,327 35 34
St I Mch Bdg & TerJuly 112.252 103.745 8,217 46.960 5.700 5.037 2.517 41,922 9 9Texas & Pacific July 951,775 1,053,395 163,941 79,620 3,150 1,033 1.515 —5,659 38,000 38.000 127,456 35,961 1,884 1.884
Denison & Pac Sub July 2,200 1.454 2,081 --894 80 80 2.001 --974 7 7Opelousas 0 & N E _July 7,295 9,818 —3.412 —5,176 303 309 --3.716 —5,485 57 57NV'd Min & N W_July 4.976 6,465 6.709 4,421 408 413 6.301 4,008 41 41
Tex Ark & Louisiana_July 955 727 —432 —285 —432 —285 7 7Texas City Terminal_July 8,642 6,606 1,277 3.367 87 60 1.190 3.306 6 6Texas Mexican July 18.069 19.259 5.578 3.902 1.338 1,220 4,240 2.680 161 161Texas Midland July 36.050 39.435 6,644 1,119 1,500 1,200 5,144 --80 125 125Texas Okla & East_ _ July 10.373 —2,819 —2,819 24 ......Texas Short Line _ _ _ July 2.034 2.300 746 699 70 75 676 624 9 9Texas Southeastern_ _July 7.144 6.248 768 403 85 85 683 318 27 27Texas State July 3.572 1.448 —895 1.167 --895 1,167 32 32Thornton & Alexan_July 2,408 2.936 1.766 538 98 100 1.668 438 22 22Tidewater & Western July 6.760 6.280 822 902 356 335 466 567 92 92Timpsott & Bend _J'ne 6.428 2.747 —3.468 763 153 47 —3,622 716July 1 to J'ne 30 _ _ _ 41.499 22,640 13.903 3,920 1.135 287 12,768 3,633 34 34Tionesta Valley July 12,886 12.233 4,472 4.272 350 450 4,122 3.822 85 85Toledo & Ohio Cent_ July 282.144 259.121 160,443 203,854 1.051 —992 20,343 14.929 139.106 188,924 440 444Toledo Angola & W_ _July 1.153 1,515 878 --975 129 52 749 —1.028 8 8Toledo Peor & West July 86.052 80,004 16.212 13.898 4.800 5.000 11.412 8,898 247 247Toledo St I. & West _July 235.428 181.291 100,096 107,050 14,500 13,900 85.596 93,150 450 450Chicago & AI ton_ _ July 870.733 806,109 444,167 364,881 11.398 11.993 --3,016 —4.807 36.500 37,300 404,650 322,774 1,025 998
Toledo Southeast__ _July 648 2.172 1,204 —792 105 23 1.098 --815 1 1Toledo Terminal July 21.628 27,591 3.028 --5,910 1.687 1,076 1.340 --6.986 31 31Tomahawk & Eastern July 876 1.370 162 6 162 6 20 20Tombigbee Valley._ _July 4,346 4.330 2.956 3.074 161 161 2.795 2.913 62 62Tonopah & Ooldfield_July 38.508 48,153 23,381 24,941 2.447 2,400 '20.933 22,541 110 109Tonopah & Tidewater J'ne 16,373
July I to J'ne130_ _ _ _ 233,94519.434
278,6955,228
83.47813.975
142,8331,759
21,8381,513
19.0503.468
61.64012,462
123.782 180 180Bullfrog-Goldfleld J'ne 23.662 r9,310 —16.250 2.601 831 1,113 —17.081 1.487July I to J'ne• 30_ __ _ 132.084 132,402 —32.405 —3.843 10,962 14.925 —43.367 —18.768 83 83
Tooele Valley July 7,227 3,495 —2,384 1,811 100 92 —2.485 1.719 7 7Tray C Leel & Manis_July 2.239 2,749 1,066 781 1.066 781 29 29Tremont & Gulf July 13,439 14.860 —1.345 5,420 200 200 —1.545 5.220 102 102Trinity ValleOt Nor_J'ne 1,106 2.522 879 --481 35 40 844 --521July 1 to;J'ne,130_ _ 22,812 27.409 —6,850 4,581 495 469 --7,346 4.112 10 10Trinity ValleyiSou J'ne 1.066 1.531 294 --116 44 65 250 --182July 13to1J'ne 30._ _ 13.646 21,293 4.991 2,851 436 466 4,554 2.384 6 6Tuckerton July 5'95.187 2.629 2,921 328 393 2,301 2.527 29 29Tuscarora Valley. _ July 1.99557 1.307 619 856 30 30 589 826 27 27Tuskegee July 1,253 1.197 1.003 875 138 120 865 755 6 6Twin Buttes J'ne 341 2.621 398 --366 197 197 201 --563July I to J'ne 30_ _ _ 12.442 21.203 —1.673 58.329 2,366 2,340 —4.040 55.988 10 10Ulu talt July. •• [21,425.' 15,205 • 2,287 14.934 1117,853 7,073 --2,901 —2;688. .1.250 833 —1,863 11.41241 • 54 54
inde4to roads not appearing in alphabetical order, but given under some other system, see me 31.
Digitized for FRASER http://fraser.stlouisfed.org/ Federal Reserve Bank of St. Louis

26 RAILWAY EARNINGS [VOL. Lxxxxiii
NAME OF ROAD
FREIGHT & PASSENGER EARNINGS TOTAL EARNINGS MAINTENANCE EXPENSES TRAFFIC & TRANSPORTAT'N EXP'SFREIGHT PASSENGER incl. Other Revenue Way & Structure Equipment TRAFFIC 7'RANSPORTA7"NThis Year Last Year This Year Last Year This Year Last Year This Year Last Year This Year Last Year ThisY'r LastY'r This Year Last Year$ $ $ $ $ $ $ $ $ $ $ $ $ $Ulster & Delaware_ _ _J'ne 61,322 74,065 39,001 34,240 105,468 113,382 49,851 16,234 9.966 11,992 3,364 3,720 38,216 45.668July 1 to J'ne 30_ - — 713,775 735,926 355,379 351.937 1.122,928 1,139,253 177.718 136,216 144,925 145.342 20,558 19,698 460,535 448,952(New fiscal year)_July 50,916 69,398 79,815 74,284 145.116 149,563 15.778 16,843 11,532 13,628 2.239 1,359 44,659 48,915Unadilla Valley J'ne 3,400 3.509 868 853 4,584 4,864 1.358 995 542 589 105 1.358 1.219July I to J'ne 30_ __ _ 45,054 41,292 10,783 11,153 59.296 56.471 12,259 11.780 6.923 7.094 460 241 16.953 15.279(New fiscal year)_July 3,760 3.818 910 987 5.144 5,168 1.215 1,027 555 607 10 125 1.420 1.416UnIcol Ry July 994 512 994 512 207 152 201 222 300 516Union & Glenn Spr_ _J'ne 2.770 2,334 712 418 3,578 2.858 1,369 2.825 58 414 626 1,531July 1 to J'ne 3-0„- - 33.731 32,517 8.595 5.512 43.605 39,114 10,874 12,704 14,289 4,054 16 11.465 11.289Union Pacific July 2,521.723 3,199,752 1.038,051 1,108,537 3,927.611 4,632,389 454,113 574.817 435,802 505.196 119,191 110.907 999,429 1,062,189Oregon Short Line_July 1,124.899 1,188.776 506,882 524.635 1,728,005 1.803,731 227,561 310,234 160,564 163,335 30.143 14.445 359,538 393.658Ore-Wash RR&NavJuly 882,381 522,298 1,493.437 219,503 119.158 41.358
Total Company _ _July 4,529,003 2,067,231 7,149.053 902,177 715.524 190.592 1,48734:872807St Jos & Grand Isl _July 97,329 87,499 30,266 41.873 148.235 140,504 26.785 32,855 17,280 18,902 5,791 6,043 55,634 63.643
Union Ry of Memphis _J'ne 14,229 39,421 3.008 2.688 234 2,587 11.244 14.310July 1 to J'ne 30_ 245.686 211,468 34,423 26.756 29.098 7,066 77 24 181,286 136,213Union Terminal J'ne 350 426 287 110 2.741 97 121 207July 1 to J'ne 30 4,573 6,545 3,487 2,239 4.712 2.229 2,429 2.336United States Steel Corp—Bessemer & L E_ July _July 858,483 807.134 37.504 42.019 904.725 859,514 82.445 83.520 131.785 113,518 9,415 9.254 193.774 205.201Donora Southern_ _July 17,331 18,207 12.171 1,603 3.450 4.172 6,407 7,979Dui & Iron. Range _July 872.939 1.158,249 22,365 24,608 907,456 1.195,053 117,261 105,010 58.004 66,670 1,257 882 135,009 172.188Dul Missal; & Nor _July 981.400 1,936328 43,747 43,407 1.036,292 1,989,082 107.470 97.977 73,528 108.466 2.503 1,495 143,878 227,364Elgin Joliet & East_July 684,358 693.504 8 5 726.050 739,765 64,665 126,364 129.681 149.966 3.820 3,797 215.447 228,612Elw'd And & Lapel July 512 1.788 27 1,010 150 176 293 537Etna & Montr July 93 5,036 2,062 171 830 3 184 3.014Johnst & Sty Cr'k_July 1,713 1,692 354 348 74 328 837 746Lake Terminal__ _ _July 50.102 41,702 14,983 13.292 10.873 8.636 17,021 15,606McKeesport ConnecJuly 13.897 20,031 6.996 1.752 3,231 3.230 8.880 10.740McKeesport Term _July 706 956 379 254 716 81 338 411Mercer Valley July 6,290 23,319 650 10.715 780 1.053 14 5,563 9,688Newb & South Sh_July 542 615 39,911 40.033 6.001 6.024 13,418 12,590 14,526 16,650Northern Liberties _July 3.163 4.365 396 830 564 774 1,834 2,891Pencoyd & Phila_ _July 4,832 3.468 1,075 1.532 801 524 2.255 2,193Pitts St Ohio Vall_ _July 111 114 490 1,524 130 170 20 37 364St Clair Terminal_ _July 26.229 19.916 2.508 2,434 2,942 3,663 10 5,362 5,756Union RR (of Pa). _July 408.941 386.285 27,919 37.443 88,360 63,072 100 24 132,532 137.450Wauk & Miss Vali _July 2.411 3,465 336 1.209 447 1.060 1.213 1.147
United Verde & Pac_ _July 18.569 23.462 1,422 1,205 20.888 25,364 6,937 8,036 4.486 5.064 5,903 7,342Upper Merlon & Plym JulyVald Moultrie & Wes t.J'ne
1.778
2,766 1.8733,713
5,249235 879
151
4829
742671.6July 1 to J'ne 30_ _ _ _ 40.417 25.605 68.764 10.714 4,7672,510479
20.366(New fiscal year)_Jui Y 3,730 3,633 2,108 2,267 6.200 5.959 922 935 560 254 118 271 1,652 1,446Valley Railroad July 699 823 106 99 842 958 539 458 111 120 431 400Vandalia July 516.023 536.175 224,803 201.246 836.427 820,338 173.271 135,794 153.634 161,715 29.616 29,298 303.761 314,630Vicks Shrev & Pac_ July 53.404 73,894 42.846 40,810 105.987 122,976 20.528 17,389 21,584 21,060 3.498 2.908 35,511 35,544Vic t Fisher St West_ _J'ne 9.024 16,386 9.024 16.386 Cr4,367 2,826 1.734 1,084 41 1,294 2.832 2.346July Ito J'ne 30__ 96.522 119.282 96,522 119.282 30.022 56.858 19.549 15,396 1,722 3,670 27.738 23,282Virginia & Caro Sou_ _J'ne 4,710 3.153 1.661 1,055 6.566 4,358 1.138 785 336 74 13 2,985 2.685July 1 to J'ne 30_ __ - 56.865 42.446 17,783 12.439 76.774 56,298 11,614 10.126 4.183 4.058 226 33,743 23.447Virginia & Kentucky _July 758 304 540 704 1.388 1.119 106 85 561 652Virginia & Sou thw _ _ _July 108,874 75,274 15.308 12.929 128,203 91,453 16,182 11.781 26.045 21,191 1.815 1,407 37,645 25,252Virginia & Truckee _ _July 15,336 14,535 9,926 11,540 26.904 27.592 4.803 5.101 2,747 2,149 887 300 7,660 8.431Virg Anthr Coal & Ry July 812 497 563 584 1,562 1.294 261 610125 276 843 773Virginia-Carolina _ _ _July 8.452 7,343 1,822 1,865 10.463 9,384 1.434 2,032 358 469 1 48 1.70824 1,988Virginia Southern _ _ _July 1.999 2.524 183 213 2.219 2.782 1.294 483 75 151
1.0
996Virginian July 309,261 200,519 27.473 24,059 348,111 232,462 39.625 28,752 59.553 34.830 5,108 6.184 84.106 66,497Wabash July 1.581,556 1.451.455 688,455 716,409 2,447,442 2,344.431 310.655 327,228 430,496 398.752 83,218 83.384 930.848 893,257
Lorain & W Va. _ _July 20,146 14,944 20,451 15,179 1,766 1.196 1.358 703 161 203 4.986 2.912Pittsb Lisbon & W July 3.452 4.339 1,151 1,115 4,954 5.972 1.367 1,144 345 284 184 389 1.659 1.692Wab-Pittsb Term_ _July 47,091 60,585 7.754 8,074 57.461 71,624 9,342 6,633 8.932 10,925 1,000 3.029 21,306 25.017West Side Belt_ _ _ _July 42,311 44.316 559 820 43,142 45.273 6,394 5.663 7.185 6.217 636 852 7.712 6.717Wheeling & L Erie_July 513,803 531,602 63.749 61,706 615.183 630.796 74,810 79,932 108.425 05,503 6,543 10,305 194.100 205.255
Wab Chester & West _July 6.754 9.239 2,233 2,138 10.024 12.252 2.784 1.899 1.825 1.572 183 212 3.401 3.818Ware Shoals July 680 1.084 356 369 1,059 1,475 342 368Warren & Ouach Val_July 5,486 5,289 1,055 1,116 7.283 7,279 2.985 857 422 558 24 4. 1,628 1.473War Johnsv & S Riv_July 1.372 3,306 1,638 3.737 1.104 208 1.100 564 4 964 730Warrenton July 1,258 1,251 230 170 1,584 1,507 212 38 145 129 488 392Washington & Choc_July 1,218 1,266 762 572 897Wash Idaho & Mont_July 26,034 21.572 4.424 5,095 33,395 28.219 7,897 5,298 9.081 4.983 193 118 9.453 7,115Wash Pot & Chesap_July 2.350 2,353 403 495 3.135 3,036 1,293 2.830 118 56 902 986Washington Run_ _ . _July 2.997 4.190 452 498 3.927 5,825 240 325 84 295 75 75 1,352 1,397Waupaca Green Bay_J'ne 384 621 482 622 890 1.257 257 133 7 330 4 505 602July 1 to J'ne 30---- 15,142 10.745 6.635 6.818 22.079 17,788 2.038 1.850 1,948 3,047 74 2.642 101:817724 6,729Waycross & South__ _July 2.463 735 3,388 582 876 50 W Jersey & Sea Sh- - -JulyWest Virginia Midi'd_July
162,772
2,636
163.524
2,201
652.176
2.741
612.9902.177
854,1225.758
811,933
4.704
70.172
1.571
94.984
1.009
80.432
304
60,803
264
15.737 17.862 2619:218631 2371..619787
West Va Northern_ _ _J'ne 1,124 2.341 334 376 1.524 2,800 1.129 371 1.364 1.808 51 1.100 1.067July 1 to J'ne 30_ _ _ _Western AlleghenyJuly.—
19,801
13,020
23,047
12.145
4.182
2.912
3.125
3,122
24.799
16.545
27.064
15.900
6.081
4,348
5,254
3.552
19.198
3,257
20.770
1.428
120
124
5384
1.0%18015. 1,42:806789
Western Maryland.. -J'ne 501.670July 1 to J'ne 30_ _ - - 5,938.425
483.597 80.158963.628
76,824 606.951 7,200.933
589.675 .8530947,8885 79.910 78.923 856.038
68.711 12,106 100.702
9,748 1493508072,57,0 196.207
Georges Cr & Cum_J 'ne 5,794 3.417 91 78 6.458 4.194 1.616 471 4.654 5,376 170 210July 1 to J'ne 30._ _ . 58,902 53,772 937 817 67.263 53.531 5.231 5,334 60.486 63,090 2.076 .2.125 21g3Western Pacific July 299,603 107.718 422.084 66.128 32.382 29.720
12812!
Western Ry of Ala__ _J'ne 47.987 43.398 37,520 32.715 94,881 85,409 36.361 18.613 25.729 16,414 4.967 5.546 31.583 23.720July 1 to J'ne 30---- 724.640 651,507 460.334 418,692 1,293,271 1.167.402 274.397 205.592 237,135 203,563 61,404 63,320 360.870 310.037(New fiscal Year)-July 50395 42.227 39.174 34,901 98,248 84,097 19.974 16.073 21.749 16,776 4.890 4,949 29.185 25,485Wharton & Northern_July 3,382 4.251 796 764 4,196 5,379 2.170 1,244 381 87 1,133 1,634Whitcomb & Morris_July 131 185 131 185 17 133 133White Oak Ry July 3.911 3.464 970 958 5.102 4.922 761 385 750 269 1,656 1,445Wichita Falls & N W_May
July Ito May 31.....34.825
707,12138.094
440.48023.273
235,06312,27485,077
62.668980,690
52.517538.037
11.07388.266
3.66242.453
7,78776.064
1.45716,213
2,13916,098 8.R.W
27,157289.969
12,192105.414
For index to roads not appearing in alphabetical order, but given under some other system, see page 31. •
Digitized for FRASER http://fraser.stlouisfed.org/ Federal Reserve Bank of St. Louis

SEPT., 1911. RAILWAY EARNINGS 27
TAXESTOTAL EXPENSES NET OUTSIDE OPERATIONS FINAL NET MILESincl. General Exp. FROM RAILROAD Gross Revenue Net Revenue Current Previous Current Previous end of Month
NAME OF ROAD This Year Last Year This Year Last Year This Year Last Year This Year Last Year Year Year Year Year This Last$ $ $ $ $ $ $ $ $ $ $ $ Year Year
Ulster & Delaware_ __J'ne 104,353 80,201 1.115 33,181 463 399 99 42 2,162 4,387 —947 28.836July 1 to J'ne 30_ _ _ _ 834.038 779,881 288,890 359,372 6,064 6,046 783 1.239 38.462 39,587 251.210 321.023 128 128(New fiscal year)._July 76,575 83,128 68,541 66.434 366 355 —179 —30 3.300 3.000 65.061 63,103 128 128
Unadilla Valley J'ne 3.771 3.156 813 1,707 121 94 692 1,613July 1 to J'ne 30_ _ _ _ 41,358 38.815 17.938 17.655 1,930 2.019 16,008 15.636 19 19(New fiscal year) _July 3,822 3.538 1.322 1,629 —666 —666 165 175 490 788 19 19
Unicoi Ry July 744 927 249 —414 5 6 244 —420 7 7Union & Glenn Spr J'ne 2,648 12.831 930 —9,973 103 106 827 —10.080July 1 to J'ne 30____ 44.039 41.662 —434 —2,547 1.256 1.314 —1.690 —3.862 19 19Union Pacific July 2,114,329 2.351.754 1,813,281 2,280,635 88.396 99.839 241 4,506 151.650 144,504 1,661.873 2,140.641 3,497 3,411Oregon Short Line_July 812.998 921,138 915,007 882,593 33,714 38.255 —724 1.404 777:71406 61.991 837.176 822.006 1,646 1,594Ore-Wash RR&NavJuly
_Total Company_ J uly
897,3373,824.664
596,100 3,324,388
57.184179.294
4.8154,332
7 9
306,505523,165
3.022,214 1.856 6,999
--- -- - - -
St Jos & Grand Isl _July 110.906 127.073 37.328 13.431 143 736 —79 19 5.711' 5,388 31,537 8.061 319 319Union Ry of Memphis _J'ne 15,481 20.969 —1,251 18,451 594 1,048 —1.846 17.403
July 1 to J'ne 30_ _ _ _ 257,333 181,944 —11,647 29.524 9.460 9,510 —21.107 20,014 20 20Union Terminal J'ne 3,681 543 —3,331 —117 294 244 266 240 2,489 1.459 —5.555 —1,337
July 1 to J'ne 30- - - - 15,194 9,986 —10,621 —3,441 3,182 2,916 3.085 2.513 9.435 7,091 —16.972 —8,020 6 4United States Steel Corp—Bessemer & L E. July 425,936 419,853 478.790 439,660 7,000 7,000 471.790 432.660 203 204Donora Southern_ _July 22.178 13.989 --4,847 4,218 165 172 —5,012 4,045 4 4Dul & Iron Range_July 322,042 353.410 585,413 841,642 13,505 15.312 6,361 6.874 36.706 48.258 555,069 800.259 190 167Dul Missabe & Nor_July 339.977 446.708 696,314 1,542,374 13.458 16,830 8,394 12.988 45,294 80,236 659.414 1,475.125 328 293Elgin Joliet & East_July 428.707 521,314 297.343 218,450 16.725 15.400 280.618 203.050 831 780Elw'd And & Lapel July 702 1,954 --189 —166 246 168 —436 —334 1 1Etna & Montr July 405 5.959 --311 —922 40 30 —351 —952 2 2Johnst & Sty Cr'k_July 1,386 1,544 326 147 51 53 275 94 1 1Lake Terminal_ _ _ _July 43,012 37,617 7,090 4,085 1,557 814 5,532 3,270 10 10McKeesport ConnecTuly 19,146 15,761 —5,248 4,269 546 633 --5,794 3.635 5 7McKeesport Term_July 1,435 748 —729 207 18 20 —747 186 0.43 0.43Mercer Valley July 7,084 21,552 —794 1,767 85 85 --879 1,682 3 3Newb & South Sh_July 35,637 37.253 4,274 2,780 1,968 1.150 2,306 1,629 13 13Northern Liberties_July 2,853 4.565 310 --200 41 51 268 —251 1 1Pencoyd & Phila. _July 4,131 4.251 701 —782 32 18 668 --801 3 3Pitts & Ohio Vail_ _July 707 2,129 —596 —2.014 25 25 —621 —2,039 12 12St Clair Terminal _ _July 10,862 11.913 15.366 8,002 130 280 15,236 7.722 7 7Union RR (of Pa) _ _July 251,239 240,504 157,702 145.780 12.347 24,432 2.799 3.407 3.250 2,770 157.251 146.418 31 31Wauk & Miss Vall_July 2.036 3.447 374 18 25 18 349 2 2
United Verde & Pac- _July 18,273 21,179 2,615 4.185 539 409 2,075 3.776 26 26Upper Merlon & Plym July 1.138 2.574 250 2,324 1 ____Vald Moultrie & Wes t.J'ne 3.978 1.270 201 1.068
July I to J'ne 30 46.725 22,039 1.413 20.625 42 ---(New fiscal year)_July 4,141 3.746 2,058 2.212 201 1,856 2.212 42 42
Valley Railroad July 1,122 980 —280 —21 10 16 --290 --38 11 11Vandalia July 680.558 691.260 155,869 129.078 27.401 27.758 128,468 101,320 827 827Vicks Shrev & Pac _ _ _July 86,057 81.633 19.929 41,343 575 576 --920 244 6.300 6.375 12.709 35.212 171 171Vict Fisher & West_ _J'ne
July Ito J'ne 30__ _ _366
80.9427.577
100,5638.65815,580
8,80818,718 433
2.483629
2.3048.22513.096
8.17916.414 56 56
Virginia & Caro Sou_ _J'ne 5,570 3.803 995 555 39 39 956 516July 1 to J'ne 30_ _ _ _ 55,503 40,229 21,270 16,068 473 473 20,797 15,595 55 27
Virginia & Kentucky_July 822 892 565 226 50 55 515 171 4 4Virginia & South w _ _ _July 85,581 62.664 42.621 28,788 4,560 4,357 38.061 24.431 240 188Virginia & Truckee July 16,964 17,000 9,939 10,591 1,810 1,477 8.128 9.114 67 67Virg Anthr Coal & Ry July 1.326 1,738 236 —443 90 100 146 --543 9 9Virginia-Carolina _ _ _July 4.414 5.622 6.049 3.762 380 377 5.669 3,385 29 29Virginia Southern _ _ _July 2,652 1.693 —433 1,088 134 110 --567 977 12 12Virginian July 196,499 143,333 151,611 89.129 13.777 8.026 4.261 3.525 17.300 13.000 138,573 79.654 473 473Wabash July 1,840.047 1,765.838 607.394 578,593 18.605 20,053 357 --307 71.655 68.175 536,096 510.109 2,514 2.514
Lorain & W Va. _ _ _July 8.360 5.093 12.090 10,085 127 127 554 486 11.663 9.598 34 34Pittsb Lisbon & W July 3.962 3.827 991 2.145 135 181 856 1.963 27 27Wab-Pittsb Term_ _July 45,575 51,463 11,886 20.160 10,330 5.540 6,000 6,000 11,426 14.160 63 63West Side Belt,. July 25,374 21,947 17,767 23.326 981 300 --90 --150 100 400 17,576 22,776 22 22Wheeling & I Erie_July 397,825 404,550 217,358 226.246 5,321 7.991 2,377 6,177 21.151 21.307 198,583 211.116 514 518
Wab Chester & West_July 8.581 7.866 1,443 4.386 552 589 890 3,796 64 64Ware Shoals July 440 467 618 1.008 10 15 608 993 5 5Warren & Ouach Val _July 5,489 3.290 1.794 3,988 300 300 1,494 3,688 16 16War Johnsv & S Riv_July 3.537 1,611 --1,899 2,126 85 85 --1.984 2.041 26 26Warrenton July 915 630 669 877 12 10 657 867 3 3Washington & Choc_July 2.473 —1,207 --1.207 22 --Wash Idaho & Mont_July 28,102 18,231 5,292 9,988 692 650 4.600 9,338 48 48Wash Pot & Chesap_July 3.149 5,021 —13 —1,985 138 101 --152 ---2.087 21 21Washington Run_ _ __July 2.446 3,187 1,480 2.638 195 157 1,285 2.481 4 4Waupaca Green Bay_J'ne 889 1.176 1 81 37 34 --36 47
July I to J'ne 30_ _ _ 20.927 19.489 1,152 —1,701 424 408 727 --2.109 10 10Waycross & South_ __July 2,925 462 100 362 10 10W Jersey & Sea Sh_ __July 446.197 421.370 407.924 390.563 13.165 14.429 --5.771 --8,709 23.473 23.000 378.679 358,853 355 353West Virginia MIdI'd _July 3,802 2,997 1,956 1,706 115 133 1.841 1.571 45 35West Va Northern_ _ _J'ne
July 1 to J'ne 30_ _ _ _4,23645,712
3,84446.781
—2.712—20.913
—1.044—19.716
861,014
88884
--2.798--21.927
--1.133--20.601 10 10
Western Allegheny_ _July 13.801 11,433 2.743 4,466 250 362 2,493 4.103 53 53Western Maryland_ __J'ne 396.219 366,612 210.731 223.062 10,500 2,940 21.000 18.500 192.672 204.562
July 1 to J'ne 30.... 4.440.227 2,760,705 42,562 576 240,000 2,521,281 543 543Georges Cr & Cam _ _J'ne 9,247 8,332 —2,789 —4.138 900 900 --3.689 --5.038
July 1 to.J'ne 30..,. 101,376 99,338 --34.113 —35.807 10.800 10.800 --44,913 --46.607 32 32Western Pacific July 310.533 111.550 17,257 --2,866 14,350 94.334 934 ___.Western Ry of Ala_ _ _The 106.737 69.415 —11,856 15.993 1.055 1,156 --247 --134 9.497 2,175 --21.602 13,682
July I to J'ne 30....(New fiscal year).July
1,012.68781.813
841,84368.447
280.58416.435 325.559
15,64913.4091.137
13.1441,036
--2,216--141
--3.861--235
57.2284,612
44,1103.890
221,13911.681 277,587
11.523 133133
133133
Wharton & Northern_July 3,902 3.367 294 2,011 400 100 105 1,611 20 20Whitcomb & Morris_July 150 167 --18 17 9 9 --28 8 6 6White Oak Ry July 3,539 2,289 1.562 2.633 202 202 1.360 2.430 8 8Wichita Falls & N W_May 50.900 19.868 11,767 32.648 5,845 1.104 5,922 31.543
July 1 to May 31.... 494,791 185,860 485.898 352,176 25.966 - 12.154 459.932 340.022 227 113For;index to roads not appearing in alphabetical order, but given under some other system, see page 31.
Digitized for FRASER http://fraser.stlouisfed.org/ Federal Reserve Bank of St. Louis

28 RAILWAY EARNINGS Lxxxxiii
NAME OF ROAD
FREIGHT & PASSENGER EARNINGS TOTAL EARNINGS MAINTENANCE EXPENSES TRAFFIC & TRANSPORTAT'N EXP'SFREIGHT PASSENGER incl. Other Revenue Way & Structure Equipment TRAFFIC TRANSPOR7'AT'NThis Year Last Year This Year Last Year This Year Last Year This Year Last Year This Year Last Year ThisY'r LastY'r This Year Last Year
$ $Wichita Falls & Sou_ May• July 1 to May 31_.•
W'msp't 5c Nor Bch J'neJuly 1 to J'ne(New fiscal year)_July
Wilmar & Saline Val_July
Wilson Northern J'neJuly 1 to J'ne 30____
Winfield JuneJuly 1 to June 30_ _ - -
Winston-Salem So Bd July
Wis Wat & Farm J'neJuly 1 to J'ne 30- ---
Wisconsin & Mich__ _July
Wisconsin & North_ _July
Wisconsin Northw J'neJuly 1 to J'ne 30__--
Woodstock July
Woodville July
Woodw & La Central _J'neJuly 1 to J'ne 30_---
Wyandotte Terminal_J'neJuly 1 to J'ne 30_-_,
Wyom & Mo River_ J'neJuly 1 to J'ne 30_---
Yazoo dc Miss Valley_July.
Yosemite Valley July
Youngstown & 0 R.-July
Yreka Railroad J'neJuly 1 to J'ne 30_ -__ .•
Zanesville & Western July
4,739 5.71379,117 83.3746,062 6.90077.341 82.8545,560 5,891477 2,954528 3,762
18.681 36.0072,534 2,66329,644 18,233
121,533
6.953 3.50854.537 45,1064,078 5.1173,111 4,638973 4,304
40.397 49,2332.043 1,725
19
2,533 2,60338,882 36.986
1.456 -54214,185 13.549
467.455 436.3919,232 7,275
3,275 4.268758 634
9.105 • 9,58832.000 31.471
Zwolle & Eastern_ __J'ne 5,437July 1 to 61.421
. For index
1,685 2,131 6,919 8.345 3,084 980 937 9420,891 21,311 106,324 109.319 17,248 19.483 3,926 4,6605.083 4,989 12,079 12.799 2.034 2,200 1.203 1,15249.442 50.563 134.632 140,731 19,610 19.520 13,021 26,0138,832 8.393 15,290 14,704 5.509 1.524 983 1,361
1,191 3.668 393 341 44 138710 3,967 972 330 1,206 cr91
22.114 38.799 6.712 14,995 6,737 6.120295 423 2,935 3,148 846 742 39 673
3,486 2.494 34,003 22.017 5.893 4.946 2,345 4,5284,013 25,831 4,118 , 1.016527 483 7.960 4.472 2,432 2.050 698 539
5.898 6.643 65.683 56.697 23,181 21,701 10.675 7.4823.354 3.799 7,995 9.471 1,776 1.416 1,823 2.4861.679 1.684 5.859 6,547 566 547 681 259
34 73 1.007 4,377 117 677 274 3571,227 1,759 41.625 50.992 2,647 3.657 5,509 5.7891,723 1.747 3.950 3.655 723 579 66 514
192.544 2.622 1,315 1.158 194 22038.902 37,004 14.050 12.558 2,770 1,1875.672 5,180 1.312 420 1,361 97675.634 62.732 10.981 8.904 5,405 4,540
206 294 1.763 -88 1,087 330 59 132,637 2.782 18,325 17.633 5.871 4.970 1.406 554
209,676 187.701 730.559 671.025 164.053 177,238 112,586 127,61238,783 34.940 49,278 43.320 4.049 2,267 1,230 1.58516.601 13.562 22,009 19.282 2,355 1,985 1,432 6991,154 1.120 2.139 1.936 575 656 96 17214,668 13,561 26.173 25,573 5.267 4,968 1,224 3,0024,596 4,773 37.670 37,466 7.513 9,547 4,721 6,455
5.000 20 5.457 5,000 1.223 552 505 95458,014:j 385 61,806 . 58.014 12.323 10,059 4,893 6.109 ---- ------to roads not appearing in alphabetical order, but given under some other system, see page 31.
230 117 2.777 2.5541.708 2,115 27.584 27,006153 304 4.351 3.830
2.182 3,012 48.775 50,240133 51 4,257 4.487
258 761
909 75021 191 10,912 16,8,35
862 84710.449 9.118
1,499 8.8392.194 1,645
22,602 18.344524 482 3,809 4.75940 14 1,813 1,995
851 1.27815.750 16.6841,515 1,330
573 218 7924,107 3.470 11.750
2,82253.914
275 137 5931.996 1.444 7.534
15.181 13.892 262,8771,247 1,872 5,225
295 359 5.35519 13 2,119156 160 11,528848 631 14,616
1.08713,923
1
1.13912.384
3.27945.866
5677,108
242,0694,801
5,0001.616
11,189
14,4251,173
11.954
Digitized for FRASER http://fraser.stlouisfed.org/ Federal Reserve Bank of St. Louis

SEPT., 1911.) RAILWAY EARNINGS 29
NAME OF ROAD
Wichita Falls & Sou May
TOTAL EXPENSES NET O.UTSIDE OPERATIONS TAXESincl. General Exp. FROM RAILROAD Gross Revenue Net Revenue Current PreviousThis Year Last Year This Year Last Year This Year Last Year This Year Last Year Year Year
$ $ $ $ $ $ $ $ $ $
7,283 3,910 —363 4.435 Cr478 247
FINAL NET MILESCurrent Previous end of MonthYear Year This Last$
114 $4,087 Year YearJuly 1 to May 31__ __ 52.820 57.420 53,503 51.898 4,121 2,727 49.382 49,171 56 56
W'msp't & Nor Bch _ _J'ne 8,516 8.140 3,563 4.659 153 204 3,409 4.455July 1 to J'ne 30__ -- 93.985 107.518 40,647 33.213 1.841 2,450 38.805 30.762 84 84(New fiscal year) July 11,635 8,807 3.654 5.897 246 153 3.408 5,743 84 94
Wilmar & Saline Val_July 696 1,241 495 2,426 71 35 423 2.391 12 12
Wilson Northern J'ne 3,382 1.258 —2.672 2.708 133 5Er - 698 460 —3.314 2.247July 1 to J'ne 30_ _ _ - 28.247 41.637 —6,132 —2,837 1.811 593 1,478 850 —7.017 —3.688 10 • 10
Winfield June 1,979 2.546 956 601 40 40 916 561July 1 to June 30_ _ _ _ 21,642 21.120 12.360 897 395 308 11.965 589 12 12
Winston-Salem So Bd July 16,503 9.328 2,000 7,328 90 --
Wis Wat & Farm _ _ _ _J'ne 5,694 4,437 2.265 34 359 528 —40 —11 25 2.224 —1July I to J'ne 30-- - - 59.754 50.721 5,928 5,975 359 528 —40 —11 450 476 5.437 5.487 57 (57
Wisconsin & Mich _ _ _July 8.748 10,472 —752 —1.001 1.175 1.300 —1,927 —2.302 135 135
Wisconsin & NorthJuly 3.584 3.303 2,275 3.243 48() 480 1,795 2.763 55 54
Wisconsin Northw___J'ne 2,215 2,532 —1.207 1,845 177 51 —1,385 1,793July 1 to J'ne 30____ 29,059 29,718 12,565 21.274 . 856 765 11,708 20,508 28 27
Woodstock July 2.537 2.581 1,412 1,074 100 100 1.312 974 13 13
Woodville July 25 26 —25 —6 —25 —6 10 10
Wood w & La Central _J'ne 3.517 3.465 —973 —843 40 118 —1.013 —962July 1 to J'ne 30_ _ - - 41.219 39.893 —2.316 —2.888 731 846 —3.047 —3.735 24 24
Wyandotte Terminal _J'ne 5.576 4.756 • 95 423 42 95 52 328July 1 to J'ne 30_ - - - 71.484 60.385 4.149 2,346 665 516 3.484 1.830 16 14
Wyom & Mo River_ _ _J'ne 2,168 1.354 —405 —1,442 78 78 —483 —1.521July I to J'ne 30_ --- 20,629 19.139 —2.303 —1,506 951 951 —3,255 —2.457 18 18
Yazoo & Miss Valley_July 579.437 583,460 151,122 87.564 610 593 --286 —559 38.000 33,030 112.836 54,005 1.371 1.371
Yosemite Valley July 12,135 10,971 37.142 32,348 1.832 1,000 35,309 31,348 79 79
Youngstown & 0 R_ _July 10.657 9,065 11,351 10,217 1,393 567 9.958 9.649 35 35
Yreka Railroad J'ne 2.812 2.463 —672 —526 29 57 —702 —584115July 1 to J'ne 30__ — 18.216 19,592 7.957 5.981 654 689 7,302 5.292 7 7
Zanesville & Western July 28.556 31.888 9.114 5.578 1,650 1.214 7.464 4,363 89 89
Zwolle &lEastern J'ne 3.121 2,855 2,336 2,144 74 53 2,262 2,091Julyil to J'no 30__ __ 35,630 30,413 26,176 27,601 888 636 25,288 26,964 17.' • 17
For index to roads not appearing in alphabetical order, but given under some other system, see page 31.
Digitized for FRASER http://fraser.stlouisfed.org/ Federal Reserve Bank of St. Louis

30 RAILWAY EARNINGS [VOL. Lxxxxin.
List of Systems with Roads Grouped Under the Same
ATCHISON TOPEKA & SANTA FE—Beaumont Wharf & Terminal Co.Concho San Saba & Llano Valley.Eastern Ry. of New Mexico.Grand Canyon.Gulf & Inter-State of Texas.Gulf Colorado & Santa Fe.Pecos & Northern Texas.Pecos River.Rio Grande & El Paso.Santa Fe Prescott & Phoenix.Southern Kansas Ry. of Texas.Texas de Gulf.
ATLANTIC COAST LINE—Augusta Belt.Charleston & Western Carolina.Columbia Newberry & Laurens.Conway Coast & Western.Georgia.Lexington Terminal.Louisville & Nashville.Louisville Henderson & St. Louis.Monroe.Nashville Chattanooga & St. Louis.Northwestern RR. of South Carolina.Union Point & White Plains.Washington & Vandemere.
BALTIMORE & OHIO—Baltimore & Ohio Chicago Terminal.Cincinnati Hamilton & Dayton.Hamilton Belt.Sharpsville.Staten Island.Staten Island Rapid Transit.
BOSTON & MAINE—Maine Central.St. Johnsbury & Lake Champlain.Sullivan County.Vermont Valley.York Harbor & Beach.
CANADIAN PACIFIC LINES IN UNITED STATES—Canadian Pacific Ry. in Maine.Duluth South Shore & Atlantic.Mineral Range.Minneapolis St. Paul & Sa?sit Ste. Marie.Newport & Richford.
CENTRAL OF GEORGIA—Louisville & Wadley.Wadley Southern.Wrightsville & TenniIle.
CHICAGO & NORTH WESTERN—Chicago St. Paul Minneapolis & Omaha.Macoupin County.Pierre & Ft. Pierre.Pierre Rapid City & North Western.Wyoming dc Northwestern.
CHICAGO BURLINGTON & QUINCY—Quincy Omaha & Kansas City.
CHICAGO MILWAUKEE & ST. PAUL—Chicago Milwaukee & Puget Sound.Gallatin Valley.Tacoma Eastern.White Sulphur Springs & Yellowstone Park.
CINCINNATI NEW ORLEANS Ec TEXAS PACIFIC—Cincinnati Burnside dc Cumberland River.Harriman & Northeastern.
COLORADO & SOUTHERN—Colorado Springs & Cripple Creek District.Fort Worth & Denver City.Trinity & Brazos Valley.Wichita Valley.
CRIPPLE CREEK CENTRAL—Florence & Cripple Creek.Midland Terminal.
DELAWARE & HUDSON—Cooperstown & Charlotte Valley.Greenwich & Johnsonville.
DELAWARE LACKAWANNA & WESTERN—Lackawanna & Montrose.Sussex.Syracuse Binghamton & New York.
DENVER & RIO GRANDE—Boca & Loyalton.Rio Grande Southern.Western Pacific.
DETROIT TOLEDO & IRONTON—Ann Arbor.Manistique & Lake Superior.
EL PASO dc SOUTHWESTERN CO.Morenci Southern.
ERIE—Bath & Hammondsport.Chicago & Erie.New Jersey & New York.New York Susquehanna & Western.Wilkes-Barre & Eastern.
FORT SMITH 6c WESTERN—St. Louis El Reno & Western.
GREAT NORTHERN—Farmers Grain & Shipping.Minneapolis Western.
GREEN BAY & WESTERN—Ahnapee & Western.Iola & Northern.Kewaunee Green Bay & Western.
GRAND TRUNK OF CANADA IN U. S.—Atlantic & St. Lawrence.Central Vermont.Champlain ec St. Lawrence.Chicago Detroit & Canada 'Grand Trunk JunctionCincinnati Saginaw & Mackinaw.Detroit Grand Haven & Milwaukee.Grand Trunk Western.Lewiston & Auburn.Michigan Air Line.Pontiac Oxford & Northern.Saint Clair Tunnel Co.Toledo Saginaw & Muskegon.United States & Canada.
ILLINOIS CENTRAL—Omaha Bridge & Terminal.Yazoo & Mississippi Valley.
KANSAS CITY SOUTHERN—Arkansas Western.
MISSOURI KANSAS & TEXAS—Texas Central.
MISSOURI PACIFIC—.Arkansas Central.Natchez & Southern.St. Louis Iron Mountain & Southern.
NEVADA-CALIFORNIA-OREGON—Sierra Valleys.
NEW YORK CENTRAL & HUDSON RIVER—Chicago Indiana & Southern.Chicago Kalamazoo & Saginaw.Cincinnati Northern.Cleveland Cincinnati Chicago & St. Louis.Detroit & Charlevoix.Dunkirk Allegheny Valley & Pittsburgh.Fulton Chain.Indiana Harbor Belt.Kanawha & Michigan.Kankakee & Seneca.Lake Erie & Western.Lake Erie Alliance & Wheeling.Lake Shore & Michigan Southern.Little Falls & Dolgeville.Louisville Jeffersonville Bridge Co.Michigan Central.Mount Gilead Short Line.New York & Ottawa.New York Chicago & St. Louis.Peoria & Eastern.Pittsburgh & Lake Erie.Raquette Lake.Rutland.St. Lawrence & Adirondack.Toledo & Ohio Central.Zanesville & Western.
NEW YORK NEW HAVEN & HARTFORD—Central New England.New York Ontario & Western.Union Freight.Wood River Branch.
NORTHERN PACIFIC—Big Fork &Minnesota & International.Port Townsend Southern.
PENNSYLVANIA—Lines East of Pittsburgh:Baltimore & Sparrows Point.Baltimore Chesapeake & Atlantic.Cape Charles.Cornwall & Lebanon.Cumberland Valley.Long Island.Maryland Delaware & Virginia.New York Philadelphia & Norfolk.Northern Central.Pennsylvania Terminal.Philadelphia Baltimore & Washington.Rosslyn Connecting.Union RR. of Baltimore.West Jersey & Seashore.
Lines West of Pittsburgh:Cincinnati Lebanon & Northern.Cleveland Akron & Cincinnati.Grand Rapids & Indiana.Pennsylvania Company.Pittsburgh Cincinnati Chicago & St. Louis.Vandalia.Waynesburg & Washington.Wheeling Terminal.
RICHMOND FREDERICKSBURG & POTOMAC—Washington Southern.
ROCK ISLAND—Chicago Rock Island & Gulf.Chicago Rock Island & Pacific.Morris Terminal,
READING SYSTEM—Atlantic City.Catasauqua & Fogelsville.Central RR. of New Jersey.Chester & Delaware River.Gettysburg & Harrisburg.Middletown & Hummeistown.Northeast Pennsylvania.Perkiomen.
• Philadelphia & Chester Valley.Philadelphia & Reading Ry.Philadelphia Newtown & New York.Pickering Valley.Port Reading.Reading & Columbia.RU pert & Bloomsburg.Stony Creek.Tamaqua tiazelton & Northern.Williams Valley.
ST. LOUIS & SAN FRANCISCO—Beaumont Sour Lake & Western.Chicago & Eastern Illinois.Fort Worth & Rio Grande.New Orleans Texas & Mexico.Orange & Northwestern.Paris & Great Northern.Rio Grande.St. Louis Brownsville & Mexico.St. Louis San Francisco & Texas.
ST. LOUIS SOUTHWESTERN—Eastern Texas.Paragould Southeastern.Pine Bluff Arkansas River.St. Louis Southwestern Ry. of Texas.Stephenville North & South Texas.
SOUTHERN—Alabama Great Southern.Asheville & Craggy Mountain.Augusta Southern.Blue Ridge.Cumberland.Danville & Western.Georgia Southern & Florida.tiartwell.Mobile & Ohio.Northern Alabama.Tallulah Falls.Virginia & Southwestern.
SOUTHERN PACIFIC—Arizona Eastern.Coos Bay Roseburg & Eastern RR. & Navigation.Corvallis & Eastern.Galveston Harrisburg & San Antonio.Hearne & Brazos Valley.Houston & Shreveport.Houston & Texas Central.Houston East & West Texas.Iberia & Vermilion.Lake Charles & Northern.Louisiana Western.Morgan's Louisiana & Texas RR. & SS. CoTexas & New Orleans.
TERMINAL RR. ASSOCIATION OF ST. LOUIS—St. Louis Merchants Bridge & Terminal.
TEXAS & PACIFIC—Denison & Pacific Suburban.Opelousas Gulf 6c Northeastern.Weatherford Mineral Wells & Northwestern.
TOLEDO ST. LOUIS lc WESTERN—Chicago & Alton.
TONOPAH TIDEWATER—Bullfrog-Goldfield.
UNION PACIFIC--Oregon-Washington RR. & Navigation Co.Oregon Short Line.St. Joseph & Grand Island.
UNITED STATES STEEL CORPORATIONBessemer & Lake Erie.Donora Southern.Duluth & Iron Range.Duluth hlissabe & Northern.Elgin Joliet & Eastern.Elwood Anderson & Lapel.Etna & Montrose.Johnstown & Stony Creek.Lake Terminal.McKeesport Connecting.McKeesport Terminal.Mercer Valley.Newburg & South Shore.Northern Liberties.l'encoyd & Philadel phia.Pittsburgh & Ohio Valley.St. Clair Terminal.Union RR. (of Pennsylvania)Waukegan & Mississippi Valley.
WABASH—Lorain & West Virginia.Pittsburgh I.isbon & Western.Wan bsh-Pi t tsburgit Terminal.West Side Belt.Wheeling & Lake Erie.
WESTERN MARYLAND—Georges Creek & Cumberland
Digitized for FRASER http://fraser.stlouisfed.org/ Federal Reserve Bank of St. Louis

SEPT., 1911. RAILWAY EARNINGS 31
Index to Roads Appearing Under Other Companies
Name of Road— To be found under—Ahnapee & Western Green Bay & Western.Arizona Eastern Southern Pacific.Arkansas Central Missouri Pacific.Arkansas Western Kansas City Southern.Asheville & Craggy Mountain Southern Railway.Atlantic & St. Lawrence Grand Trunk of Canada.Atlantic City Reading Company.Augusta Belt Atlantic Coast Line.Augusta Southern Southern Railway.Baltimore & Ohio Chicago Terminal Baltimore St Ohio.Baltimore & Sparrow's Point Pennsylvania RR.Bath & Hammondsport Eric Railroad.Beaumont Sour Lake & Western St. Louis & San Fran.Beaumont Wharf Sc Terminal Co Atch. Top. & Santa Fe.Big Fork & International Falls Northern Pacific.Blue Ridge Southern Railway.Boca & Loyalton Denver & Rio Grande.Bullfrog Goldfield Tonopah & Tidewater.Canadian Pacific Railway in Maine Canadian Pacific.Cape Charles Pennsylvania RR.Carolina Clinchfield & Ohio of S. C Caro. Clinch. & Ohio.Catasauqua & Fogelsville Reading Company.Champlain & St. Lawrence Grand Trunk of Canada.Charleston & Western Carolina Atlantic Coast Line.Chester & Delaware River Reading Company.Chicago & Eastern Illinois St. Louis & San Fran.Chicago & Erie Erie Railroad.Chic. Detroit St Can. Grand Trunk Junc Grand Trunk of Canada.Chicago Kalamazoo et Saginaw N Y. Cent. & Hud. Riv.Chicago Milwaukee & Puget Sound Chic. Milw. & St. Paul.Chicago Rock Island & Gulf Rock Island.Chicago Rock Island & Pacific Rock Island.Cincinnati Burnside .5t Cumberland an. N. 0. & Texas Pac.Cincinnati Lebanon & Northern Pennsylvania Railroad.Cincinnati Northern N V. Cent. & Bud. Rh'.Cincinnati Saginaw & Mackinaw Grand Trunk of Canada.Cleveland Akron & Cincinnati Pennsylvania Railroad.Colorado Springs & Cripple Creek Dist Colorado & Southern.Conch° San Saba & Llano Valley Atch. Top. & Santa Fe.Conway Coast & Western Atlantic Coast Line.Cooperstown & Charlotte Valley Delaware St Hudson.Coos Bay Roseburg & Eastern Southern Pacific.Cornwall & Lebanon Pennsylvania Railroad.Corvallis & Eastern Southern Pacific.Cumberland RR Southern Railway.Danville & Western Southern Railway.Denison & l'acific Suburban Texas & Pacific.Detroit & Charlevoix N Y. Cent. & tIud. Riv.Detroit Grand Haven & Milwaukee Grand Trunk of Canada.Donora Southern United States Steel.Dunkirk Allegheny Valley et Pittsburgh N V. Cent. & Bud. Riv.Eastern Railway of New Mexico Atch. Top. & Santa Fe.Eastern Texas St. Louis Southwestern.Elwood Anderson & Lapel United States Steel.Etna & Montrose United States Steel.Farmers Grain & Shipping Co Great Northern.Florence & Cripple Creek Cripple Creek Central.Fort Worth & Denver City Colorado & Southern.Fort Worth & Rio Grande St. Louis St San Fran.Fulton Chain N V. Cent. & Bud. Riv.Gallatin Valley Chic. Milw. & St. Paul.Galveston Harrisburg & San Antonio Southern Pacific.Georges Creek & Cumberland Western Maryland.Gettysburg & Harrisburg Reading Company.Grand Canyon Atch. Top. & Santa Fe.Grand Trunk Western Grand Trunk of Canada.Greenwich & Johnsonville Delaware & lIudson.Gulf & Inter-State of Texas Aid'. Top. & Santa Fe.Gulf Colorado & Santa Fe Atch. Top. & Santa Fe.Hamilton Belt Baltimore & Ohio.Harriman & Northeastern Cin. N. 0. & Texas Pac.Hartwell Southern Railway.Hearne & Brazos Valley Southern Pacific.Houston & Shreveport Southern Pacific.Houston East & West Texas Southern Pacific.Iberia St Vermilion Southern Pacific.Indiana Harbor Belt N Y. Cent. & Bud. Riv.Iola & Northern Green Bay & Western.Johnstown & Stony Creek United States Steel.Kanawha & Michigan N V. Cent. & thud. Riv.Kankakee & Seneca N V. Cent. & thud.Kewaunee (keen Bay & Western Green Bay & WesternLackawanna et Montrose Del. Lack. & Western.Lake Charles & Northern Southern Pacific.Lake Erie Alliance & Wheeling N. V. Cent. & Bud. Riv.Lake Terminal United States Steel.Lewiston & Auburn Grand Trunk of Canada.Lexington Terminal Atlantic Coast Line.Little Fails & Dolgeville N V. Cent. & Bud. Riv.Lorain & West Virginia Wabash Railroad.Louisiana Western Southern Pacific.Louisville & Jefferson Bridge N. V. Cent. & Bud. Riv.Louisville & Wadley Central of Georgia.Macoupin County Chicago & North West.Manistique & Lake Superior Detroit Toledo & Ironton.Maryland Delaware & Virginia Pennsylvania Railroad.McKeesport Connecting United States Steel.McKeesport Terminal United States Steel.Mercer Valley United States Steel.Michigan Air Line Grand Trunk of Canada.Middletown & Hummelstown Reading Company.
Name of Road— To be found under—Midland Terminal Cripple Creek Central.Mineral Range Canadian Pacific.Minneapolis Western Great Northern.Minnesota St International Northern Pacific.Missouri Kansas St Texas of Texas Missouri Kansas:CTexas.Monroe Atlantic Coast Line.Morenci Southern El Paso & Southwestern.Morgan's Lou. & Tex. RR. dc SS. Co Southern Pacific.
Rock Island.N Y. Cent. &1Hud.Missouri Pacific.Erie Railroad.
New Orleans Texas & Mexico St. Louis & San Fran.N. V. Cent. & Hud4Riv.United States Steel.Canadian Pacific.Reading Company.Southern Railway.United States Steel.Atlantic Coast Line.Illinois Central.Texas & Pacific.St. Louis & Sanyran.Union Pacific.Union Pacific.St. Louis Southwestern.St. Louis & San:Fran.Atch. Top. & Santa Fe.Atch. Top. & Santa Fe.
Pencoyd & Philadelphia United States Steel.Pennsylvania T ermtn,21 Pennsylvania Railroad.Perklomen Reading Company.Philadelphia & Chester Valley Reading Company.Philadelphia & Reading Reading Company.Philadelphia Newtown & New York Reading Company.Pickering Valley Reading Company.Pierre & Fort Pierre Bridge Chicago & North Western.Pierre Rapid City & North Western Chicago & North Western.Pine Bluff Arkansas River St. Louis Southwestern.Pittsburgh & Ohio Valley United States Steel.Pittsburgh Lisbon St Western Wabash Railroad.Pontiac Oxford & Northern Grand Trunk of Canada.Port Reading Reading Company.Port Townsend Southern Northern Pacific.Quincy Omaha & Kansas City Chic. Burl. & Quincy.Raquette Lake N. Y. Cent. & Bud. Riv.
Reading Company.Rio Grande St. Louis & San Fran.Rio Grande St El Paso Atch. Top. & Santa Fe.Rio Grande Southern Denver & Rio Grande.Rosslyn Connecting Pennsylvania Railroad.Rupert & Bloomsburg Reading Company.St. Clair Terminal United States Steel.St. Clair Tunnel Co Grand Trunk of Canada.St. Joseph & Grand Island Union Pacific.St. Louis Brownsville & Mexico St. Louis & San Fran.St. Louis El Reno & West Fort Smith & Western.St. Louis Iron Mountain & Southern Missouri Pacific.St. Louis Merch. Bridge St Terminal Term. RR. Ass'n of St. L.St. Louis San Francisco & Texas St. Louis & San Francisco.Santa Fe Prescott & Phoenix Atch. Top. & Santa Fe.Sharpsville Baltimore & Ohio.Sierra & Mohawk Nevada-California-OregonSouthern Kansas Ry. of Texas Atch. Top. & Santa Fe.Stephenvilip North & South Texas St. Louis Southwestern.Stony Creek Reading Company.Sullivan County Boston & Maine.Sussex Del. Lack. et Western.Syracuse Binghamton St New York Del. Lack. & Western.Tacoma Eastern Chic. Milw. dc St. Paul.Tallulah Falls Southern Railway.Tamaqua Hazleton & Northern Reading Company.
Atch. Top. & Santa Fe.Southern Pacific.Missouri Kansas & Texas.Grand Trunk of Canada.Colorado & Southern.United States Steel.N V. N. H. & Hartford.Atlantic Coast Line.Pennsylvania Railroad.Grand Trunk of Canada.Boston & Maine.Wabash Railroad.
Wadley Southern Central of Georgia.Washington & Vandemere Atlantic Coast Line.Washington Southern Richm. Frederick. & Pot.Waukegan & Mississippi Valley United States Steel.Waynesburg & Washington Pennsylvania Railroad.Weatherford Mineral Wells & N. W Texas & Pacific.West Side Belt Wabash Railroad.Wheeling St Lake Erie Wabash Railroad.Wheeling Terminal Pennsylvania Railroad.White Sul. Springs & Yellowstone Pk Chic. Milw. & St. Paul.Wichita Valley Colorado et Southern.Wilkes-Barre & Eastern Erie Railroad.Williams Valley Reading Company.Wood River Branch N Y. N.11. & Hartford.Wrightsville & Tennille Central of Georgia.Wyoming dc Northwestern Chicago & North Western.York Harbor et Beach Boston & Maine.
Morris Terminal Mount Gilead Short LineNatchez & Southern New Jersey & New York
New York & Ottawa Newburgh & South Shore Newport & Richford North Eas Pennsylvania Northern Alabama Northern Liberties North Western RR. of South Carolina Omaha Bridge & Terminal Opelousas Gulf & Northeastern Orange et Northwestern Oregon-Wash. RR. & Navigation Oregon Short Line Paragould Southeastern Paris & Great Northern Pecos & Northern Texas Pecos River
Reading & Columbia
Texas & Gulf Texas & New Orleans Texas Central Toledo Saginaw & Muskegon Trinity & Brazos Valley Union Railroad (of Pannsylvania) Union FreightUnion Point et White Plains Union Railroad of Baltimore United States & Canada Vermont Valley Wabash Pittsburgh Terminal
Digitized for FRASER http://fraser.stlouisfed.org/ Federal Reserve Bank of St. Louis

THE RULES FOR COMPILING RETURNS
AS stated on our title page, a special feature of usefulness in the monthly returns con-tained in this publication is the fact that the figures for all the different roads are ona uniform basis. This makes it important to know just what items are includedunder each head. Elaborate instructions have been issued from time to time by the
Commission for the guidance and understanding of the accounting officers of the roads.The classification of items and accounts for the monthly returns is precisely the same asfor the annual reports which the roads are required to make to the Commission.
The Commission distinguishes sharply between "Rail Operations" andRail "Outside Operations." The phrase "Rail Operations"is self-explanatory.Operations. It means the business which is the chief function of a rail carrier, namelythe railroad transportation business. The results of these rail operations are comprisedunder the terms 'Operating Revenues," "Operating Expenses' and "Net OperatingRevenue." In our tables we do not use the expression "Operating Revenues" buthave substituted for it the term "Gross Earnings"—not because it is an improvementon the Commission's phraseology, but because to the ordinary reader, accustomed forhalf a century or more to the use. of the words "Gross Earnings," this latter conveys morereadily the meaning intended.
The gross earnings, are sub-divided so as to show: (1) Freight Revenues,Gross Earnings, (2) Passenger Revenues, (3) Other Transportation Revenue and (4)How Classified. Non-Transportation Revenue. Freight revenues or earnings means, ofcourse, the amount earned by the carrier in the transportation of freight, and passengerearnings means the amount earned from the transportation of passengers. "OtherTransportation Revenue" and "Non-Transportation Revenue" are small items andwe do not report them separately. "Other Transportation Revenue" includes suchaccounts as Excess Baggage Revenue; Parlor and Chair Car Revenue; Mail Revenue;Express Revenue; Milk Revenue (on passenger trains); Other Passenger Train Revenue;Switching Revenue; Special Service Train Revenue, and Miscellaneous TransportationRevenue. "Non-Transportation Revenue" includes amounts derived from Station andTrain Privileges; Parcel Room Receipts; Storage, Freight; Storage, Baggage; Car Service;Telegraph and Telephone Service; Rents of Buildings and Other Property; Miscellaneous;Joint Facilities Revenue, Dr. and Cr.
Classification of The classification of expenditures is along well understood lines, corn-
Expenditures. prising (1) Maintenance of Way and Structures, (2) Maintenance ofEquipment, (3) Traffic Expenses, (4) Transportation Expenses and
(5) General Expenses. It is perhaps well to say that Maintenance of Equipment includesnot only renewal charges, but also an allowance to cover depreciation of locomotives,of passenger cars, of freight cars, of floating equipment and of work equipment.
It is the Outside Operations with reference to which enlightenment willOutside be particularly sought. These outside operations deal with Boat Lines;Operations. Ferry Lines; Harbor Terminal Transfers; Electric Railways; ExpressLines; Car and Omnibus Service; Sleeping Car Service; Parlor and Chair Car Service;Dining and Special Car Service; Electric Light and Power Plants; Gas Producing Plants;Canals; Grain Elevators; Stock Yards; Commercial Telegraph and Telephone Lines;Hotels and Restaurants; Amusement Parks and Resorts; Coal Storage Plants; ColdStorage Plants; Commercial Ice Supply Plants; Public Toll Bridge Service, and Mis-cellaneous. Professor Henry C. Adams, the Statistician of the Commission, definesOutside Operations as facilities operated or services rendered by a railway other thanthose incidental to transportation by rail, the revenues and expenses of which, if includedin the carriers' accounts dealing with transportation by rail, would impair the significanceof statistics prepared from such accounts. Miscellaneous receipts and expenditures, whenno service is performed, he states, should not be treated as outside operations. Thislast is important as showing that income from investments is not included in the outsideoperations. No digest is possible of the rules prescribed for computing the OutsideRevenues or the Outside Expenses. The instructions concerning the same make apamphlet of 160 pages, printed in small type.
The taxes in these monthly returns are supposed to be one-twelfth ofTaxes. the amount of the annual taxes. These taxes, it should be observed,are not included in operating expenses, but stated. as a separate item and deducted fromnet revenue. The only charges in the nature of taxes included in the operating accountsare assessments for highways, sidewalks, sewers, and the like.
The result reached by deducting the item of taxes the Inter-StateFinal Net. Commerce Commission calls "Operating Income." We call it in ourtables "Final Net," as best describing for the purpose of these monthly returns the finalresult. For in these returns there are several different kinds of Net, namely the Netfrom the Rail Operations, the Net from the Outside Operations, the Combined Net, and,last of all, the Net after the Deduction of the Taxes. We term this last the Final Net.
Digitized for FRASER http://fraser.stlouisfed.org/ Federal Reserve Bank of St. Louis