two sides of urban mexico - the world...
TRANSCRIPT
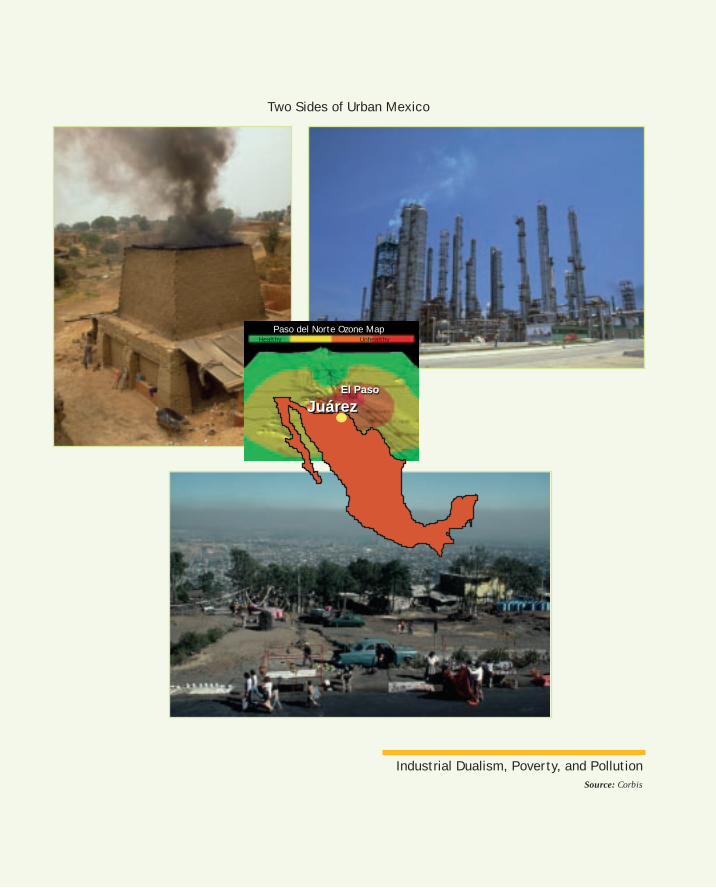
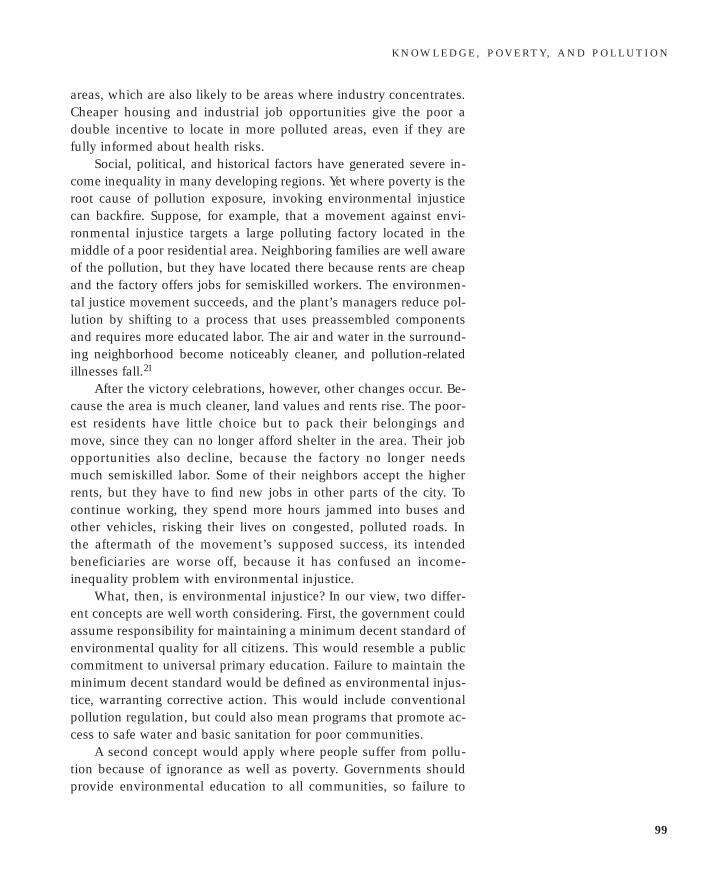
Industrial Dualism, Poverty, and PollutionSource: Corbis
Two Sides of Urban Mexico
JuárezJuárezEl PasoEl Paso
Healthy UnhealthyPaso del Norte Ozone Map

Knowledge, Poverty,and Pollution
Chapter Four
Mexico’s border with the United States runs from the PacificOcean to the Rio Grande, then winds southeast with theriver until it empties into the Gulf of Mexico near Mata-
moros. Along this 1,900-mile frontier, thousands of maquiladora fac-tories assemble products for duty-free export to the United States.Their explosive growth has provided employment for thousands ofyoung Mexicans, but some factories have also contributed to pollu-tion along both sides of the border.
Some of the worst pollution problems occur in the Paso delNorte region, where the Rio Grande crosses from the United Statesinto Mexico. Here the cities of Ciudad Juárez, Mexico, and El Paso,Texas, flank the river in a high desert valley that is prone to thermalinversions. In the 1980s, air pollution mounted as growth in bothcities accelerated. The U.S. Environmental Protection Agency citedEl Paso’s air quality as substandard, and U.S. environmental groupsopposed to the North American Free Trade Agreement (NAFTA)pointed to the region’s problems. Better to defer NAFTA, some ar-gued, until Mexican industry could handle pollution problems likethose in the Paso del Norte.
But which “Mexican industry”? Some firms handle their pollu-tion problems very well. Cemex (Cementos Mexicanos), for example,operates cement plants all over Mexico while setting a world stan-dard for environmental performance.1 Cemex’s Barrientos facilitywas the first cement plant in the Americas to receive ISO 14001 certi-
fication, and Mexico’s Environment Ministry has publicly lauded sixCemex plants for their participation in a voluntary environmentalaudit program.
In the border region, some maquiladora plants are undoubtedlyserious polluters. But many specialize in garment and electronics as-sembly operations that are less pollution intensive than heavy man-ufacturing. For example, in 1997 about 80 percent of maquiladorafactories were assembly operations (garments, electrical equipment,furniture, auto parts, etc.), 15 percent were in general manufactur-ing, and 5 percent produced chemicals.2
In fact, the worst industrial pollution in Juárez has no direct link toNAFTA or maquiladora production.3 It comes from small brick kilns,which belch filthy smoke from combustion of scrap wood, old tires,used motor oil, and sawdust laden with toxics (Figure 4.1). The kilnsevoke Mexico’s historic poverty, not its new prosperity. Most brickmakers live near their work sites in cardboard or scrap wood shanties,in which families crowd five to a room. Some 40 percent of the house-holds report the death of at least one child. Even the kiln owners aver-age only three years of schooling, and a quarter are illiterate.
Originally isolated in outlying squatter settlements, the kilnswere absorbed by urban sprawl as Juárez expanded. They posed nu-merous air pollution hazards for their neighbors, principally fromfine particles and carbon monoxide but also from volatile organiccompounds, nitrogen oxide, sulfur dioxide, and heavy metals.4 Aspublic awareness of such hazards grew, kiln-related incidents be-came the largest source of community complaints to the CiudadJuárez environmental authority.
Technically, the solution was clear: replace scrap fuels withpropane or natural gas. However, fierce price competition preventedfuel switching in the crude brick market. Rapid bankruptcy loomedfor any kiln operator who used propane, which cost 28 percent morethan scrap fuels despite state subsidies. Switching fuels also entailedacquiring a new burner, learning how to use it, and modifying thekiln itself.
Traditional regulation provided little incentive to switch. Thelocal environmental authority was not only understaffed but reluc-tant to confront the brick makers, many of whom were allied withpolitically powerful organizations. Some 40 percent belonged to anaffiliate of the Partido Revolucionario Institucional (PRI), Mexico’sdominant political party. Another 19 percent, in the poorest colo-nias, belonged to the Comite de Defensa Popular (CDP), which hadformed to resist the political establishment’s attempts to evict squat-
G R E E N I N G I N D U S T RY: N E W R O L E S F O R C O M M U N I T I E S , M A R K E T S , A N D G O V E R N M E N T S
82

Figure 4.1 Fuel Use and Pollution from Kilns
Source: Corbis; Courtesy of Octavio Chavez, Southwest Center for EnvironmentalResearch and Policy (SCERP), Instituto Tecnologico y de Estudios Superiores deMonterrey — Campus Ciudad Juarez (ITEMS), and Salud y Desarrollo Comunitariode Ciudad Juarez (SADEC/FEMAP)
ters. This tradition of resistance affected attitudes toward the localenvironmental agency, based partly on the fear that pollution controlwould bankrupt the kilns and eliminate jobs for over 2,000 of thepoorest people in Juárez.
Public pressure finally broke the regulatory deadlock in the early1990s. Action was sparked by election of a new municipal president,whose mandate included strong action to reduce pollution from thekilns. He banned dirty fuels and routinely jailed or fined violators.Support came from local and national NGOs, led by the MexicanFederation of Private Community Health and Development Associa-tions (FEMAP). FEMAP and the city authorities launched an aggres-sive public campaign to educate the brick makers and their neigh-bors about the health risks from burning scrap. In private meetings,they persuaded the brick makers’ organizations to support conver-
K N O W L E D G E , P O V E R T Y, A N D P O L L U T I O N
83
Smoke from Scrap Fuel
Two Options for Firing Bricks
The Clean Option: Gas Firing

sion to propane. Sensing an important business opportunity, localpropane suppliers offered the kiln owners free equipment to encour-age fuel-switching. Engineers from local universities provided freetechnical assistance, and engineers from the El Paso Natural GasCompany suggested more efficient kiln designs.
Paradoxically, the controversy over NAFTA also encouragedrapid progress, as transborder pollution became an important pawnin the struggle for public opinion. Anxious to promote the free-tradeagreement, the U.S. Government offered technical support for theswitch to propane. Motivated partly by NAFTA and partly by risingpublic interest in pollution control, the Mexican Government and itslocal PRI affiliate tacitly supported the municipal president’s cam-paign against kiln-based pollution.
From 1990 to 1992, these forces converged to transform small-scale brick making in Juárez. Over half of the city’s 300 brick mak-ers switched to propane firing, and pollution from the kilns droppedsharply. This transformation resonated far beyond Juárez, as itdemonstrated the feasibility of pollution control by small-scale in-dustry in the informal economy. However, the triumph was short-lived, as Mexico began eliminating subsidies for basic commoditiessuch as propane under its economic reform program. From 1992 to1995, the 28 percent cost differential between propane and scrap fir-ing leaped to 162 percent.
Bankruptcies and unemployment loomed as the remainingscrap-fired kilns easily undercut their cleaner competitors, and thisseismic shock destroyed the community consensus that had sup-ported conversion to propane. As support from community groupsand brick makers’ organizations evaporated and the municipal gov-ernment dropped its punitive enforcement stance, the clean kilnsquickly retreated to scrap firing.
Still, community awareness of pollution damage remained, withresidents redirecting their efforts into formal and informal pressuresto discourage use of the dirtiest scrap fuels—tires, battery cases, andused motor oil. A positive response from many brick makers haskept emissions below their 1990 level, albeit higher than the levelafter propane conversion.
The Ciudad Juárez story illustrates two ways that public actioncan reduce industrial pollution. First, environmental education andpolitical mobilization can lead local communities to raise marginalexpected pollution penalties (MEP; Figure 4.2). In Juárez, the com-munity fought pollution through formal channels, by filing com-plaints against the kilns and electing a municipal president who
G R E E N I N G I N D U S T RY: N E W R O L E S F O R C O M M U N I T I E S , M A R K E T S , A N D G O V E R N M E N T S
84

tightened enforcement. Informally, community-based NGOs pres-sured the brick makers’ organizations to support conversion topropane. Reversal occurred when national decontrol of propaneprices raised marginal abatement costs (MAC) again, but MEP didn’trevert to its 1990 level because environmental awareness had grown.
Governments can also cut pollution by providing support forconversion to clean production, thereby lowering marginal abate-ment costs. This approach is a promising alternative to traditionalregulation because it wields a carrot rather than a stick. It may alsoreduce pollution more cheaply than enforcement of formal regula-tions, which requires monitoring, data analysis, and, if necessary,police action—all time-consuming and expensive ways to raise MEP.
However, many economists have maintained that public inter-vention to curb pollution should stop at the factory gate, for a simpleand sensible reason: Factory managers know their operations betterthan regulators, who should simply establish incentives. WhenCETESB, São Paulo’s pollution control authority, launched an ag-gressive campaign to reduce pollution of the Tiete River, programmanagers attributed over 50 percent of the improvement to changesin manufacturing processes rather than installation of pollution con-
K N O W L E D G E , P O V E R T Y, A N D P O L L U T I O N
85
Pollution/Output
The Ciudad Juárez Experience
$ $
Free EquipmentTechnical ExtensionImproved Efficiency
MAC Decrease
Rising IncomeRising PopulationNAFTA UnsignedHealth EducationPolitical PressureLocal Pressure
MEP Increase
Propane Price Increase Job ConcernsNAFTA Signed
Pollution Decrease(1990–92)
19901992 1992 19901995
MEPMACMEP
MAC
MAC Increase MEP Decrease
Pollution Increase(1993–95)
Figure 4.2 Mexican Brick Makers in the ’90s: MAC vs. MEP

trol equipment.5 Environmental agencies do not typically promotesuch changes directly.
This arm’s-length regulatory model works effectively when well-informed factory managers can easily revamp their technology as in-centives shift. But what happens when plant managers face highconversion costs with little certainty about outcomes? One responsemight be that fast learners will adjust and expand while others willsuffer losses and leave the business. This approach has surface ap-peal, but it didn’t survive the test of experience in Ciudad Juárez, asconcern for jobs prompted the community to assist many kiln own-ers in taking the initial steps toward cleaner production.
Polluters often must make even more fundamental changes inthe way they do business to curb emissions. Is technical assistanceuseful and feasible in more complex situations? An affirmative re-sponse requires credible evidence that changes in plant managementcan significantly reduce pollution, and that governments can helpfirms make the needed changes at affordable cost. Recent researchfrom Mexico suggests that developing countries can satisfy bothconditions.
4.1 Helping Firms Adopt Environmental Management
Certification by the International Standards Organization (ISO)offers one vehicle for pursuing such initiatives. The ISO certifies in-ternational auditing firms, which in turn scrutinize the quality of fac-tories’ processes according to ISO guidelines. ISO-certified businesses,especially those seeking rapid growth in the international market-place, enjoy a competitive advantage because they can assure poten-tial customers that they maintain high quality standards. Many lead-ing firms prefer subcontractors that have satisfied ISO requirements.
The latest benchmark, ISO 14001, includes new standards forenvironmental management systems (EMS) based on thousands offirm-level case histories. According to this benchmark, plants musttake the following EMS steps to achieve ISO certification:
n Perform an initial managerial review to identify environmen-tal issues of concern, such as excessive use of polluting inputsand the potential for a serious environmental accident;
n Establish priorities for action, taking into account factors suchas local environmental regulations and potential costs;
n Establish an environmental policy statement, signed by theCEO, that includes commitments to compliance with environ-
G R E E N I N G I N D U S T RY: N E W R O L E S F O R C O M M U N I T I E S , M A R K E T S , A N D G O V E R N M E N T S
86

mental regulations, pollution prevention, and continuousimprovement;
n Develop performance targets based on the policy statement(such as reduction of emissions by a set amount over a de-fined period);
n Implement the environmental management system (EMS)with defined procedures and responsibilities; and
n Measure performance and conduct management audits.
Since the ISO published the preliminary version of 14001 in1996, factories in both developed and developing countries haverushed to obtain certification. Some 8,000 plants achieved certifica-tion by January 1999.6 Asia leads other developing regions, but LatinAmerica has also seen significant activity, and three African coun-tries (Egypt, Morocco, and South Africa) are represented (Figure 4.3,
K N O W L E D G E , P O V E R T Y, A N D P O L L U T I O N
87
100
10
20
30
0
40
80
100
Asia
0Latin America
Africa 0
20
40
50
Oceania
0
10
20
30
00
100
200Western Europe
0
North America
40
80
Eastern Europe
ISO 14001 Certifications, 1999Country Indices by Region*
10
20
Figure 4.3 International Diffusion of ISO 14001
*In the regional graphs, each bar represents one country.
Source: ISO World

Table 4.2).7 The developed world is split: Western Europe and Japanlead in certifications, while the United States and Canada lag behindmany newly industrialized countries that depend heavily on interna-tional trade.
A recent World Bank study examined a large sample of Mexicanfactories to determine whether factories that adopt ISO 14001 proce-dures reduce pollution (Box 4.1).8 Almost 50 percent of these facto-ries had adopted few or no procedures necessary for ISO certifica-tion, while 18 percent had completed most or all of the requiredsteps (Table 4.1). The research shows that process is important:Plants that have completed most of the ISO 14001 steps comply withpollution regulations far more than plants that have completed fewsteps.9
We also investigated the degree of “environmental mainstream-ing”: whether the plants had assigned environmental responsibilitiesto general managers rather than specialized managers, and whetherthe plants provided environmental training for all workers as well asenvironmental personnel. The plants varied substantially in theiradoption of such practices (Table 4.3). But our research shows thatmainstreaming works: Providing environmental training for all plantpersonnel and assigning environmental tasks to general managershelp plants comply with regulations.
Large vs. Small PlantsThe Mexico survey suggests that targeting assistance to help
smaller plants adopt such procedures would yield the biggest payoff.That’s partly because large factories are much better equipped tomonitor their own pollution (Figure 4.4). The survey shows that only5 percent of large plants lacked that capacity. Some 60 percent ofsmall plants could not monitor their air pollution or hazardous waste,while 40 percent lacked the ability to monitor water pollution.10
Differences in plant size also affect the rate at which plantsadopt ISO-type EMS procedures. Large branch plants with well-educated workers score 70 points higher on our EMS adoption index(Table 4.1) than small, individually owned plants operating withlower-skilled labor.
The Mexico study reveals the consequences of these variationsfor environmental performance: The regulatory compliance rate isonly about 25 percent for small, individually owned plants such asthe brick kilns of Ciudad Juárez, whose workers have little educa-tion (Figure 4.5). By contrast, the compliance rate is over 70 percent
G R E E N I N G I N D U S T RY: N E W R O L E S F O R C O M M U N I T I E S , M A R K E T S , A N D G O V E R N M E N T S
88

K N O W L E D G E , P O V E R T Y, A N D P O L L U T I O N
89
To learn more about the role of environmentalmanagement in promoting compliance withpollution regulations, the World Bank partici-pated in a survey of Mexican industry with ateam of regulators, academics, and industrial-ists.11 This team conducted confidential inter-views at 236 representative factories in all sizeclasses for four key polluting sectors: food,chemicals, nonmetallic minerals, and metals.
Figure B4.1a shows that about half of thefactories regularly fail to comply with Mexicanregulations. The study investigated the rela-tionship between compliance and four mea-sures of plant-level environmental manage-ment: (1) percent completion of steps likethose necessary for ISO 14001 EMS certifica-tion, (2) assignment of personnel to environ-mental tasks, (3) assignment of environmental
tasks to general managers rather than use ofspecialized managers, and (4) environmentaltraining for workers other than specializedpersonnel.
The results (Figure B4.1b) highlight theimportance of environmental managementand training, particularly the adoption of ISO14001-type procedures. Some 86 percent ofplants with high EMS adoption scores complywith regulations, while only 24 percent ofplants with low scores comply. Plants thathave assigned personnel to environmentaltasks report much higher compliance than oth-ers (58 percent vs. 34 percent), as do plantsthat have mainstreamed environmental con-cerns among managers (71 percent vs. 47 per-cent) and workers (59 percent vs. 34 percent).
Box 4.1 Environmental Management and Regulatory Compliance in Mexico
VeryGood
Compliant Not Compliant
Good Fair Poor VeryBad
Mexican Factories:Compliance with Pollution Regulations
Sam
ple
Pla
nts
0
20
40
60
80
100
120
Source: Dasgupta, Hettige, and Wheeler (1997)
Figure B4.1a Mexican Polluters
>75 25–75 <25 Yes No Yes No Yes No
Com
plia
nce
Rat
e (%
)
Environmental Management and RegulatoryCompliance in Mexico
Adoption Score:EnvironmentalManagement
System
30
0
10
20
40
50
60
70
80
90
Main-streaming
Labor?
Main-streaming
Management?
EnvironmentalPersonnel?
Source: Dasgupta, Hettige, and Wheeler (1997)
Figure B4.1b EMS and Compliance

G R E E N I N G I N D U S T RY: N E W R O L E S F O R C O M M U N I T I E S , M A R K E T S , A N D G O V E R N M E N T S
90
LatinAmerica
Costa Rica 2 22Argentina 37 12Brazil 65 8Mexico 27 8Chile 4 6Uruguay 1 5Colombia 3 4Peru 1 2
E. Europe
Hungary 31 69Slovak Rep. 8 40Slovenia 6 31Czech Rep. 12 22Croatia 3 15Poland 8 6Rumania 1 3Russia 1 1
W. Europe
Denmark 300 175Sweden 400 172Ireland 80 121Finland 130 105Switzerland 292 93Austria 180 80UK 950 78The Netherlands 300 75Germany 1100 47Belgium 120 45Norway 60 38Spain 116 20France 177 12Italy 100 9Portugal 7 7Greece 6 5
NorthAmerica
Canada 90 15USA 210 3
Region/ Number Index*Country Certified Value
Africa
Egypt 15 21South Africa 21 16Morocco 2 6
Asia
Korea 463 95Malaysia 80 82Thailand 100 59Singapore 60 59Japan 1542 32Philippines 23 26Hong Kong 40 24Turkey 40 20Indonesia 43 19India 60 16China 60 7Pakistan 2 3
Oceania
Mauritius 2 47New Zealand 27 45Australia 130 34
Region/ Number Index*Country Certified Value
Region/ Number Index*Country Certified Value
Adoption Score Number of Plants Percent
S ≤ 25 111 47.0
25 < S ≤ 50 45 19.1
50 < S ≤ 75 38 16.1
75 < S ≤ 100 42 17.8
Table 4.1 Adoption Index for ISO 14001 Procedures by Mexican Factories
Source: Dasgupta, Hettige, and Wheeler (1997)
Table 4.2 ISO 14001 Certification, 1999 by Country and Region
* Index = (Number Certified)/GDP, standardized to the range 1–200.

Management strategy Yes % No %
Environmental trainingfor nonenvironmentalworkers? 76 32.6 157 67.4
Environment manageralso has otherresponsibilities? 211 93.8 14 6.2
for large branch plants of publicly traded firms, which employ manyworkers with secondary-school education. As Figure 4.5 shows,plant size, firm size and worker education contribute roughlyequally to compliance.
Since many large plants already have EMS capability, govern-ment promotion of environmental management should focus onsmall- and medium-scale enterprises (SMEs). But from a public pol-icy perspective, doing so makes sense only if SMEs actually adoptEMS procedures, and if such intervention reduces pollution morecheaply than conventional regulation. For evidence on this issue, weturn to another recent Mexican project.
K N O W L E D G E , P O V E R T Y, A N D P O L L U T I O N
91
Table 4.3 Mainstreaming Environmental Management in Mexican Factories
Source: Dasgupta, Hettige, and Wheeler (1997)
AirPollution
HazardousWaste
WaterPollution
4%
61% 59%
5%
40%
6%
Small Plants
Large Plants
Small vs. Large PlantsLittle or No Ability to Monitor:
Figure 4.4 Plant Size and Monitoring Capacity
Source: Wells (1996)

Lessons from GuadalajaraMonitored experiments in promoting EMS within plants remain
rare; one notable exception is a recent project in Guadalajara, Mexico,that tested whether SMEs could successfully adopt environmentalmanagement systems. Eleven large companies, many of them multi-nationals, agreed to provide assistance to 22 small- and medium-scalesuppliers who were interested in improving their environmental per-formance. The project, which enlisted the private sector, local aca-demic institutions, the Mexican Government, and the World Bank,entailed several two-month cycles of intensive training, implementa-tion, and review sessions.12
After nine months of implementation, the 15 SMEs remaining inthe project rated their degree of EMS adoption on a 20-point scale. InMay 1997, the average adoption score was effectively zero. By Feb-ruary 1998, average scores had increased to around 16 points for en-vironmental planning and 11 points for EMS implementation. About80 percent of the plants reported lower pollution, and nearly 50 per-cent reported improved compliance and waste handling. Many alsoreported improved work environments, more efficient use of materi-als, and better overall economic performance (Figure 4.6).
G R E E N I N G I N D U S T RY: N E W R O L E S F O R C O M M U N I T I E S , M A R K E T S , A N D G O V E R N M E N T S
92
Compliance in Mexico:Small vs. Large Plants
Small Large
Publicly Traded
Plant Size
Multiplant Firm
Worker Education
Factors
Nonmetals Sector
Com
plia
nce
Rat
e (%
)
0
20
40
60
80
100
Figure 4.5 Plant Size and Compliance in Mexico
Source: Dasgupta, Hettige, and Wheeler (1997)

The Guadalajara project showed that SMEs can successfullyadopt EMS—with assistance. These plants will probably sustain thechanges, because the project covered the fixed costs of adjusting toan environmental management system; the incremental costs of op-erating an EMS should be much lower. Participating SMEs have alsoaltered their internal communications to provide constant feedbackon environmental problems and solutions. Once formed, this newbusiness culture will not easily disappear.
The Guadalajara project reduced pollution by lowering marginalabatement costs (MAC) rather than raising marginal expected pollu-tion penalties, as in conventional regulation. The evidence suggeststhat this alternative approach was cost competitive. The project’stotal cost was around $200,000. Because about 10 plants realizedsignificant benefits, the unit cost was approximately $20,000 perplant.13 To compare the project (an investment) with conventionalregulation (an annual flow of costs), we use the discounting ap-proach. We employ a 10 percent discount rate and assume that a re-duction in MAC from EMS adoption is sustainable. This yields anannualized cost of $2,000 per factory in perpetuity.
To estimate the cost of future projects in Guadalajara, we as-sume that local consultant fees are about 25 percent of fees chargedby the international consultants in the pilot program. The implied
K N O W L E D G E , P O V E R T Y, A N D P O L L U T I O N
93
0 20 40 60 80 100
Small Plants Reporting Improvements:Guadalajara Project
Percent of Total Plants (15)
Pollution Control
Waste Handling
Work Environment
Economic Performance
Input Use Efficiency
Compliance
Environmental Improvements
Other Improvements
Figure 4.6 Results From Adoption of ISO 14001
Source: Ahmed, Martin, and Davis (1998)

unit cost is $5,000 per plant, or $500 in annualized costs—roughlyequivalent to a month’s wages for a skilled worker in urban Mexico.To achieve similar results each year, conventional regulation wouldalmost certainly require equal or greater time and costs devoted tomonitoring, record keeping, and enforcement. What’s more, tradi-tional regulation is less likely to yield the economic benefits of EMSstemming from greater overall efficiency. We conclude that promot-ing EMS among SMEs compares favorably with attempting to regu-late these enterprises by conventional means.
Because they have been monitored and evaluated systemati-cally, both the Ciudad Juárez project and the Guadalajara projectprovide important new information about the power of government-supported learning to reduce pollution by SMEs. The Ciudad Juárezproject revealed the feasibility of improving pollution control in informal-sector, low-technology enterprises operated by some ofurban Mexico’s poorest, least-educated workers. Farther south, theGuadalajara project showed the feasibility of encouraging EMSadoption by somewhat more sophisticated small- and medium-scalesubcontractors to large firms. In both Ciudad Juárez and Guadala-jara, project funds financed the development of local consultingskills that will contribute to future pollution-reduction initiatives inthe private sector.
4.2 Who’s Complaining about Pollution?
In Ciudad Juárez, effective regulation required feedback to kilnowners from the surrounding community. This is not an isolatedcase. Despite their putative independence, pollution control agenciesrespond to the demands of the political institutions that determinetheir budgets and, ultimately, their legitimacy. Political leaders, inturn, respond to citizen complaints from communities affected bypollution.
Regulators also have an administrative reason to heed commu-nity protests: Monitoring is costly and agencies’ budgets are lean indeveloping countries, so they cannot remain fully informed about allpolluters. As a result, regulators often focus resources on respondingto citizen complaints. For example, the pollution control agency ofBrazil’s Rio de Janeiro State devotes nearly 100 percent of its inspec-tion resources to complaints. After setting aside 50 percent of its re-sources for targeting priority polluters, São Paulo’s pollution controlagency allocates the remainder to complaints. In Indonesia, the na-
G R E E N I N G I N D U S T RY: N E W R O L E S F O R C O M M U N I T I E S , M A R K E T S , A N D G O V E R N M E N T S
94

tional pollution control agency has few inspectors but allocatesmuch of their time to complaints. China’s provincial and local regu-lators respond annually to more than 100,000 citizen complaints.14
Although complaints are a valuable source of low-cost informa-tion, regulation based on complaints may suffer from serious biases.Plaintiffs may lack enough information to distinguish between “nui-sance” emissions and those that are truly hazardous. Colorless,odorless toxics and heavy metals may escape notice altogether. Fur-thermore, some individuals or communities may simply complainmore, regardless of the objective situation. If regulators automati-cally respond to complaints, aggressive plaintiffs may capture mostof the available resources.
World Bank researchers have used new data from China to learnmore about the links between complaints, environmental conditions,and the characteristics of communities.15 China’s citizens are farfrom passive about pollution from neighboring factories. From 1987to 1993 the nation’s environmental authorities recorded over 130,000complaints per year, mostly related to air, water, and noise pollution.These complaints generated action: In almost all provinces, agencyresponse rates varied from 70 to 100 percent. Responding to so manycomplaints absorbed much of regulatory inspectors’ time.
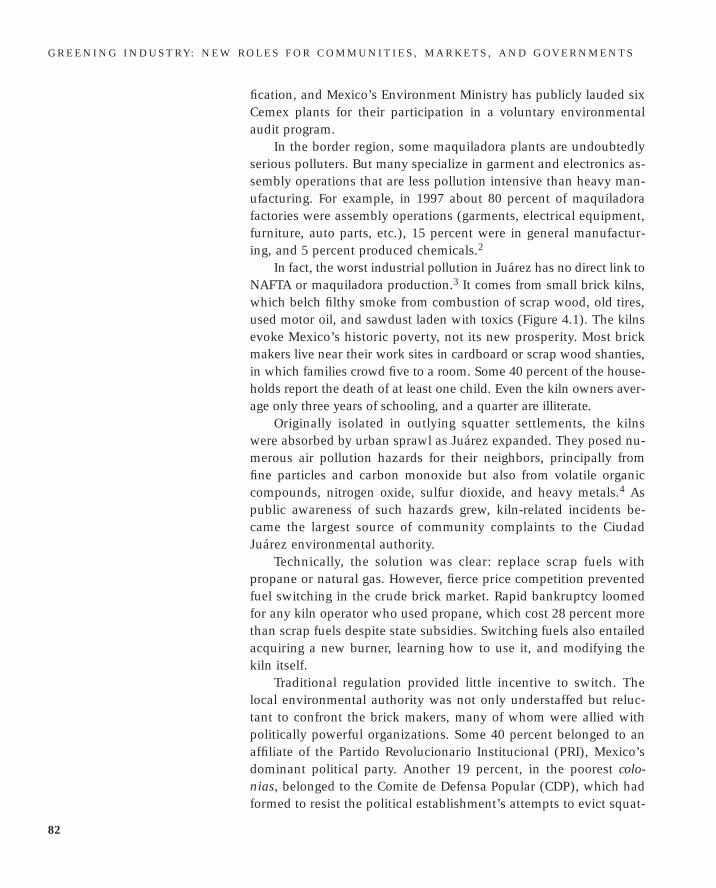
But Figure 4.7 shows that the propensity to complain varies con-siderably across China’s provinces. In 1993, Shanghai and Tianjinreported some 30 complaints per 100,000 individuals, but Gansu,Xinjiang, and Inner Mongolia reported less than 5 complaints per100,000. The incidence of complaints was generally highest in theurban industrial centers of east China, lower in the middle provinces,and lowest in the western hinterlands, the least-developed region.
To assess the factors influencing these provincial differences, weanalyzed the impacts of pollution, income, and education on the in-cidence of complaints. Holding income and education constant, wefound that provinces with high emissions reported 75 percent morecomplaints than lightly polluted provinces. However, this effect ap-plied only to highly visible pollutants such as particulates.
Holding pollution and education constant, we found complaintsin high-income provinces 110 percent more numerous than in low-income provinces. Another recent study shows that such complaintsinduce local regulators to raise the air pollution levy, thereby lower-ing industry’s air pollution intensity.16 Box 4.2 illustrates the conse-quences for 50 Chinese cities: Richer areas that complain more havesignificantly cleaner air.17
K N O W L E D G E , P O V E R T Y, A N D P O L L U T I O N
95
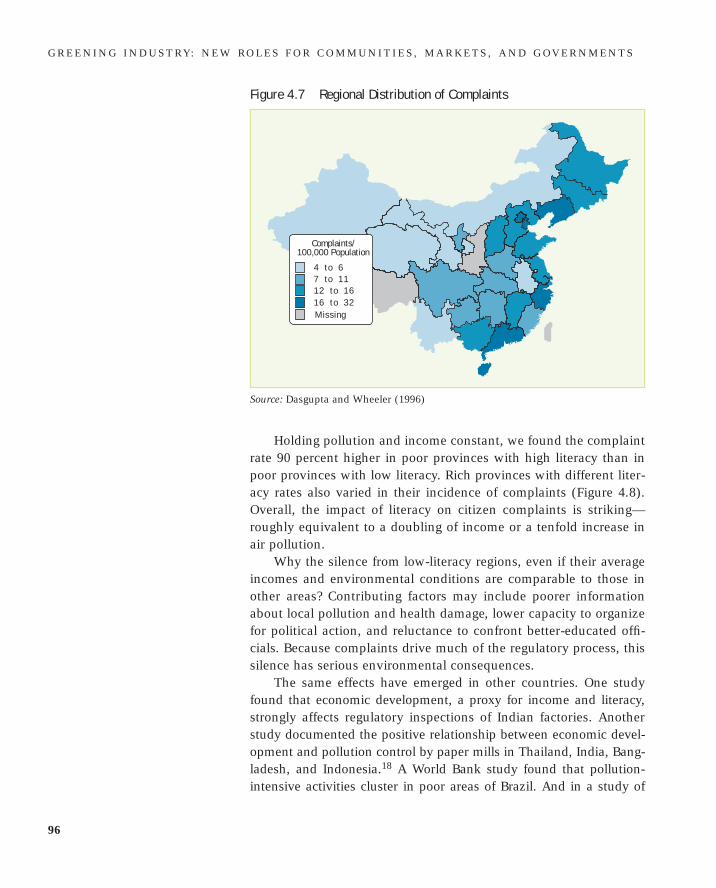
Holding pollution and income constant, we found the complaintrate 90 percent higher in poor provinces with high literacy than inpoor provinces with low literacy. Rich provinces with different liter-acy rates also varied in their incidence of complaints (Figure 4.8).Overall, the impact of literacy on citizen complaints is striking—roughly equivalent to a doubling of income or a tenfold increase inair pollution.
Why the silence from low-literacy regions, even if their averageincomes and environmental conditions are comparable to those inother areas? Contributing factors may include poorer informationabout local pollution and health damage, lower capacity to organizefor political action, and reluctance to confront better-educated offi-cials. Because complaints drive much of the regulatory process, thissilence has serious environmental consequences.
The same effects have emerged in other countries. One studyfound that economic development, a proxy for income and literacy,strongly affects regulatory inspections of Indian factories. Anotherstudy documented the positive relationship between economic devel-opment and pollution control by paper mills in Thailand, India, Bang-ladesh, and Indonesia.18 A World Bank study found that pollution-intensive activities cluster in poor areas of Brazil. And in a study of
G R E E N I N G I N D U S T RY: N E W R O L E S F O R C O M M U N I T I E S , M A R K E T S , A N D G O V E R N M E N T S
96
Complaints/100,000 Population
4 to 6 7 to 11 12 to 16 16 to 32 Missing
Figure 4.7 Regional Distribution of Complaints
Source: Dasgupta and Wheeler (1996)

Indonesia, researchers found that factories in municipalities in the bot-tom quartile of income and postprimary schooling have organic waterpollution intensity 15 times the level of plants in communities in thetop quartile of income and education.19
Recent research on Brazil found that although pollution-inten-sive activities are more prevalent in poor municipalities, overall pol-lution problems are much worse in affluent municipalities becausethe volume of industrial production is much larger (Box 2.2).20
K N O W L E D G E , P O V E R T Y, A N D P O L L U T I O N
97
Poverty is a curse, but the poor might hope forat least one compensation: Since richer areashave more industrial production, they mightwell have more pollution. Unfortunately, the in-habitants of China’s poor regions have no suchconsolation. Figure B4.2 displays the relation-ship between average wages and emissions den-sity (or emissions per unit area, a reasonableproxy for atmospheric pollution concentration)in 50 Chinese cities. For suspended particulates(TSP), pollution density clearly rises as wagesfall. The poorest cities also have higher densi-ties of SO2 emissions than the richest cities, al-though the graph suggests that emissions den-
sity rises from poor to middle-income cities andthen falls to the lowest levels in the richestareas.
Why this tragic association betweenpoverty and pollution? Richer areas do havehigher levels of industrial production, but pro-duction in those areas is also much cleaner be-cause citizen feedback is stronger (Figure 4.8)and regulation is tighter. Also, industrial facili-ties in areas with unskilled workers generallyoperate at lower efficiency and create morewaste. The scale of industrial production in agiven region therefore plays second fiddle topollution intensity in China.
Box 4.2 In China the Poor Get More . . . PollutionLo
g TS
P D
ensi
ty
03.35 3.45 3.55 3.65 3.75 3.85 3.95
Log Wage
l
SO2 Pollution vs. Income in 50 Chinese Cities
0.5
1
1.5
2
2.5
3
l
l
llll
l
lll
ll
ll
l
lllll
llllll
llllllllllll
l
lll llll
Log
SO
2 D
ensi
ty
TSP Pollution vs. Income in 50 Chinese Cities
3.35 3.45 3.55 3.65 3.75 3.85 3.95
Log Wage
0
0.5
1
1.5
2
2.5
3
l
llll
l
l
ll
ll
llll
ll
llll
ll
ll
ll
llll
llllllll
lllll
ll
l
l
Source: SEPA
Figure B4.2 Income and Air Pollution
Nevertheless, studies of Rio de Janeiro and São Paulo have shownthat pollution-intensive industry dominates the poorer municipali-ties within these metropolitan regions. Even in cases where richerareas are more polluted, poor residents of those regions suffer thegreatest exposure.
4.3 Redefining Environmental Injustice
In the United States, the belief that polluters in poor, uneducatedcommunities face laxer regulation and operate at higher levels ofpollution intensity has catalyzed a political movement for environ-mental justice. Its goal is equal environmental quality for all citi-zens, regardless of their income, education, or ethnicity.
The concept of environmental justice has strong intuitive appealfor developing countries as well, as so many poor citizens sufferfrom pollution. Yet what appears to be clear evidence of environ-mental injustice can also reflect broader economic problems. For ex-ample, environmental problems can reflect the economics of loca-tion. Decades of research have shown that urban land values areaffected by a variety of factors, including residents’ exposure to pol-lution. Both land values and housing rents are lower in polluted
G R E E N I N G I N D U S T RY: N E W R O L E S F O R C O M M U N I T I E S , M A R K E T S , A N D G O V E R N M E N T S
98
RegionRichPoor
China: Poverty, Literacy, and Pollution Complaints
Com
plai
nt R
ate
0
5
10
15
20
25
HighLiteracy(84%)
LowLiteracy(60%)
HighLiteracy(90%)
LowLiteracy(77%)
Figure 4.8 Literacy and Complaints
areas, which are also likely to be areas where industry concentrates.Cheaper housing and industrial job opportunities give the poor adouble incentive to locate in more polluted areas, even if they arefully informed about health risks.
Social, political, and historical factors have generated severe in-come inequality in many developing regions. Yet where poverty is theroot cause of pollution exposure, invoking environmental injusticecan backfire. Suppose, for example, that a movement against envi-ronmental injustice targets a large polluting factory located in themiddle of a poor residential area. Neighboring families are well awareof the pollution, but they have located there because rents are cheapand the factory offers jobs for semiskilled workers. The environmen-tal justice movement succeeds, and the plant’s managers reduce pol-lution by shifting to a process that uses preassembled componentsand requires more educated labor. The air and water in the surround-ing neighborhood become noticeably cleaner, and pollution-relatedillnesses fall.21
After the victory celebrations, however, other changes occur. Be-cause the area is much cleaner, land values and rents rise. The poor-est residents have little choice but to pack their belongings andmove, since they can no longer afford shelter in the area. Their jobopportunities also decline, because the factory no longer needsmuch semiskilled labor. Some of their neighbors accept the higherrents, but they have to find new jobs in other parts of the city. Tocontinue working, they spend more hours jammed into buses andother vehicles, risking their lives on congested, polluted roads. Inthe aftermath of the movement’s supposed success, its intendedbeneficiaries are worse off, because it has confused an income-inequality problem with environmental injustice.
What, then, is environmental injustice? In our view, two differ-ent concepts are well worth considering. First, the government couldassume responsibility for maintaining a minimum decent standard ofenvironmental quality for all citizens. This would resemble a publiccommitment to universal primary education. Failure to maintain theminimum decent standard would be defined as environmental injus-tice, warranting corrective action. This would include conventionalpollution regulation, but could also mean programs that promote ac-cess to safe water and basic sanitation for poor communities.
A second concept would apply where people suffer from pollu-tion because of ignorance as well as poverty. Governments shouldprovide environmental education to all communities, so failure to
K N O W L E D G E , P O V E R T Y, A N D P O L L U T I O N
99

inform poor neighborhoods about dangerous pollution would qual-ify as injustice. The Ciudad Juárez case shows how effective publiceducation can be. Very poor people in the colonias supported regula-tion of the kilns after an education campaign persuaded them thatthe health benefits would compensate for the additional risk of un-employment and higher rents. The program worked because it tar-geted serious polluters and provided assistance for their conversionto propane firing. Better-informed colonias continued to supportcleaner production after propane price decontrol, but concern forjobs shifted their focus to pressure for cleaner scrap fuels.
Ciudad Juárez demonstrated the power of public education topromote environmental change even when poverty remains unal-tered. In our view, this is an important arena in which the strugglefor environmental justice should be joined.
References
Afsah, S., B. Laplante, and D. Wheeler, 1997, “Regulation in the In-formation Age: Indonesian Public Information Program For En-vironmental Management,” World Bank, March.
Ahmed, K., P. Martin, and S. Davis, 1998, “Mexico: The GuadalajaraEnvironmental Management Project,” World Bank, September.
Blackman, A., and G. Bannister, 1998a, “Pollution Control in the In-formal Sector: The Ciudad Juárez Brickmakers’ Project,” Nat-ural Resources Journal, Vol. 37, No. 4, 829–56.
———, 1998b, “Community Pressure and Clean Technology in theInformal Sector: An Econometric Analysis of the Adoption ofPropane by Traditional Mexican Brickmakers,” Journal of Envi-ronmental Economics and Management, Vol. 35, No. 1, 1–21.
Chávez, O., 1995, “Alternative Fuels for Brick-Makers, CD Juárez,Mexico Project,” Southwest Center for Environmental Researchand Policy (SCERP). Reproduced from the SCERP Web site athttp://www.civil.utah.edu/scerp/brickmaker/brickmaking.html.
Dasgupta, S., H. Hettige, and D. Wheeler, 1997, “What Improves En-vironmental Performance? Evidence from Mexican Industry,”World Bank Development Research Group Working Paper, No.1877, December.
Dasgupta, S., R. Lucas, and D. Wheeler, 1998, “Small Plants, Pollu-tion and Poverty: Evidence from Mexico and Brazil,” WorldBank Development Research Group Working Paper, No. 2029,November.
G R E E N I N G I N D U S T RY: N E W R O L E S F O R C O M M U N I T I E S , M A R K E T S , A N D G O V E R N M E N T S
100

Dasgupta, S., H. Wang, and D. Wheeler, 1997, “Surviving Success:Policy Reform and the Future of Industrial Pollution in China,”World Bank Policy Research Department Working Paper, No.1856, October.
Dasgupta, S., and D. Wheeler, 1996, “Citizen Complaints As Envi-ronmental Indicators: Evidence From China,” World Bank PolicyResearch Department Working Paper, No. 1704, November.
Hamson, D., 1996, “Reducing Emissions from Brick Kilns in CiudadJuárez: Three Approaches,” Border Environment Research Re-ports, No. 2, Southwest Center for Environmental Research andPolicy (SCERP), June. Reproduced from the SCERP Web site athttp://www.civil.utah.edu/scerp/docs/berr2.html.
Hartman, R., M. Huq, and D. Wheeler, 1997, “Why Paper MillsClean Up: Determinants of Pollution Abatement in Four AsianCountries,” World Bank Policy Research Department WorkingPaper, No. 1710, January.
Hettige, H., M. Huq, S. Pargal, and D. Wheeler, 1996, “Determinantsof Pollution Abatement in Developing Countries: Evidence fromSouth and Southeast Asia,” World Development, Vol. 24, No. 12,1891–1904.
Ostro, B., 1994, “The Health Effects of Air Pollution: A MethodologyWith Applications to Jakarta,” World Bank Policy Research De-partment Working Paper, No. 1301, May.
Pargal., S., M. Huq, and M. Mani, 1997, “Inspections and Emissionsin India: Puzzling Survey Evidence on Industrial Water Pollu-tion,” World Bank Development Research Group Working Paper,No. 1810, August.
Pargal, S., and D. Wheeler, 1996, “Informal Regulation of IndustrialPollution in Developing Countries: Evidence From Indonesia,”Journal of Political Economy, Vol. 104, No. 6, 1314+.
Petzinger, T., 1996, “Mexican Cement Firm Decides to Mix Chaosinto Company Strategy,” Wall Street Journal, December 13.
Stotz, E., 1991, “Luta Pela Saude Ambiental: A AMAP Contra Cor-tume Carioca, S.A., Una Experiencia Vitoriosa,” V. V. Valla andE. N. Stotz (eds.) Participacao Popular, Educacao e Saude, Rio deJaneiro, 133–60.
Wang, H., and D. Wheeler, 1996, “Pricing Industrial Pollution inChina: An Econometric Analysis of the Levy System,” World BankPolicy Research Department Working Paper, No. 1644, September.
——— 1999, “China’s Pollution Levy: An Analysis of Industry’s Re-sponse,” presented to the Association of Environmental and Re-
K N O W L E D G E , P O V E R T Y, A N D P O L L U T I O N
101

source Economists (AERE) Workshop, “Market-Based Instru-ments for Environmental Protection,” John F. Kennedy School ofGovernment, Harvard University, July 18–20.
Wells, R., 1996, “Prevención y Control de la Contaminación en la In-dustria Mexicana: Reporte de Una Encuesta,” (Lexington, Mass:The Lexington Group), December.
End Notes
1. See Petzinger (1996) for a report on Cemex’s innovative rolein Mexican business.
2. Statistics reported by Mexico’s Secretariat for Commerce andIndustrial Promotion (SECOFI) at http://www.nafta-mexico.org/export.htm.
3. Our discussion of the Ciudad Juárez case draws heavily ontwo papers by Allen Blackman and Geoffrey Bannister (1998a,b),which document the authors’ extensive primary research and econo-metric analysis. Our thanks to Allen Blackman for additional discus-sion of Ciudad Juárez in a series of personal communications. Foradditional information about the brick kiln pollution problem, seeHamson (1996) and Chávez (1995).
4. Blackman and Bannister (1998a) cite a study of brick makersin Saltillo, Mexico, that finds that 47 percent of subjects tested had“abnormal” pulmonary functions. See Ostro (1994) for detailed dis-cussion of the impacts on health of particulates.
5. Interviews with CETESB staff.6. Reinhard Peglau of the Federal Environmental Agency, Repub-
lic of Germany, provided these estimates. They are reproduced by ISOWorld at http://www.ecology.or.jp/isoworld/english/analy14k.htm.
7. To control for extreme scale differences, such as betweenCosta Rica and China, we divided each country’s total certificationsby its GDP, and standardized the result on a scale from 1 to 200.
8. See Dasgupta, Hettige, and Wheeler (1997).9. The study recognizes the possibility of reverse causation:
Once other factors have convinced plant managers to comply withregulations, they could implement the ISO 14001 steps as part of theimprovement process. However, this would not imply that the ISO14001 steps caused the improvement. The research (Dasgupta, Het-tige, and Wheeler, 1997) uses standard econometric techniques toadjust for this problem.
10. See Wells (1997).
G R E E N I N G I N D U S T RY: N E W R O L E S F O R C O M M U N I T I E S , M A R K E T S , A N D G O V E R N M E N T S
102

11. Participants included Mexico’s National Environment Min-istry (SEMARNAP), the Monterrey Institute of Technology, and theMexican National Association of Industries. Both the survey ques-tionnaire and the data are available online at http://www.world-bank.org/nipr/work_paper/1877/survey/index.htm.
12. This summary is based on a World Bank report by Ahmed,Martin, and Davis (1998).
13. The final project report estimates the cost of the pilot projectto be $135,000, excluding the time and travel costs of World Bankstaff. Including these factors would increase the estimated cost toaround $200,000.
A second approach would apportion the cost among all 15 par-ticipating plants, lowering the apparent cost per plant. However,measured benefits were apparently zero for 5 plants, so this ap-proach would yield the same result as the first, because the expectedvalue of results per plant would be lowered proportionately.
14. Complaint-response systems in Brazil, China, and Indonesiaare familiar to the authors from collaborative work with FEEMA,CETESB, BAPEDAL, and China’s State Environmental ProtectionAgency (SEPA).
15. See Dasgupta and Wheeler (1996). Data linking environ-mental conditions, pollution complaints, and community character-istics in China are available online at http://www.worldbank.org/nipr/data/china/status.htm #Province.
16. See Wang and Wheeler (1999).17. See Wang and Wheeler (1996) and Dasgupta, Wang, and
Wheeler (1997).18. See Pargal, Huq, and Mani (1997) and Hartman, Huq, and
Wheeler (1997).19. See Dasgupta, Lucas, and Wheeler (1998) and Pargal and
Wheeler (1996).20. See Dasgupta, Lucas, and Wheeler (1998).21. In extreme cases, the targeted plant may simply move away.
Stotz (1991) describes such a case for a tannery in Rio de Janeiro,Brazil. Environmental regulators in Rio have reported to the authorsthat middle-income residents led the movement against the plant;lower-income families were far more reluctant to act, because theyvalued the tannery as a source of employment.
K N O W L E D G E , P O V E R T Y, A N D P O L L U T I O N
103