types and roles of entrepreneurship - panteiaondernemerschap.panteia.nl/pdf-ez/h201418.pdf · types...
TRANSCRIPT
Types and roles of entrepreneurship
The value of different types of entrepreneurs for
the Dutch economy and society
André van Stel (editor)
With contributions by:
Amber van der Graaf
Brigitte Hoogendoorn
Jan de Kok
Jacqueline Snijders
André van Stel
Nardo de Vries
Paul Vroonhof
Sander Wennekers
Zoetermeer, September 2015

The responsibility for the contents of this report lies with Panteia. Quoting numbers or
text in papers, essays and books is permitted only when the source is clearly mentioned.
No part of this publication may be copied and/or published in any form or by any means,
or stored in a retrieval system, without the prior written permission of Panteia. Panteia
does not accept responsibility for printing errors and/or other imperfections.
This research has been partly cofinanced by the research programme SMEs and
Entrepreneurship (www.entrepreneurship-sme.eu)
reference number H201418
publication September 2015
number of pages 118
email address corresponding author [email protected]
address Panteia
Bredewater 26
P.O. Box 7001
2701 AA Zoetermeer
The Netherlands
Phone: +31 79 322 20 00
All the research reports are available on the website www.entrepreneurship-sme.eu

3
Contents
1 Introduction 7
2 Incorporating roles and types of entrepreneurship in
the entrepreneurial ecosystem approach 9 2.1 Extending the entrepreneurial ecosystem approach 9 2.2 The role of the entrepreneur in economic theory 12 2.3 Categorizations and types of entrepreneurs 23 2.4 Literature 24
3 Ambitious entrepreneurs 29 3.1 Introduction 29 3.2 Explaining ambitious entrepreneurship 30 3.3 Prevalence and characteristics of ambitious entrepreneurship 32 3.4 Economic contributions of ambitious entrepreneurship 34 3.5 Summary and policy implications 35 3.6 Literature 37
4 Solo self-employed 41 4.1 Introduction 41 4.2 Prevalence and characteristics of the solo self-employed 42 4.3 The economic contributions of the solo self-employed 46 4.4 Summary and policy implications 50 4.5 Literature 51
5 Green entrepreneurs 53 5.1 Introduction 53 5.2 Defining green entrepreneurship 54 5.3 Prevalence and determinants of green entrepreneurship 58 5.4 Economic and societal contributions 64 5.5 Summary and policy implications 65 5.6 Literature 66
6 Younger versus older entrepreneurs 69 6.1 Introduction 69 6.2 Prevalence and determinants of entrepreneurship across different
age groups 69 6.3 Economic and societal contributions of young entrepreneurs 73 6.4 Summary and policy implications 76 6.5 Literature 77
7 Higher educated entrepreneurs 81 7.1 Prevalence 81 7.2 Contributions 82 7.3 Summary and policy implications 84 7.4 Literature 85
4
8 Women entrepreneurs 87 8.1 Introduction 87 8.2 Prevalence, characteristics, and determinants of women
entrepreneurship 87 8.3 Economic and social contributions 95 8.4 Summary and policy implications 97
9 Inclusive entrepreneurship 99 9.1 Introduction 99 9.2 Prevalence and characteristics of inclusive entrepreneurship 99 9.3 Economic and social contributions 103 9.4 Barriers to entrepreneurship 104 9.5 Summary and policy implications 106
10 Summary and conclusions 109
Tables
table 1 Entrepreneurial roles x intermediate linkages 17
table 2 Intermediate linkages x final (economic and societal) contributions 21
table 3 Empirical literature on various types of entrepreneurship 24
table 4 Share of innovative solo self-employed compared to SMEs,
2010-2013 48
table 5 Overview of three related areas of entrepreneurship research 54
table 6 Country average on the prevalence of three measures of green
entrepreneurship 59
table 7 Determinants of green entrepreneurship 63
Figures
figure 1 Key elements, outputs and outcomes of the entrepreneurial
ecosystem 10 figure 2 Extending the entrepreneurial ecosystem 12 figure 3 Exploration and exploitation as successive phases of the cycle of
innovation 16 figure 4 A model of ambitious entrepreneurship and growth realization 31 figure 5 Job growth expectations between now and five years of early-stage
entrepreneurs internationally compared (unweighted average), 2013,
percentage of TEA 32 figure 6 Development of high job growth expectation (more than 19 jobs) of
early-stage entrepreneurs in the Netherlands and innovation-driven
economies, 2002-2013, percentage of TEA 33 figure 7 The share of solo self-employment in the working population in the
Netherlands (broad and narrow definition), 2000-2014 42 figure 8 Share of female solo self-employment in total solo self-employment
in the Netherlands in 2014, by sector 44 figure 9 Age distribution of solo self-employed and employees (15-64)
in the Netherlands, 2014 44 figure 10 Distribution of educational level of solo self-employed by sector
in the Netherlands, 2014 45 figure 11 Ambitions of solo self-employed, 2012 50 figure 12 Total early-stage entrepreneurial activity (TEA) rate in the
Netherlands, 2010-2013, by age group 70

5
figure 13 Start-up rates by age group in the Netherlands, 2002 and 2009 71 figure 14 Business ownership rates by age group in the Netherlands,
2002 and 2009 72 figure 15 Total early-stage Entrepreneurial Activity (TEA) in the Netherlands
and innovation-driven economies, 2013, percentage of a given
subgroup by highest attained education level 81 figure 16 Product innovativeness of early-stage entrepreneurs in the
Netherlands, 2013, percentage of a given subgroup by highest
attained education level 84 figure 17 Total Early-stage Entrepreneurial Activity (TEA) rate in the
Netherlands and innovation-driven economies, 2013, percentage
of adult population by gender 88 figure 18 Percentage of entrepreneurs in total active labour force
(entrepreneurship rate) by gender and country in Europe-37, 2012 89 figure 19 Percentage of women entrepreneurs of total number of entrepreneurs,
by sector in the Netherlands, 2011 90 figure 20 Percentage entrepreneurs by gender and age in the Netherlands
and EU-28, 2003 and 2012 91 figure 21 Percentage of entrepreneurs by gender and education in the
Netherlands and EU-28, 2003 and 2012 91 figure 22 Percentage of part-time entrepreneurs by gender in the Netherlands
and EU-28, 2003, 2008 and 2012 96 figure 23 Established entrepreneurship in the Netherlands and innovation-driven
economies, 2013, percentage of a given subgroup 101 figure 24 Total early-stage entrepreneurial activity (TEA) in the Netherlands
and innovation-driven economies, 2013, percentage of a given
subgroup 102 figure 25 Total early-stage entrepreneurial activity (TEA) in the Netherlands,
2010-2013, percentage of a given age category 102 figure 26 Main roles, intermediate linkages and final economic and societal
contributions of six entrepreneurial types 114


7
1 Introduction
Entrepreneurship is a multi-faceted phenomenon and the heterogeneity of
entrepreneurs in the economy is huge. In fact, Gartner (1985, p. 696) argued that:
‘The diversity among entrepreneurs and their ventures may be larger than the
differences between entrepreneurs and non-entrepreneurs and between
entrepreneurial firms and non-entrepreneurial firms’. Entrepreneurship is often
positively associated with macro-economic performance (see, e.g., Carree and Thurik,
2010). But even so, because in most empirical studies the population of entrepreneurs
is treated as a homogeneous group, our knowledge concerning how different types of
entrepreneurs may contribute differently to value creation at the aggregate level is
still rather limited (Stam and Van Stel, 2011).
A recent theoretical approach aimed at identifying (productive) types of entrepreneurs
is called the entrepreneurial ecosystem approach (see, e.g., Stam, 2014). In this
approach the link between different types of entrepreneurs and aggregate value
creation is studied as well as the link between structural characteristics of an economy
(framework conditions) and the various types of entrepreneurs.
The present report aims at shedding more light on the question which types of
entrepreneurs make which contribution to aggregate value creation by adopting and
extending the entrepreneurial framework approach. In particular, for a relevant
selection of entrepreneurial types we will investigate in some detail how and to which
type of value creation (e.g. job creation or well-being) these entrepreneurs contribute.
To this end we build on theoretical literature describing the various roles that the
entrepreneur plays in economy and society (cf. Hébert and Link, 1989), and construct
a framework as to how these roles contribute to (different types of) value creation.
We then review empirical literature to see how different types of entrepreneurial
activity are related to these various roles and contributions to value creation. For our
selection of entrepreneurial types we also benchmark the Netherlands with other
countries based on quantitative information on prevalence, and we review the
empirical literature on characteristics and determinants (including framework
conditions) of the selected types of entrepreneurship. Our selection of types includes
(1) ambitious entrepreneurs, (2) solo self-employed, (3) ‘green’ entrepreneurs, (4)
younger vs. older entrepreneurs, (5) higher vs. lower educated entrepreneurs, (6)
women entrepreneurs, (7) inclusive entrepreneurs (i.e., entrepreneurs stemming from
immigrant, disabled and young age groups).
Note that our operationalizations of these entrepreneurial ‘types’ is based on
demographics of the entrepreneurs, and on characteristics of the entrepreneurial
activity involved or organizational form, i.e., it is based on characteristics that are
relatively easy to measure empirically. Hence, for our selection of entrepreneurial
types we do not employ theoretical notions of entrepreneurship such as the discovery
of opportunities, or the introduction of some form of newness. These theoretical
notions do play a role though in the construction of our framework linking
entrepreneurial activity to aggregate value creation via the various roles of the
entrepreneur, and in our subsequent discussion of the selected types.

8
In short, our report aims at providing more insights into (1) which types of
entrepreneurs contribute to (different types of) value creation, (2) how the
Netherlands score on these types relative to benchmark countries, (3) the
characteristics and determinants of these types.
The set-up of this report is as follows. In chapter 2 we construct a theoretical
framework identifying how (different types of) entrepreneurial activity contributes to
(different types of) value creation, while adopting and extending the entrepreneurial
ecosystem approach (Stam, 2014), and building on theoretical literature dealing with
the role of the entrepreneur in economy and society (cf. Hébert and Link, 1989). As
many different types of entrepreneurship can be considered, and only seven of these
were selected for our empirical review, in section 2.3 we explain and justify our
selection of which entrepreneurial types are investigated empirically in some detail.
Chapters 3 to 9 then focus on the seven entrepreneurial types mentioned above. For
each type, the Netherlands will be benchmarked with other countries with respect to
prevalence. Furthermore, based on a review of empirical literature, characteristics and
determinants of this type will be identified, as well as the extent of association of this
type with the various roles of the entrepreneur in economy and society and their
associated contribution to value creation. These chapters can be informative for policy
makers as they reveal the relative prevalence of each entrepreneurial type for the
Netherlands (are we lagging behind or not), its contribution to value creation, and its
determinants (tools for stimulation or encouragement). Chapter 10 provides a
summary as well as conclusions of the study.
Literature
Carree, M.A. and A.R. Thurik (2010), The impact of entrepreneurship on economic
growth, in: D.B. Audretsch and Z.J. Acs (eds.), Handbook of Entrepreneurship
Research, Berlin/Heidelberg: Springer Verlag, 557-594.
Gartner, W.B. (1985), A conceptual framework for describing the phenomenon of new
venture creation, Academy of Management Review 10 (4), 696-706.
Hébert, R.F. and A.N. Link (1989), In search of the meaning of entrepreneurship,
Small Business Economics 1, 39-49.
Stam, E. (2014), The Dutch Entrepreneurial Ecosystem, Utrecht: Birch Research.
Available at SSRN: http://ssrn.com/abstract=2473475 or
http://dx.doi.org/10.2139/ssrn.2473475
Stam, E. and A. van Stel (2011), Types of Entrepreneurship and Economic Growth, in:
A. Szirmai, W. Naudé and M. Goedhuys (eds.), Entrepreneurship, Innovation,
and Economic Development, Oxford, UK: Oxford University Press, 78-95.

9
2 Incorporating roles and types of
entrepreneurship in the entrepreneurial
ecosystem approach
Sander Wennekers – Rotterdam School of Management, Erasmus University
Rotterdam
André van Stel – Kozminski University, Warsaw, Poland & Trinity College Dublin,
Ireland1
2.1 Extending the entrepreneurial ecosystem approach
As mentioned in the Introduction, in this report we study different types of
entrepreneurs and the roles they play in economy and society. We will do so by
connecting to the so-called entrepreneurial ecosystem approach. According to Stam
(2014), an entrepreneurial ecosystem is “an interdependent set of actors that is
governed in such a way that it enables entrepreneurial action” (p. 1). The
entrepreneurial ecosystem approach emphasizes the person of the entrepreneur as
the central figure in the ecosystem (rather than the firm). It also emphasizes the role
of context (e.g. government institutions) in enabling or constraining (productive)
entrepreneurship. Baumol (1990) distinguished between productive, unproductive and
destructive types of entrepreneurship, where the net contribution to aggregate value
creation of the three types are positive, zero, and negative, respectively. In a
successful entrepreneurial ecosystem, conditions are such that productive
entrepreneurship is stimulated. Two obvious questions that arise then are: 1) which
types of entrepreneurs can be labeled (basically)2 ‘productive’, and what are their
specific contributions to economy and society?; 2) how can these types be stimulated
(i.e., what are their determinants)? Addressing these questions is the essence of the
present report. We will study a number of types of entrepreneurs (in terms of
demographic characteristics of the entrepreneur or characteristics of their
entrepreneurial activity or organizational form) that can be labeled (basically)
‘productive’ (in the Baumol sense), elaborate on the nature and mechanisms of their
contribution to value creation, and investigate what are the determinants of these
productive types. Studying these issues fits nicely in the entrepreneurial ecosystem
approach, as we will show below.
2.1.1 The entrepreneuria l ecosystem
Figure 1 illustrates the concept of the entrepreneurial ecosystem as depicted by Stam
(2014). It consists of three main components which are mutually interconnected.
First, the key elements of the entrepreneurial ecosystem are the framework conditions
and systemic conditions. Framework conditions mainly consist of formal and informal
institutions which, either directly or indirectly, enable or constrain entrepreneurial
activity. Framework conditions only change slowly over time and can be seen as fixed
in the short term. At a more operational level, framework conditions translate in
systemic conditions, such as access to finance for entrepreneurs, the creation and use
of new knowledge and a skilled and diverse workforce. Thus, while a good access to
finance and a high human capital level of the workforce (systemic conditions) may be
seen as proximate causes of a successful entrepreneurial ecosystem, it is likely to
1 At the time of writing this chapter, André van Stel was affiliated with Panteia/EIM. 2 We are aware that a minority of entrepreneurs within these productive types may engage in unproductive or
destructive activities.

10
depend on underlying institutions with respect to education and financial markets
(framework conditions) (Stam, 2014, p. 5).
Second, the outputs of the entrepreneurial ecosystem are various types of
(productive) entrepreneurial activity. Stam (2014) identifies three such productive
entrepreneurial types: innovative start-ups, high-growth start-ups (reflecting value
creation in new firms) and entrepreneurial employee activity (reflecting value creation
in incumbent firms). The prevalence of productive entrepreneurial activity in an
economy depends on the key elements of the entrepreneurial ecosystem described
above.
Third, the ultimate outcome of the entrepreneurial ecosystem is new value creation in
society (Stam, 2014). This new value creation comes in various shapes, i.e.
productivity, income, employment and well-being.3 The new value is created by the
various types of (productive) entrepreneurial activity. Figure 1 illustrates the
entrepreneurial ecosystem approach (Stam, 2014).
figure 1 Key elements, outputs and outcomes of the entrepreneurial ecosystem
Source: Stam (2014).
2.1.2 Extending the entrepreneuria l ecosystem approach
As described above, an entrepreneurial ecosystem consists of various systemic and
framework conditions resulting, somehow, in entrepreneurial activity and ultimately,
in value creation. In theory, this value creation may also be zero or negative in case
of unproductive or destructive types of entrepreneurship (e.g. when entrepreneurs are
involved in rent seeking or illegal activities; Baumol, 1990). However, in this study we
focus exclusively on productive entrepreneurship resulting in positive value creation.
Stam (2014) describes that, because the entrepreneurial ecosystem is a rather recent
concept, there is no shared definition yet. Accordingly, it is also not entirely clear how
a ‘successful’ ecosystem should be defined. Moreover, although figure 1 seems to
assume an upward causal chain (i.e., the entrepreneurial ecosystem elements cause
3 The entrepreneurial ecosystem approach is more concerned with the dynamic contribution of entrepreneurs
(i.e., their contribution to new value creation) than with their static contribution (i.e., their contribution to the level of GDP).

11
entrepreneurial activity, which in turn cause value creation), it is not clear what are
the mechanisms linking the variables from the three blocks depicted in figure 1.
In the present study we aim at extending the entrepreneurial ecosystem approach by
focusing on some of these caveats in our current knowledge of entrepreneurial
ecosystems. In particular, we will extend the entrepreneurial ecosystem according to
figure 1 in three directions. These three extensions are illustrated in figure 2 and they
will now be discussed in turn. First, we consider more different types of
entrepreneurial activity. The middle block is thus extended with additional types of
entrepreneurial activity.
Second, for each of the identified types of entrepreneurship, we investigate to which
type of value creation they contribute. To this end we will use a categorization of
value creation which is slightly different from the four types identified in figure 1, by
distinguishing between economic and societal contributions and by adding a ‘green
economy’ as an outcome. We will thus try to unravel the link between the upper two
blocks, i.e., to unravel the mechanisms through which the outputs of the
entrepreneurial ecosystem (entrepreneurial activity) lead to the outcomes of the
entrepreneurial ecosystem (value creation). We will do this by reviewing both
theoretical and empirical literature. Regarding theoretical literature, we review the
different roles that entrepreneurs play in economy and society. We then construct a
framework of intermediate linkages through which these different roles theoretically
influence the various types of value creation. For instance, through the innovative role
of the entrepreneur, productivity and firm growth (intermediate linkages) are
positively influenced, which in turn contributes to economic growth (i.e., value
creation, as the final contribution (outcome) of the entrepreneurial ecosystem). To
answer the question how a certain type of entrepreneurship (e.g. solo self-employed)
contributes to value creation, we then review empirical literature to see how this type
is associated with the various roles, intermediate linkages and final contributions
identified in the theoretical framework. This theoretical framework will be explained in
detail in Section 2.2.
Third, for our selection of entrepreneurial types, we review empirical literature dealing
with the prevalence, characteristics and determinants of this type of entrepreneurship.
Regarding determinants, we investigate which framework and systemic conditions
influence which types of entrepreneurial activity. Hence, in terms of figure 2, these
determinants deal with the link between the lower two blocks.
To summarize, with our first extension of the entrepreneurial ecosystem approach we
open the discussion as regards the question if there are more types of entrepreneurial
activity (than the three from figure 1) that can be considered (basically) productive in
the Baumol sense (i.e., contributing to value creation). With our second extension we
investigate how different types of entrepreneurs contribute to different types of value
creation. With these first two extensions we aim at providing a broad overview as to
which types of entrepreneurship may be labeled ‘productive’ with regard to different
sorts of value creation. For policy makers it is then interesting how these different
types of entrepreneurship (and particularly, the ‘productive’ types) can be stimulated.
This is the topic of our third extension, focusing on prevalence, characteristics and
determinants of each entrepreneurial type.

12
figure 2 Extending the entrepreneurial ecosystem
Source: Panteia, adapted from Stam (2014).
2.2 The role of the entrepreneur in economic theory
2.2.1 Roles of entrepreneurs
As stated in the Introduction (chapter 1), entrepreneurship is a multi-faceted and
quite heterogeneous phenomenon. This heterogeneity has given rise to a plethora of
definitions of entrepreneurship. Two well-known definitions are the following:
1. Shane (2003: 4), based on Shane and Venkataraman (2000):
‘Entrepreneurship is an activity that involves the discovery, evaluation and
exploitation of new opportunities to introduce new goods and services, ways of
organizing, markets, processes, and raw materials through organizing efforts
that previously had not existed’.
2. Lumpkin and Dess (1996: 136): ‘The essential act of entrepreneurship is new
entry. New entry can be accomplished by entering new or established markets
with new or existing goods or services’.
These two definitions share a behavioural perspective (Sternberg and Wennekers,
2005) and an emphasis on elements of ‘newness’ (Wennekers and Thurik, 1999). They
also explicitly include two different ’modes of exploitation’ (Shane and Venkataraman,
2000), i.e. the creation of new independent enterprises and corporate
entrepreneurship within existing businesses. However, they exclude a large part of the
solo self-employed and independent small businesses. Those entrepreneurs fit best in
an occupational perspective, i.e. they are called entrepreneurs because they own and
manage their business for their own account and risk.
Framework conditions
Systemicconditions
Economic growth Employment Well-being
Value creation
Green economyOutcomes
Outputs Innovativestart-ups
High-growthstart-ups
Entrepreneurial employee activity
Types of entrepreneurial activity
Formal institutions
Culture
Networks Leadership Finance Talent
Physical infrastructure
Demand
New knowledge
Support services / intermediaries
Entrepreneurial Ecosystem Elements
Determinants of entrepreneurial types
Roles of entrepreneurship
More types
Economic contribution
Societal contribution

13
Related to this heterogeneity, entrepreneurs (however defined) have, throughout
economic history, played many roles. An overview is given by Hébert and Link (1982;
1989), who list twelve distinct roles. Other distinctions are conceivable and other roles
can be added to the list, particularly that of realizing the start-up of a new business or
venture (Wennekers and Thurik, 1999). Some of these roles pertain to all or at least
most entrepreneurs, while other roles are specific for certain types of entrepreneurs
only. Below we will discuss some prominent examples of both categories of roles.
General entrepreneurial roles
The following two roles appear to be applicable for (almost) all entrepreneurs:
1. Bearing the risk associated with uncertainty (Hébert and Link, 1989: 41). The
first to write about entrepreneurial risk taking was Cantillon in the early 18th
century, who viewed an entrepreneur as ‘someone who buys at a certain cost
price and sells at an uncertain price’ (Hoselitz, 1960: 240). This view of
bearing risk and uncertainty as a characteristic of entrepreneurship is shared
by many of the (neo-)classical authors, most notably Say and Marshall (Van
Praag, 1999), and later on Knight (1921) and the (neo-)Austrians such as
Kirzner. An exception is Schumpeter (1934) who argues that risk falls on the
owner of the means of production, and ‘hence never on the entrepreneur as
such’.
2. Exercising entrepreneurial judgement about business opportunities and
judgmental decision making about the implementation of scarce resources
(Westhead at al., 2011). Some 20th century economists who can clearly be
associated with this view are Knight (1921), Casson (1982) and Foss (1993).
A classical author who has written about entrepreneurial judgement and the
coordination of scarce resources is J. B. Say (Van Praag, 1999).
Specific entrepreneurial roles
Below we have identified six roles that apply to specific types of entrepreneurs only:
1. Exploration and experimentation
The role of exploration and experimentation is carried out by all entrepreneurs
who try something really new, and thus contribute to variety and learning
(Wennekers, 2006: 90). In the footsteps of Cantillon and Knight, McGrath
(1999: 13-14) takes uncertainty as a fundamental underlying characteristic of
suchlike entrepreneurial initiatives, in the sense of ’introducing a new
combination of resources’, and failure as one of the possible outcomes.
However, in a ‘real options approach’, she does not view failure ‘negatively’,
as ‘shameful’ and as something to ‘be avoided’. Instead, she also points out
‘failure’s possible benefits’. To give one example, McGrath (1999: 16) points
at the positive association of high rates of founding and exiting with ‘economic
vibrancy’. Another benefit is that ‘it is often easier to pinpoint why a failure
has occurred than to explain a success’ (McGrath, 1999: 28), making failure
analysis very helpful for learning. McGrath (1999: 14) also states that
‘because of spill over and learning effects, it is often more useful to evaluate
the collective contribution of entrepreneurial initiatives to wealth creation than
to assess each initiative on its own.
The initiative that fails may still improve knowledge or methods of production’.
She adds that ‘on a larger scale’ failed first movers are also associated ‘with
the emergence of entirely new industries’.

14
2. Introduction of radical innovations
According to Joseph Schumpeter’s ‘The Theory of Economic Development’
(first published in German in 1911) the key role of entrepreneurs is
innovation, which in Schumpeter’s vocabulary is indicated as ‘New
Combinations’ (of productive means). This concept of new combinations may
refer to the introduction of new products and new methods of production, the
opening of new markets, the ‘conquest of a new source of supply’ and a ‘new
organization of any industry’. Schumpeter however excludes new combinations
that ‘may in time grow out of the old by continuous adjustment in small
steps’. Instead he explicitly means new combinations that ‘appear
discontinuously’. These radical innovations often imply the creation of a new
industry, and ‘the competitive elimination of the old’, a process also known as
‘creative destruction’ (Schumpeter, 1942). In ‘The Theory of Economic
Development’ Schumpeter held the view that ‘… new combinations are, as a
rule, embodied … in new firms’. In his later writings Schumpeter (1942) came
to view innovative incumbent large businesses with R&D laboratories as the
major agents of change. The former view is now known as the ‘Schumpeter
Mark I regime’, and the latter view as the ‘Schumpeter Mark II regime’
(Malerba and Orsenigo, 1995; Carree et al., 2002). Whatever the regime,
creation of new information (Shane, 2003: 19-21), based on external changes
and to be explored by innovative entrepreneurs, and creative action (De Jong
and Marsili, 2015) are key elements of ‘Schumpeterian opportunities’.
The role of ‘early ventures in the formative years of a new industry’ includes
challenges that are different from those faced by entrepreneurs ‘that simply
carry on a tradition pioneered by thousands of predecessors in the same
industry’ (Aldrich and Fiol, 1994: 645-646). In addition to ‘the normal
pressures facing any new organizations, they also must carve out a new
market, raise capital from skeptical sources’ and ‘recruit untrained
employees’. Radical innovations must also gain ‘cognitive and socio-political
legitimacy’. Cognitive legitimation refers to the spread of knowledge about a
new industry. Socio-political legitimacy refers to ‘public acceptance of an
industry, government subsidies to the industry, or the public prestige of its
leaders’ (Aldrich and Fiol, 1994: 648).
3. Introduction of incremental innovations
The Austrian Economics school claims that ‘due to constant shifts in, and
movements along, the demand and supply functions’ (Westhead et al., 2011),
markets are never in equilibrium. Consequently there are always opportunities
to exploit ‘gaps in the market’, by introducing new product variations and
(incremental) process improvements in order to develop and serve potential
markets, or by expanding and penetrating underdeveloped markets through
focused marketing efforts and the opening up of new establishments.
Subsequently, through this ‘dynamic competitive process of entrepreneurial
discovery’, markets tend towards equilibrium (Kirzner, 1997: 62). In the
footsteps of Mises and Hayek, Kirzner is presently the most prominent
representative of this approach that ‘defines the essence of entrepreneurship
as alertness to profit opportunities’ (Hébert and Link, 1989: 46).
In this view, competition in the sense of ‘dynamic rivalry’ and not in the neo-
classical sense of ‘perfect competition’ plays a key role. Kirzner (1997: 73):

15
‘The (market) process is made possible by the freedom of entrepreneurs to
enter markets in which they see opportunities for profit. In being alert to such
opportunities and in grasping them, entrepreneurs are competing with other
entrepreneurs. …. It is … the rivalrous process we encounter in the everyday
business world, in which each entrepreneur seeks to outdo his rivals in
offering goods to consumers (recognizing that, because those rivals have not
been offering the best possible deals to consumers, profits can be made by
offering consumers better deals).’ The Kirznerian process of entrepreneurial
discovery is often associated with the production and exploitation of
incremental innovations (Cromer et al., 2011; Stam and Nooteboom, 2011).
However, also see De Jong and Marsili (2015) who suggest that many real-life
business opportunities show a mix of Schumpeterian and Kirznerian
characteristics.
4. Replicative or imitative entrepreneurship
The diffusion of innovations, also known as imitative or replicative
entrepreneurship, is closely linked to the previously discussed role of the
introduction of incremental innovations. As Schumpeter (1934) points out,
entrepreneurs often appear in ‘swarms’ or ‘clusters’, because the appearance
of a few radical innovators paves the way for many other new entrepreneurs
who will replicate their innovation, and ‘later by existing firms serving the
same market who must compete or go under’ (Ziegler, 1985: 103). According
to Ziegler the first imitators are often entrepreneurial f irms founded by former
employees of the ‘innovator-entrepreneur’. Ziegler also points out that: ‘… in
this paradigm imitation is an important phenomenon in the diffusion of
innovation’.
Minniti and Lévesque (2010: 305-306) highlight the ‘crucial role’ of ‘a high
number of imitative entrepreneurs’ (in addition to ‘research-based
entrepreneurs’), ‘who increase competition and product supply’ for generating
economic growth. In their approach they take a ‘Kirznerian’ view of
entrepreneurs, and conceptualize imitators as entrepreneurs who are ‘alert to
opportunities’, who ‘do not incur R&D costs’ but who ‘are willing to incur
upfront costs in the hope of realizing profit expectations’, either by ‘imitating
existing product or technology, or transforming a new invention into
marketable technological change’.
Finally, Aldrich and Fiol (1994: 647), based on Klepper and Graddy (1990),
point out that ‘there is an enormous range of variation in the time required for
industries to become established’, as ‘some industries went from origin to
stability (defined as the year when the number of firms reached a peak and
remained more or less the same for a few years) in only two years, whereas
others took more than 50 years.’
Henceforth in this report, the roles 1) exploration and experimentation and 2)
radical innovation will be taken together under the heading ‘exploration and
creation’. The roles 3) incremental innovation and 4) replicative entrepreneurship
are also closely related (De Jong and Marsili, 2015: section 3). Therefore, they will
be taken together under the heading ‘exploitation of opportunities’. Exploration (&
creation) and exploitation (of opportunities) may be seen as two successive major
phases in a ‘cycle of innovation’ (Stam and Nooteboom, 2011). This is depicted in
figure 3, which also pays attention to the risks of each phase (i.e., chaos and
inertia respectively).

16
In addition variety of content, a key characteristic of exploration and
experimentation, gradually lessens in the movement towards exploitation,
followed by ‘an opening up of variety of context’ as indicated in the lower half of
the figure, which includes generalisation and differentiation of existing practice.
See Stam and Nooteboom (2011) for a further description how this ongoing
process may subsequently lead to new rounds of ‘Schumpeterian novel
combinations’.
figure 3 Exploration and exploitation as successive phases of the cycle of innovation
Source: Stam (2014), based on Stam and Nooteboom (2011).
5. Enabling role of entrepreneurs on behalf of client firms
A specific role of (mostly) enterprises without employees, that are active in
the B2B market, is enabling the entrepreneurship of the client firms hiring
them ‘by enabling de-risking strategies, reducing financial constraints,
increasing entrepreneurial strategic agility as well as facilitating market entry
by start-ups’ (Burke, 2011: 25). These enterprises often do this by providing
labour services on a project by project basis. Accordingly they help lower the
risks of their clients who can employ flexible and/or temporary labour services
‘instead of having to commit to long term employment contracts’ (Burke,
2011). These labour services may greatly lower the risks when entrepreneurs
are testing out the viability of a new venture (Bhidé, 2000), and may enhance
their agility to alter business strategy when necessary. According to Burke
(2009) these lower risks also minimise the amount of finance required during
the start-up or pilot phase. In addition, commercial labour services by micro
enterprises also lower the costs of client firms that need temporary specialized
services with high downtime or idleness hazards. This also reduces minimum
efficient scale facilitating market entry by business start-ups. A final example
of the enabling role of entrepreneurs working on behalf of client firms is that
they offer the possibility of ‘performance related pay schemes’ enhancing
productivity and lowering costs. On the other hand, the enabling
entrepreneurs are often not themselves involved in the key entrepreneurial
function of ‘creating/finding and exploiting profit opportunities’ (Burke, 2011).
Thus they are the ‘enablers of entrepreneurship rather than the
entrepreneurial agents themselves’ (Burke, 2011).

17
6. Self-employment as work opportunity for ‘outsiders’
Entrepreneurship in the sense of self-employment is often the only viable
route to work and income for ‘outsiders’ in the social arena who are
‘vulnerable to labour market exclusion’ (OECD, 2013) and lack access to wage
jobs. These outsiders include immigrants, ethnic minorities, high school drop
outs, disabled persons and long-term unemployed.
Shapero and Sokol (1982) refer to their condition as ‘displacements’. Such
‘displacements’ may also pertain to women for whom self-employment is the
only feasible way to combine paid work with care tasks and/or home tasks.
Given that more than 25 million EU residents are unemployed and actively
seeking work, while many others are discouraged workers or people outside of
the labour market for other reasons (OECD, 2013), so-called ‘inclusive
entrepreneurship’ can be an important source of new work opportunities
including ‘improved employability from engaging in entrepreneurship’.
A related phenomenon is known as ‘necessity entrepreneurship’, referring to
people who choose for self-employment ‘because they have no better options
for work’ (Wennekers et al., 2010: 42). In lesser developed countries the
number of necessity entrepreneurs may be quite substantial, in an order of
magnitude of 50% of all self-employed. With less than 10% the share of
purely necessity-driven entrepreneurs in the Netherlands is among the lowest
in the world, while other early-stage entrepreneurs in the Netherlands
however may have ‘mixed motives’ or ‘other motives’ not related to either
necessity or opportunity (Van Stel et al., 2014).
2.2.2 First order effects and f inal contributions
For a further conceptual development of these specific roles, it seems useful to
distinguish between ‘final contributions’ (such as economic growth, the establishment
of a green economy, and job satisfaction/happiness) and ‘first order effects’ acting as
‘intermediate linkages’ towards these final effects. For early attempts to identify
intermediate linkages between entrepreneurship and economic growth, see Wennekers
and Thurik (1999), Thurik, Wennekers and Uhlaner (2002) and Wennekers (2006).
First order effects acting as intermediate linkages
Major first order effects acting as intermediate linkages towards the final contributions
are higher productivity and competitiveness (penetration of international markets),
the creation of new industries and new niches, firm growth, and participation,
autonomy and (subsistence) income for all social groups. How these linkages relate to
the specific roles discussed above is visualized in table 1.
table 1 Entrepreneurial roles x intermediate linkages
Linkages
Roles
New industries and
niches
Productivity and
competitiveness
Firm growth Participation,
autonomy and
income
Exploration and creation X X X
Exploitation of
opportunities
x X X
Enabling role X X
Self-employment as
work opportunity for
‘outsiders’
x X
18
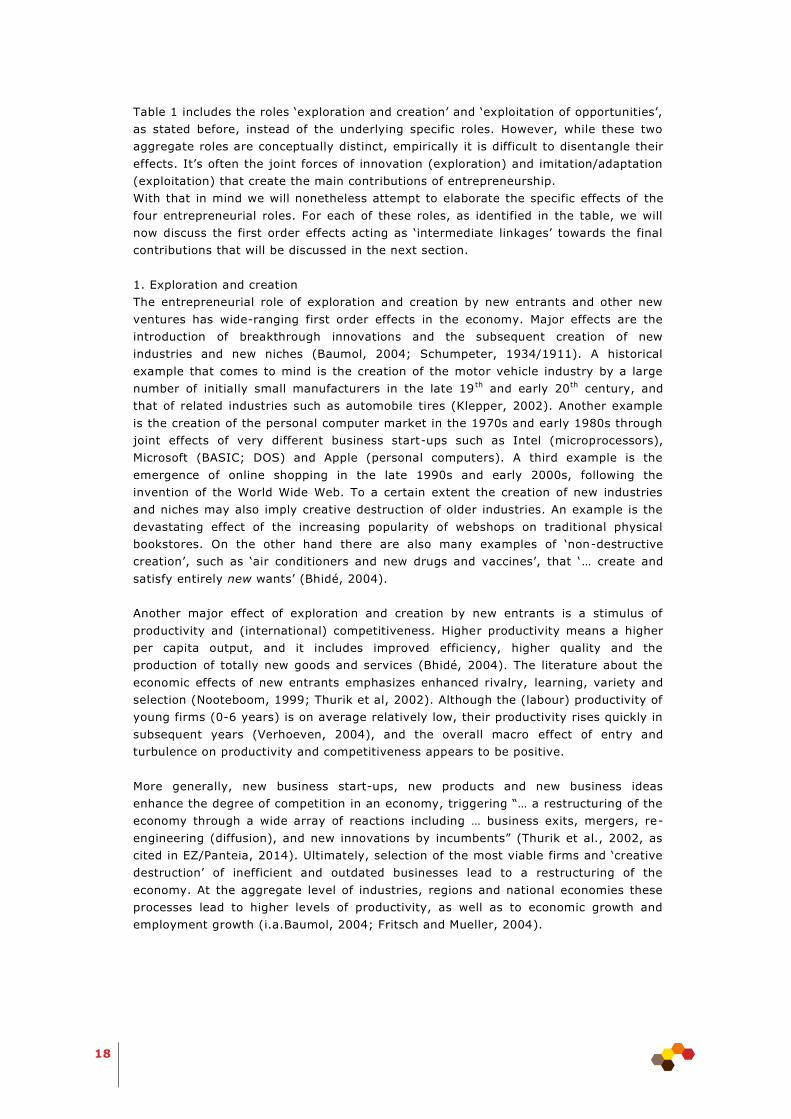
Table 1 includes the roles ‘exploration and creation’ and ‘exploitation of opportunities’,
as stated before, instead of the underlying specific roles. However, while these two
aggregate roles are conceptually distinct, empirically it is difficult to disentangle their
effects. It’s often the joint forces of innovation (exploration) and imitation/adaptation
(exploitation) that create the main contributions of entrepreneurship.
With that in mind we will nonetheless attempt to elaborate the specific effects of the
four entrepreneurial roles. For each of these roles, as identified in the table, we will
now discuss the first order effects acting as ‘intermediate linkages’ towards the final
contributions that will be discussed in the next section.
1. Exploration and creation
The entrepreneurial role of exploration and creation by new entrants and other new
ventures has wide-ranging first order effects in the economy. Major effects are the
introduction of breakthrough innovations and the subsequent creation of new
industries and new niches (Baumol, 2004; Schumpeter, 1934/1911). A historical
example that comes to mind is the creation of the motor vehicle industry by a large
number of initially small manufacturers in the late 19 th and early 20th century, and
that of related industries such as automobile tires (Klepper, 2002). Another example
is the creation of the personal computer market in the 1970s and early 1980s through
joint effects of very different business start-ups such as Intel (microprocessors),
Microsoft (BASIC; DOS) and Apple (personal computers). A third example is the
emergence of online shopping in the late 1990s and early 2000s, following the
invention of the World Wide Web. To a certain extent the creation of new industries
and niches may also imply creative destruction of older industries. An example is the
devastating effect of the increasing popularity of webshops on traditional physical
bookstores. On the other hand there are also many examples of ‘non-destructive
creation’, such as ‘air conditioners and new drugs and vaccines’, that ‘… create and
satisfy entirely new wants’ (Bhidé, 2004).
Another major effect of exploration and creation by new entrants is a stimulus of
productivity and (international) competitiveness. Higher productivity means a higher
per capita output, and it includes improved efficiency, higher quality and the
production of totally new goods and services (Bhidé, 2004). The literature about the
economic effects of new entrants emphasizes enhanced rivalry, learning, variety and
selection (Nooteboom, 1999; Thurik et al, 2002). Although the (labour) productivity of
young firms (0-6 years) is on average relatively low, their productivity rises quickly in
subsequent years (Verhoeven, 2004), and the overall macro effect of entry and
turbulence on productivity and competitiveness appears to be positive.
More generally, new business start-ups, new products and new business ideas
enhance the degree of competition in an economy, triggering “… a restructuring of the
economy through a wide array of reactions including … business exits, mergers, re-
engineering (diffusion), and new innovations by incumbents” (Thurik et al., 2002, as
cited in EZ/Panteia, 2014). Ultimately, selection of the most viable firms and ‘creative
destruction’ of inefficient and outdated businesses lead to a restructuring of the
economy. At the aggregate level of industries, regions and national economies these
processes lead to higher levels of productivity, as well as to economic growth and
employment growth (i.a.Baumol, 2004; Fritsch and Mueller, 2004).

19
Van Praag and Versloot (2007: 371) conclude: ‘Entrepreneurs may lag behind in the
levels of productivity, but they are catching up to the production efficiency of the
control group due to a higher growth rate4’. These latter final effects will be
elaborated in one of the following sections.
More specifically, exploration and creation are advantageous for firm growth in the
sense that the emergence of new industries and the realization of higher productivity
create growth opportunities for ambitious entrepreneurs. But here it holds, as stated
before, that it is the joint forces of exploration and exploitation that create the main
contributions of entrepreneurship. Rapidly growing firms may just as likely be the
ambitious imitators as the initial innovators, but precise figures on this distinction are
not available. We do however know that a higher incidence of ambitious entrepreneurs
has a positive effect on the percentage of high-growth firms (Teruel and de Wit,
2011).
2. Exploitation of opportunities
The entrepreneurial role of ‘exploitation’ particularly enables the dissemination of
invention, leading to ‘widespread utilization of new or improved products and
processes’ (Baumol, 2004:14). In addition Baumol (2004:17) emphasizes the
‘invaluable contribution of “mere imitation”’. He continues: ‘History is replete with
examples of substantial improvements that were contributed by the imitators. In part,
these improvements are elicited by the need to adapt the technology to local
conditions, including differences in size of the market, in the nature of consumer
preferences, in climatic conditions and in the character of available complementary
inputs.’ The crucial value of imitation for long term technological development is
corroborated by the research findings of evolutionary anthropology (McGowan, 2014).
Obviously, exploitation thus plays a major role in the full development of new
industries ànd in the accompanying growth of productivity and competitiveness.
As for the effect on firm growth, again it must be pointed out that it is the joint forces
of exploration and exploitation that matter. An interesting example is again the
automobile industry in the US that began in 1895. Klepper (2002): ‘Paralleling entry,
the number of firms rose through 1909, peaking at 271, and then fell sharply. By
1923 only 104 firms were left in the industry.’ Automobile sales during this latter
period had risen quite strongly, illustrating the extremely high firm growth of the
surviving producers5.
A quite different example of exploitation of opportunities, in which non-technological
innovation comes to the fore, is the growth of a diversified restaurant sector in many
European countries during the past decades6, in reaction to growing prosperity, an
increasing number of immigrants and changing lifestyles. A more recent example is
the proliferation of niches around the development of so-called apps for mobile
devices (smart phones and mobile computers).
4 This refers to relatively high growth rates of both value added and productivity (Van Praag and
Versloot, 2007: 377). 5 The production of only the Model T Ford increased from around 10,000 in 1909 to almost one million in
1920 (www.mtfca.com/encyclo/fdprod.htm ). 6 To cite just one figure: the number of restaurants in the Netherlands increased from 4,541 in 1995 to 6,213
in 2005, a growth rate of 3.2% per annum (http://abf.kenniscentrumhoreca.nl/).

20
3. Enabling role
As explained in a previous section, the enabling role is tailor-made for enterprises
without employees and other small enterprises that are active in the B2B market and
perform labour services on behalf of client firms. They help mitigate the risks, lower
the costs and enhance the agility of their clients who can employ flexible and/or
temporary labour services ‘instead of having to commit to long term employment
contracts’ (Burke, 2011). In addition, many of these enterprises also play an enabl ing
and accelerating role in the innovative processes of their clients.
As will be elaborated in a later chapter of this report, this contribution to innovation is
often based on their specialized expertise acquired in previous assignments. De-
risking, agility and gradual innovation are among the key ingredients of an
entrepreneurial success strategy for the minority of client firms that not only survive
after start-up but also become really successful (Burke, 2009). Through their
contribution to these success factors enabling entrepreneurs thus also contribute to
higher productivity, competitiveness and firm growth of their clients. Indirectly
enabling entrepreneurs may also contribute to the expansion of new industries and
niches, as this process often takes the form of gradual reform and diffusion by
entrepreneurial (client) firms that build on an innovation platform provided by earlier
more revolutionary innovators (Burke, 2009: 37).
4. Self-employment as work opportunity for ‘outsiders’
Social inclusion of all groups, including ethnic minorities, high school drop outs,
disabled persons, long-term unemployed and women, is an explicit policy goal of the
European Union (OECD, 2013: 23-24), the more so because presently more than 25
million EU residents are unemployed and actively seeking work, while many others are
outside of the labour market for other reasons. In most EU-member states active
labour market policy measures, as a way to fight social exclusion, so far have
focussed mainly on wage jobs while support for business start-ups represents less
than 10% of these expenditures. However, there is a growing awareness that start-up
activities may generate important benefits. Self-employment, in these cases also
known as ‘inclusive entrepreneurship’, can be an important source of new work
opportunities, and may thus generate increasing participation in the labour market
and in society in general, and as a result may lead to decreasing dependency on social
security, to an increasing sense of autonomy and to opportunities for better balancing
private life and work. In addition, it may offer a new source of income for those who
set up a business successfully or who gain ‘improved employability from engaging in
entrepreneurship’ (OECD, 2013). Finally, although there is no specific empirical
evidence for this effect, it seems likely that inclusive entrepreneurs may also fulfil an
enabling role on behalf of client firms and may thus contribute to their firm growth.
Final contributions
Table 2 visualizes how the intermediate linkages may ultimately lead to final economic
and societal contributions, i.e., outcomes of the entrepreneurial ecosystem. The
discussion will now be done ‘backwards’, i.e. we start with the final contributions and
discuss how they are linked to the various first order effects (intermediate linkages).

21
table 2 Intermediate linkages x final (economic and societal) contributions
Effects
Linkages
Economic growth and
job creation
Green
economy
Well-being:
inclusive economy, job
satisfaction and
happiness
New industries and
niches
X X
Productivity and
competitiveness
X
Firm growth
X
Participation, autonomy
and income
X
1. Economic growth and job creation
The causal relationships between the growth of productivity, production and
employment are complex. In the long run and given the supply of labour, it is per
definition productivity growth that determines the rate of economic growth. In that
respect the positive first order effect of entrepreneurship on productivity growth is of
crucial importance. In addition, in a small open economy like the Netherlands,
production growth follows to a large extent increasing foreign demand (Panteia, 2011:
165-166). Thus increasing international competitiveness, another first order effect of
entrepreneurial exploration and exploitation, is also of great importance for economic
growth. At the supply side, economic growth per definition takes the form of firm
growth. This may happen in either the sense of (a large number of) growing firms or
the sense of a growing number of businesses. Growing firms are particularly important
because of their dynamic qualities (Panteia, 2011: 127). Finally, there is ample
evidence that in the long run the introduction and expansion of new industries and
niches, based on new products and processes, play a major role in these processes
(Baumol, 2004).
At the macro level, employment growth follows production growth (Kaldor, 1966). At
the underlying industry level, job creation is determined by the net effect of business
dynamics (entry, firm growth and decline, and exits) in which entry and firm growth
play the driving role. In their survey based on a large number of empirical studies,
Van Praag and Versloot (2007: 361) found that ‘in the long run, entrepreneurial firms
create positive externalities leading to more employment, also in other, i.e., older,
larger, and incumbent firms’. However, the jobs created by entrepreneurial businesses
are ‘less secure due to higher volatility and higher probabilities of firm dissolution’. A
(multi-regional) study by Fritsch and Mueller (2004) indicates both indirect effects of
new business formation (such as crowding out of competitors and improved
competitiveness) and direct effects, i.e. the jobs created in the new entities. While the
net employment effect of new businesses on regional employment is initially negative,
‘due to crowding out effects and to failing newcomers’, in the longer run there is a
positive net effect that peaks about 8 years after entry.
Recent research by the OECD (Andrews et al., 2014, based on Criscuolo et al., 2014)
shows that ‘young firms systematically create more jobs than they destroy’. In
particular, ‘young firms represent only around 20% of total employment, but they
account for almost 50% of total job creation in the economy, while their share in job
destruction is around 25%’ (Andrews et al., 2014: 73).
22
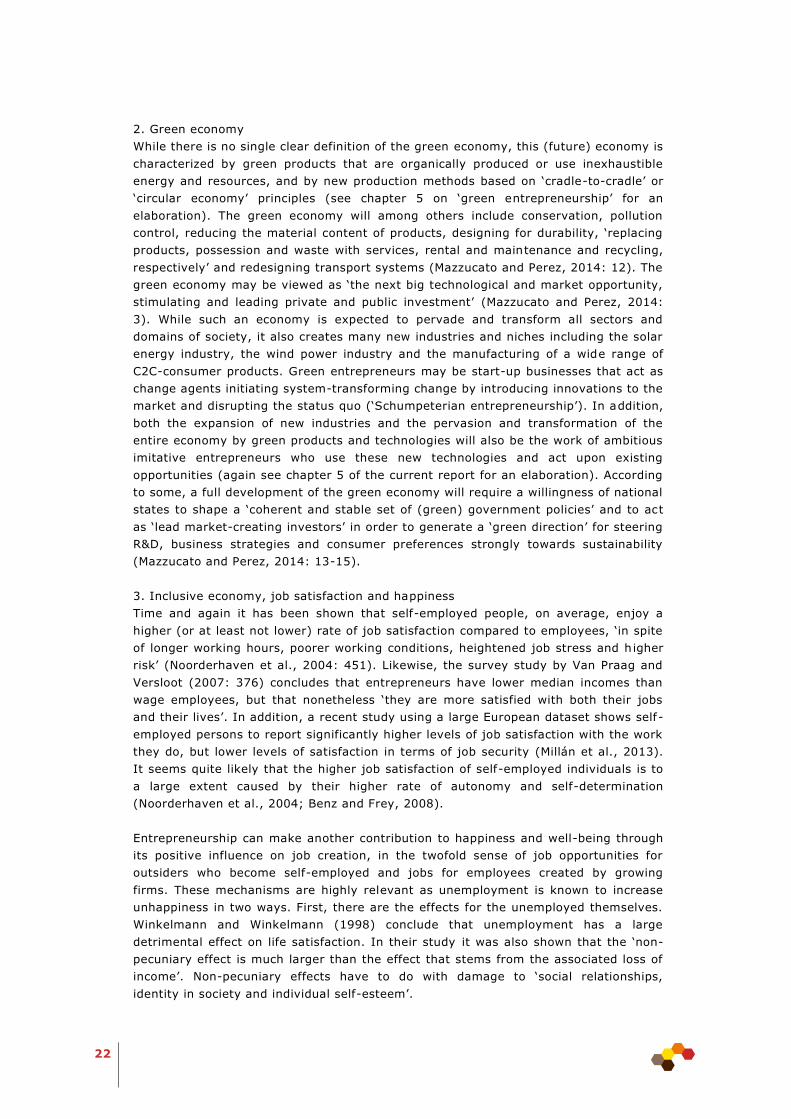
2. Green economy
While there is no single clear definition of the green economy, this (future) economy is
characterized by green products that are organically produced or use inexhaustible
energy and resources, and by new production methods based on ‘cradle-to-cradle’ or
‘circular economy’ principles (see chapter 5 on ‘green entrepreneurship’ for an
elaboration). The green economy will among others include conservation, pollution
control, reducing the material content of products, designing for durability, ‘replacing
products, possession and waste with services, rental and maintenance and recycling,
respectively’ and redesigning transport systems (Mazzucato and Perez, 2014: 12). The
green economy may be viewed as ‘the next big technological and market opportunity,
stimulating and leading private and public investment’ (Mazzucato and Perez, 2014:
3). While such an economy is expected to pervade and transform all sectors and
domains of society, it also creates many new industries and niches including the solar
energy industry, the wind power industry and the manufacturing of a wide range of
C2C-consumer products. Green entrepreneurs may be start-up businesses that act as
change agents initiating system-transforming change by introducing innovations to the
market and disrupting the status quo (‘Schumpeterian entrepreneurship’). In addition,
both the expansion of new industries and the pervasion and transformation of the
entire economy by green products and technologies will also be the work of ambitious
imitative entrepreneurs who use these new technologies and act upon existing
opportunities (again see chapter 5 of the current report for an elaboration). According
to some, a full development of the green economy will require a willingness of national
states to shape a ‘coherent and stable set of (green) government policies’ and to act
as ‘lead market-creating investors’ in order to generate a ‘green direction’ for steering
R&D, business strategies and consumer preferences strongly towards sustainability
(Mazzucato and Perez, 2014: 13-15).
3. Inclusive economy, job satisfaction and happiness
Time and again it has been shown that self-employed people, on average, enjoy a
higher (or at least not lower) rate of job satisfaction compared to employees, ‘in spite
of longer working hours, poorer working conditions, heightened job stress and higher
risk’ (Noorderhaven et al., 2004: 451). Likewise, the survey study by Van Praag and
Versloot (2007: 376) concludes that entrepreneurs have lower median incomes than
wage employees, but that nonetheless ‘they are more satisfied with both their jobs
and their lives’. In addition, a recent study using a large European dataset shows self-
employed persons to report significantly higher levels of job satisfaction with the work
they do, but lower levels of satisfaction in terms of job security (Millán et al., 2013).
It seems quite likely that the higher job satisfaction of self-employed individuals is to
a large extent caused by their higher rate of autonomy and self-determination
(Noorderhaven et al., 2004; Benz and Frey, 2008).
Entrepreneurship can make another contribution to happiness and well-being through
its positive influence on job creation, in the twofold sense of job opportunities for
outsiders who become self-employed and jobs for employees created by growing
firms. These mechanisms are highly relevant as unemployment is known to increase
unhappiness in two ways. First, there are the effects for the unemployed themselves.
Winkelmann and Winkelmann (1998) conclude that unemployment has a large
detrimental effect on life satisfaction. In their study it was also shown that the ‘non-
pecuniary effect is much larger than the effect that stems from the associated loss of
income’. Non-pecuniary effects have to do with damage to ‘social relationships,
identity in society and individual self-esteem’.

23
These effects underscore the importance of self-employment as a road towards
participation in society. They also resonate with the earlier findings of Clark and
Oswald (1994: 658), who conclude that unemployed people (in Great Britain) ‘have
much lower levels of mental well-being than those in work’. Secondly, Di Tella et al.
(2001) show that a higher average unemployment rate at the country level negatively
influences overall life-satisfaction. In addition, they also find that ‘unemployment
depresses reported well-being more than does inflation’ (op cit.: 340).
Clearly, self-employment as a road towards participation in the economy also
contributes to the establishment of an ‘inclusive economy’, which Acemoglu and
Robinson (2013: 74) define as an economy with institutions ‘that allow and encourage
participation by the great mass of people in economic activities that make best use of
their talents and skills and that enable individuals to make the choices they wish’.
2.3 Categorizations and types of entrepreneurs
As stated in the Introduction (chapter 1), regarding types of entrepreneurship,
different categorizations can be made, for instance on the basis of demographics of
entrepreneurs but also based on the type of entrepreneurial activity or organizational
form. Examples of the former are categorizations by age, gender and education.
Examples of the latter are ambitious entrepreneurs, innovative entrepreneurs,
corporate entrepreneurs, solo self-employed, necessity entrepreneurs, social
entrepreneurs, ‘green’ entrepreneurs, international entrepreneurs, academic
entrepreneurs, franchisees, team entrepreneurs, starters, et cetera. Usually these
categorizations may be expressed as dichotomies, such as in solo self-employed
versus employer entrepreneurs or necessity versus opportunity entrepreneurs.
Obviously, these categorizations are not mutually exclusive. Instead they can best be
viewed as dimensions. A real life entrepreneur may be characterized on several of
these dimensions, such as an ‘ambitious, innovative, international start-up
entrepreneur’ or an ‘academic, green, team and employer entrepreneur’.
In writing this report choices had to be made with respect to the types of
entrepreneurs to be discussed within the framework as laid out in the preceding
sections. As stated in the Introduction, the following ‘types’ w ill be reviewed:
- Ambitious entrepreneurs
- Solo self-employed
- Green entrepreneurs
- Younger vs. older entrepreneurs
- Higher vs. lower educated entrepreneurs
- Women entrepreneurs
- Inclusive entrepreneurs (i.e., entrepreneurs stemming from immigrant, disabled
and young age groups)
These choices were based on both societal relevance and availability of data. In
addition, some dimensions such as innovativeness or necessity versus opportunity will
be taken on board as complementary aspects in the discussion of the seven chosen
types. In the end however, some clearly interesting typologies do remain outside the
scope of this report.

24
One clear example is early-stage entrepreneurs versus incumbent entrepreneurs.7
Another one is entrepreneurship in small versus large firms (De Kok, Prince and Span,
2015; Prince and Van der Zeijden, 2015). Two other types that will not be covered are
corporate entrepreneurs and team entrepreneurs.
As a service for the interested reader table 3 mentions some relevant empirical
literature for a number of types of entrepreneurship not covered by the present study.
table 3 Empirical literature on various types of entrepreneurship
Type of entrepreneurship Chapter in present report or starting point for
empirical investigation
Characteristics of the venture
Ambitious entrepreneurship Chapter 3
Social entrepreneurship Hoogendoorn (2011)
‘Green’ entrepreneurship Chapter 5
International entrepreneurship Terjesen, Hessels and Li (2013)
Opportunity/necessity entrepreneurship Block and Sandner (2009)
Innovative entrepreneurship Koellinger (2008)
Organizational form
Solo self-employed Chapter 4
Academic entrepreneurship Shane (2004)
Corporate entrepreneurship Bosma et al. (2013)
Team entrepreneurship Hoogendoorn (2013)
Starters vs. incumbents Alvarez et al. (2014)
Franchisees Croonen et al. (2014)
Demographic characteristics
Younger vs. older entrepreneurs Chapter 6
Higher vs. lower educated entrepreneurs Chapter 7
Female vs. male entrepreneurs Chapter 8
Immigrant entrepreneurs Chapter 9
Disabled entrepreneurs Chapter 9
2.4 Literature
Acemoglu, D. and J.A. Robinson (2013), Why Nations Fail; The Origins of Power,
Prosperity and Poverty, London: Profile Books.
Aldrich, H.E. and C.M. Fiol (1994), Fools rush in? The institutional context of industry
creation, Academy of Management Review 19(4), 645-670.
Alvarez, S., D. Urbano and J.E. Amoros (2014), GEM research: achievements and
challenges, Small Business Economics 42, 445-465.
Andrews, D., C. Criscuolo, P. Gal, C. Menon and D. Pilat (2014), Entrepreneurship and
business dynamics in the Netherlands – enabling experimentation, in:
EZ/Panteia (2014), Entrepreneurship in the Netherlands: the top sectors,
Zoetermeer: Panteia.
Baumol, W.J. (1990), Entrepreneurship: Productive, unproductive and destructive,
Journal of Political Economy 98(5), 893-921.
7 For studies on early-stage entrepreneurship, we refer to Global Entrepreneurship Monitor based studies,
see, e.g., Alvarez et al. (2014), for an overview.

25
Baumol, W.J. (2004), Entrepreneurial enterprises, large established firms and other
components of the free-market growth machine, Small Business Economics 23,
9-21.
Benz, M. and B.S. Frey (2008), Being independent is a great thing: subjective
evaluations of self-employment and hierarchy, Economica 75, 362-383.
Bhidé, A.V. (2000), The Origin and Evolution of New Businesses, New York: Oxford
University Press.
Bhidé, A. (2004), Entrepreneurs in the 21st Century – Non-destructive creation: how
entrepreneurship sustains prosperity, Lecture RSA: London, 17th November
2004.
Block, J., and P. Sandner (2009), Necessity and Opportunity Entrepreneurs and their
Duration in Self-employment: Evidence from German Micro Data, Journal of
Industry, Competition and Trade 9(2), 117–137.
Bosma, N., Wennekers, S., Guerrero, M., Amorós, J.E., Martiarena, A. and Singer, S.
(2013), GEM Special Report On Entrepreneurial Employee Activity. Wellesley
MA, Santiago Chile, Kuala Lumpur, Malaysia: Babson College, Universidad del
Desarrollo, Universiti Tun Abdul Razak.
Burke, A.E. (2009), Strategies for Entrepreneurial Success, Journal of Strategic
Management Education, 5(1), 33-44.
Burke, A.E. (2011), The entrepreneurship enabling role of freelancers; theory with
evidence from the construction industry, International Review of
Entrepreneurship 9(3), 1-28.
Carree, M.A., A.J. van Stel, A.R. Thurik and A.R.M. Wennekers (2002), Economic
development and business ownership: an analysis using data of 23 OECD
countries in the period 1976-1996, Small Business Economics 19(3), 271-290.
Casson, M.C. (1982), The Entrepreneur: An Economic Theory, Oxford: Martin
Robertson.
Clark, A.E. and A.J. Oswald (1994), Unhappiness and unemployment, The Economic
Journal 104, 648-659.
Criscuolo, C., P. Gal and C. Menon (2014), The dynamics of employment growth; new
evidence from 18 countries, OECD Science, Technology and Industry Policy
Paper, Paris: OECD Publishing.
Cromer, C.T., C. Dibrell and J.B. Craig (2011), A study of Schumpeterian (radical) vs.
Kirznerian (incremental) innovations in knowledge intensive industries, Journal
of Strategic Innovation and Sustainability 7(1), 28-42.
Croonen, E.P.M., M.J. Brand, and E.K.R.E. Huizingh (2014), To be entrepreneurial, or
not to be entrepreneurial? Explaining differences in franchisee entrepreneurial
behavior within a franchise system, International Entrepreneurship and
Management Journal, forthcoming. DOI 10.1007/s11365-014-0352-1.
De Jong, J.P.J. and O. Marsili (2015), The distribution of Schumpeterian and
Kirznerian opportunities, Small Business Economics 44(1), 19-35.
De Kok, J.M.P., Y. Prince and T. Span (2015), De bijdrage van het MKB aan de
Nederlandse economie, Zoetermeer: Panteia.
Di Tella, R. and R.J. MacCulloch and A.J. Oswald (2001), Preferences over inflation
and unemployment: evidence from surveys of happiness, American Economic
Review 91(1), 335-341.
EZ/Panteia (2014), Entrepreneurship in the Netherlands; the top sectors, Zoetermeer:
Panteia.
Foss, N.J. (1993), Theories of the firm: contractual and competence perspectives,
Journal of Evolutionary Economics 3, 127-144.
Fritsch, M. and P. Mueller (2004), The effects of new business formation on regional
development over time, Regional Studies 38, 961-975.
26
Hébert, R.F. and A.N. Link (1982), The Entrepreneur: Mainstream Views and Radical
Critiques, New York: Praeger.
Hébert, R.F. and A.N. Link (1989), In search of the meaning of entrepreneurship,
Small Business Economics 1, 39-49.
Hoogendoorn, B. (2011), Social entrepreneurship in the modern economy; Warm
glow, cold feet, ERIM PhD Series in Research in Management, no. 246,
Rotterdam: ERIM.
Hoogendoorn, S.M. (2013), Diversity and team performance; A series of field
experiments, Tinbergen Institute Research Series, no. 555, Amsterdam:
Tinbergen Institute.
Hoselitz, B.F. (1960), The early history of entrepreneurial theory, in: J.J. Spengler and
W.R. Allen (eds.), Essays in Economic Thought: Aristotle to Marshall, Chicago:
Rand McNally (original version was published in 1951).
Kaldor, N. (1966), The causes of the slow rate of economic growth of the United
Kingdom: an inaugural lecture, Cambridge: Cambridge University Press.
Kirzner, I.M. (1997), Entrepreneurial discovery and the competitive market process:
an Austrian approach, Journal of Economic Literature 35, 60-85.
Klepper, S. (2002), Firm survival and the evolution of oligopoly, RAND Journal of
Economics 33(1), 37-61.
Klepper, S., and E. Graddy (1990), The evolution of new industries and the
determinants of market structure, RAND Journal of Economics, 21, 27-44.
Knight, F.H. (1921), Risk, Uncertainty and Profit, Boston, MA: Houghton Mifflin.
Koellinger, P. (2008), Why are some entrepreneurs more innovative than others?,
Small Business Economics, 31, 21–37.
Lumpkin, G.T. and G.G. Dess (1996), Clarifying the entrepreneurial orientation
construct and linking it to performance, Academy of Management Review 21(1),
1-37.
Malerba, F. and L. Orsenigo (1995), Schumpeterian patterns of innovation, Cambridge
Journal of Economics 19(1), 47-65.
Mazzucato, M. and C. Perez (2014), Innovation as growth policy; the challenge for
Europe, Working Paper SWPS 2014-13, Science Policy Research Unit, University
of Sussex.
McGowan, K. (2014), Brilliant impersonators, Aeon Magazine, November 2014
(aeon.co).
McGrath, R.G. (1999), Real options reasoning and entrepreneurial failure, Academy of
Management Review 24(1), 13-30.
Millán, J.M., J. Hessels, A.R. Thurik and R. Aguado (2013), Determinants of job
satisfaction: a European comparison of self-employed and paid employees,
Small Business Economics 40, 651-670.
Minniti, M. and M. Lévesque (2010), Entrepreneurial types and economic growth,
Journal of Business Venturing 25, 305-314.
Noorderhaven, N., A.R. Thurik, S. Wennekers and A. van Stel (2004), The role of
dissatisfaction and per capita income in explaining self-employment across 15
European countries, Entrepreneurship Theory and Practice 28, 447-466.
Nooteboom, B. (1999), Learning, innovation and industrial organization, Cambridge
Journal of Economics 23, 127-150.
OECD/The European Commission (2013), The missing entrepreneurs; policies for
inclusive entrepreneurship in Europe, OECD Publishing
(http://www.oecd.org/cfe/leed/inclusive-entrepreneurship.htm).
Panteia (2011), Trendstudie MKB en Ondernemerschap; ontwikkelingen, vooruitblik en
beleidssignalen, Zoetermeer: Panteia.

27
Prince, Y. and P. van der Zeijden (2015), Aandacht voor het MKB in het
bedrijvenbeleid, Zoetermeer: Panteia.
Schumpeter, J.A. (1934/1911), The Theory of Economic Development, Cambridge,
MA: Harvard University Press (a translation of the second edition from 1926 of a
work that originally appeared in 1911).
Schumpeter, J.A. (1942), Capitalism, Socialism and Democracy, New York: Harper and
Row.
Shane, S. and S. Venkataraman (2000), The promise of entrepreneurship as a field of
research, Academy of Management Review 25(1), 217-226.
Shane, S. (2003), A General Theory of Entrepreneurship; The Individual-Opportunity
Nexus, Cheltenham: Edward Elgar.
Shane, S. (2004), Academic Entrepreneurship: University Spinoffs and Wealth
Creation, Northampton, MA: Edward Elgar Publishing.
Shapero, A. and L. Sokol (1982), The social dimensions of entrepreneurship, in: C.A.
Kent, D.L. Sexton and K.H. Vesper (eds.), Encyclopedia of Entrepreneurship,
72-90, Englewood Cliffs, NJ: Prentice-Hall.
Stam, E. (2014), The Dutch Entrepreneurial Ecosystem, Utrecht: Birch Research.
Available at SSRN: http://ssrn.com/abstract=2473475 or
http://dx.doi.org/10.2139/ssrn.2473475
Stam, E. and B. Nooteboom (2011), Entrepreneurship, innovation and institutions, in:
D. Audretsch, O. Falck and S. Heblich (eds.), Handbook of Research on
Innovation and Entrepreneurship, Cheltenham: Edward Elgar, 421-438.
Sternberg, R. and S. Wennekers (2005), Determinants and effects of new business
creation; investigations using Global Entrepreneurship Monitor data, Small
Business Economics, 24(3), 193-203.
Terjesen, S., J. Hessels and D. Li (2013), Comparative International Entrepreneurship:
A Review and Research Agenda, Journal of Management, forthcoming. DOI:
10.1177/0149206313486259.
Teruel, M. and G. de Wit (2011), Determinants of high-growth firms; Why do some
countries have more high-growth firms than others?, Research Report 201107,
Zoetermeer: Panteia/EIM.
Thurik, A.R., S. Wennekers and L.M. Uhlaner (2002), Entrepreneurship and economic
performance: a macro perspective, International Journal of Entrepreneurship
Education 1(2), 157-179.
Van Praag, C.M. (1999), Some classic views on entrepreneurship, De Economist 147,
311-335.
Van Praag, C.M. and P.H. Versloot (2007), What is the value of entrepreneurship? A
review of recent research, Small Business Economics 29(4), 351-382.
Van Stel, A., T. Span and J. Hessels (2014), Global Entrepreneurship Monitor the
Netherlands 2013; National Report, Zoetermeer: Panteia.
Verhoeven, W. (2004), Firm dynamics and labour productivity, in: G. Gelauff et al.
(eds.), Fostering Productivity; Patterns, Determinants and Policy Implications ,
Elsevier, 211-241.
Wennekers, S. (2006), Entrepreneurship at Country Level; Economic and Non-
Economic Determinants, Ph.D. Thesis, Rotterdam: ERIM.
Wennekers, S. and A.R. Thurik (1999), Linking entrepreneurship and economic growth,
Small Business Economics, 13 (1), 27-55.
Wennekers, S., A. van Stel, M. Carree and A.R. Thurik (2010), The relationship
between entrepreneurship and economic development: Is it U-shaped?,
Foundations and Trends in Entrepreneurship 6(3), 167-237.
Westhead, P., M. Wright and G. McElwee (2011), Entrepreneurship: Perspectives and
Cases, Harlow: Pearson Education.

28
Winkelmann, L. and R. Winkelmann (1998), Why are the unemployed so unhappy?
Evidence from panel data, Economica 65, 1-15.
Ziegler, C.A. (1985), Innovation and the imitative entrepreneur, Journal of Economic
Behavior and Organization 6, 103-121.
29
3 Ambitious entrepreneurs
Nardo de Vries – Maastricht University8
This chapter reviews the literature with regards to the conceptualization and
prevalence of ambitious entrepreneurship as well as the contributions of this type of
entrepreneurship to the economy and society. Next to theoretical foundations and
concepts, the operationalization and measurement problems are discussed. The rate of
ambitious entrepreneurship in the Netherlands is relatively low and declining over the
years. Some possible explanations and policy implications are presented.
3.1 Introduction
Ambitious entrepreneurship relates to a recently explored research domain covering
individuals who are engaged in the entrepreneurial process with the aim to create as
much value as possible. This research field has received increasing attention in
academic research (Hermans, Vanderstraeten, Dejardin, Ramdani, Stam, & Van
Witteloostuijn, 2012) and also by practitioners (Stam, et al., 2012). One important
reason for this surge is that recent studies suggest that ambitious entrepreneurship
contributes more strongly to macro-economic growth than conventional
entrepreneurial activity (Stam, Suddle, Hessels, & Van Stel, 2009; Stam, Hartog, Van
Stel, & Thurik, 2011; Acs & Varga, 2005). Furthermore, from a policy point of view,
the focus on ambitious entrepreneurship is interesting because specific determinants
identified at the individual and institutional level may help develop feasible and
adequate support schemes for practitioners (Autio, Kronlund, & Kovalainen, 2007;
Stam, et al., 2012).
There is an extensive literature, predating the year 2000, on entrepreneurial
ambitions in general, involving entrepreneurial intentions, motivations, growth
willingness and aspirations. Nevertheless, that earlier research lacks an explicit
distinction between high and low levels of ambitions. This is a relevant taxonomy, as
argued by Stenholm, Acs and Wuebker (2013), because not all entrepreneurial
activities contribute equally to development (Amorós, Bosma, & Levie, 2013; Baumol,
1990). As Hermans et al. (2012) demonstrate, there is a growing body of knowledge
on high ambition level entrepreneurship, i.e., ambitious entrepreneurship, which has
been developed predominantly in this millennium. High ambition levels form a
breeding ground for value creation, conceivably translating into more high-growth
entrepreneurship with a strong contribution to macro-economic growth (Stam, Suddle,
Hessels, & Van Stel, 2009). The first contributions actually addressing activities with
high-level entrepreneurial ambitions, hence coining the term “ambitious
entrepreneurship”, appeared in 2001 (Gundry & Welsch, 2001; Guzmán & Santos,
2001). Since then, numerous studies emerged focusing on high ambition
entrepreneurial activity, which also coincided with the availability of relevant data
collected via the Global Entrepreneurship Monitor (GEM) and the Panel Study of
Entrepreneurial Dynamics (PSED).9
8 At the time of writing this chapter, the author was affiliated with Panteia/EIM. 9 Both data sets focus on nascent and early-stage entrepreneurial activity.

30
Although the scrutiny of ambitious entrepreneurship seems to deliver promising
insights and suggests a specific impact on the economy, it is still surrounded by a lack
of clarity. It is not always a foregone conclusion that the prevalence of high-level
ambitions contributes to economic development. Much is still unclear about the way
that ambitions are effectuated, or rather not translated, into realized performance.
Are there direct or perhaps indirect effects? Also, the chase for high-growth
entrepreneurship is still unsubstantiated by evidence that their value creation is
sustained for longer periods (Daunfeldt & Halvarsson, 2015). Furthermore, we need
deeper understanding of the contextual conditions of ambitious entrepreneurship. For
instance, how do interactions between innovations, motivations and institutions and
ambitions influence the realization of performance? Finally the advancement of
ambitious entrepreneurship research is hampered by problems with the
conceptualization and operationalization of the main concept: growth ambitions
(Hermans et al., 2012).
3.2 Explaining ambitious entrepreneurship
3.2.1 Theory
The research on entrepreneurial ambitions and the role they play in the
entrepreneurial process is rooted in psychological theory on motivation. This approach
regards the willingness to pursue growth as one of the important factors in explaining
differences in growth patterns of (small) businesses. Davidsson (1989) identified and
estimated that factors such as financial reward, independence, well-being of
employees and loss of control influence the willingness of small business managers to
pursue growth. In subsequent work, Davidsson (1991) postulated that growth
motivation of entrepreneurs depends on the latent ability, need and opportunity to
grow their own firm as well as his/her own perception on these facets. These insights
draw heavily on the theory of planned behavior (Fishbein & Ajzen, 1975; Ajzen,
1991). Translating this theory into the context of entrepreneurship, implies that the
entrepreneur’s attitude towards growing the firm can predict the intention to grow and
that is often associated with the realization of growth (Wiklund, Davidsson, & Delmar,
2003). Intentions are then also affected by the expected consequences of growth. For
instance, expected financial gains or increased independence positively affect growth
motivation, whereas an expected loss of control has a negative effect (Davidsson,
1989).
3.2.2 Concepts
A distinction can be made between entrepreneurial ambitions and ambitious
entrepreneurship. The difference appears to be nuanced, but as entrepreneurship is
viewed by many as an activity involved with the principal pursuit of profit and growth
(Carland, Hoy, Boulton, & Carland, 1984), it can be considered ambitious by nature.
Ambitious entrepreneurship however, is characterized by above-normal growth
intention. Hence, “An ambitious entrepreneur is someone who engages in the
entrepreneurial process and operates a new private business venture with the aim to
create as much value as possible.” (Stam, et al., 2012). Autio (2011) defines high-
aspiration entrepreneurial activity as entrepreneurial start-ups that exhibit an
aspiration to rapidly grow their employment size.
The extant literature on ambitious entrepreneurship mentions several concepts to
capture the ambitious nature of entrepreneurs. Indeed, growth willingness, growth
intentions or aspirations and growth expectations are introduced and sometimes even
used interchangeably. Part of the explanation for this myriad in concepts is embedded
in the composite nature of growth motivation (Wiklund, Patzelt, & Shepherd, 2009).

31
It is argued that these motivations are composed of an affective component, which
consists of feelings, emotions and attitudes towards growth. Second, they consist of a
behavioural component expressed in terms of intentions (or aspirations) to grow.
Third, they consist of a cognitive component that includes the assessment of expected
consequences of growth. In other words, growth motivations are the combined
outcome of what an entrepreneur desires, intends and expects with regard to firm
growth (Verheul & Van Mil, 2011; Hermans, Vanderstraeten, Dejardin, Ramdani, Stam
& Van Witteloostuijn, 2012).
Our understanding of ambitious entrepreneurship is hampered by the lack of
corresponding concepts and clear definitions (Hermans, Vanderstraeten, Dejardin,
Ramdani, Stam, & Van Witteloostuijn, 2012). Differences in the conceptualization of
growth ambitions make it difficult to arrive at clear, unambiguous conclusions.
Furthermore, the abovementioned concepts are used interchangeably. Some
clarification is offered by Hermans, et al. (2012, p. 21) who propose a growth
projecting process as intermediate component between growth attitude and growth
realization (figure 4). The growth projecting process encompasses the individual
growth intentions of the entrepreneur (ideal firm size) confronted with the availability
of resources and perceived opportunities and constraints. As such, the entrepreneur
arrives at well-reasoned expectations of firm growth (expected firm size), which can
then be transformed into actual realized growth. The proposed model enables us to
identify the ambitious entrepreneurs, i.e. those that display above-average intentions
to grow, and shows what mechanisms are at play.
figure 4 A model of ambitious entrepreneurship and growth realization
Source: Hermans et al. (2012), adapted from Stam et al. (2012).

32
3.2.3 Operationalizat ion and measurement of ambit ious entrepreneurship
To capture the concept of ambitious entrepreneurship it is necessary to explicitly
operationalize the difference between high and low ambitions. What can be considered
as high and low ambitions levels? In the Global Entrepreneurship Monitor (GEM) high-
aspiration entrepreneurial activity (HEA) is typically a subset of total early-stage
entrepreneurial activity (TEA), consisting of individuals who expect to grow with
twenty or more individuals within five years (Autio, 2011). In some cases ambitious
entrepreneurship is defined as the share of TEA that expects their firm to grow with at
least six employees in the next five years (Stam, Hartog, Van Stel, & Thurik, 2011).
Another source used to empirically measure ambitious entrepreneurship is the Panel
Survey on Entrepreneurship Dynamics (PSED) that employs similar thresholds but with
sales, revenues and fees (Cassar, 2007, p. 95).
The empirical work on ambitious entrepreneurship reveals that the majority of the
research is focused on growth ambitions (Hermans, Vanderstraeten, Dejardin,
Ramdani, Stam, & Van Witteloostuijn, 2012). Next to growth, other dimensions such
as innovation, export, finance and wealth are examined in the literature to assess how
ambitious entrepreneurs pursue value creation beyond subsistence. Unfortunately, this
observed heterogeneity of constructs poses problems for drawing overarching
conclusions.
3.3 Prevalence and characteristics of ambitious entrepreneurship
Most studies on ambitious entrepreneurship use the aforementioned criterion of at
least twenty expected additional employees in the next five years to indicate high
ambition levels (Hermans, Vanderstraeten, Dejardin, Ramdani, Stam, & Van
Witteloostuijn, 2012). On average for all participating countries in GEM, high
aspiration entrepreneurship represents about ten percent of total early-stage
entrepreneurial activity (Autio, 2011, p. 252). These ambitious entrepreneurs account
for more than seventy percent of the expected employment growth by all (nascent)
firms. A breakdown between high-income and low-income countries over the period
2002-2008 reveals that the rate of high aspiration entrepreneurship was twelve
percent and seven percent of the total early-stage entrepreneurs respectively (Autio,
2011, p. 257). When the high aspiration threshold is stretched to an expected job
growth of six additional employees the prevalence of ambitious entrepreneurship
increases to 43 percent on average (Stam, Hartog, Van Stel, & Thurik, 2011, p. 237).
figure 5 Job growth expectations between now and five years of early-stage entrepreneurs internationally
compared (unweighted average), 2013, percentage of TEA
Source: Global Entrepreneurship Monitor, calculations by Panteia, 2014
65,6
6,5
72,2
11,4
0 25 50 75 100
any jobs
more than 19 jobs
Netherlands innovation-driven economies

33
In the Netherlands the rate of ambitious entrepreneurship is below the average of all
innovation-driven economies (see figure 5). With 6.5 percent of total early-stage
entrepreneurs (TEA) expecting to grow their business with more than 19 jobs the
Dutch rate of ambitious entrepreneurs is more than 40 percent lower than the average
of all innovation-driven economies. This suggests that the size class structure in the
Netherlands is more skewed towards small size enterprises, with relatively
underdeveloped growth ambitions. One explanation for this might be the relatively
high increase of solo self-employment in the Netherlands in the past decade (Rapelli,
2012; Leighton & Brown, 2013). This type of entrepreneurship typically does not
expect similar levels of job growth compared to other business types, such as team
entrepreneurs or employer firms (Van der Zwan, Hessels, Hoogendoorn, & De Vries,
2013).
figure 6 Development of high job growth expectation (more than 19 jobs) of early-stage entrepreneurs in
the Netherlands and innovation-driven economies, 2002-2013, percentage of TEA
Source: Global Entrepreneurship Monitor, calculations by Panteia, 2014
The rate of high expectation TEA (the HEA-rate: more than 19 expected jobs within
the next five years) in the Netherlands is fluctuating but steadily decreasing over
time. Figure 6 shows that the aforementioned 6.5 percent of HEA in 2013 is less than
half the 14 percent of HEA in 2002. For innovation-driven economies we obtained the
HEA-rates from 2010 and onwards, indicating a stable rate of approximately 10 to 12
percent. Possible explanations might be rooted in institutional arrangements, such as
the access to capital and/or the opportunity for knowledge spillovers (Bowen & De
Clercq, 2007; Stenholm, Acs, & Wuebker, 2013). These arrangements have been
positively linked to high growth-oriented entrepreneurship. Since the financial crisis,
access to finance is relatively difficult for SMEs in the Netherlands. In 2014 the
highest complete (‘flat-out’) rejection rate of bank loan applications by SMEs in the
EU-28 was reported in the Netherlands (Doove, Gibcus, Kwaak, Smit, & Span, 2014).

34
3.3.1 Individual characterist ics of ambit ious entrepreneurs
Previous research on entrepreneurship has already established the link between
individual characteristics and growth expectations (Davidsson, 1991). However,
promising findings from the ambitious entrepreneurship field suggest that specific
drivers might be at play, that are influenced by individual level factors (Hermans,
Vanderstraeten, Dejardin, Ramdani, Stam, & Van Witteloostuijn, 2012). The decision
to pursue a high-aspiration entrepreneurial firm is constituted in personal
characteristics attitudes and the individual’s human capital.
Age seems to impact both growth preferences and growth expectations (Verheul & Van
Mil, 2011). Autio (2011) finds a non-linear relation, suggesting that both younger and
older entrepreneurs are more likely to pursue rapid growth of their venture. Not all
individual level studies confirm an effect of gender. Verheul and Van Mil (2011) find
that the impact of female nascent entrepreneurs and young business owners
disappears after including control variables (such as exporting). However, the authors
did not specifically model high job growth expectations. In contrast, other studies
observe that men are more likely to qualify as high aspiration entrepreneurs than
women (Autio, 2011). An important aspect of individual human capital endowments is
the educational level. Ambitious entrepreneurs are more likely to be found among
higher educated individuals (Autio, 2011). The impact of education is substantiated by
other empirical research (Terjesen & Szerb, 2008), although it is also suggested that
the effect might be indirect through other variables (Verheul & Van Mil, 2011). From a
psychological point of view, entrepreneurs that are highly ambitious are mostly
motivated by intrinsic and opportunity driven motives rather than extrinsic and
necessity (Guzmán & Santos, 2001; Verheul & Van Mil, 2011).
3.4 Economic contributions of ambitious entrepreneurship
3.4.1 Contributions at the micro level:
At the individual level high ambitions may contribute to firm performance. It is often
implied that entrepreneurship in the Schumpeterian sense includes the ambition to
innovate and grow. Simply starting a business is not entrepreneurial by Schumpeter’s
definition, let alone a form of ambitious entrepreneurship. Therefore, those individuals
who (have the ambition to) innovate and disrupt markets by introducing new and
improved products and processes can be classified as entrepreneurial. Ambitious
entrepreneurs (e.g. represented by high-impact entrepreneurs) are more likely to
fulfill an entrepreneurial function via the role of exploration (creating change),
exploitation (pursuing business opportunities) and finally enabling (inspiring and
complementing) growth in other firms and thus more prone to create additional value
(Sanandaji & Sanandaji, 2014). However, the interrelationship between high-
aspirations and actual firm performance has not yet been fully explored.
As it is often argued that ambitious entrepreneurship is linked to high performance
and high-growth firms (Teruel & De Wit, 2011), a lot of attention has been paid to the
economic consequences of this latter group. An intriguing study in the field of high-
impact entrepreneurship is aimed at super entrepreneurs or billionaire entrepreneurs,
i.e. individuals who are classified as self-made (not inherited) billionaires according to
the Forbes Magazine worldwide list (Henrekson & Sanandaji, 2014; Sanandaji &
Sanandaji, 2014). In total, the authors identified 996 self-made billionaire
entrepreneurs in 53 countries, who were able to acquire high wealth by creating a
business and maintain persistent high growth. These entrepreneurs form anecdotal
evidence that ambitious entrepreneurship can be an innovative and disruptive force
that changes markets.

35
An important caveat with ambitious and high-growth entrepreneurship is the
sustainability of the implied impact. Using firm-level data from Sweden during the
period 1997–2008, Daunfeldt and Halvarsson (2015) examined the growth persistence
of high-growth firms. They show that fast-growing firms are not capable to maintain
this high growth in a subsequent period, and thus can be classified as one-hit
wonders. As a consequence, policies aimed at promoting high-growth firms that
previously realised high growth rates are unlikely to succeed.
3.4.2 Contributions at the macro level
The aggregate of the individual level effects, i.e., the explorative, exploitative and
enabling role of ambitious entrepreneurship is assumed to contribute to macro
economic development. However, the evidence at the macro level is still inconclusive.
Some studies report a positive influence of ambitious entrepreneurial activity on
technological change (Acs & Varga, 2005) and some claim that ambitious
entrepreneurship better explains macro-economic growth than entrepreneurial activity
in general (Wong, Ho, & Autio, 2005; Stam, Suddle, Hessels, & Van Stel, 2009). For
instance, the ambition level of early-stage entrepreneurs is found to determine the
rate of high growth firms in a country (Teruel & De Wit, 2011). On the other hand,
there are also studies that report no impact of ambitious entrepreneurship on
economic growth in emerging countries (Valliere & Peterson, 2009) and that there is
no link between the rate of high-growth firms and the share of ambitious
entrepreneurs (Stam, Hartog, Van Stel, & Thurik, 2011).
A possible explanation for these ambiguous results might be that the relationship
between ambitions and macro economic growth suffers from endogeneity bias. For
example, ambition levels may be influenced by recent economic development, so that
they form a lagging indicator for macro-economic growth (Autio, 2011; Hermans,
Vanderstraeten, Dejardin, Ramdani, Stam, & Van Witteloostuijn, 2012). Most studies
do not consider this endogeneity problem. One exception is the study of Stam et al.
(2011), which found a stand-alone effect of ambitious entrepreneurship on macro-
economic growth when controlling for previous macro-economic conditions.
3.5 Summary and policy implications
Ambitious entrepreneurs are those individuals engaged in the entrepreneurial process
with the aim to create as much value as possible. The research on ambitious
entrepreneurship has received increasing attention in the past decade. From a
theoretical perspective it is argued that the attitude towards and motivation for high
value creation (mostly in the form of firm growth), shapes entrepreneur’s growth
intentions which are then translated into realistic expectations. Finally the
expectations are then often associated with actual realization of (high) growth.
Ambitious entrepreneurs are more likely to fulfill an entrepreneurial function via the
role of exploration (creating change), exploitation (pursuing business opportunities)
and finally enabling (inspiring and complementing) growth in other firms and thus
create more value.
Although there is still debate on how to best operationalize and measure ambitious
entrepreneurship, the worldwide prevalence can be estimated as approximately
10 percent of total early-stage entrepreneurial activity (12 percent in high-income and
7 percent in low-income countries).

36
With 6.5 percent of total early-stage entrepreneurial activity (TEA) in 2013, the Dutch
rate of ambitious entrepreneurs is below the average of all innovation-driven
economies. Possible explanations might be rooted in institutional arrangements, such
as the access to capital and/or the opportunity for knowledge spillovers. Since the
financial crisis, access to finance is relatively difficult for SMEs in the Netherlands
(Doove et al., 2014). Of course, more research is required in order to be able to link a
(possible) lack of access to finance to the relatively low rate of ambitious
entrepreneurship in the Netherlands.
3.5.1 Policy implications
Our review confirms that ambitious entrepreneurship can be regarded as a distinct
type of entrepreneurial activity compared to entrepreneurship in general. It is
important to note that both types of entrepreneurship play their own role and are
important for a well-functioning economy (Henrekson & Sanandaji, 2014). For
instance, ambitious entrepreneurship is typically associated with roles such as value
creation and growth, whilst small business activity is instead associated with
“…flexible employment forms, mitigation of agency problems and a safety valve from
dysfunctional economic systems.” (Henrekson & Sanandaji, 2014, p. 11). Different
antecedents exist for entrepreneurship in general and for ambitious entrepreneurship
respectively (Autio, 2011; Stam, et al., 2012; Hermans, Vanderstraeten, Dejardin,
Ramdani, Stam, & Van Witteloostuijn, 2012). Not surprisingly, both types of
entrepreneurship seem to thrive under different circumstances (Sanandaji &
Sanandaji, 2014). Hence, different policy implications should be considered in order to
support each of these types (Autio, Kronlund, & Kovalainen, 2007; Stam, et al.,
2012). Policy measures aimed at promoting entrepreneurship in general, in other
words the quantity of entrepreneurship may not help to promote ambitious or high-
impact entrepreneurship. In some cases it is even possible that measures encouraging
conventional entrepreneurship, simultaneously hinder ambitious entrepreneurship
(Henrekson & Sanandaji, 2014).
Stam et al. (2012) propose four transition paths necessary for promoting high-
potential and ambitious entrepreneurship. First, the transition to more ambitious
individuals; second, the stimulation of (ambitious) individuals to turn to
entrepreneurship; third, to stimulate entrepreneurs to become ambitious
entrepreneurs; and finally to realize the creation of new value. Supporting the first
two transition schemes requires policies aimed at (entrepreneurial) education and
skills development, (public) investments in knowledge creation and also more labor
market flexibility. For the two final transition paths Autio, Kronlund and Kovalainen
(2007) make a contribution by distinguishing between classical and high-growth
entrepreneurship policies. To stimulate ambitious entrepreneurship, more emphasis
should be put on quality instead of the quantity of entrepreneurship, by getting the
right people starting a business, facilitating new firm growth instead of new firm
creation, inducing public and private partnerships and by offering expert advice on
firm growth and internationalization.
In the specific context of the aforementioned super entrepreneurs (or self-made
billionaire entrepreneurs) Sanandaji and Sanandaji (2014) argue that only the right
preconditions can help getting more of those. For instance, societies that embrace a
system with English legal origins are associated with a higher prevalence of super
entrepreneurs than nations with systems based on German, Scandinavian or French
legal origins. Furthermore, in economies with weak protection of property rights, weak
(informal) institutions and low levels of interpersonal trust the incidence of billionaire

37
entrepreneurs is low, because firms cannot rely on contracts and are not able to
effectively manage their employees.
A final policy implication from our review on ambitious entrepreneurship is on a more
cautionary note. Studying the persistence of high-growth firms and super
entrepreneurs revealed that only very few numbers maintain a persistent high growth
rate for a longer period (Daunfeldt & Halvarsson, 2015; Henrekson & Sanandaji,
2014).
Policies that are based on previous growth rates of firms are therefore likely to fail. It
is recommended to look for the more dynamic firms characterized by high volatility in
number of employees as these firms are more likely to contribute to firm growth.
Furthermore, these high-impact entrepreneurs appear to be very scarce and
exceptional and the findings imply that it is very hard to target policies for the
highest-impact firms (like finding a needle in a haystack). We argue that it might be
more fruitful to support/facilitate a greater group of moderately ambitious
entrepreneurs when on balance the final aggregated impact might be greater.
Finally, more research is needed on the failure rate and the constraints for high-
impact entrepreneurship. In particular, more research is needed on what factors
influence the transition of ambitions into actual realization of these ambitions.
3.6 Literature
Acs, Z., & Varga, A. (2005). Entrepreneurship, agglomeration and technological
change. Small Business Economics, 24(3), 305-322.
Ajzen, I. (1991). The theory of planned behaviour. Organizational Behavior and
Human Decision Processes, 50, 179-211.
Amorós, J. E., Bosma, N., & Levie, J. (2013). Ten years of Global Entrepreneurship
Monitor: accomplishments and prospects. International Journal of
Entrepreneurial Venturing, 5(2), 120-152.
Autio, E. (2011). High-Aspiration Entrepreneurship. In M. Minniti (Ed.), The Dynamics
of Entrepreneurship: Evidence from Global Entrepreneurship Monitor Data (pp.
251-276). New York: Oxford University Press.
Autio, E., Kronlund, M., & Kovalainen, A. (2007). High-growth SME support initiatives
in nine countries: Analysis, Categorization and Recommendations. Edita,
Finland: Edita Publishing.
Baumol, W. J. (1990). Entrepreneurship: productive, unproductive, and destructive.
Journal of Political Economy, 98(5-1), 893-921.
Bowen, H., & De Clercq, D. (2007). Institutional context and the allocation of
entrepreneurial effort. Journal of International Business Studies, 39(4), 747-
767.
Carland, J. W., Hoy, F., Boulton, W. R., & Carland, J. A. (1984). Differentiating
entrepreneurs from small business owners: A conceptualization. Academy of
Management Review, 9(2), 354-359.
Cassar, G. (2007). Money, money, money? A longitudinal investigation of
entrepreneur career reasons, growth preferences and achieved growth.
Entrepreneurship & Regional Development, 19(1), 89-107.
Daunfeldt, S.-O., & Halvarsson, D. (2015). Are high-growth firms one-hit wonders?
Evidence from Sweden. Small Business Economics, 44(2), 361-383.
Davidsson, P. (1989). Entrepreneurship and after? A study of growth willingness in
small firms. Journal of Business Venturing, 4(3), 211-226.

38
Davidsson, P. (1991). Continued entrepreneurship: Ability, need, and opportunity as
determinants for small firm growth. Journal of Business Venturing, 6(6), 405-
425.
Doove, S., Gibcus, P., Kwaak, T., Smit, L., & Span, T. (2014). Survey on the access to
finance of enterprises (SAFE); Analytical Report 2014. Report commissioned
by Directorate-General for Enterprise and Industry. Brussels: European
Commission.
Fishbein, M., & Ajzen, I. (1975). Belief, Attitude, Intention and Behaviour: An
Introduction to Theory and Research. Reading, MA: Addison-Wesley.
Gundry, L. K., & Welsch, H. P. (2001). The ambitious entrepreneur: High growth
strategies of women-owned enterprises. Journal of Business Venturing, 16(5),
453-470.
Guzmán, J., & Santos, F. J. (2001). The booster function and the entrepreneurial
quality: An applicaton of the province of Seville. Entrepreneurship and
Regional Development, 13(3), 211-228.
Henrekson, M., & Sanandaji, T. (2014). Small Business Activity Does not Measure
Entrepreneurship . Proceedings of the National Academy of Sciences of the
United States of America. PNAS.
Hermans, J., Vanderstraeten, J., Dejardin, M., Ramdani, D., Stam, E., & Van
Witteloostuijn, A. (2012). Ambitious Entrepreneurship: Antecedents and
Consequences. CERPE Working Paper Series, WP1210. Namur: University of
Namur.
Leighton, P., & Brown, D. (2013). Future working: The rise of Europe's independent
professionals (iPROS). London: EFIP/PCG.
Rapelli, S. (2012). European I-Pros: A Study. London, UK: Professional Contractors
Group Ltd. .
Sanandaji, T., & Sanandaji, N. (2014). SuperEntrepreneurs: And how your country can
get them. Surrey, UK: Centre for Policy Studies.
Stam, E., Bosma, N., Van Witteloostuijn, A., De Jong, J., Bogaert, S., Edwards, N., &
Jaspers, F. (2012). Ambitious Entrepreneurship: A Review of the Academic
Literature and New Directions for Public Policy. Report for the Advisory Council
for Science and Technology Policy (AWT) and the Flemish Council for Science
and Innovation (VRWI).
Stam, E., Hartog, C., Van Stel, A., & Thurik, R. (2011). Ambitious entrepreneurship.
high-growth firms and macroeconomic growth. In M. Minniti (Ed.), The
Dynamics of Entrepreneurship: Evidence from Global Entrepreneurship Monitor
Data (pp. 231-249). New York: Oxford University Press.
Stam, E., Suddle, K., Hessels, J., & Van Stel, A. (2009). High-Growth Entrepreneurs,
Public Policies and Economic Growth. In J. Leitao, & R. Baptista (Eds.), Public
Policies for Fostering Entrepreneurship: A European Perspective (Vol. 22, pp.
91-110). New York, NY: Springer.
Stenholm, P., Acs, Z., & Wuebker, R. (2013). Exploring country-level insititutional
arrangements on the rate and type of entrepreneurial activity. Journal of
Business Venturing, 28(1), 176-193.
Terjesen, S., & Szerb, L. (2008). Dice thrown from the beginning? An empirical
investigation of determinants of firm level growth expectations. Estudios de
Economia, 35(2), 153-178.
Teruel, M., & De Wit, G. (2011). Determinants of high-growth firms: Why do some
countries have more high-growth firms than others? Zoetermeer:Panteia/EIM.
Valliere, D., & Peterson, R. (2009). Entrepreneurship and economic growth: Evidence
from emerging and developed countries. Entrepreneurship & Regional
Development, 21(5), 459-480.

39
Van der Zwan, P., Hessels, J., Hoogendoorn, B., & De Vries, N. (2013). Global
Entrepreneurship Monitor the Netherlands 2012. Zoetermeer: Panteia/EIM.
Verheul, I., & Van Mil, L. (2011). What determines the growht ambition of Dutch
early-stage entrepreneurs? International Journal of Entrepreneurial Venturing,
3(2), 183-207.
Wiklund, J., Davidsson, P., & Delmar, F. (2003). What do they think and feel about
growth? An expectancy-value approach to small business managers' attitudes.
Entrepreneurship Theory and Practice, 27(3), 247-270.
Wiklund, J., Patzelt, H., & Shepherd, D. (2009). Building an integrative model of small
business growth. Small Business Economics, 32(4), 351-374.
Wong, P., Ho, P., & Autio, E. (2005). Entrepreneurship, innovation and economic
growth: Evidence from GEM data. Small Business Economics, 24(3), 335-350.


41
4 Solo self-employed
Nardo de Vries – Maastricht University10
André van Stel – Kozminski University, Warsaw, Poland & Trinity College Dublin,
Ireland
This chapter reviews the literature on solo self-employment focusing on prevalence,
characteristics and economic and societal contributions. Besides providing
explanations for the upward trend in solo self-employment observed in many Western
economies, we shed light on the heterogeneity within the population of solo self-
employed with respect to demographic characteristics and start-up motives. Moreover,
we review the literature on the macro- and micro-level contributions of the solo self-
employed to societal and economic value creation, including well-being, income,
innovativeness, job creation and ambitions.
4.1 Introduction
From the 19th Century onwards, an increased importance of capital intensity and scale
economies in the production process led to ever decreasing rates of business
ownership in Western economies (Wennekers et al., 2010). However, from the 1970s
onwards, the trend toward lower business ownership rates reversed due to
technological developments and globalization. In particular, the production factor
knowledge became more important relative to capital, providing more room for small
and new firms. In many countries, the increase of the number of business owners was
accompanied by a disproportionate increase in the number of solo self-employed. For
example, between 1992 and 2008, the share of solo self-employed in the total number
of self-employed (i.e., including those holding employees) increased with more than
10 percentage points in the United States, Canada and Germany. In 2008, for a
selection of 26 OECD countries, the share of solo self-employed in total self-
employment was highest in the United Kingdom (78%; see Van Stel et al., 2014).
Two drivers of the trend towards higher levels of solo self-employment in modern
economies may be distinguished (Van Stel et al., 2014; Wennekers et al., 2010).
First, in many Western countries there is a trend of increased outsourcing to
freelancers by established firms, enabling the latter to be more flexible (Burke, 2011)
and, in case of dependent self-employment, to avoid paying social security
contributions (Román et al., 2011). Second, for higher levels of economic
development, different human motivations may have become important. In particular,
rather than basic material and social needs which already tend to be fulfilled in
developed societies, a need for autonomy and self-realization emerges (Maslow,
1970). Solo self-employment is a way of working which allows for a lot of freedom and
autonomy, thereby fulfilling these higher needs from the Maslow pyramid.
On the contrary, we can also identify a socio-economic trend implying fewer solo self-
employed. This is the larger supply of paid jobs and more stable wages which is
associated with higher levels of economic development (Lucas, 1978). These increased
possibilities to find wage-employment reduce the need to enter solo self-employment
out of a necessity motive, i.e., the inability to find a paid job. The increased numbers
10 The present chapter is an extended version of: Van Stel, A. and N. de Vries (2015), The economic value of
different types of solo self-employed: A review, International Review of Entrepreneurship, 13(2), 73-80. At the time of writing this chapter, both authors were affiliated with Panteia/EIM.
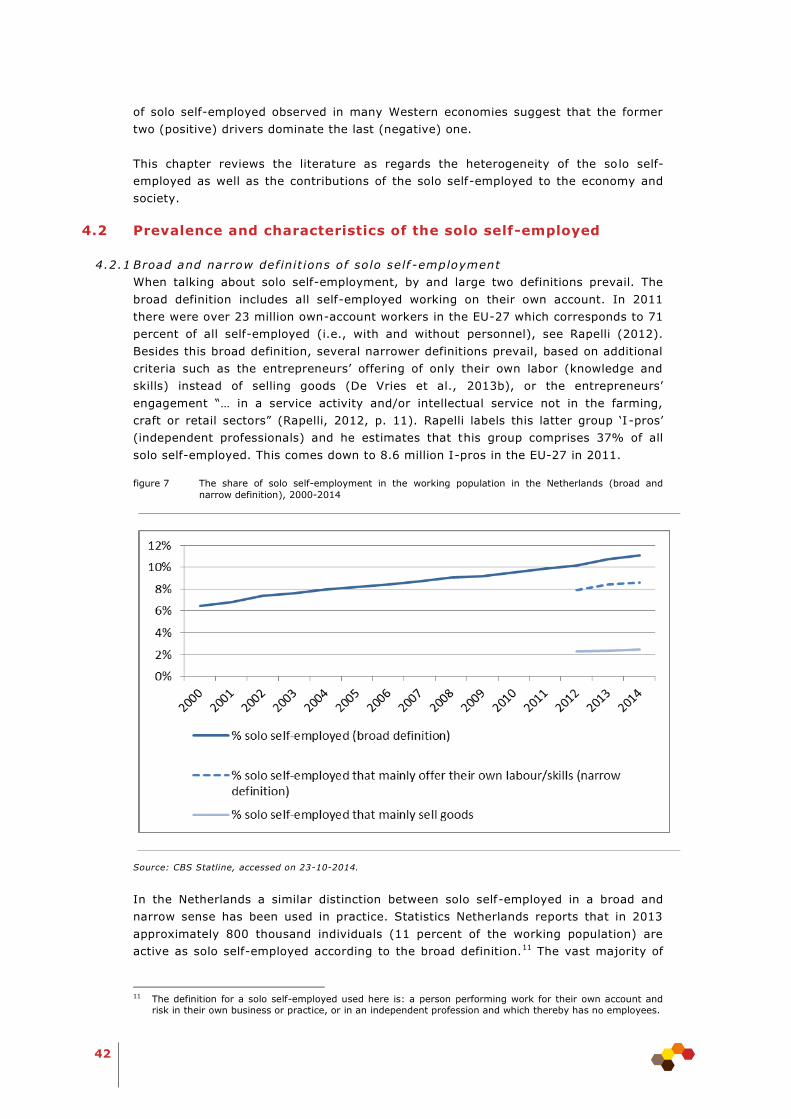
42
of solo self-employed observed in many Western economies suggest that the former
two (positive) drivers dominate the last (negative) one.
This chapter reviews the literature as regards the heterogeneity of the solo self-
employed as well as the contributions of the solo self-employed to the economy and
society.
4.2 Prevalence and characteristics of the solo self-employed
4.2.1 Broad and narrow def init ions of solo self -employment
When talking about solo self-employment, by and large two definitions prevail. The
broad definition includes all self-employed working on their own account. In 2011
there were over 23 million own-account workers in the EU-27 which corresponds to 71
percent of all self-employed (i.e., with and without personnel), see Rapelli (2012).
Besides this broad definition, several narrower definitions prevail, based on additional
criteria such as the entrepreneurs’ offering of only their own labor (knowledge and
skills) instead of selling goods (De Vries et al., 2013b), or the entrepreneurs’
engagement “… in a service activity and/or intellectual service not in the farming,
craft or retail sectors” (Rapelli, 2012, p. 11). Rapelli labels this latter group ‘I-pros’
(independent professionals) and he estimates that this group comprises 37% of all
solo self-employed. This comes down to 8.6 million I-pros in the EU-27 in 2011.
figure 7 The share of solo self-employment in the working population in the Netherlands (broad and
narrow definition), 2000-2014
Source: CBS Statline, accessed on 23-10-2014.
In the Netherlands a similar distinction between solo self-employed in a broad and
narrow sense has been used in practice. Statistics Netherlands reports that in 2013
approximately 800 thousand individuals (11 percent of the working population) are
active as solo self-employed according to the broad definition.11 The vast majority of
11 The definition for a solo self-employed used here is: a person performing work for their own account and
risk in their own business or practice, or in an independent profession and which thereby has no employees.

43
this group (78 percent) consists of solo self-employed who mainly offer (their own)
labor and skills.
Figure 7 clearly shows the rise in solo self-employment in the Netherlands over the
period 2000-2014. Since 2012 we are able to discern between the broad and the
narrow definition, indicating that the growth is mainly explained by an increase in solo
self-employed who mainly offer their own labor/skills.
The operationalization used in Panteia/EIM’s longitudinal panel of solo self-employed
(the so-called “zzp-panel”) is consistent with the abovementioned narrow definition.12
Individuals are considered to be solo self-employed if they independently undertake
entrepreneurial activities without employing another person. In addition they have to
indicate to mainly offer labor (knowledge, skills et cetera) instead of selling goods.
This definition is slightly broader than that of Rapelli’s I-pros, because it also includes
solo self-employed who mainly offer labor and operate in the construction and
agricultural sectors. The zzp-panel enables us to better investigate individual and firm
level characteristics, as well as personal motivations.
4.2.2 Exploring the heterogeneity among the solo self -employed
In the literature on (solo) self-employment, it is generally acknowledged that there is
much heterogeneity within this group of entrepreneurs (Blanchflower, 2000; Bosch
and Van Vuuren, 2010). The solo self-employed consist of a diverse group of
individuals varying from shopkeepers, craftsmen, ICT specialists, artists and
entertainers to doctors and nurses. They are active in almost all economic sectors, to
a high or lesser extent. Due to the observed heterogeneity, it is difficult to clearly
demarcate the group. However, two important dimensions along which the solo self-
employed are characterized are their demographic characteristics and their start-up
motivations.
4.2.3 Demographic characterist ics (for the narrow def init ion)
Rapelli (2012) reports that 46 percent of I-pros (his narrow definition of solo self-
employed, see above) in Europe in 2011 are women. However, there are considerable
country differences with the share estimated in the range of 40 to 58 percent. For the
Netherlands, for instance, the share of female I-pros is estimated to lie between 50
and 58 percent. Note that the definition of I-pros excludes the construction sector, a
sector dominated by male solo self-employed. Other data sources from the
Netherlands, that include these sectors, indicate lower shares of female solo self-
employment. The Dutch labor force survey and Panteia/EIM’s zzp-panel report 35 and
39 percent in 2014 respectively. Sectors with the highest shares of female solo self-
employment are the care and wellness sector (75 percent) and other services (57
percent) as is illustrated in figure 8.
12 See for a detailed description (in Dutch): http://persistent-identifier.nl/?identifier=urn:nbn:nl:ui:13-b2oc-ro

44
figure 8 Share of female solo self-employment in total solo self-employment in the Netherlands in 2014,
by sector
Source: Panteia/EIM’s zzp-panel 2014
Regarding age, Rapelli reports that 62 percent of European I-pros is between 25 and
49 years of age, while female I-pros are slightly younger than male ones. Regarding
education, Rapelli reports that 53 percent of European I-pros are highly educated.
There are considerable sector differences though, ranging from over 70 percent in the
human health and social work sector to below 30 percent for administrative and
support service activities. Also note that some sectors where education levels are
lower, such as construction, are excluded from the I-pros definition.
figure 9 Age distribution of solo self-employed and employees (15-64) in the Netherlands, 2014
*) Retrieved from CBS Statline, August 2014
Source: Panteia/EIM’s zzp-panel 2014 and Statistics Netherlands 2014.
0%
10%
20%
30%
40%
50%
60%
70%
80%
0%
10%
20%
30%
40%
up to 24 yrs 25 - 34 yrs 35 - 44 yrs 45 - 54 yrs 55 - 64 yrs
Solo self-employed (narrow defin.) Employees*

45
For the Netherlands we find different patterns. In general, solo self-employed are
relatively older than employees. Note that this comparison can only be made for the
group from 15 to 65 years (see figure 9). Approximately 63 percent is between 45 and
65 years old, whereas for employees this is only 42 percent. Again, the narrow
definition used in the Dutch sample includes the construction sector and agriculture
which might explain the differences. Regarding education, the average share of higher
educated solo self-employed in the Netherlands is 51 percent. Consistent with
Rapelli’s findings there are significant sector differences (figure 10). The share of
higher educated solo self-employed ranges from 83 percent in business services to 11
percent in the construction sector.
figure 10 Distribution of educational level of solo self-employed by sector in the Netherlands, 2014
Source: Panteia/EIM’s zzp-panel 2014.
4.2.4 Start-up motives
A distinction can be made between solo self-employment out of necessity and out of
opportunity. In the latter case, the individual started a business because he or she
saw a profitable business opportunity. In the former case, the person became self-
employed because of a lack of alternative employment options. De Vries et al. (2013b)
estimate the share of solo self-employment with a necessity motive to lie around 25
percent in the Netherlands. Turnover of these entrepreneurs is significantly lower than
for opportunity-based solo self-employed, yet on average annual turnover of necessity
entrepreneurs is still found to be sufficient to make a living, thereby contributing to
subsistence.
A specific group of necessity solo self-employed are the so-called dependent self-
employed, defined as self-employed workers who carry out the same tasks for their
client firm as they did before when they worked for the same firm as an employee.
0%
20%
40%
60%
80%
100%
Higher Medium Lower
46
Their job has not essentially changed but their employment protection is lower than
before when they were employees. The size of this group is likely to be small though
(Román et al., 2011).
4.3 The economic contributions of the solo self-employed
4.3.1 Contributions at the macro level
The main contribution of solo self-employed to the economy is their provision of labor
market flexibility, facilitating job mobility (SEO, 2010). They also provide flexibility to
large firms, enabling the latter to reduce the risk of worker downtime for (specialist)
workers whose skills are required only during parts of the year (Burke, 2011, 2012).
On average, the productivity of solo self-employed is not lower than that of employees
(SEO, 2010). The solo self-employed also contribute to innovations, not only by
themselves, but also innovations in the firms that hire their services (De Vries, 2011).
Quantitative macro-level research on solo self-employed is limited. One exception is
Van Stel et al. (2014) who find evidence for an equilibrium rate of solo self-
employment for a sample of OECD countries. Their results suggest that economies can
have fewer solo self-employed than economically desirable, indicating a lack of
flexibility, competition and dynamism, but also more solo self-employed than is good
for economic growth, indicating a lack of efficiency and exploitation of scale
economies.
4.3.2 Contributions at the micro level
When it comes to quantifying the contributions of the solo self-employed to economy
and society at the level of individuals, the literature focuses on well-being, income,
innovation, job creation and ambitions. Below, the contributions of solo self-employed
to each of these five outcomes will be discussed in turn.
4.3.3 Well-being
Several studies on (subjective) well-being make a comparison of job and life
satisfaction between self-employed individuals and wage workers. A consistent finding
in the economic literature is that self-employed workers have higher levels of job
satisfaction than employees (Bradley and Roberts 2004; Benz and Frey, 2004, 2008;
Blanchflower 2000; Blanchflower and Oswald 1998). The most important argument for
this is that self-employed have more autonomy and are better able to (re)define their
work (Millán et al. 2013a). They report greater job satisfaction with the type of work
because they experience more independence and flexibility, e.g. because they are
better able to combine work and care. On the other hand, job security is reported to
be lower for self-employed individuals compared to paid employees (Millán et al.
2013a). They have less social security than wage workers, hence the risk to fail
exceeds that of the risk that an employee becomes unemployed. Comparing solo self-
employed with employers does not reveal any significant differences in terms of job
satisfaction with the type of work. But in terms of job security, solo self-employed
experience substantial less job satisfaction than employers. A possible explanation is
that employers associate having at least some employees with better survival and
growth prospects of their firm (Millán et al. 2013a).
It is important to note that there may also be a self-selection bias in the job-
satisfaction of self-employed. Individuals with certain personality traits seem to thrive
under circumstances with high autonomy and being an own boss (Van den Born and
Van Witteloostuijn 2013). Thus their choice for working as solo self-employed seems
eminent and may result in higher subjective well-being.

47
The importance of subjective career success (in terms of career satisfaction) is
illustrated by Van den Born and Van Witteloostuijn (2013), who find that solo self-
employed (or freelancers as they coin them) continuously make trade-offs between
subjective and objective success factors in their career. Subjective career success is
most strongly determined by personality and motivational characteristics, while
objective career success (in terms of revenue) is most strongly determined by
external market factors.
4.3.4 Income
Solo self-employed can be driven by pecuniary and non-pecuniary motives. Using data
for paid employees, solo self-employed and employers in Germany in 2009, Sorgner et
al. (2014) show that, controlling for education level and other individual
characteristics, solo self-employment is associated with higher incomes than paid
employees for individuals with a university entrance degree (similar to a high school
diploma) but no further professional qualification, but with lower incomes for
individuals with a vocational or tertiary degree (i.e., higher education).
Individuals with higher education can better exploit their education in a position of
paid employee or self-employed with employees (employer). So, in general, highly
educated solo self-employed will not be driven by pecuniary motivations. Instead,
non-pecuniary motivations such as autonomy in the job are likely to play a role.
Individuals with a university entrance degree but no further education are likely to be
relatively intelligent but the lack of formal higher education makes it difficult for them
to earn a high income as a paid employee. Solo self-employment is then a better
option for this group. Sorgner et al. (2014) also show that for individuals with lower
education, there are no significant income differences between paid employees and
solo self-employed.
So, for higher educated solo self-employed, incomes are lower than what they could
earn as an employee while for lower educated individuals, incomes from solo self-
employment are similar to those from wage-work. For both these groups solo self-
employment thus contributes to subsistence, i.e., a way to make a living. Only for the
medium educated group (university entrance degree), solo self-employment actually
pays off in pecuniary terms, i.e., a higher income compared to wage-work.
Of course, for some (lower educated) solo self-employed, working as an employee
may not be a realistic labor market alternative as they miss the required human
capital. However, Sorgner et al. (2014) also show that it is mainly the higher qualified
labor market participants (those who were in the higher parts of the wage distribution
prior to becoming self-employed) who select into (solo) entrepreneurship. These
findings are in line with De Vries et al. (2013b) who show that even for solo self-
employed who started out of a necessity motive, earnings are still high enough to
make a living. They are also in line with De Vries and Dekker (2015) who show that
only a small fraction of the group of solo self-employed in the Netherlands is subject
to a precarious financial position.

48
4.3.5 Innovativeness
As the innovation process of solo self-employed is different from that of bigger firms,
not much empirical measurement has taken place yet regarding the innovativeness of
solo self-employed. The study by De Vries and Koster (2013) forms an exception.
They used survey panel data among solo self-employed and small and medium-sized
enterprises (SMEs) in the Netherlands over the period 2010-2013, and compare their
levels of innovativeness (table 4). They show that, by and large, solo self-employed
have the same shares of firms that report innovative output as SMEs. In particular,
they find that one out of four solo self-employed (SMEs) had engaged in some form of
product innovation over the last three years while one out of two solo self-employed
had engaged in some form of process innovation. The latter score was even slightly
higher than for SMEs. De Vries and Koster (2013) also find that the level of
innovativeness is higher among solo self-employed with a higher level of education.
Other determinants of innovative solo self-employment are previous entrepreneurial
experience, growth ambitions, firm age and sector. Achieving innovative outputs is
more common for solo self-employed workers who typically are involved in knowledge
exchange, innovative cooperation and those who are contracted for innovative
assignments in other firms.
table 4 Share of innovative solo self-employed compared to SMEs, 2010-2013
Solo self-employed SMEs
2010 2011 2013 2010 2011 2013
Product innovation
Total 23% 29% 28% 31% 25% 27%
Radical 11% - 14% 15% 13% 13%
Independent 17% - 19% 17% 15% 17%
Process innovation
Total 49% 51% 55% 45% 40% 43%
Independent 30% - 36% 20% 18% 18%
Source: De Vries and Koster (2013), based on Panteia/EIM’s zzp-panel.
This latter finding provides empirical evidence for an often overlooked role of solo
self-employment: a more indirect, enabling role of innovation (De Vries 2011; Burke
2012). By providing high levels of human and social capital (manifested in skills and
expertise), acquired by previous experience in paid jobs or from previous
assignments, solo self-employed can help accelerate innovative processes in other
organizations (Burke 2012; Van den Born and Van Witteloostuijn 2013). By being
involved in the innovation of others, solo self-employed are more prone to deliver
innovative outputs themselves. In the Netherlands approximately one out of three
innovating SMEs involves solo self-employed in their innovation processes (De Vries
2011). At the same time, one out of three solo self-employed declared to be
contracted by SMEs for innovation purposes in 2010 (De Vries and Vroonhof 2011).
4.3.6 Job creation
As by definition the solo self-employed work alone, job creation will not be the most
predicted outcome of their presence in the entrepreneurial ecosystem (see chapter 2
of this report). Still, some of them will take on personnel at some point, and thereby
turn into employer entrepreneurs.

49
Empirical literature on transitions from solo self-employed to employer entrepreneur is
limited. Nevertheless, Millán et al. (2015) provide an overview of determinants of
these transitions. Their most important conclusions are briefly summarized below.
First, both informal acquisition of entrepreneurial human capital and formal education
contribute positively to the probability that own-account workers (solo self-employed)
turn into employer entrepreneurs, i.e., that solo self-employed start employing
personnel. In this respect, informal acquisition of entrepreneurial human capital (e.g.
by previous entrepreneurship experience or experience obtained in the own firm) has
been found to be more important than formal education. Second, liquidity constraints
have been found to influence transitions from solo self-employed to employer,
emphasizing the importance of access to credit for solo self-employed. Third, stricter
employment protection has been found to have a negative impact on the probability of
switching from own-account worker to employer. As expected, stricter employment
protection is also found to lower the number of job dismissals, so that the net effect of
stricter employment protection is not so much a lower level of employment, but rather
a lower level of labour mobility in an economy (Millán et al., 2013b). This is a relevant
finding since higher labour mobility is associated with higher levels of knowledge
spillovers and productivity growth (Cooper 2001).
4.3.7 Ambit ions
De Vries et al. (2013a) investigate ambitions of solo self-employed individuals in the
Netherlands in 2012. Respondents were asked to indicate whether or not they
intended to contribute with their firm to a specific goal within the next five years.
Their answers were captured on a scale ranging from 1 “absolutely not” to 7
“absolutely” and all scores higher than 4 can be interpreted as the prevalence of
ambitions. Goals that they would like their firm to contribute varied from personal
ambitions such as personal development and making the contents of their work more
challenging to growth ambitions such as growth in turnover, personnel, market share
and exporting (see figure 11). In terms of prevalence, higher shares of solo self-
employed indicated to have personal and societal ambitions than growth ambitions
(figure 11). Over 80 percent intended to improve their work content with their firm,
while in contrast only three percent intended to hire staff within the next five years.
When asked if they ever see themselves as employers, a much higher rate of 18
percent indicates that it is conceivable for them to hire staff (Hoevenagel et al. 2015).
Apparently, a larger share has growth intentions that are not always translated into
growth expectations. Considering the importance, in terms of strong or no intentions,
De Vries et al. (2013a) find that personal ambitions are important ambitions of solo
self-employed (figure 11). However, the growth ambitions of the solo self-employed
are found to be considerably less important than their personal ambitions, particularly
when it comes to employing personnel (job creation) and engaging in export. Many
solo self-employed do have an ambition to grow their level of turnover and their
number of clients though.
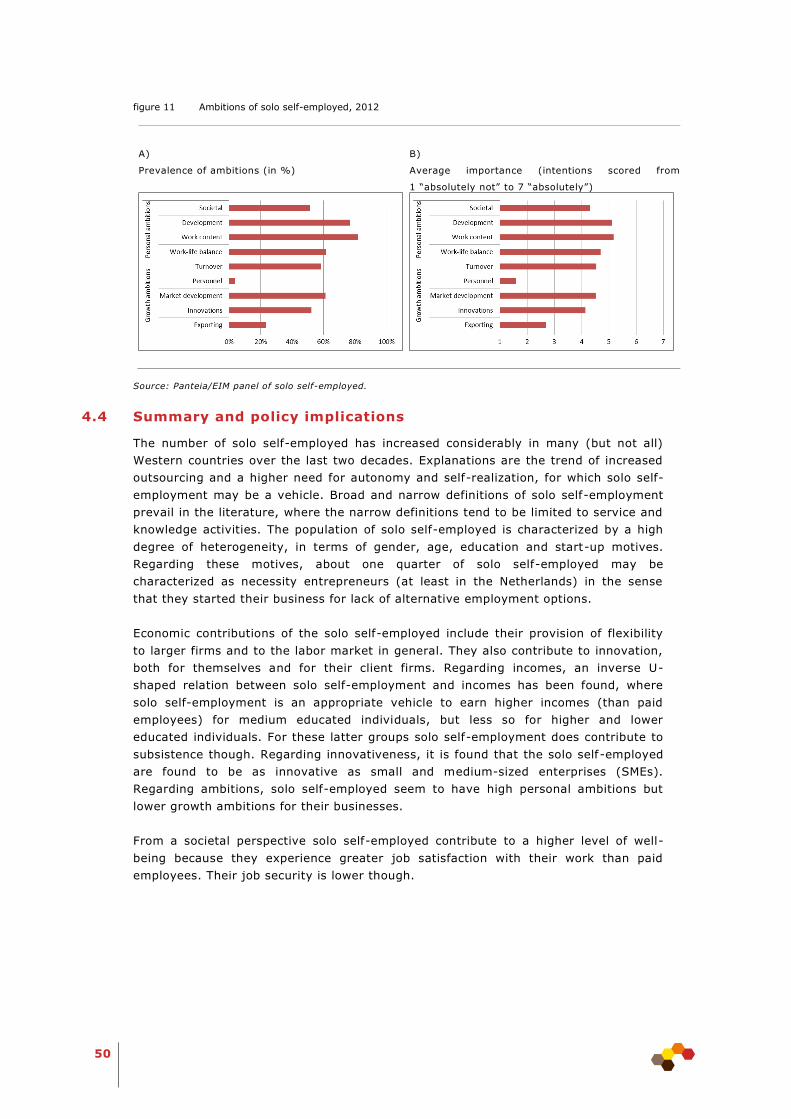
50
figure 11 Ambitions of solo self-employed, 2012
A)
Prevalence of ambitions (in %)
B)
Average importance (intentions scored from
1 “absolutely not” to 7 “absolutely”)
Source: Panteia/EIM panel of solo self-employed.
4.4 Summary and policy implications
The number of solo self-employed has increased considerably in many (but not all)
Western countries over the last two decades. Explanations are the trend of increased
outsourcing and a higher need for autonomy and self-realization, for which solo self-
employment may be a vehicle. Broad and narrow definitions of solo self-employment
prevail in the literature, where the narrow definitions tend to be limited to service and
knowledge activities. The population of solo self-employed is characterized by a high
degree of heterogeneity, in terms of gender, age, education and start-up motives.
Regarding these motives, about one quarter of solo self-employed may be
characterized as necessity entrepreneurs (at least in the Netherlands) in the sense
that they started their business for lack of alternative employment options.
Economic contributions of the solo self-employed include their provision of flexibility
to larger firms and to the labor market in general. They also contribute to innovation,
both for themselves and for their client firms. Regarding incomes, an inverse U-
shaped relation between solo self-employment and incomes has been found, where
solo self-employment is an appropriate vehicle to earn higher incomes (than paid
employees) for medium educated individuals, but less so for higher and lower
educated individuals. For these latter groups solo self-employment does contribute to
subsistence though. Regarding innovativeness, it is found that the solo self-employed
are found to be as innovative as small and medium-sized enterprises (SMEs).
Regarding ambitions, solo self-employed seem to have high personal ambitions but
lower growth ambitions for their businesses.
From a societal perspective solo self-employed contribute to a higher level of well-
being because they experience greater job satisfaction with their work than paid
employees. Their job security is lower though.

51
4.4.1 Policy implications
Macro-economic research has shown that there is an equilibrium rate of business
ownership and solo self-employment (Carree et al., 2002; Van Stel et al., 2014),
indicating that an economy can have fewer but also more (solo) self-employed than is
good for macro-economic performance, the latter case pointing at a lack of macro-
economic efficiency and exploitation of scale economies. When economies are having
relatively many solo self-employed, policy makers might consider two routes out of
solo self-employment (Van Stel et al., 2014). The first route is to stimulate solo self-
employed to become employers. The earlier-mentioned study by Sorgner et al. (2014)
suggests that this may be particularly beneficial (at least in a pecuniary sense) for
higher educated individuals, as they could earn more as an employer than as a solo
self-employed. Higher educated entrepreneurs may also create more jobs (Unger et
al., 2011). Finally, firm growth may also benefit well-being as job satisfaction in terms
of job security is greater for employees and employer entrepreneurs, compared to solo
self-employed. The second route is to stimulate solo self-employed to become
employee. This may be a feasible option for lower educated solo self-employed, as
their earnings as an employee are on average equal to those as a solo entrepreneur.
Another implication of our review is that, although there is considerable heterogeneity
among the group of solo self-employed, most of them start up from a relatively high
wage income (Sorgner et al., 2014). Furthermore, even among the necessity solo self -
employed, the majority is still able to make a living (De Vries et al. 2013b; De Vries
and Dekker, 2015). Hence, there does not seem to be much empirical evidence for the
sometimes-heard notion that solo self-employment is a form of hidden unemployment.
4.5 Literature
Blanchflower, D.G. (2000), Self-employment in OECD countries, Labour Economics, 7,
471-505.
Blanchflower, D.G. and A.J. Oswald (1998), What makes an entrepreneur?, Journal of
Labor Economics, 16(1), 26-60.
Benz, M. and B.S. Frey (2004), Being independent raises happiness at work, Swedish
Economic Policy Review, 11, 95-134.
Benz, M. and B.S. Frey (2008), Being independent is a great thing: subjective
evaluations of self-employment and hierarchy, Economica, 75(298), 362-383.
Bosch, N. and D. van Vuuren (2010), De heterogeniteit van zzp'ers, Economisch
Statistische Berichten, 95(4597), 682-684.
Burke, A. (2011), The entrepreneurship enabling role of freelancers: Theory with
evidence from the construction industry, International Review of
Entrepreneurship, 9(3), 1-28.
Burke, A. (2012), The role of freelancers in the 21st Century British economy, Report
commissioned by PCG, West Drayton, UK: PCG.
Bradley, D.E. and J.A. Roberts (2004), Self-employment and job satisfaction:
Investigating the role of self-efficacy, depression and seniority, Journal of Small
Business Management, 42(1), 37–58.
Carree, M., A. van Stel, R. Thurik and S. Wennekers (2002), Economic development
and business ownership: An analysis using data of 23 OECD countries in the
period 1976-1996, Small Business Economics, 19(3), 271-290.
Cooper, D.P. (2001), Innovation and reciprocal externalities: information transmission
via job mobility, Journal of Economic Behavior & Organization 45(4), 403–425.
De Vries, N. (2011), Smering voor de nering; zzp'ers als smeermiddel voor innovaties
in het MKB, EIM Publieksrapportage M201102, Zoetermeer: EIM.

52
De Vries, N. and S. Koster (2013), Determinants of innovative solo self-employment:
A regional approach, In: EIASM, ECSB and ISM: RENT XXVII conference
(Research in Entrepreneurship and Small Business), Book of abstracts, Vilnius:
ISM, p. 54.
De Vries, N. and F. Dekker (2015), Solo self-employed: The new precariat?
Determinants of a precarious financial position of solo self-employed, mimeo.
De Vries, N., A. Bruins and P. Vroonhof (2013a), Ambities en vermogens van zzp’ers.
Resultaten zzp-panel meting II van 2012. EIM Publieksrapportage A201320,
Zoetermeer: Panteia/EIM.
De Vries, N., W. Liebregts and A. van Stel (2013b), Explaining entrepreneurial
performance of solo self-employed from a motivational perspective, EIM Research
Report H201308, Zoetermeer: Panteia/EIM.
De Vries, N. and P. Vroonhof (2011), Ondernemen voor de toekomst. Innovatie en
pensioenen van zzp’ers: resultaten zzp-panel meting II, najaar 2010. EIM
Publieksrapportage A201107. Zoetermeer: EIM.
Hoevenagel, R., N. De Vries and P. Vroonhof (2015), Arbeidsmarktpositie van zzp’ers.
Zzp-panel: resultaten eerste meting 2014. Publieksrapportage A201435,
Zoetermeer: Panteia/EIM.
Lucas, R.E. (1978), On the size distribution of business firms, Bell Journal of
Economics 9(2), 508-523.
Maslow, A.H. (1970), Motivation and Personality, New York: Harper and Row.
Millán, J.M., J. Hessels, R. Thurik and R. Aguado (2013a), Determinants of job
satisfaction: A European comparison of self-employed and paid employees, Small
Business Economics, 40(3), 651-670.
Millán, A., J.M. Millán, C. Román, A. van Stel (2013b), How does employment
protection legislation influence hiring and firing decisions by the smallest firms?
Economics Letters 121(3), 444–448.
Millán, A., J.M. Millán, C. Román, and A. van Stel (2015), Determinants of the own-
account workers’ decision to hire employees: A review, International Review of
Entrepreneurship 13(2), 129-142.
Rapelli, S. (2012), European I-Pros: A Study, London, UK: Professional Contractors
Group Ltd.
Román, C., E. Congregado and J.M. Millán (2011), Dependent self-employment as a
way to evade employment protection legislation, Small Business Economics
37(3), 363-392.
Sorgner, A., M. Fritsch and A. Kritikos (2014), Do entrepreneurs really earn less?,
Jena Economic Research Papers # 2014-029, Jena, Germany: Friedrich Schiller
University and Max Planck Institute of Economics.
SEO (2010), Markt èn hiërarchie; kosten en baten van het zzp-schap [Market and
hierarchy; costs and benefits of solo self-employment], Amsterdam: SEO.
Unger J., A. Rauch, M. Frese and N. Rosenbusch (2011), Human capital and
entrepreneurial success: A meta-analytical review, Journal of Business Venturing
26(3), 341-358.
Van den Born, A. and A. van Witteloostuijn (2013), Drivers of freelance career
success. Journal of Organizational Behaviour, 34(1), 24-46.
Van Stel, A., S. Wennekers and G. Scholman (2014), Solo self-employed versus
employer entrepreneurs: Determinants and macro-economic effects in OECD
countries, Eurasian Business Review 4(1), 107-136.
Wennekers, S., A. van Stel, M. Carree and R. Thurik (2010), The relationship between
entrepreneurship and economic development: Is it U-shaped?, Foundations and
Trends in Entrepreneurship 6(3), 167-237.
53
5 Green entrepreneurs
Brigitte Hoogendoorn – Erasmus School of Economics, Erasmus University Rotterdam
5.1 Introduction
The 20th century is characterized by unprecedented economic growth and human
prosperity however progress was accompanied by, albeit unintended, severe damage
to the natural environment. Today, our society faces many environmental issues
including climate change, ozone decline, nuclear radiation, industrial toxins and
widespread air and water pollution. Few scientists today disagree with the notion that
humans are severely degrading many of earth’s ecosystems. While debate continues
on just how much human activities impact the environment (IPPC, 2007), industry is
often viewed as one of the largest contributors to environmental degradation (Cohen &
Winn, 2007). Contrary to the perception of business being a cause of our
environmental problems, a recent stream of literature perceives business and in
particular entrepreneurship as part of the solution: we refer to this stream as green
entrepreneurship (Cohen & Winn, 2007; York & Venkataraman, 2010; Hockert &
Wustenhagen, 2010).
The role of business in society and in particular their role towards the environment
differs over time and has been subject to changing circumstances (Bansal and
Hofmann, 2012; Van Marrewijk, 2003). In the 1970s it was assumed that society was
best served if organizations solely focused on increasing their profits (Garriga and
Melé, 2004). Environmental issues caused by firms required regulatory controls
serving as a means to correct and control undesirable corporate activity. During the
1980s and the 1990s a wide range of stakeholders started holding organizations
accountable for the social and ecological consequences of their activities. By taking
the claims of employees, customers, government activists, and media into account
environmentalism turned to an issue of strategic choice and decision-making, gaining
or retaining a license to operate. Currently we are moving into a phase characterized
by an increasing awareness of a firm’s responsibility to society as a whole: firms
depend upon society for their existence, continuity, and growth. Taking environmental
and social challenges seriously is not an act of public relations, media campaigns, or
other responsive actions to satisfy stakeholders, it is turning a necessity. Here is
where the role of green entrepreneurship is increasingly acknowledged.
With an increasing awareness of the threats that we are facing, it is realized that it is
not simply the responsibility of government or NGO’s to solve these problems.
Fundamental changes have to take place and we need all the creativity, passion, and
skills of all participants in society from big corporate firms to the small micro firms.
Hart & Milstein already predicted in 1999 “the emerging challenge of global
sustainability is a catalyst for a new round of creative destruction that offers
unprecedented opportunities” (p. 24). It is against this background that we explore
the role of the green entrepreneur in the transformation towards a more sustainable
society. We do so by first, explaining what green entrepreneurship is and how it is
different from related types of entrepreneurship. Next we will explore the prevalence
and the insights we have on the drivers of green entrepreneurship. Finally we will
discuss the role of the green entrepreneur in economy and society as well as policy
implications.

54
5.2 Defining green entrepreneurship
Increasingly, attention is devoted to the allocation of entrepreneurial effort with
different impact on society beyond economic growth and job creation. This is among
others reflected in the development of social, sustainable, and environmental
entrepreneurship. A first step to define environmental entrepreneurship or green
entrepreneurship is exploring its boundaries with these other types of
entrepreneurship i.e. social and sustainable entrepreneurship.
Three related areas of entrepreneurship
Characteristics that social, environmental, and sustainable entrepreneurship share are
at least threefold. First, akin to traditional entrepreneurs, social, sustainable and
green entrepreneurs are perceived as individuals who engage in the process of
discovery, evaluation, and exploitation of opportunities to create future goods and
services (Shane and Venkataramen, 2000). Second, these three areas of
entrepreneurship share a drive to intentionally create societal value. As such, an air of
optimism is associated with these three areas on how they can solve society’s most
pressing social and environmental challenges (Dean & McMullen, 2007; Hoogendoorn,
2011; Thompson, Kiefer & York, 2011). Third, all these areas of entrepreneurship are
still in a nascent stage of development which is reflected by conceptual ambiguity and
limited availability of data and consequently empirical studies.
Turning to the differences of these three areas of entrepreneurship, Thompson, Kiefer
& York (2011) summarize them as: “… social entrepreneurs focus mainly on problems
that affect people today, sustainable entrepreneurs focus on a ‘‘triple bottom line’’ of
people, planet, and profit, whereas environmental entrepreneurs are focused on
creating simultaneous economic and ecological benefit.” (p. 204). In addition, these
authors provide an overview comparing the three fields in terms of concepts,
questions, methodologies, and disciplinary roots. Combining the overview provided by
Thompson, Kiefer & York (2011) with even more recent literature reviews by Belz &
Binder (2014) and Bell & Stellingerwerf (2012) results in table 5.
table 5 Overview of three related areas of entrepreneurship research
Social
entrepreneurship
Sustainable
entrepreneurship
Green
entrepreneurship
Source of
opportunity
Exploiting
opportunities aimed at
creating positive social
benefits
Organizing along
sustainability principles.
Developing strategies to
meet sustainable laws and
goals.
Identifying
environmental
market failures as
opportunities
Main
disciplinary
Root
Nonprofit and
public sector
Sustainable
development
Environmental
economics
Methodologies Emphasis on qualitative
case studies and
interviews
Emphasis on qualitative
case studies and
interviews
Quantitative
analyses using
regressions

55
Social
entrepreneurship
Sustainable
entrepreneurship
Green
entrepreneurship
Objectives Placing a social
agenda before
financial goals
Putting economic, social
and environmental
objectives on equal
footing
Combining environmental
and economic goals
Examples Community-based
enterprises, nonprofit
organizations such as
work integration projects
for the long-term
unemployed, improving
sanitation in slum areas
Fair trade movement,
producing products out of
waste or recycled material
by people with a distant to
the labor market
Environmental friendly
production methods,
developing eco-friendly
products and services
such as solar panels,
hydrogen vehicles, and
organic foods
Source: adapted from Thompson, Kiefer & York (2011), Belz & Binder (2014), and Bell & Stellingerwerf
(2012).
What can be observed from table 5 is that there are several areas where these types
of entrepreneurs differ from one another in particular with respect to the objectives
pursued and the sources of opportunities. Social entrepreneurs are aiming to create
social value by addressing societal problems including access to healthcare, sanitation
and water in slum areas, reintegrating long-term unemployed, and revitalizing
deprived communities (Hoogendoorn, 2011). As such, the creation of social benefits
tends to dominate the generation of economic benefits. This may partly be explained
by the observation that the field of social entrepreneurship emerged from the non-
profit sector (Thompson, Kiefer & York, 2011). Balancing social and economic goals is
still a highly debated issue in social entrepreneurship literature (Hoogendoorn, Thurik,
Pennings, 2010). Environmental entrepreneurs are evidently more focused on the
protection of our natural environment or recovering our eco-systems (York &
Venkataraman, 2010). Its disciplinary roots being environmental economics in a for-
profit context results in environmental entrepreneurs being driven by the need for
environmental improvement or simply by opportunity recognition and financial profits.
Finally, sustainable entrepreneurship emerged from the international determination to
pursue sustainable development which refers to the development that “meets the
needs of current generations without compromising on the ability of future
generations to meet their own needs” (WCED 1987, p.43). Sustainable development
finds its expression in many activities such as changing consumer behavior
governmental decision making and entrepreneurship. More precisely, sustainable
entrepreneurship refers to business practice that puts economic, social and
environmental goals on equal footing (so-called ‘triple bottom line’ (Elkington, 1997 ).
According to Hockert & Wustenhagen (2010), sustainable entrepreneurship emerged
from the fields of social and environmental entrepreneurship.
Green entrepreneurship
Commonly used terms for green entrepreneurship are: ecopreneurship, eco-
entrepreneurship and environmental entrepreneurship. We claim that these terms
capture the same concept and can be used interchangeably. In the context of this
chapter, we will mainly make use of the term green entrepreneurship.
The study and practice of green entrepreneurship began to take-off in the early 1990’s
(Schaper, 2002; Bell & Stellingerwerf, 2012).

56
New and alternative life-styles, the introduction of environmental legislation across
countries, a growing importance of sustainable development including a ‘green
agenda’ and the perception that engaging in environmental activities serves as a
competitive advantage, are all assumed contributing to green start-ups: new ventures
with a strong concern for the environment.
The recent emergence of green entrepreneurship underlines the nascent stage of this
field. This is also reflected by the fact that currently a generally accepted definition of
green entrepreneurship does not exist (Lenox & York, 2011). However, some
definitions that have been put forward share certain characteristics. For example,
Dean and McMullen (2007) define green entrepreneurship as “the process of defining
and exploiting economic opportunities that are present in environmentally relevant
market failures” (p.53). In this same vein, Kotchen (2009,) defines green
entrepreneurship as "the practice of starting new businesses in response to an
identified opportunity to earn a profit and provide (minimise) a positive (negative)
environmental externality "(p.28). Finally, Walley and Taylor (2002) define green
entrepreneurship as “entrepreneurs who found new businesses based on the principle
of sustainability” (p. 37) and ecopreneurs are those entrepreneurs who start for-profit
businesses with strong underlying green values and who sell green products or
services”. Based on these definitions, we can distil that green entrepreneurship
entails… 1. … the process of how and with what effects opportunities to create future
goods and services are discovered, evaluated and exploited;
2. … market failures as source of opportunities
3. … for-profit enterprises combining environmental and economic value
creation;
The first of these characteristics is what green entrepreneurs share with traditional
entrepreneurs including the bearing of risk and being innovative. The latter two
characteristics are those that distinguish green entrepreneurs from their traditional
counterparts.
An important source of opportunities for green entrepreneurs is found in market
failures (Dean & McMullen, 2007; Cohen & Winn, 2007) such as the inefficient use of
resources and a lack of incentives to organize more efficiently. There is increasing
evidence that only a fraction of the potential efficiencies of the natural resources are
being used which offers ample opportunities for entrepreneurs to gain energy from
waste, and re-use and recycled of minerals and materials. An example is Back to the
Roots (https://www.backtotheroots.com), a firm founded on the idea of turning waste
into fresh, local food by growing gourmet mushrooms on recycled coffee grounds.
Another market failure serving as a source of opportunities is the existence of
information asymmetries. In perfect markets sellers and buyers have all possible
information and use this information to make rational choices. However, cognitive
limits, the existence of transaction costs, and uncertainty contribute to market
failures. Information not available to all agents serve as a source of opportunities. An
examples of informational green entrepreneurship is Eneco’s Toon® a thermostat that
provides consumers real time insight into their energy consumption and costs. These
imperfections remain until they are perceived by alert entrepreneurs who act upon
these opportunities and hence create value to society. The second distinguishing
characteristic, i.e. combining environmental and economic value creation, will be
discussed in the next sub-section.
57
Types of green entrepreneurs
The three characteristics as mentioned above provide a rather wide definition of green
entrepreneurship allowing for further classification. This could be interesting since
distinct drivers might be at play for different types of green entrepreneurs. Not
surprisingly, typologies of green entrepreneurs have been proposed (Linnanen, 2002;
Walley & Taylor, 2002). The dimensions along which we can distinguish between
different types of green entrepreneurs are as follows.
Drive: change the world or making money. Green entrepreneurship entails for-
profit enterprises combining environmental and economic value creation. This
excludes the not-for-profit sector (e.g. charities, environmental NGO’s and public-
sector organizations) (Walley & Taylor, 2002), however, this still allows for
differentiation among green entrepreneurs: they may pursue financial profit-
maximizing or -optimizing objectives. Put differently, green entrepreneurs may be
primarily focused on making money and grow their venture or they may thrive to
change the world and improve the quality of the environment at the expense of
economic objectives (Linnanen, 2002).
How: green or greening. Although there is no accepted definition of what is to be
considered environmental friendly and how to measure the net impact, ‘Green’ or
‘greening’ tends to be used in a sense of ‘moving towards environmental or ecological
sustainability’ (Walley & Taylor, 2002). As such, a green business can refer to a
venture that has been set up green from scratch or as a business that is becoming
relatively green during its life span. In this case, ‘relatively’ means relatively
compared to competitors’ greenness.
Type of activity: processes or product/services. We can distinguish between
green entrepreneurs that engage in environmental practices in their operational
processes and those entrepreneurs that apply environmental friendly technologies to
create green products and services. Examples of greening operational processes are
minimizing waste, saving on resources, recycling. Examples of offering green products
and services include organically produced products, eco-designed products, products
that allow switching to alternative energy such as solar panels and electric cars, and
new production methods based on ‘cradle-to-cradle’ or ‘circular economy’ principles
(Hoogendoorn et al. 2014; Mazucatto & Perez, 2014). Note that those entrepreneurs
that offer green products and services may or may not have environmental friendly
production processes.
Innovation: pattern breaking or incremental. Akin to discussions on the role of
traditional entrepreneurs (Hebert & Link, 1989), green entrepreneurs might be the
change agents initiating system-transforming and pattern breaking change by
introducing innovations to the market and herewith disrupting the current status quo
(‘Schumpeterian’ entrepreneurship) or they might be more of an imitative nature and
acting upon existing opportunities such as the presence of an eco-niche for fair trade
products.
With these different dimensions, various typologies or ideal typical green
entrepreneurs can be defined. We suggest that it is important to take these different
types into account when considering the role of entrepreneurs in the transformation
towards a more sustainable society: all types of green entrepreneurs are important
and serve the transformation process.
58
In addition, since empirical research is still scarce, and no consensus exists on the
definition of green entrepreneurship, these dimensions could serve to specify what is
meant by green entrepreneurship.
Next we will explore what is known about the incidence of green entrepreneurs and its
determinants.
5.3 Prevalence and determinants of green entrepreneurship
Prevalence
Data on the prevalence of green entrepreneurship across countries is scant. In
particular, studies that measure the incidence of ventures that start green from
scratch are, to the best of our knowledge, not available. The data from the Adult
Population Survey (APS) of the Global Entrepreneurship Monitor (GEM) might provide
a first indication.
All respondents who, at the time of survey, indicated to be trying to start a new
business or owning-managing an existing young business, were asked to allocate a
total of 100 points across three main categories of goals of his/her organization: the
generation of economic, social, and/or environmental goals. Choosing an (arbitrary)
cut-off point for points allocated to environmental goals by early-stage entrepreneurial
ventures may serve as an indication for green venture creation.
Descriptive statistics using the GEM 2009 APS (Bosma & Levie, 2011), defining green
entrepreneurs as those entrepreneurs that allocate at least 50 or more points out of a
possible 100 points to environmental goals provides the following picture13. Across the
55 countries participating in GEM 2009, on average 3.5% (unweighted) of all early-
stage entrepreneurs can be considered early-stage green entrepreneurs14 (i.e. 3.5% of
all entrepreneurs that are currently trying to start a new business or owning-
managing an existing business that is not more than 3.5 years old (Reynolds et al.,
2005)). No green entrepreneurs are found in Malaysia, Jordan, Yemen, Tonga and
West Bank & Gaza Strip. The highest percentages of early-stage green entrepreneurs
as a percentage of all early-stage entrepreneurs are found in South Africa (14%),
Croatia (13%), Belgium (12%) and Japan (12%). The number of early-stage green
entrepreneurs in the Netherlands is slightly above average (4%). These calculations
exclude those firms that are older than 3.5 years but started green from inception
nonetheless.
Moving from early-stage green entrepreneurs to greening businesses (i.e. a business
that is becoming relatively green during its life span), a study by Hoogendoorn et al.
(2014) provides insight on the incidence of greening businesses distinguishing
between types of greening activities. This study concludes that, based on a sample of
almost 8,000 SMEs across 36 countries15, on average, more than 90% of all SMEs are
to some extent engaged in greening their processes whereas on average less than one
third of SMEs (29%) offers green products and services (at least one percent of
annual turnover). Portugal and the United States with 100% of SMEs claiming to be
somehow involved in greening their processes, clearly stand out, together with high
percentages of no engagement in some Eastern and Southeastern European countries
such as Estonia (31%), Macedonia (29%), Romania (23%) and Lithuania (21%).
13 This cut-off point is arbitrary and in this context chosen intuitively assuming that allocating 50 points out of
100 to environmental goals implies addressing substantial importance to the green cause. 14 Note that the absolute numbers of green entrepreneurs for some countries are very low due to small sample
sizes. 15 Dataset used for this study: Flash Eurobarometer survey on “SMEs, resource efficiency and green markets”
(no. 342).

59
With respect to green products and services, 15% of all SMEs indicate to have more
than 10% of their turnover represented by green products and services. High
percentages are found in Northern European countries such as Norway (27%), Sweden
(22%) and Finland (17%). Low percentages, on the other hand, can again be
observed in some Eastern and Southeastern European countries such as Hungary
(1%), Croatia (7%), Macedonia (7%) Bulgaria (8%), Romania (10%), but also in
Portugal (4%) and Turkey (5%).
The averages for Dutch SMEs for greening processes and greening products and
service offerings are comparable to the average across all countries (93% and 16%
respectively). What is evident from this study is that the prevalence of greening
businesses differs across countries and that there is a sharp contrast in the
engagement of SMEs across different types of greening activities (Hoogendoorn et al.,
2014). Next we will explore what drives green entrepreneurship.
Table 6 provides an overview of the prevalence of different measures for green
entrepreneurship across countries.
table 6 Country average on the prevalence of three measures of green entrepreneurship
Percentage
early-stage
green
entrepreneurs16
Percentage of annual
turnover invested in
greening processes by
SMEs
Percentage of annual turnover
generated by green product/service
offerings by SMEs
0%
1%-
10%
11%-
100%
0%
1%-
10%
11%-
50%
51%-
100%
European Union:
Austria n.a. 4 90 6 63 12 15 10
Belgium 12 10 85 5 72 13 9 6
Bulgaria n.a. 15 78 8 75 17 3 5
Croatia 13 10 87 3 77 16 0 6
Cyprus n.a. 9 84 7 76 10 8 5
Czech Republic n.a. 8 89 3 78 10 5 6
Denmark 3 16 81 3 68 16 8 8
Estonia n.a. 31 67 1 81 7 3 9
Finland 5 4 91 5 67 16 8 9
France 5 3 95 1 71 16 11 2
Germany 4 7 88 5 61 21 12 6
Greece 5 15 80 5 66 11 5 17
Hungary 4 6 85 8 88 11 1 0
Ireland n.a. 2 97 1 58 21 8 13
Italy 4 6 87 7 67 16 8 9
Latvia 7 14 79 6 76 9 6 9
Lithuania n.a. 21 73 6 76 13 6 4
Luxembourg n.a. 7 90 3 71 14 13 2
Malta n.a. 15 81 4 89 1 6 4
Netherlands 4 6 82 11 72 11 7 9
Poland n.a. 8 84 8 67 17 7 9
16 The percentage of all early stage-entrepreneurs (i.e. entrepreneurs that are currently trying to start a new
business or owning-managing an existing business that is not more than 3.5 years old) that allocate at least
50 or more points to environmental goals out of a possible 100 points to be allocated across economic, social, and/or environmental goals of their firm.

60
Percentage
early-stage
green
entrepreneurs16
Percentage of annual
turnover invested in
greening processes by
SMEs
Percentage of annual turnover
generated by green product/service
offerings by SMEs
0%
1%-
10%
11%-
100%
0%
1%-
10%
11%-
50%
51%-
100%
Portugal n.a. 0 88 12 75 21 1 3
Romania 3 23 70 7 83 7 3 7
Slovakia n.a. 6 89 5 68 16 6 9
Slovenia 7 11 71 18 63 13 12 13
Spain 4 2 92 6 74 14 7 5
Sweden n.a. 6 85 9 65 13 17 5
United
Kingdom 6 2 93 5 66 17 5 12
Other
countries:
Iceland 7 11 87 1 72 16 6 7
Israel 3 13 75 12 70 17 4 9
Liechtenstein n.a. 8 89 3 71 15 4 10
Macedonia n.a. 29 62 8 80 13 1 6
Norway 5 5 91 4 53 20 17 10
Serbia 8 8 82 10 78 11 4 7
Turkey n.a. 8 67 25 85 10 4 1
United States 6 0 95 5 64 24 5 7
Total 3.5 17 9 84 7 71 14 7 7
Source ‘greening processes’ and ‘greening product and service offerings’: Flash Eurobarometer survey on “SMEs,
resource efficiency, and green markets” (no. 342), 2012.
Source ‘early-stage green entrepreneurs’: APS GEM, 2009.
Determinants
Several factors have been proposed and studied that may relate to the likelihood of
individuals to start a green venture or to green their business. These drivers can
eventually be traced back to four rationales for entrepreneurs/businesses to engage in
environmental issues (York & Venkataraman, 2010):
Governmental regulations and control; firms address environmental issues because
they have to due to environmental legislation;
Stakeholder action / activism; pressure from stakeholder groups or even
environmental activists pushes firms to change their operations;
Ethical motivation; often based on personal experience, ethical considerations of the
founder/manager facilitate the adoption of practices that are in the first place
beneficial to society and the environment and not necessarily contribute to a
healthy business case;
Competitive advantage; seizing opportunities related to environmental issues or
consumer demand for green products and services could serve as sources of
competitive advantage for firms.
17 Unweighted average for all 55 countries in the GEM 2009. Not all countries are included in the table.

61
The first two motivations (i.e. governmental regulations and stakeholder action) are
reactive by nature; firms have to take on environmental issues in their decision-
making processes and operations to guarantee a licence to operate (Halme & Laurila,
2009). The latter two (i.e. ethical motivations and competitive advantage) are pro-
active and reflect a voluntary drive or willingness of individuals or firms to address
environmental issues in their current firms or new ventures. In addition to the
distinction between reactive and proactive motives (Bianchi and Noci, 1998), these
motives suggest that factors at play relate to different levels of analysis. Ethical
motivation directly relates to the drive of owner-manager(s) and hence relates to the
micro level. On the contrary, governmental regulations and legislation relates to the
macro level.
This section will explore what we know about the drivers of green entrepreneurship
using three clusters of factors (Horbach et al. (2012)18: firm specific /technology
factors, market related factors, and regulations. Most of the studies explore the
drivers of eco-innovation or the greening of operational processes and product and
service offerings. The studies and determinants are summarized in table 7.
Firm level drivers. At firm level the following factors have been repeatedly
investigated that relate to greening businesses: firm size, organizational capabilities,
and perceived financial benefits.
First, firm size is found to positively relate to firms’ engagement in environmental
practices suggesting that larger firms are more likely to take on their societal
responsibility (Uhlaner et al, 2012; Bianchi& Noci, 1998; Perrini et al., 2007). This
finding is in line with the dominant view that small firms compared to their larger
counterparts are reluctant to invest in greening activities due to a presumed lack of
resources, small scale of production making additional investments hard to justify,
and a certain degree of anonymity making them less prone to pressure from media,
public and environmental activists. However, the study by Hoogendoorn et al. (2014)
suggests that size matters mainly for engagement in greening processes whereas
greening product and service offerings is largely independent of size. This latter
suggestion may relate to arguments that apply to smaller firms to justify R&D
expenditures on green product development: smaller firms are assumed to be more
innovative and alert to opportunities to serve an eco-niche without fear of
cannibalizing market share of current product offerings.
Second, organizational capabilities with respect to the environment such as resource
reduction, recycling, and pollution prevention are often developed by the
implementation of an Environmental Management System (EMS) (Kesidou & Demirel,
2012). Having an EMS in place (e.g. ISO 14001 and ISO 14064) is used as an
indication for organizational capabilities and seems to be positively related to
environmental engagement of firms (Horbach, 2008; Rennings et al. 2006; Rehfeld et
al. 2007; Wagner, 2007; Kesidou & Demirel). However, a positive relationship may
not be surprising because environmental practices need to be implemented to have
such a management system in the first place. So, having an EMS in place may well be
the result instead of a driver of engagement in environmental practices.
18 Horbach et al. (2008) describe the drivers of eco-innovation which they define as “… the production,
application or exploitation of a good, service, production process, organizational structure, or management
or business method that is novel to the firm or user and which results, throughout its life cycle, in a
reduction of environmental risk, pollution and the negative impacts of resource use (including energy use)
compared to relevant alternatives” (p. 113). Defined in this way, we argue that eco-innovation fits the definition of greening businesses.

62
Other organizational capabilities such as capability to innovate measured by R&D
investment and education of the employees are also positively associated with
greening businesses (Horbach, 2008; Del Rio et al, 2013).
Third, perceived financial benefits have been investigated as a potential driver for
engagement in greening activities. For example Uhlaner et al. (2012) argue that firm
behavior is based in part on perceived benefits of that behavior. Financial benefits
from waste reduction, alternative energy use and using recycled resources are
expected to stimulate greening activities. Indeed, several studies do observe a
positive relationship between perceived financial benefits and engagement in
environmental practices (Uhlaner et al., 2012; Kesidou & Demirel 2012; Horbach,
2008). However, Del Rio et al. (2013) do not find evidence for this particular driver.
Market drivers. A small number of empirical studies explore the influence of demand
factors on the extent to which firms are engaged in greening activities (Kesidou &
Demirel, 2012; Rehfeld et al., 2007; Horbach 2008). Market drivers such as demand
from consumers, public procurement and other firms are in particular relevant in the
diffusion phase of green products and services (Horbach, 2008). Preferences for
environmentally friendly products can be considered as a market driver. For example
Horbach (2008) suggests that expectations of increases in the turnover of a firm (i.e.
expected demand for green product and services), is an important driver of greening
in the case of German manufacturing firms. In addition, Kedidou & Demirel (2012)
indicate that demand factors affect the decision of firms to engage in greening
activities however, demand factors are not of influence on the level of investments.
Furthermore, Rehfeld et al. (2007) also suggest a positive relationship for demand
side factors, but they also claim that the effect of these factors is not very strong
since green or environmental friendly products are too expensive. In addition,
Hoogendoorn et al. (2014) find that firms that serve consumers are more likely to
engage in greening their products and services than firms that serve other companies.
A direct effect of customers seems to be absent in the case of greening processes.
This suggests that the effect of market drivers is different for different types of
environmental practices. This is in line with a suggestion by Rennings (2000) that
environmental product innovation is significantly driven by the strategic market
behavior of firms or market pull effect, whereas environmental process innovation is
more driven by other factors such as regulation.
Firm image can also be considered a market driver (Rennings, 2000); for example
firms in process-intensive industries are likely to face different environmental
challenges related to their reputation and image compared to firms in less process-
intensive industries. Firms in process-intensive sectors such as construction or
manufacturing face high levels of processing costs and cause substantial
environmental damage. Hence, firms in process-intensive sectors are more likely to be
closely monitored by primary and secondary stakeholder groups which may drive the
adoption of environmental strategies as compared to firms in less process-intensive
industries. Therefore, industry-specific characteristics may influence the greening
practices of firms. Two studies in particular show that the tangibility of a sector (i.e. a
sector’s use of natural resources as well as its potential to pol lute) indeed is positively
associated with the extent to which a firm is engaged in greening activities (Uhlaner
et al., 2012; Hoogendoorn et al., 2014).

63
Regulations. Legislative bodies influence environmental decision making by means of
stimulating firms to gain or retain their license to operate or to avoid penalties for
non-compliance (Halme and Laurila 2009). As such, there seems to be a strong
conviction that government intervention serves as an effective mechanism to drive the
greening of businesses. There are specific reasons why environmental regulation is
considered particularly important in the case of environmental degradation, as we will
see in the next section. Empirical firm-level studies on the effectiveness of
environmental regulations with respect to greening business activities, seem to point
in the same direction: more stringent environmental regulations stimulate
environmental engagement (Frondel et al., 2008; Del Rio et al., 2013; Rehfeld et al.,
2007; Horbach, 2008; Kesidou & Demirel, 2012). However, little is known about how
different types of environmental regulations may relate to different types of
environmental activities of firms. Environmental legislation can take many forms
including the installation of pollution standards to limit emission levels, putting a price
on the release of pollution or legislation on publically reporting pollution emission.
For example, Kesidou & Demirel (2012) suggest that higher levels of environmental
stringency may increase greening in less innovative firms that adopt reactive
strategies in order to retain their license to operate. In contrast, the effect of more
stringent regulations may not be as effective for more innovative firms that are
already complying with regulations. In addition, environmental legislation may not be
effective for all types of environmental practices as was suggested by Hoogendoorn et
al. (2014): stringency of environmental legislation is positively related to greening
products and services but not to greening operational processes. Finally, Baden et al.
(2009) indicate a counter intuitive effect of regulation: the ceiling effect. This effect
suggests that imposed regulations tend to result in lower level of greening standards
than firms would set for themselves in the absence of regulations.
table 7 Determinants of green entrepreneurship
Firm specific/technology Market factors Regulation
Firm size (+):
Bianchi and Noci 1998; Buysse and
Verbeke, 2003; Perrini et al.,
2007; De Marchi, 2012; Uhlaner et
al.,2012; Hoogendoorn et al.,
2014;
Demand pull (+):
Horbach, 2008; Rehfeld et al.
2007; Kesidou & Demirel,
(2012)
Environmental legislation
(+):
Brunnermeier & Cohen, 2003;
Del Rio et al, 2013;
Hoogendoorn et al, 2014;
Horbach, 2008; Frondel et al,
2008; Kesidou & Demirel, 2012;
Rehfeld et al, 2007
Organizational capabilities:
-EMS (+)
Horbach, 2008; Rennings et al.
2006; Rehfeld et al. 2007; Wagner,
2007; Kesidou and Demirel 2012;
Frondel et al., 2008 (n.s.)
-Technical capabilities (+)
Horbach, 2008; Del Rio et al.,2013
Sector tangibility (+):
Uhlaner et al. (2012);
Hoogendoorn et al. (2014)
Perceived financial benefits
(+):
Horbach, 2008; Uhlaner et al.,
2012; Kesidou & Demirel (2012)
Del Rio et al., 2013 (n.s.)

64
5.4 Economic and societal contributions
The roles of entrepreneurs in the transformation to a more sustainable
society
We started this chapter by describing the multitude of environmental issues that we
are currently facing and the potential role that entrepreneurs can play in a
transformation towards a more sustainable society. On the one hand, the
entrepreneur as agent of change may drive this process towards a more sustainable
society by introducing new products, services, production processes, and technologies.
On the other hand, the entrepreneur as business owner has a crucial role to play in
this process by lowering the environmental impact of its products and processes.
Green entrepreneurs as agents of change. One of the key roles of entrepreneurs
is to introduce new products and services, new technologies, and new ways of
organizing. In doing so, entrepreneurial behavior upsets the status quo for new
combinations or entirely new markets create disequilibrium (‘creative destruction’),
abolish existing processes and markets and replace them with new technological
regimes that create new opportunities (Schumpeter, 1942).
The first ones to emphasize this role of entrepreneurs in the context of sustainability
were Hart & Milstein (1999). Whereas traditionally sustainable development was seen
as a cost factor impeding competition, Hart & Milstein predicted that sustainable
development would be an important source for entrepreneurial opportunities. Green
entrepreneurs serve as the embodiment of change agents for a more sustainable
society. Bell and Stellingerwerf (2012) suggest that the role of green change agents
might be best fulfilled by start-up businesses or in this context the ‘green from scratch
ventures’.
Greening entrepreneurs as societal value creators. Not all (green) entrepreneurs
introduce pattern-breaking changes in a Schumpeterian sense. Those who are able to
upset the status quo are a rare breed. Entrepreneurs or business owners that engage
in environmental practices reduce the impact of their operations or products and
services on the environment. Hence, contrary to traditional entrepreneurs that only
generate societal value as a by-product of economic value, green entrepreneurs
intentionally create societal value; a laudable contribution that addresses the call of
policy makers to firms to lower the environmental impact of their products and
processes (European Commission, 2010). In particular the substantial impact of SMEs
on the natural environment, which accounts for 60–70 % of total pollution is
increasingly receiving policy makers’ attention (European Commission, 2010).
Societal role and policy implications
To fully understand the societal role of green entrepreneurs and the policy debate on
public intervention requires some understanding of specific characteristics of
environmental issues. First, we tend to use our natural resources such as fossil fuels
and our ecosystems as if they are inexhaustible whereas they may not regenerate
naturally or not for several generations. This makes how we use our scarce resources
and our ability to create alternative sources highly relevant and socially desirable.
Second, a lack of well-defined ownership rights with respect to our natural resources
hinders the adequate functioning of markets. For example, environmental resources
such a clean water and fresh air, owned by no one, can be used at zero cost, whereas
the actual cost of this use for society is certainly greater. As a result true costs are
not reflected in the price, which encourages economic agents to over use these
resources.

65
The beneficial environmental impact of environmental innovations makes their
diffusion socially desirable. However, entrepreneurs that want to invest in
environmental innovations are facing a severe obstacle: the double externality
problem. Environmental innovations produce two types of positive externalities: one in
the innovation phase and one in the diffusion phase. In the innovation phase, the
innovation may create positive spillovers to other firms that could improve the
innovation, apply it to other fields or create new technologies. These positive effects
are not fully appropriated by the firm making the investment. So even if the societal
gains can be substantial and desirable, the firm will underinvest in R&D compared to
the potential societal gains they could create. In the diffusion phase a second positive
externality occurs. Consuming environmental friendly products has a positive side
effect to society: a positive impact on the environment. However, this societal gain,
again, is not fully captured by the firm offering the green products and services.
Hence, environmental innovations are socially desirable since they have a positive
environmental impact, however, firms are reluctant since the private return on R&D
investment in environmental innovations is less than its social return. This market
failure justifies the needs of policy instruments (Rennings, 2000). For example, to
stimulate the level of innovation, providing subsidies for green innovations might
increase the level of innovation or tax on pollution may increase the incentive and
value of innovations in pollution reducing technologies.
What will be clear from these specific characteristics of environmental issues is that,
in contrast to regular innovations such as microelectronics, eco-innovations and the
diffusion of products and processes based on these innovations are normally not self-
enforcing (Rennings, 2000). Combined with the societal need to move in a more
sustainable direction, public intervention in the case of eco-innovation and in the case
of green entrepreneurship seems warranted.
5.5 Summary and policy implications
Green entrepreneurship fits recent attention devoted to the allocation of
entrepreneurial effort with different impacts on society. Contrary to traditional
entrepreneurs, green entrepreneurs intentionally aim to create environmental value in
the pursuit of profit. Green entrepreneurship entails ventures that have been set up
green from scratch as well as businesses that are becoming relatively green during
their life span. As such, green entrepreneurs are seen as agents of change, i.e. the
innovative force driving the process towards a more sustainable society, and as
conscious agents intentionally lowering the environmental impact of doing business.
The prevalence of green entrepreneurship differs across countries and across
measures for green entrepreneurship. Across the three measures for green
entrepreneurship as presented in this chapter (i.e. early-stage green entrepreneurs,
greening processes, and greening product and service offerings), the Netherlands
performs on par compared with the average across all countries. More specifically this
means that 92% of all Dutch SME’s claim that they are somehow engaged in activities
to green their operational processes and that 15% of all Dutch SME’s are offering
green products and services (more than ten percent of annual turnover). In addition,
4% of all early-stage entrepreneurs can be considered ‘green’.

66
When considering factors that might be conducive to the engagement of existing firms
in green activities such as eco-innovations, there is some evidence that firm size,
organizational capabilities in terms of the implementation of environmental
management systems and the capability to innovate, and perceived financial benefits
are all positively related. Also market demand, sector tangibility and stringency of
environmental legislation seem to be positively associated with firm’s engagement in
environmental activities.
The main contribution of green entrepreneurs is bringing necessary eco-innovations to
markets and lowering the impact of business on the environment, next to economic
growth and job creation. Market failures are an important source of opportunities.
Whereas markets in general function well to reach optimal use of scarce resources and
public intervention is only warranted for redistributing revenues, or when markets are
not fulfilling their role effectively, specific characteristics of our natural resources (i.e.
resources are exhaustible and lack of well-defined ownership rights) pose additional
challenges. The existence of the double externality problem in the innovation and
diffusion phase hinder the beneficial environmental impact of green entrepreneurs.
Not surprisingly, a strong call exists for a regulatory framework and environmental
policy to stimulate eco-innovation by green entrepreneurs. Even stronger, the
direction of a next wave of creative destruction is a chosen one, and can be
considered a socio-political choice. A better understanding of what drives green
entrepreneurs is, however, still warranted. Closing with the words of Jeffrey Sachs as
cited in Mazzucati & Perez (2014), we stress that the importance of green
entrepreneurs is important in the transformation towards a more sustainable society
but not sufficient:
“The good news is we are sitting on a complete revolution of technology that allows us
to move in a sustainable direction. That’s a matter of choice though. Markets alone
won’t take us there. We have to decide on planetary scale, we’re going for a
sustainable, green, inclusive economy.” (p. 13).
5.6 Literature
Baden, D. A., Harwood, I. A., & Woodward, D. G. (2009). The effect of buyer pressure
on suppliers in SMEs to demonstrate CSR practices: An added incentive or
counterproductive? European Management Journal, 27(6), 429–441.
Bansal, P. & Hoffman, A.J. (2012) The Oxford Handbook of Business and the Natural
Environment. Oxford: Oxford University Press.
Belz, F. M., & Binder, J. K. (2013). Sustainable Entrepreneurial Processes: An
Explorative Investigation. Available at SSRN 2336464.
Bell, J. & Stellingerwerf, J.J., Sustainable Entrepreneurship: The Motivations &
Challenges of Sustainable Entrepreneurs in the Renewable Energy Industry.
Master Thesis Jonkoping International Business School under supervision of L.
Achtenhagen.
Bianchi, R., & Noci, G. (1998). Greening SMEs’ competitiveness. Small Business
Economics, 11, 269–281.
Bosma, N., and Levie, J. (2010). Global Entrepreneurship Monitor - 2009 Executive
Report. Wellesley, MA/London: Babson College London Business School.
Brunnermeier, S. B., & Cohen, M. A. (2003). Determinants of environmental
innovation in US manufacturing industries. Journal of environmental economics
and management, 45(2), 278-293.
Buysse, K., & Verbeke, A. (2003). Proactive environmental strategies: A stakeholder
management perspective. Strategic Management Journal, 24(5), 453–470.
67
Cohen, B., & Winn, M. I. (2007). Market imperfections, opportunity and sustainable
entrepreneurship. Journal of Business Venturing, 22(1), 29-49.
De Marchi, V. (2012). Environmental innovation and R&D cooperation: Empirical
evidence from Spanish manufacturing firms. Research Policy, 41(3), 614-623.
Dean, T. J., & McMullen, J. S. (2007). Toward a theory of sustainable
entrepreneurship: Reducing environmental degradation through entrepreneurial
action. Journal of Business Venturing, 22(1), 50–76.
Del Río, P. Peñasco, C., & Romero-Jordán, D. (2013). Distinctive Features of
Environmental Innovators: An Econometric Analysis. Business Strategy and the
Environment. DOI: 10.1002/bse.1822
Elkington, J. (1997). Cannibals with forks: the triple bottom line of twenty first
century business. Capstone, Mankato, MN.
European Commission. (2010). SMEs and the Environment in the European Union.
Luxembourg: Publications Office of the European Union.
Frondel, M., Horbach, J., & Rennings, K. (2008). What triggers environmental
management and innovation? Empirical evidence for Germany. Ecological
Economics, 66(1), 153-160.
Garriga, E., & Melé, D. (2004). Corporate social responsibility theories: Mapping the
territory. Journal of Business Ethics, 53(1-2), 51-71.
Halme, M., & Laurila, J. (2009). Philanthropy, integration or innovation? Exploring the
financial and societal outcomes of different types of corporate responsibility.
Journal of Business Ethics, 84(3), 325–339.
Hart, S.L. & Milstein, M.B. (1999). Global sustainability and the creative destruction of
industries. Sloan Management Review, 41(1), 23-33.
Hébert, R. F., & Link, A. N. (1989). In search of the meaning of entrepreneurship.
Small Business Economics, 1(1), 39-49.
Hockerts, K., & Wüstenhagen, R. (2010). Greening Goliaths versus emerging Davids—
Theorizing about the role of incumbents and new entrants in sustainable
entrepreneurship. Journal of Business Venturing, 25(5), 481-492.
Hoogendoorn, B. (2011). Social entrepreneurship in the modern economy: Warm
glow, cold feet (No. EPS-2011-246-STR). Erasmus Research Institute of
Management (ERIM).
Hoogendoorn, B., Guerra, D. & Van der Zwan, P. (2014). What drives environmental
practices of SMEs? Small Business Economics. DOI :10.1007/s11187-014-9618-9.
Hoogendoorn, B., & Pennings, H. P. G., & Thurik, A.R. (2010). What do we know about
social entrepreneurship: an analysis of empirical research. International Review
of Entrepreneurship. 8(2).
Horbach, J. (2008). Determinants of environmental innovation—new evidence from
German panel data sources. Research Policy, 37(1), 163-173.
Horbach, J., Rammer, C., & Rennings, K. (2012). Determinants of eco-innovations by
type of environmental impact—The role of regulatory push/pull, technology push
and market pull. Ecological Economics, 78, 112-122.
IPPC (2007). Contribution of Working Group I to the Fourth Assessment Report of the
Intergovernmental Panel on Climate Change. Solomon, S., D. Qin, M. Manning, Z.
Chen, M. Marquis, K.B. Averyt, M. Tignor and H.L. Miller (eds.) Cambridge, UK:
Cambridge University Press.
Kesidou, E., & Demirel, P. (2012). On the drivers of eco-innovations: Empirical
evidence from the UK. Research Policy, 41(5), 862-870.
Kotchen, M. J. (2009). Some microeconomics of eco-entrepreneurship. In Gary D.
Libecap (Eds.), Frontiers in Eco-Entrepreneurship Research (Advances in the
Study of Entrepreneurship, Innovation & Economic Growth, Volume 20) (pp. 25-
37). Howard House, UK: Emerald Group Publishing Limited.

68
Lenox, M., & York, J. G. (2011). Environmental entrepreneurship. In: A. J. Hoffman &
T. Bansal (Eds), Oxford handbook of business and the environment. Oxford, UK:
Oxford University Press.
Linnanen, L. (2002). An insider’s experiences with environmental entrepreneurship.
Greener Management International, 38, 71-80.
Marrewijk, M. van (2003). Concepts and definitions of CSR and corporate
sustainability: Between agency and communion. Journal of Business Ethics, 44(2-
3), 95-105.
Mazzucato, M., Perez, C. (forthcoming). Innovation as growth policy: the challenge
for Europe. in Fagerberg, J., S. Laestadius and B. Martin (eds.) The Triple
Challenge: Europe in a New Age. Oxford, UK: Oxford University Press.
Perrini, F., Russo, A., & Tencati, A. (2007). CSR strategies of SMEs and large firms.
Evidence from Italy. Journal of Business Ethics, 74(3), 285–300.
Rehfeld, K. M., Rennings, K., & Ziegler, A. (2007). Integrated product policy and
environmental product innovations: an empirical analysis. Ecological Economics,
61(1), 91-100.
Rennings, K. (2000). Redefining innovation—eco-innovation research and the
contribution from ecological economics. Ecological economics, 32(2), 319-332.
Rennings, K., Ziegler, A., Ankele, K., & Hoffmann, E. (2006). The influence of different
characteristics of the EU environmental management and auditing scheme on
technical environmental innovations and economic performance. Ecological
Economics, 57(1), 45-59.
Reynolds PD, Bosma, N, Autio E, Hunt S, De Bono, N, Servais, I, et al. (2005) Global
Entrepreneurship Monitor: Data collection design and implementation 1998–2003.
Small Business Economics. 24(3): 205-231.
Schaper, M. (2002). The essence of eco-entrepreneurship. Greener Management
International, 38, 26-30.
Shane, S., & Venkataraman, S. (2000). The promise of entrepreneurship as a field of
research. Academy of Management Review, 25(1), 217–226.
Thompson, N., Kiefer, K., & York, J. G. (2011). Distinctions not Dichotomies:
Exploring Social, Sustainable, and Environmental Entrepreneurship. In G.T.
Lumpkin, & J. A. Katz (Eds.), Social and Sustainable Entrepreneurship (Advances
in Entrepreneurship, Firm Emergence and Growth, Volume 13), (pp. 201-220).
Howard House, UK: Emerald Group Publishing Limited.
Uhlaner, L. M., Berent-Braun, M. M., Jeurissen, R. J., & de Wit, G. (2012). Beyond
size: Predicting engagement in environmental management practices of Dutch
SMEs. Journal of Business Ethics, 109(4), 411–429.
Wagner, M. (2007). On the relationship between environmental management,
environmental innovation and patenting: Evidence from German manufacturing
firms. Research Policy, 36(10), 1587-1602.
Walley, E. E., & Taylor, D. W. (2002). Opportunists, Champions, Mavericks...?.
Greener Management International, 2002(38), 31-43.
WCED: World Commission on Environment and Development (1987). Our Common
Future (The Brundtlandt Report). New York, USA: Oxford University Press.
York, J.G., & Venkataraman, S. (2010). The entrepreneur-environment nexus:
Uncertainty, innovation, and allocation. Journal of Business Venturing, 25(5),
449–463.

69
6 Younger versus older entrepreneurs
Jan de Kok - Rotterdam Business School, Rotterdam University of Applied Sciences19
6.1 Introduction
This chapter is about young entrepreneurs as a specific type of entrepreneurship. It
appears straightforward to define this type of entrepreneurship: young entrepreneurs
are entrepreneurs of relatively young age. This definition does not tell us, however,
what is meant with ‘entrepreneur’ and what is meant with ‘young’. Regarding the
latter, the threshold used to demarcate the young (or youth) from the older part of
the population varies between countries and institutions (Green, 2013). For example,
Statistics Netherlands uses 25 as a threshold in its tables on young people. The EU
defines young people as being less than 30 years old (EU, 2009), a threshold also
used in a background study for the OECD on youth entrepreneurship (Green, 2013). In
the GEM youth report (Kew et al., 2013), a threshold of 35 is used, with a further
distinction between young youth (18 – 24 years) and the older youth (25 – 34 years).
Regarding entrepreneurs, it is customary to define entrepreneurs either as persons
that exhibit entrepreneurial behaviour (in particular, starting an enterprise) or as
persons that own and/or manage an enterprise. Common indicators for
entrepreneurial behaviour are nascent entrepreneurship, new entrepreneurs (owning
and managing a business that exists no longer than 3.5 years) and total
entrepreneurial activity (TEA), which is the sum of nascent and new entrepreneurship.
Another common indicator for entrepreneurial behaviour is the start-up rate.
To avoid a discussion on definitions, in this chapter we will discuss our current
understanding of the relationship between an individual’s age and entrepreneurship,
where entrepreneurship refers to entrepreneurial behaviour as well as business
ownership. We will return to the specific definition of ‘young entrepreneurs’ when we
discuss policy implications at the end of this chapter.
6.2 Prevalence and determinants of entrepreneurship across
different age groups
Prevalence of entrepreneurial behaviour across age groups
Most studies find an inverse u-shaped relationship between age and entrepreneurial
behaviour (Bönte et al., 2007, p. 2). This means that the probability that a person is
busy starting a new enterprise and/or recently started a new enterprise first increases
with age until it reaches a maximum, after which it decreases with age. The specific
age (group) at which this maximum occurs varies however between studies. For
example, Delmar and Davidsson (2000) find that in 1998, the nascent
entrepreneurship rate in Sweden was highest for the age group 25 - 30. Using a
European sample, Millán (2008) finds that the probability of entering self-employment
is highest around the age of 35. This applies to entering self-employment from paid
work as well as entering self-employment from unemployment. Van Stel et al. (2014)
find a similar result for a sample of developed economies20, where the TEA rate is
highest amongst people aged 25 to 45 (Van Stel et al., page 24). Within this broad
age group, the TEA rate is comparable for the age groups 25 – 34 and 35 – 44.
19 At the time of writing this chapter, the author was affiliated with Panteia/EIM. 20 Countries for which GDP/capita ≥ US$ 17.000.

70
In their analysis of the transition to self-employment in Britain, Georgellis et al.
(2005) find that the age effect (the effect of age on the probability of this transition,
in a model that controls for other variables as well) is the highest for people aged 48.
In Canada, however, the age effect is the highest for the youngest age group (15-24),
after which the age effect decreases monotonically with age (Lin et al., 2000).
For the Netherlands, the TEA rate reaches its maximum for the two age groups 25 –
34 and 35 – 44. Which of these groups has the highest TEA rate varies from year to
year. For example, in 2010 and 2013 the TEA rate seems to be the highest for the
people aged 25 – 34, while in 2012 the opposite occurs (in 2011 the difference is
relatively small) (figure 12). The TEA rate for the youngest age group (18 – 24) is
clearly lower than for the next two age groups.
figure 12 Total early-stage entrepreneurial activity (TEA) rate in the Netherlands, 2010-2013, by age group
TEA is the sum of nascent entrepreneurship and new entrepreneurs (owning and managing a business
that exists not more than 3.5 years)
Source: Van Stel et al. (2014).
In the Netherlands, the TEA rate almost doubled between 2006 and 2012 (from 5.4 to
10.3%), after which it slightly dropped to 9.3% in 2013. This general pattern also
applies to the age categories 35 – 44, 45 – 54 and 55 – 64, and with the exception of
2013 also to the youngest age group. The age group of 25 – 34 shows a different
development. However, findings from De Kok and Span (2014) suggest that over a
longer period, all age categories show a similar development. De Kok and Span (2014)
compare start-up rates in the Netherlands for 2002 and 2009 (where start-ups are
entrepreneurs that started an enterprise less than one year ago). They find that start -
up rates have increased across all age groups, and that they are the highest for the
age groups 25 – 35 and 35 – 45 (figure 13).
In sum, when entrepreneurship is defined as entrepreneurial behaviour (in particular
the process of starting and managing a new enterprise), the conclusion seems to be
that entrepreneurship is most prevalent amongst people aged 25 to 45.
6,9
11,3
7,6 6,8
3,4
7,4
9,9 9,3 9,0
4,9
7,4
11,8
13,7
11,9
5,2
7,6
13,1
10,6 10,0
4,4
0
5
10
15
18-24 25-34 35-44 45-54 55-64
2010 2011 2012 2013

71
Entrepreneurship is least prevalent amongst the youngest and oldest age groups
within the labour force21.
figure 13 Start-up rates by age group in the Netherlands, 2002 and 2009
Start-ups are people that own and/or manage an enterprise that they started less than one year ago.
Source: De Kok and Span (2014).
Prevalence of business ownership across age groups
When we define entrepreneurship as business ownership (i.e., counting entrepreneurs
in both new and incumbent firms), the age distribution of entrepreneurship seems to
shift to the right. The relationship between age and self-employment can also be
characterised as an inverse u-shaped relationship (Borjas and Bronars, 1989; Rees
and Shah, 1986), but the top of this graph occurs at a higher age (as compared to
entrepreneurial behaviour). For example, for Canada, Lin et al. (2000) found that the
age effect is strongest amongst people aged 35 – 44, while for entrepreneurial
behaviour the age effect was strongest for the youngest age group in their sample.
These authors report a maximum at the age of 45. This also applies for the
Netherlands: while the prevalence of entrepreneurial behaviour is highest for the age
groups 25 – 35 and 35 – 45, the prevalence of business ownership is the highest for
the age groups 35 – 45 and 45 - 55 (figure 14).
When entrepreneurship is measured as nascent or new enterprise, young
entrepreneurs are by definition involved in setting up their own enterprise. When
entrepreneurship is measured by business ownership rate, this is no longer the case.
Young entrepreneurs now also include young owner/managers of established
enterprises that have been created by other persons. In particular, this includes young
people who have succeeded family members in a family business.
21 The data on the TEA rate suggests that entrepreneurship is least common amongst the oldest age group,
while the data on start-ups suggests that entrepreneurship is least common amongst the youngest age
groups. A possible explanation for this difference is that the youngest age group is defined differently for
both statistics: while the statistics on the TEA rate use 18 as a lower bound, the statistics for the start-ups use 15 as a lower bound. It is likely that the TEA rate will be very low for people aged 15-18.
0,0
0,5
1,0
1,5
2,0
15 to 25 25 to 35 35 to 45 45 to 55 55 to 65
Sta
rt-
up
rate
(%
)
Age group
start-up rate by age group
2002 2009

72
Unfortunately, there is not much empirical evidence available on the number of people
that become entrepreneur by taking over an existing enterprise. There are some
indications, however, that this occurs relatively often. Based on a survey amongst
Dutch enterprises with 1-100 employees, De Kok et al. (2007) conclude that 41% of
the business owners had actually started their current enterprise, while 47% had
taken over the enterprise (12% is ‘other’).
The relationship with the age of the entrepreneur was not examined in this study, but
it seems reasonable to assume that the decision whether to start a new venture or
take over an existing enterprise is related to the age of the (potential) entrepreneur.
De Kok and Winnubst (2007) argue that the possibility of taking over an existing
enterprise may increase with age: while younger people have a longer time horizon
(which may stimulate them to start a new enterprise of their own), older people have
more experience and more financial possibilities (which increases their possibilities to
finance the takeover of an existing firm).
figure 14 Business ownership rates by age group in the Netherlands, 2002 and 2009
Source: De Kok and Span (2014).
An individual’s age as a determinant of entrepreneurship
The decision to become an entrepreneur is influenced by a combination of
environmental factors (e.g., sector, region, business cycle) and individual
characteristics. Individual characteristics that have been taken into account in
previous research include previous labour market status, risk attitude, attitudes
towards entrepreneurship, human and social capital, available financial capital, health
status and demographic factors such as gender, ethnic background, household
composition and age (Bates, 1995; Beugelsdijk and Noorderhaven, 2005; Davidsson
and Honig, 2003; Dunn and Holtz-Eakin, 2000; Hout and Rosen, 2000; Thurik et al.,
2008).
Many empirical studies into determinants of entrepreneurship include age of the
entrepreneur as one of their control variables (De Kok et al., 2010; Georgellis et
al.,2005; Lin et al., 2000). This is partly for pragmatic reasons (age is relatively easy
0
2
4
6
8
10
12
15 to 25 25 to 35 35 to 45 45 to 55 55 to 65
Bu
sin
ess o
wn
ersh
ip r
ate
(%
)
Age group
business ownership rate by age group
2002 2009

73
to establish, so this information is often available) but also because age is believed to
be an indicator of several important but not-so-easy to measure variables, such as
experience, objectives, innovativeness, motivation etc. In fact, any relationship
between age and entrepreneurship is likely to be an indirect one, where age affects
characteristics such as health status, availability of financial capital, relevant
experience, start-up motives and goals.
These characteristics may, in turn, affect decisions by the (nascent) entrepreneur. In
general, however, the mediation effect of age is not examined empirically.
Only a few studies explicitly examine the relationship between age, strategy and
motivation of entrepreneurs. De Kok, Ichou and Verheul (2010) find that
entrepreneurs who start at older age are less likely to work fulltime in their new
venture, are less willing to take risks and have a lower perception of their
entrepreneurial skills. Ruis and Scholman (2012) examine a sample of more than
1.600 Dutch business owners and find various differences between business owners of
different ages, but these differences are mostly relatively small and do not seem to
follow a specific pattern. Regarding the main objective of the entrepreneur, they find
that continuity is the most important objective for all age cohorts (other objectives
are growth, independence and making profit), but that the likelihood of reporting
‘continuity’ as the most important objective increases with age. Achieving growth is
only indicated as most important objective by a relatively small group of
entrepreneurs, and they find no support for the presence of a relationship with age.
Regarding the competitive strategy, they find that younger entrepreneurs more often
pursue an innovation or marketing strategy, while older entrepreneurs more often
tend to practice a price discounting strategy.
6.3 Economic and societal contributions of young entrepreneurs
The literature mentions several possible economic and societal contributions of young
entrepreneurs. For example, in the case of high levels of youth unemployment,
entrepreneurship may be a way for unemployed young people to gain income (an
example of necessity entrepreneurship). There are also some indications that young
entrepreneurs may be more innovative than older entrepreneurs, at least according to
their own opinion: young entrepreneurs in all regions of the world perceive
themselves, on average, to be more innovative than adults with respect to the extent
to which their product or service is new to some or all customers and where few or no
other businesses offer the same product (Kew et al., 2013, p. 8). Most of the studies
on the economic and societal contribution of young entrepreneurs, however, focus on
entrepreneurial age and job creation.
Job creation
Studies on the relationship between age and entrepreneurship have focused mainly on
the question to what extent age explains entry into self-employment (Curran and
Blackburn, 2001; Zissimopoulos and Karoly, 2007; Karoly and Zissimopoulos, 2004;
Singh and DeNoble, 2003). Few studies have related age of the entrepreneur to
employment creation and other measures of entrepreneurial performance.

74
The studies that investigate the relationship between age and employment creation
(Henley, 2005; Schutjens and Wever, 2000; Bosma et al., 2004; Cowling et al., 2004;
Stam et al., 2008) often include age as a control variable. These studies have
reported diverse findings. This ambiguity in results may be attributed to the fact that
researchers include different sets of independent variables in their analyses, which will
affect the reported 'direct' relationship between age and entrepreneurship.
Cowling et al. (2004) present a formal model where a risk-neutral individual is faced
with the choice between three labour market positions: paid employment, solo self-
employment or job-creating self-employment. This model assumes a single
simultaneous decision-making process, where the individual decides whether or not to
become entrepreneur and, if so, how many employees should be hired.
Others, however, point out that many individuals do not possess the necessary
cognitive abilities required to determine their labour market position within the
context of one single conscious decision. Instead, they assume a hierarchical decision
tree where the decision process is split up into several different decisions (Singh and
DeNoble, 2003). The choice to become an employer is only relevant for those that
have decided to become an entrepreneur.
Only a few studies investigated the extent to which age determines the entrepreneur's
choice to become an employer. These studies generally include similar independent
variables as the studies examining the determinants of the decision to become self-
employed. For example, Cowling et al. (2004) investigate determinants of self-
employment and employership and use the same set of explanatory variables in both
equations.
In terms of the relationship with age, different studies in this field have reached
different conclusions. For example, estimating a probit regression to explain whether
or not a sole proprietor hired any employees, Caroll et al. (2000) find that age has a
negative relationship with the decision to hire employees. Next to age, they include
the following independent variables: industry dummies, marital status and number of
dependents (children, parents, others). Cowling et al. (2004) also examine the choice
of an entrepreneur to become employer and find that the relationship with age is
different for women and men. For male entrepreneurs, they find an inverse u-shaped
effect, where the probability of being an employer is highest at the age of 41 (after
which it declines). For female entrepreneurs, they do not find a significant relationship
with age. Finally, Millán (2008) shows that the transition from own-account worker to
employer does not (directly) depend on age of the entrepreneur, but he finds a u-
shaped effect of years of experience, reaching a minimum at approximately 10 years
of experience. This suggests that there may be an indirect effect of age, through
experience, on employership.
Studies that include age as an explanatory variable tend to find a negative or inverse
U-shaped relationship between age of the entrepreneur and the level of employment.
Henley (2005) finds an inverse U-shaped relationship between the entrepreneur's age
and the number of employees, with the peak at 47.8 years old: "Ceteris paribus the
most successful job creators appear to be in middle age" (Henley, 2005, p. 190).
Similarly, Storey (1994, p. 146) finds evidence for an inverse U-shaped relationship
between the founder's age and employment after seven years, arguing that it is
"neither the very young nor the very old founders which are more likely to establish
new firms which will grow".

75
The support for this claim is, however, relatively weak: the relevant parameters are
statistically significant at a 10% confidence level rather than 5%. This common finding
may relate to the lower need of older individuals to earn additional income because,
generally, the costs of living (i.e., support burden, mortgage or interest on housing)
decrease with age (Davidsson, 1991). These costs may also be relatively low for
young people, becoming substantial in the 'middle-age' category. This would support
the inverse U-shaped relationship between age and employment that is sometimes
found. Furthermore, the lower need of individuals to earn additional income is
consistent with the lower growth ambition of older individuals as is reported in several
studies (Lau and Busenitz, 2001; Autio, 2005; Terjesen and Szerb, 2008).
Finally, we mention some studies that examine the relationship between age and
employment growth in young enterprises. Schutjens and Wever (2000) find no
evidence for a direct effect of age of the entrepreneur on employment growth in
companies younger than four years old. Using the same data set, but examining
employment growth during the first ten years of existence, Stam et al. (2008) arrive
at a different conclusion and report a negative direct effect of age on the likelihood of
employment growth. Davidsson (1991) also finds evidence for a negative effect of an
entrepreneur's age on employment growth. Focusing on fast-growing firms, Brüderl
and Preisendörfer (2000) find support for an inverse U-shaped relationship, where the
percentage of fast growing firms is highest for founders in their middle ages (after 10-
20 years of work experience).
De Kok, Ichou and Verheul (2010) find that the decision of entrepreneurs whether or
not to become an employer depends on other factors than the decision of employers
regarding the number of employees. A second conclusion is that age has a negative
relationship with the outcome of both decisions, but that these relationships are
completely mediated by the mediating variables included in their study. They find that
entrepreneurs who start at older age are less likely to work fulltime in their new
venture, are less willing to take risks and have a lower perception of their
entrepreneurial skills. Each of these factors has, in turn, a positive impact on the
probability of employing personnel. For the number of employees they find a negative
indirect effect of age through the effect of age on the perception of entrepreneurial
skills.
Firm survival
Studies about job creation focus on surviving enterprises. From a macro perspective,
it is equally relevant to examine if the age of the entrepreneur is related to the
probability of firm exit. There are indications that this is indeed the case. For example,
Lin et al. (2000) find that younger people are not only more likely to enter into self-
employment, but also to exit self-employment (controlling for the age of the
enterprise). This is one of their explanations for the fact that business ownership is
higher for elder age groups, even though start-up rates are lower.
Happiness
Using a representative sample of Dutch founders of new ventures, Carree and Verheul
(2012) do not find a statistically significant relation between various measures of
entrepreneurial satisfaction and the entrepreneur’s age.
76
6.4 Summary and policy implications
The prevalence of entrepreneurs running new and young businesses (‘entrepreneurial
behaviour’) is highest among the age category between 25-44 years while the
prevalence of entrepreneurs in incumbent businesses is highest among individuals
aged between 35-55 years. Hence, on average, higher-aged firms tend to be run by
higher aged entrepreneurs. Part of the explanation for the higher prevalence of
incumbent business ownership among older age groups (relative to the prevalence of
new and young businesses among older aged entrepreneurs) is the considerable
amount of business takeovers, which more often involve relatively older
entrepreneurs.
Regarding performance, the consensus in the literature seems to be that successful
job creators tend to be middle-aged. Moreover, firm survival seems to increase with
the age of the entrepreneur.
In the Netherlands, entrepreneurial behaviour is most prevalent amongst people aged
25 to 45. From this point of view, there does not seem to be a strong case for policies
to further stimulate entrepreneurial behaviour for this specific age group. The same
conclusion may be drawn from the perspective of job creation, since the most
successful job creators appear to be of middle age. To the extent that firm exit would
also be highest for younger age groups (as suggested by Lin et al., 2000), there might
be a case for specific policies to support young business owners (rather than
stimulating TEA), in order to reduce exit rates.
For the youngest age group (of people up to 25), a different picture emerges. For this
group, with its high levels of youth unemployment, various arguments have been
raised why youth entrepreneurship should be stimulated. These policies may also
include continued support during the first few years after the start, to reduce the risk
of firm exit.
Ageing of the workforce
During the past 60 years, the age structure of the Dutch population changed
considerably and it will change even further in the coming decades. One might expect
that these changes could affect the size and composition of the population of
entrepreneurs.
As De Kok and Span (2014) show, it is not likely that these changes in the age
composition of the workforce will affect the national start-up rates and business
ownership rates. It is likely, however, that the composition of the population of
entrepreneurs will change: if the age distribution of the workforce shifts to the right,
then the age distribution of the enterprise population will ceteris paribus also shift to
the right (implying a.o. an increase in the average age of entrepreneurs). The effects
of this changing composition on job creation may be limited, since the most successful
job creators appear to be in middle age. To the extent that younger entrepreneurs are
more innovative than older entrepreneurs (Kew et al., 2013), there might be an
impact on innovation though.

77
6.5 Literature
Autio, E., 2005, Global Entrepreneurship Monitor: 2005 Report on High-Expectation
Entrepreneurship, London: GEM.
Bates, T., 1995, Self-employment entry across industry groups, Journal of Business
Venturing 10 (2), 143-156.
Beugelsdijk, S. and N. Noorderhaven, 2005, Personality characteristics of self-
employed: an empirical study, Small Business Economics 24 (2), 159-167.
Borjas, G.J. and S.G. Bronars, 1989, Consumer discrimination and self-employment,
Journal of Political Economy 97 (2), 581-605.
Bosma, N.S., C.M. van Praag, A.R. Thurik and G. de Wit, 2004, The value of human
and social capital investments for the business performance of startups, Small
Business Economics 23(3), 227-236.
Bönte, W., O. Falck and S. Heblich, 2007, Demography and innovative
entrepreneurship, CESifo Working Paper 2115, Munich: CESifo.
Brüderl, J. and P. Preisendörfer, 2000, Fast growing businesses: Empirical evidence
from a German study, International Journal of Sociology 30 (3), 45-70.
Carree, M.A. and I. Verheul, 2012, What makes entrepreneurs happy? Determinants of
satisfaction among founders, Journal of Happiness Studies 13, 371-387.
Carroll, R., D. Holtz-Eakin, M. Rider and H.S. Rosen, 2000, Income taxes and
entrepreneurs' use of labor, Journal of Labor Economics 18 (2), 324-351.
Cowling, M., M. Taylor and P. Mitchell, 2004, Job creators, The Manchester School 72
(5), 601-617.
Curran, J. and R.A. Blackburn, 2001, Older people and the enterprise society: Age and
self-employment propensities, Work, Employment and Society 15 (4), 889-902.
Davidsson, P., 1991, Continued entrepreneurship: Ability, need, and opportunity as
determinants of small firm growth, Journal of Business Venturing 6 (6), 405-429.
Davidsson, P. and B. Honig, 2003, The role of social and human capital among nascent
entrepreneurs, Journal of Business Venturing 18 (3), 301-331.
De Kok, J.M.P., J. van der Sluis, and C.M. van Praag (2007), Dat loont!, EIM Report
A200704, Zoetermeer: EIM.
De Kok, J.M.P. and M.E. Winnubst (2007), De senior ondernemer in de zilveren
economie, EIM Report M200707, Zoetermeer: EIM.
De Kok, J.M.P., A. Ichou and I. Verheul (2010), New firm performance: does the age
of founders affect employment creation? EIM Research Report H201015,
Zoetermeer: Panteia.
De Kok, J.M.P. and T. Span (2014), Ageing and entrepreneurship across Dutch
regions, EIM Research Report H201409, Zoetermeer: Panteia.
Delmar, F. and P. Davidsson, 2000, Where do they come from? Prevalence and
characteristics of nascent entrepreneurs, Entrepreneurship and Regional
Development 12 (1), 1-23.
Dunn, T. and D. Holtz-Eakin, 2000, Financial capital, human capital, and the transition
to self-employment: evidence from intergenerational links, Journal of Labor
Economics 18 (2), 282-305.
EU, 2009, Youth in Europe, Luxembourg: Eurostat.
Georgellis, Y., Sessions, J.G. and N. Tsitsianis, 2005, Windfalls, wealth, and the
transition to self-employment, Small Business Economics 25 (5), 407-428.
Green, F. (2013), Youth entrepreneurship, Background paper for the OECD Centre for
Entrepreneurship, SMEs and Local Development, Paris: OECD.
http://www.oecd.org/cfe/leed/youth_bp_finalt.pdf
Henley, A. (2005), Job creation by the self-employed: the roles of entrepreneurial and
financial capital, Small Business Economics 25(2), 175-196.
78
Holtz-Eakin, D., Joulfaian, D. and H.S. Rosen, 1994, Entrepreneurial decisions and
liquidity constraints, Rand Journal of Economics 25 (2), 334-347.
Hout, M. and H. Rosen, 2000, Self-employment, family background, and race, Journal
of Human Resources 35 (4), 670-692
Karoly, L.A. and J. Zissimopoulos, 2004, Self-employment among older U.S. workers,
Monthly Labor Review, July 2004, 24-46.
Kew, J., M. Herrington, Y. Litovsky and H. Gale (2013), Generation entrepreneur? The
state of global youth entrepreneurship, paper published by Youth Business
International. http://www.gemconsortium.org/docs/download/2835
Lau, C. and L.W. Busenitz, L.W., 2001, Growth intentions of entrepreneurs in a
transitional economy. The people’s republic of China, Entrepreneurship Theory
and Practice 26 (1), 5-20.
Lin, Z., Picot, G. and J. Compton, 2000, The entry and exit dynamics of self-
employment in Canada, Small Business Economics 15 (2), 105-125.
Millán Tapia, J.M., 2008, Self-employment across the EU-15; a microeconometric
approach to its determinants and success, University of Huelva, Spain: doctoral
dissertation.
Parker, S.C., 2006, Entrepreneurship, self-employment and the labor market, in: M.
Casson, B. Yeung, A. Basu and N. Wadeson (eds), The Oxford Handbook of
Entrepreneurship, Oxford: Oxford University Press.
Praag, C.M. van, and J.S. Cramer, 2001, The roots of entrepreneurship and labour
demand, Economica 68 (269), 45-62.
Rees, H. and A. Shah, 1986, An empirical analysis of self-employment in the UK,
Journal of Applied Econometrics 1(1), 95-108.
Ruis, A. and G. Scholman, 2012, Ageing and entrepreneurship: an empirical study of
the relationship between entrepreneurial age and objectives, strategy and
performance, Research Report H201206, Zoetermeer: Panteia/EIM.
Schutjens, V.A.J.M. and E. Wever, 2000, Determinants of new firm success, Papers in
Regional Science 79 (2), 135-159.
Singh, G. and A. DeNoble, 2003, Early retirees as the next generation of
entrepreneurs, Entrepreneurship Theory and Practice 27 (3), 207-226.
Stam, E., P. Gibcus, J. Telussa and E. Garnsey, 2008, Employment growth of new
firms, in: Landström, H., H. Crijns, E. Laveren and D. Smallbone (eds),
Entrepreneurship, Sustainable Growth and Performance: Frontiers in European
Entrepreneurship Research, Cheltenham, UK: Edward Elgar.
Storey, D.J., 1994, New firm growth and bank financing, Small Business Economics 6,
139-150.
Terjesen, S. and L. Szerb, L., 2008, Dice thrown from the beginning? An empirical
investigation of determinants of firm level growth expectations, Estudios de
Economía 35 (2), 153-178.
Thurik, A.R., M.A. Carree, A. van Stel and D.B. Audretsch, 2008, Does self -
employment reduce unemployment? Journal of Business Venturing, 23 (6), 673-
686.
Van Stel, A., T. Span and J. Hessels, 2014, Global Entrepreneurship Monitor the
Netherlands 2013; National Report, Research Report H201407, Zoetermeer:
Panteia.
Weber, P. and M. Schaper, 2003, Understanding the grey entrepreneur: A review of
the literature, Paper presented at the 16th Annual Conference of the Small
Business and Enterprise Association of Australia and New Zealand, Ballarat, Sept
28-Oct 1, 2003.

79
Zissimopoulos, J.M. and L.A. Karoly, 2007, Transitions to self-employment at older
ages: The role of wealth, health, health insurance and other factors, Labour
Economics 14, 269-295.


81
7 Higher educated entrepreneurs
André van Stel – Kozminski University, Warsaw, Poland & Trinity College Dublin,
Ireland22
The present chapter deals with the contribution of higher educated entrepreneurs to
economy and society. First, we will discuss the prevalence of higher educated
entrepreneurs in the Netherlands, relative to other education levels and relative to
other countries. Second, we will discuss the contributions of higher educated
entrepreneurs to employment, innovation and happiness.
7.1 Prevalence
Figure 15 shows the education distribution in 2013 of those individuals who are in the
process of starting up a business (nascent entrepreneur) or are the owner-manager of
a business of less than 42 months old (young business entrepreneur), i.e., those
individuals who are classified by the Global Entrepreneurship Monitor (GEM) project as
belonging to the Total early-stage Entrepreneurial Activity (TEA) group. The result
that stands out is that the prevalence of entrepreneurial activity is especially high
among individuals with a graduate (university) degree. The prevalence rate (16.8%)
among this category is also high relative to other innovation-driven economies. Van
Stel, Span and Hessels (2014) suggest that the high prevalence rate may be related
to the increased attention for entrepreneurship in higher education programs in the
Netherlands in recent years (e.g., Niras Consultants et al., 2008, pp. 207-214; EIM
Business and Policy Research, 2012).
figure 15 Total early-stage Entrepreneurial Activity (TEA) in the Netherlands and innovation-driven
economies, 2013, percentage of a given subgroup by highest attained education level
Source: Global Entrepreneurship Monitor, calculations by Panteia.
22 At the time of writing this chapter, the author was affiliated with Panteia/EIM.
5,3
8,9
11,0
16,8
4,6
6,7
9,4
10,6
0 5 10 15 20
some secondary education
secondary education
post-secondary education
graduate education
Netherlands innovation-driven economies

82
7.2 Contributions
7.2.1 Contributions to employment creation
When it comes to labour market behaviour of higher educated individuals, two
separate trends can be observed. On the one hand, we observe increasing numbers of
entrepreneurs (including higher educated entrepreneurs) who operate on their own
(own-account workers or solo self-employed). On the other hand, for employer
entrepreneurs we observe a positive relation between education and firm size. This
suggests that higher educated entrepreneurs operate on the extremes of the firm size
distribution. One segment operates the smallest (one person) firms, whereas another
segment tends to run the largest firms. Both segments are discussed below.
Solo self-employed
According to Rapelli (2012), there were 23 million own-account workers in the EU-27
in 2011, of whom 8.6 million may be labelled ‘independent professionals (I-pros)’,
comprising the subgroup of own-account workers who are engaged “… in a service
activity and/or intellectual service not in the farming, craft or retail sectors” (Rapelli,
2012, p. 11). Of this latter group, 53% are higher educated, corresponding to some
4.5 million labour market participants in the EU-27. So, a considerable group of highly
educated individuals in Europe chooses to work on their own. It is likely that these
individuals particularly value the autonomy and freedom they have in their job (Van
der Zwan and Hessels, 2014). As explained in chapter 4, these highly educated solo
self-employed or freelancers contribute to the economy by providing flexibility to the
firms that hire their services.
The positive relation between education and firm size for employer entrepreneurs
An important finding in both theoretical and empirical literature is that higher
educated entrepreneurs tend to run firms of higher (employment) size. Lucas (1978)
develops a theoretical model where individuals differ with respect to their managerial
ability in entrepreneurship but are the same with respect to their productivity in wage-
employment. Individuals choose for entrepreneurship or wage-employment depending
on which occupational choice provides the highest income. In the model, individuals
with higher ability in entrepreneurship have lower marginal production costs which
enables them to exploit economies of scale if they choose the option of
entrepreneurship. Hence, individuals with higher ability levels are able to successfully
coordinate larger amounts of input factors in the production process, enabling them to
make higher profits by exploiting economies of scale. As a result, in the solution of the
model, only the individuals with the highest entrepreneurial ability levels select into
entrepreneurship, and those with higher ability levels run larger firms. Hence, in order
to exploit their high ability, entrepreneurs need to run large firms so that they can
benefit from scale advantages.
Lucas (1978) also provided an empirical exercise, which supported his prediction that
average firm size would continue to increase with economic development. In a recent
analysis for OECD countries, Congregado, Golpe and Van Stel (2014) confirmed that
“notwithstanding the rise of small-scale self-employment observed in many countries
over the last few decades, economies of scale and scope continue to play an important
role in advanced economies” (p. 452).

83
Although, as mentioned above, a proportion of higher educated entrepreneurs
nowadays chooses to become (and remain) solo self-employed, possibly out of
‘lifestyle’ and other non-pecuniary considerations, several empirical studies find that
higher educated entrepreneurs are associated with firms of higher (employment) size.
First, the meta-analysis study of Unger et al. (2011) on the relation between human
capital and entrepreneurial success finds that the relation is particularly strong for the
success indicator firm size, i.e., entrepreneurs with higher human capital levels run
larger firms.
Second, Van Praag, Van Witteloostuijn and Van der Sluis (2013), analysing a U.S.
panel, find that the returns to formal education are higher for entrepreneurs than for
employees. Moreover, Sorgner, Fritsch and Kritikos (2014), analysing a German panel,
show that self-employed with employees have higher earnings than solo self-
employed. Combining these results again suggests that higher educated entrepreneurs
are able to benefit from their education (in terms of income) by running larger firms.
Third, Van Praag and Van Stel (2013) formulate an extended Cobb-Douglas production
function at the macro level, incorporating the impact of business ownership and
tertiary education on macro-economic production. Estimating their model for 19 OECD
countries over the period 1981-2006, these authors find that the ‘optimal’ level of
business ownership, in terms of maximising macro-economic production, is a
decreasing function of the education level of the population. Their empirical result
suggests, in the spirit of Lucas (1978), that in countries with a higher educated
population fewer individuals choose for self-employment (business ownership), but
that those who do tend to be higher educated and run larger firms.
Fourth, Millán et al. (2014) argue that a higher educated population in a country can
increase the performance of entrepreneurs in that country not only directly (i.e.,
higher educated individuals becoming entrepreneurs), but also indirectly by providing
high-quality labour input to an entrepreneur’s business, or by acting as sophisticated
consumers creating a demand for innovative products from entrepreneurs. They show
that, controlling for individual characteristics of entrepreneurs, countries with a higher
educated populations indeed have better performing entrepreneurs.
7.2.2 Contributions to innovation
Figure 16 shows the percentages of early-stage (TEA) entrepreneurs in the
Netherlands in 2013 indicating that their product is ‘new to all customers’, ‘new to
some customers’, or ‘new to none of the customers’, where the first category is the
clearest indication that the entrepreneur’s product is innovative (according to the
entrepreneurs themselves). Van Stel, Span and Hessels (2014) show that, overall, the
degree of product innovation by Dutch early-stage entrepreneurs is comparable with
other innovation-driven economies. Figure 16 distinguishes between education levels.
The conclusion that may be drawn from this figure is that products offered by higher
educated entrepreneurs are hardly more innovative than products from lower
educated entrepreneurs, particularly when the category ‘new to all customers’ is
considered.
So, apparently the level of product innovation by higher educated entrepreneurs
hardly exceeds that of low or medium educated entrepreneurs. We offer two tentative
explanations, although more research is clearly needed on this topic.

84
First, it is possible that formal education has a negative impact on creativity, which is
needed for innovation. As Baumol (2004) puts it: “For example, the student who has
mastered a large body of the received mathematical literature, including theorems,
proofs and methods of calculation, may be led to think in conventional ways that can
be an obstacle to unorthodox approaches that favor creativity.” (p. 3). Second, it may
be that a firm’s employees, rather than the entrepreneur herself, need to be higher
educated in order to be able to innovate.
figure 16 Product innovativeness of early-stage entrepreneurs in the Netherlands, 2013, percentage of a
given subgroup by highest attained education level
Source: Global Entrepreneurship Monitor, calculations by Panteia
7.2.3 Contribution to happiness
Extant research suggests that among entrepreneurs, formal education negatively
influences entrepreneurial satisfaction. This is because expectations of higher
educated entrepreneurs are often higher, making it more difficult to meet their own
high expectations (Carree and Verheul, 2012). In addition, as opportunity costs for
higher educated people are higher, higher educated entrepreneurs are more likely to
regret foregone (employment) opportunities (Ferrante, 2009). Importantly, these
outcomes relate to formal education or general human capital. When specific human
capital is considered, e.g. experience with managerial tasks or the industry the
entrepreneur operates in, this may actually positively influence satisfaction levels as
the specific human capital helps to establish more realistic expectations. Using a data
sample of Dutch business founders, Carree and Verheul (2012) indeed find empirical
evidence supporting a negative association between general human capital and
entrepreneurial satisfaction levels, and a positive association between specific human
capital and entrepreneurial satisfaction levels.
7.3 Summary and policy implications
The present chapter showed that the prevalence rate of nascent and young business
entrepreneurs tends to increase with the education level of individuals. Moreover, it
was shown that the rate of entrepreneurship among individuals with university
education in 2013 was especially high in the Netherlands, relative to other innovation-
driven economies.
23
22
21
22
16
22
26
29
61
55
53
50
0% 25% 50% 75% 100%
some secondary education
secondary education
post-secondary education
graduate education
new to all customers new to some customers new to none of the customers

85
Regarding labour market behaviour of highly educated individuals, the analysis
suggested that higher educated entrepreneurs operate on the extremes of the firm
size distribution. One segment operates very small firms (solo self-employment),
whereas another segment tends to run the largest firms. Regarding the latter, many
empirical studies find that entrepreneurship by higher educated individuals is
associated with higher average firm size. Higher educated entrepreneurs have the
ability to coordinate larger amounts of input factors into the production process,
enabling them to run larger firms and to obtain higher returns. Hence, apart from the
considerable group of highly educated entrepreneurs who deliberately choose to work
on their own, the observation that average firm size for employer entrepreneurs
increases with a country’s level of education implies that fewer people will eventually
become (employer) entrepreneur and more people will end up working as a (high
quality) employee in an entrepreneurial firm. In simple terms, the implication is that
not everyone can become an (employer) entrepreneur. This has policy implications for
entrepreneurship education programs in institutions of higher educations. As Millán et
al. (2014) put it: “Programs of entrepreneurship education in institutions of higher
education should aim at reaching a broader audience. They should not only be
attractive to (the probably declining numbers of) future entrepreneurs, but also to the
increasing numbers of future employees in entrepreneurial firms. It is likely that for
many students the increased entrepreneurial skills resulting from entrepreneurship
curricula will be beneficial in their career in the wage sector, where entrepreneurial
employees (i.e., intrapreneurs) form an ever more important asset of successful firms
(Bosma et al., 2010).” (p. 627). Another policy implication of the current chapter is
that it may be worthwhile to distinguish between solo self-employment and employer
entrepreneurship in entrepreneurship education programs, as these two forms of
entrepreneurship require different skills and attitudes, and highly educated individuals
with entrepreneurship ambitions seem to deliberately choose for either one form or
the other.
Regarding product innovation, it was found that 51% of Dutch higher educated early-
stage entrepreneurs indicate that their product was ‘new to all customers’ or ‘new to
some customers’. This percentage is only marginally higher than for entrepreneurs
with lower levels of education. More research is needed to explain this finding.
Finally, regarding happiness, it was found that general human capital obtained
through formal education may lead to (unrealistically) high expectations, which may
not always be met in practice. This, in turn, may contribute negatively to
entrepreneurial satisfaction. On the other hand, specific human capital directly related
to the operation of the business may positively contribute to satisfaction levels of
entrepreneurs.
7.4 Literature
Baumol, W.J. (2004), Education for innovation: Entrepreneurial breakthroughs vs.
corporate incremental improvements, NBER Working Paper 10578, Cambridge,
MA: National Bureau of Economic Research.
Bosma, N., Stam, E. and Wennekers, S. (2010), Intrapreneurship – An international
study, EIM Research Report H201005, Zoetermeer: Panteia/EIM.
Carree, M.A. and Verheul, I. (2012), What makes entrepreneurs happy? Determinants
of satisfaction among founders, Journal of Happiness Studies 13, 371-387.
Congregado, E., Golpe, A. and Van Stel, A. (2014), The role of scale economies in
determining firm size in modern economies, The Annals of Regional Science 52
(2), 431-455.

86
EIM Business and Policy Research (2012), Effects and impact of entrepreneurship
programmes in higher education, Report commissioned by the European
Commission.
Ferrante, F. (2009), Education, aspirations and life satisfaction, Kyklos 62(4), 542-
562.
Lucas, R.E. (1978), On the size distribution of business firms, Bell Journal of
Economics 9(2), 508-523.
Millán, J.M., Congregado, E., Román, C., Van Praag, C.M. and Van Stel, A. (2014), The
value of an educated population for an individual’s entrepreneurship success,
Journal of Business Venturing 29 (5), 612-632.
Niras Consultants, FORA and ECON Pöyry (2008), Survey of entrepreneurship
education in higher education in Europe; Appendix B: Good-practice examples,
Report commissioned by the European Commission.
Rapelli, S. (2012), European I-Pros: A Study, London, UK: Professional Contractors
Group Ltd.
Sorgner, A., Fritsch, M. and Kritikos, A. (2014), Do entrepreneurs really earn less?,
Jena Economic Research Papers # 2014-029, Jena, Germany: Friedrich Schiller
University and Max Planck Institute of Economics.
Unger, J., Rauch, A., Frese, M. and Rosenbusch, N. (2011), Human capital and
entrepreneurial success: A meta-analytical review, Journal of Business
Venturing 26(3), 341-358.
Van Praag, C.M. and Van Stel, A. (2013), The more business owners, the merrier? The
role of tertiary education, Small Business Economics 41 (2), 335-357.
Van Praag, C.M., Van Witteloostuijn, A., and Van der Sluis, J. (2013), The higher
returns to formal education for entrepreneurs versus employees, Small Business
Economics, 40, 375-396.
Van Stel, A., Span, T. and Hessels, J. (2014), Global Entrepreneurship Monitor 2013
the Netherlands, EIM Research Report H201407.
Van der Zwan, P., and Hessels, J. (2014), Ondernemerschap en geluk, In: SMO, Het
rendement van geluk; Inzichten uit wetenschap en praktijk, Den Haag: Stichting
Maatschappij en Onderneming, blz. 73-85.

87
8 Women entrepreneurs
Amber van der Graaf and Jacqueline Snijders - Panteia
8.1 Introduction
This chapter focuses on women entrepreneurs and their position in the
entrepreneurship ecosystem. Where possible the Dutch situation is presented in a
European context. The goal is to come to a deeper understanding of which dynamics
are at work when it comes to women entrepreneurship and their impact on both the
economy and society.
8.2 Prevalence, characteristics, and determinants of women
entrepreneurship
8.2.1 Prevalence
Number and proportion of women entrepreneurs
In 2012, 424,000 women entrepreneurs were active in the Netherlands and this
amounted to 34% of the total entrepreneurs23. In the European Union (EU-28) around
31% of the entrepreneurs were women (10.3 million) and these percentages varied
considerably between countries; Latvia (40%), Lithuania (40%) and Luxembourg
(39%) had the highest percentages of women entrepreneurs, while Malta (18%) and
Ireland (20%) had the lowest. The Netherlands ranks 7 th in the percentages of female
entrepreneurs in Europe.
TEA rate
The Total Early-stage Entrepreneurial Activity (TEA) rate is defined as the percentage
of adult population that is actively involved in starting a new business or who own and
operate a business of less than 3.5 years old. In 2013, this was 11.7 for men in the
Netherlands and 6.8 for women. See figure 17.
23 Panteia, Statistical Data on Women Entrepreneurs in Europe, prepared for the European Commission, DG
Enterprise and Industry, September 2014. Entrepreneurs are defined as persons aged 15 years and older
who work in their own business, farm or professional practice to make a profit, and spend time on the
operation of a business, or are in the process of setting up a business. These entrepreneurs consider the
running of their enterprises to be their main activity. This definition is the same as the definition of a self-
employed person in the Labour Force Survey (LSF) database of Eurostat and Panteia, Monitor vrouwelijk en
etnisch ondernemerschap 2013. In this study entrepreneurs are defined as persons with income from their enterprise and persons with income as director with a majority share holding.

88
figure 17 Total Early-stage Entrepreneurial Activity (TEA) rate in the Netherlands and innovation-driven
economies, 2013, percentage of adult population by gender
Source: Global Entrepreneurship Monitor, calculations by Panteia, 2014
Entrepreneurship rate
Next to the TEA, the entrepreneurship rate is a good indicator for comparing the
entrepreneurial level of women and men in and between countries. The
entrepreneurship rate expresses the percentage of entrepreneurs in the total active
labour force. In contrast to the TEA, which emphasises entrepreneurial activity in new
and young businesses, the entrepreneurship rate is an indicator for entrepreneurial
activity in incumbent businesses.
In 2012, the women entrepreneurship rate in the Netherlands was 11%, compared to
10% in EU-28. Of the EU countries, the Netherlands ranked 9th. The top five EU
countries with the highest women entrepreneurships rates were Greece, Portugal,
Italy, Croatia and Poland. The countries with the lowest rates were Estonia, Denmark,
and Sweden. See figure 18.
In the period 2003-2012, the women entrepreneurship rate in the Netherlands
increased from 8% to 11% while the EU rate remained at 10%. The men
entrepreneurship rate in the Netherlands increased from 13% to 18% (where the EU
percentage remained at 19%)
11,7
6,8
10,1
5,7
0 5 10 15
male
female
Netherlands innovation-driven economies
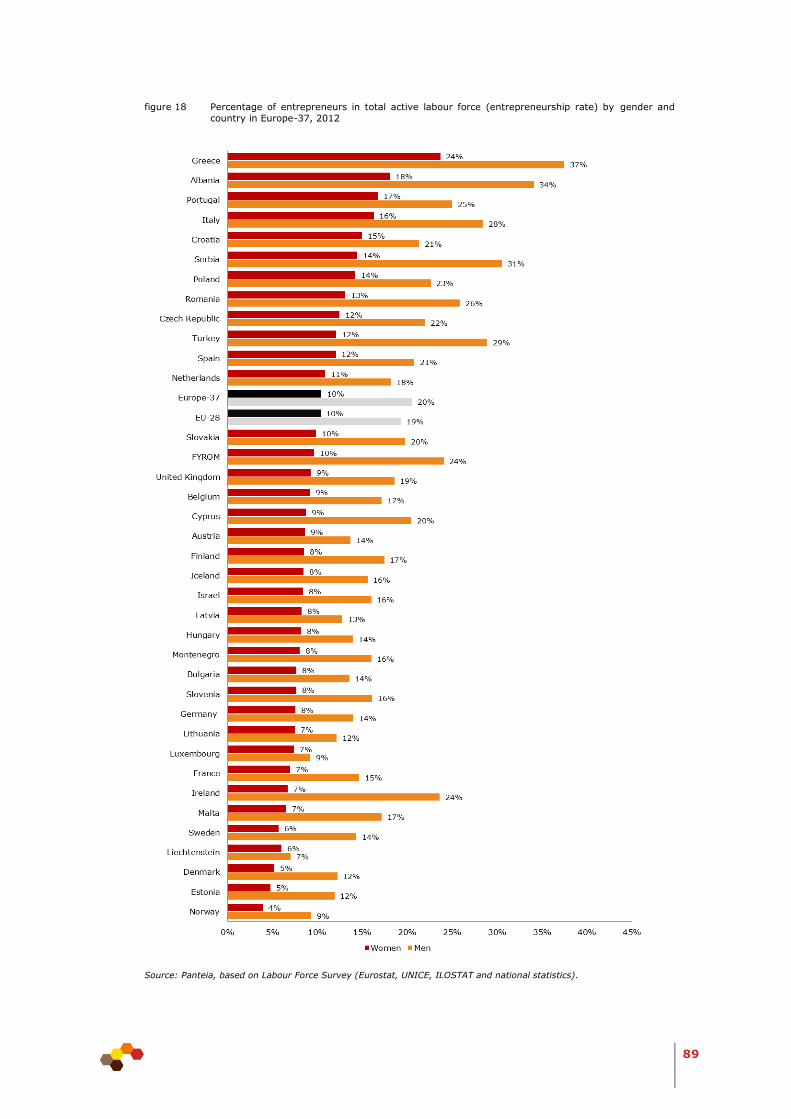
89
figure 18 Percentage of entrepreneurs in total active labour force (entrepreneurship rate) by gender and
country in Europe-37, 2012
Source: Panteia, based on Labour Force Survey (Eurostat, UNICE, ILOSTAT and national statistics).

90
Women entrepreneurs per sector
In 2011, the highest proportions of women entrepreneurs out of the total number of
entrepreneurs in a sector, were to be found in the three sector groups of other service
activities, human health and social work activities, and education. The lowest
proportions were in construction, financial and insurance services, and transportation
and storage. See figure 19 This distribution is similar for EU-28 in total.
figure 19 Percentage of women entrepreneurs of total number of entrepreneurs, by sector in the Netherlands, 2011
Source: Panteia, based on Labour Force Survey Eurostat and Netherlands Statistics
Note: missing bars means data not available
8.2.2 Characterist ics
Age of the entrepreneurs
In the Netherlands, women entrepreneurs are on average slightly younger than men
entrepreneurs. In 2012, slightly more than half (56%) of the women entrepreneurs
were between 25 and 49 years of age. Around 5% were between 15 and 24 years and
6% were older than 65 years. In 2003, the proportion of women entrepreneurs in the
age group 25-49 years was higher and the proportions in the groups of 50-64.

91
The proportion in the group 65 years or over was slightly lower, meaning that women
entrepreneurs had slightly increased in age. The distribution over the age classes was
comparable with the EU-28 distribution. See figure 20.
figure 20 Percentage entrepreneurs by gender and age in the Netherlands and EU-28, 2003 and 2012
Source: Panteia based on Labour Force Survey Eurostat
Education level of the entrepreneurs
The average education level of women entrepreneurs in the Netherlands is higher than
that of men entrepreneurs. In 2012, the proportion of women entrepreneurs with a
high education level was higher than that of men entrepreneurs and the proportions of
women in the middle and low education levels were lower. Women entrepreneurs in
the Netherlands were more highly educated compared to the total EU levels. See
figure 21.
figure 21 Percentage of entrepreneurs by gender and education in the Netherlands and EU-28, 2003 and 2012
Source: Panteia based on Labour Force Survey Eurostat
Note: Low refers to ISCED levels 0-2, middle to ISCED 3-4 and high to ISCED levels 5-6

92
Motivations to start an enterprise
There is little recent literature available on the motivation of Dutch women
entrepreneurs to start their enterprise. Based on international studies, which we
consider relevant for the Netherlands as well, the main motivations are:
Work-life balance: entrepreneurship provides the opportunity to better balance
work and private life.
Income: the prospect of making extra money has been listed as a common reason
for going into entrepreneurship24.
Personal development and acquisition of new skills:25 this includes helping the
community or gaining more work satisfaction. Compared to men, there is a
stronger tendency amongst women to start an enterprises for more personal rather
than monetary reasons.26
Attitudes and approaches
Though many motivations and character attributes for men and women entrepreneurs
are very similar, there are notable differences which influence women
entrepreneurship.27 Some of these key differences we present here.
Risk of failure: women early stage entrepreneurs have on average a higher fear of
failure than men and are therefore less inclined to start an enterprise.28
Calculated Risk: connected to this is the fact that women tend to take more calculated
risks in many areas of life. Women tend to perceive more risk in a variety of
situations29. The 2009 Eurobarometer indicates that 40% of European women,
compared to 28% of men were reported to be risk averse.30 While the evidence that
women approach risk in a more calculated manner is well documented, evidence as to
the explanations for this are not.31
Self-confidence: women tend to have different socialisation experiences than men and
as a result, tend to have different perceptions and expectations of their personal
capabilities, and consequently of their professional potential. This in turns influences
the expectations which they have for themselves from their professional life, including
in entrepreneurship specifically.32 Self-confidence towards starting an enterprise is based on several factors. At the
individual level human capital and professional networks especially influence to what
extent entrepreneurs feel they are prepared and skilled enough to start and run a
business33.
24 Overall, approximately one-half of women-led enterprises in the EU cited this factor as motivation for
starting a business. This is approximately 10 percentage points higher than for men-led enterprises.
OECD/European Union, The Missing Entrepreneurs – Policies for Inclusive Entrepreneurship in Europe, 2013, OECD. And: The profile of the successful entrepreneur: results of the survey ‘Factors of business success’’,
Eurostat statistics in focus, 29/2006. 25 Arenius, P. & Kovalainen, A., Similarities and Differences Across the Factors Associated with Women’s Self-
employment Preference in the Nordic Countries, International Small Business Journal, Vol. 24(1), 2006, pp
31 – 59 26 Piacentini, M., Women Entrepreneurs in the OECD: Key Evidence and Policy Challenges, OECD Social,
Employment and Migration Working Papers, 2013, No. 147, OECD Publishing. 27 Global Entrepreneurship Monitor, Global Entrepreneurship Monitor 2013 Global Report, 2014, Global
Entrepreneurship Monitor Consortium. 28 Global Entrepreneurship Monitor, Global Entrepreneurship Monitor 2012 Women’s Report, 2013, Global
Entrepreneurship Monitor Consortium. 29 What a Difference a Y Makes - Female and Male Nascent Entrepreneurs in Germany. Joachim Wagner, 2004 30 Piacentini, M., Women Entrepreneurs in the OECD: Key Evidence and Policy Challenges, OECD Social,
Employment and Migration Working Papers, 2013, No. 147, OECD Publishing. 31 Piacentini, M., Women Entrepreneurs in the OECD: Key Evidence and Policy Challenges, OECD Social,
Employment and Migration Working Papers, 2013, No. 147, OECD Publishing. 32 Manolova, T., Brush, C. G., and Edelman, L. F., What do women entrepreneurs want?, Strategic Change,
2008, Vol. 17, pp 69–82. 33 The Differential Effect of Men and Women Entrepreneurs’ Human Capital and Networking on Growth
Expectancies in Bulgaria - Tatiana S. Manolova Nancy M. Carter Ivan M. Manev Bojidar S. Gyoshev, 2007.

93
Human capital in this case includes elements such as education, industrial, or
managerial experience. Amongst women especially, the role of social and human
capital are important factors which influence self-perception as women tend to hold to
a more realistic and less exaggerated estimation of their own capabilities.34
One third of European women believe they have the capabilities to start a business
while more than half of the European men believe they have these capabilities.35 This
is interesting given that, as mentioned earlier, women are on average more highly
educated than men.
Networking
Social Capital is often used as a synonym to describe the network of an entrepreneur.
Through social networking entrepreneurs can gain access to and attain resources they
need for their enterprise. Networking has been connected with entrepreneurial
orientation and financing strategies, as well as with the growth of new and small
enterprises36. Women in Europe have, on average, less expansive professional social
networks, due to lower participation rates on the labour market. Additionally, the
socio-cultural expectations of women as carers and nurturers persist in many
countries, inhibiting the opportunities to develop networks to the same degree as men
do37.
Access to finance
An important barrier to starting up and to the growth of enterprises is the access to
finance. Women entrepreneurs on average use less financial capital to start and run
their enterprises than men. In addition, women prefer using internal sources of
capital, in the form of own savings, or friends or family.38 Women have also been
reported to have less risky financial portfolios and tend to assume less financial risk
than men39.
The reasons for this inequality in funding for women and men entrepreneurs have
been attributed to some degree to the lower self-confidence amongst women when
applying for credit. Women entrepreneurs are more likely than men to be discouraged
borrowers. In the EU nearly 60% of women owned firms and 44% of male-owned
firms did not get a loan either because they were discouraged from applying or
because their application was rejected.40
The funding gap can be partly explained by the sectors women entrepreneurs are
active in. As has been mentioned earlier, the proportion of women entrepreneurs is
higher in the sector groups of service activities, human health and social work
activities, and education and in these sectors less financial capital is needed to start
and run the enterprise.
34 Manolova, T. S., Carter, N. M., Manev, I. M., & Gyoshev, B. S., The Differential Effect of Men and Women
Entrepreneurs: Human Capital and Networking on Growth Expectancies in Bulgaria’, Entrepreneurship
Theory and Practice, Vol. 31(3), 2007, pp 407 – 426. 35 Global Entrepreneurship Monitor, “Global Entrepreneurship Monitor 2012 Women’s Report”, 2013, Global
Entrepreneurship Monitor Consortium. 36 (Manolova et al 2006), cited in Network practices and entrepreneurial growth.- Anderson, A. R., Dodd, S. D.
and Jack, S., 2010. Available from OpenAIR@RGU. [online]. Available from: http://openair.rgu.ac.uk. 37 Piacentini, M., “Women Entrepreneurs in the OECD: Key Evidence and Policy Challenges”, OECD Social,
Employment and Migration Working Papers, 2013, No. 147, OECD Publishing. 38 Piacentini, M., “Women Entrepreneurs in the OECD: Key Evidence and Policy Challenges”, OECD Social,
Employment and Migration Working Papers, 2013, No. 147, OECD Publishing. 39 Wagner, J., What a Difference a Y Makes : Female and Male Nascent Entrepreneurs in Germany, 2004, IZA
Discussion paper series, No. 1134, University of Lueneburg and IZA (Institute for the Study of Labor) Bonn. 40 OECD/European Union, The Missing Entrepreneurs – Policies for Inclusive Entrepreneurship in Europe, 2013,
OECD Publishing.
94
Furthermore, other evidence points to the on average lower levels of income which
women have access to with which they are able to start their business; this to some
degree explains the trend of using less capital in the start-up phase by women.41
Internationalisation
On average, women entrepreneurs are less active on international markets than
men42. This again is related to the sectors in which women entrepreneurs are active in.
Literature also points to the relation between internationalisation and the availability
of human and social capital. As women entrepreneurs, on average, tend to have lower
levels of social and human capital, this can to some degree explain the lower rates or
internationalised women-led enterprises. An additional factor could be that women
may anticipate less respect by male business owners in some countries and as such,
cultural and personal factors have been found to play a role in preventing export
activities43.
8.2.3 Determinants
Formal Institutions: Political and governmental factors
The political/governmental level influences women in entrepreneurship through the
regulatory framework and support systems and policies.
Policy focus: The political level can impact rates of entrepreneurship to some degree
through policy initiatives which somehow facilitate entrepreneurship in general or
specifically amongst women. Emphasising women entrepreneurship at the political
level can help make the issue more prevalent in the mind of the public as a whole.44
Formal institutional arrangements: The regulatory system (business licenses, tax
legislation or other business regulations) can influence the levels of women
entrepreneurship specifically.45 Administrative complexity and red tape when starting
a business has been shown to be a deterrent factor for women entrepreneurs.
Similarly, social security systems which provide for more maternity and childcare
benefits have been shown to have a negative relationship with female
entrepreneurship46 since these exist primarily for employees.
Cultural norms and values
Cultural norms and values (informal institutions) also have an impact on women
entrepreneurship. Entrepreneurship is not always seen as a stable and promising
career choice and this will also affect women entrepreneurship. Cultural norms and
attitudes towards women in employment can generally also impact how likely a
woman is to consider and take steps to start her own business47.
41 Piacentini, M., Women Entrepreneurs in the OECD: Key Evidence and Policy Challenges, OECD Social,
Employment and Migration Working Papers, 2013, No. 147, OECD Publishing. 42 Global Entrepreneurship Monitor 2012 Women‘s report, Global Entrepreneurship Monitor Consortium, 2013 43 Piacentini, M., Women Entrepreneurs in the OECD: Key Evidence and Policy Challenges, OECD Social,
Employment and Migration Working Papers, No. 147, OECD Publishing, 2013 44 European Commission, DG Enterprise and Industry, Entrepreneurship 2020 Action Plan: Reigniting the
entrepreneurial spirit in Europe, COM(2012) 795 final, 2013 45 Verheul, I., A.J. van Stel and A.R. Thurik, Explaining Female and Male Entrepreneurship at the Country
Level, Entrepreneurship and Regional Development 18 (2), 151-183, 2006 46 OECD/European Union, The Missing Entrepreneurs – Policies for Inclusive Entrepreneurship in Europe, OECD
Publishing, 2013. 47 Piacentini, M., “Women Entrepreneurs in the OECD: Key Evidence and Policy Challenges”, OECD Social,
Employment and Migration Working Papers, No. 147, OECD Publishing, 2013.

95
Such stereotypes interact with the personal motivations and character traits of the
woman in question, but the role of such informal institutions remains important. 48 Role
models have the power to influence the informal institutions and can inspire women to
choose for entrepreneurship.49
Other factors influencing entrepreneurship
Statistical analysis50 shows that in the EU there is:
A strong positive relationship between the level of women unemployment and the
percentage of women entrepreneurs, out of women in the active labour force.
A negative relationship between the level of social benefits per unemployed worker
and the percentage of necessity driven women entrepreneurs.
A weak negative relationship between the average level of welfare and the
percentage of women entrepreneurs out of women in the active labour force.
A significant negative relationship between the level of trust in other people and
the percentage of women entrepreneurs out of women in the active labour force.
No significant relationship between barriers to obtaining finance and the
percentage of women entrepreneurs out of women in the active labour force.
No significant relationship between the level of job autonomy and the percentage
of women entrepreneurs out of women in the active labour force.
No significant relationship between gender inequality and the percentage of women
entrepreneurs out of women in the active labour force.
8.3 Economic and social contributions
Employers versus solo entrepreneurs
In 2012, one in five women entrepreneurs in the Netherlands were employers51 and
the remaining ones were solo entrepreneurs52. In the EU-28, the percentage of women
employers was slightly higher (23%). Regarding the percentage of employers, the
Netherlands ranked 22nd compared to other EU countries. Since 2008, the number of
women employers increased by 13% and this increase was higher than the EU
average. The number of men employers in the Netherlands decreased by 3%.
Part-time entrepreneurship
In 2012, about two third (64%) of women entrepreneurs in the Netherlands worked
part-time in their enterprise, which was significantly higher than the EU-28 average
(30%). About 25% of all men entrepreneurs worked part-time and this percentage
was also significantly higher than the EU-28 average. In contrast with the EU-average
and with the percentage for men entrepreneurs, the percentage of women
entrepreneurs decreased between 2003 and 2012. See figure 22.
48 Global Entrepreneurship Monitor, Global Entrepreneurship Monitor 2013 Global Report, Global
Entrepreneurship Monitor Consortium, 2014. 49 Isabel Grilo and Roy Thurik, Entrepreneurship in the old and new Europe, (SCALES paper), 2006 50 Panteia, Statistical Data on Women Entrepreneurs in Europe, prepared for the European Commission, DG
Enterprise and Industry, September 2014 51 Employers are persons who operate their own economic enterprise, or engage independently in a profession
or trade. They employ one or more persons and/or family workers. 52 Solo entrepreneurs are persons who operate their own economic enterprise, or engage independently in a
profession or trade. They do not hire employees nor are family workers or volunteers active in their enterprise. Solo entrepreneurs are also known as own account workers.

96
figure 22 Percentage of part-time entrepreneurs by gender in the Netherlands and EU-28, 2003, 2008 and
2012
Source: Panteia based on Labour Force Survey Eurostat
There are various reasons for entrepreneurs choosing to work part-time in their
enterprises, such as having another job, household activities, increasing age, or
study. In 2012, 1 in 8 women entrepreneurs in the Netherlands had a job in addition
to being an entrepreneur, while this was the case for 1 in 12 men entrepreneurs.
Compared to 2008, this proportion was the same for women entrepreneurs and
slightly lower for men entrepreneurs.
In 2012, Dutch women entrepreneurs working full time worked on average fewer
hours per week than men entrepreneurs while there was no significant difference in
working hours between men and women part-time entrepreneurs.
Characteristics of women-led enterprises and net income
In 2011, 88% of women-led enterprises in the Netherlands had fewer than 5 persons
employed and this was the case for 86% of the men-led enterprises. In 2007, these
percentages were similar. Around 35% of all women-led enterprises had a turnover of
less than €25,000 and this percentage was lower for the men-led enterprises (11%).
Compared to 2007 the percentage of women-led enterprises with a turnover of less
than €25,000 has increased, while this percentage for men-led enterprises decreased.
In 2011, around half of women-led enterprises had a profit of less than €25,000
versus 30% of the men-led enterprises. On average, women-led enterprises have not
been operating as long as those led by men. In 2011, 55% of women-led enterprises
and 48% of men-led enterprises had been operating for less than 5 years.53
In 2012, the mean net income of women entrepreneurs (€28,300) was higher than
that of men entrepreneurs (€26,700) in the Netherlands, while in the EU-28, the mean
net income of women entrepreneurs was lower than that of men entrepreneurs.54
53 Panteia/EIM, Monitor vrouwelijk en etnisch ondernemerschap 2013, Zoetermeer, 2014 54 Panteia, Statistical Data on Women Entrepreneurs in Europe, prepared for the European Commission, DG
Enterprise and Industry, September 2014.
97
Some studies indicate that women entrepreneurs tend to have a certain size threshold
for their businesses which they do not wish to exceed. Other studies suggest that
women are on average less motivated towards growing their business than by
maintaining a size for their enterprise which allows them to balance work and private
life55.
Well-being
A survey among Dutch founders of new ventures showed that women entrepreneurs
are more satisfied with their income than men entrepreneurs, even though they have
a lower average monthly turnover. On the other hand, women entrepreneurs find it
more difficult to cope with stress and are less satisfied with their leisure time.56
8.4 Summary and policy implications
In 2012, around 34% of all entrepreneurs in the Netherlands were women.
Entrepreneurs are defined as persons aged 15 years and older who work in their own
business, farm or professional practice to make a profit, and spend time on the
operation of a business, or are in the process of setting up a business.
The vast majority of these women entrepreneurs were solo entrepreneurs. One in nine
women in the active labour force are entrepreneurs (entrepreneurship rate). The
highest proportions of women entrepreneurs in the total number of entrepreneurs in a
sector were in the sector groups of other service activities, human health and social
work activities, and education. The lowest proportions were in construction, financial
and insurance services, and transportation and storage. Women entrepreneurs in the
Netherlands are on average slightly younger than men entrepreneurs and the average
education level is higher for women. Most women entrepreneurs in the Netherlands
work part-time. In 2012, the mean net income of women entrepreneurs was higher
than that of men entrepreneurs. The major motivations for women to start an
enterprise are work-life balance, income and personal development. Besides
differences in motivation, differences in character (for example calculated risk) also
influence the choice for entrepreneurship.
The goal of this chapter is to come to a deeper understanding of which dynamics are
at work when it comes to women entrepreneurship and their impact on economy and
society. In the Netherlands as well as in Europe women are less involved in
entrepreneurship than men. This holds for existing and early stage entrepreneurs.
Policies can be developed to stimulate women entrepreneurship further. These could
entail support in the start-up phase, help to stimulate growth, and contribute to the
creation of jobs. The proportion of women entrepreneurs in the Netherlands with
employees is still low compared to men entrepreneurs but also compared to the EU.
The majority of women entrepreneurs are solo entrepreneurs and a large part of them
work part-time, which could indicate that entrepreneurship is a good tool to improve
the participation of women in the labour force and in society.
55 Piacentini, M., Women Entrepreneurs in the OECD: Key Evidence and Policy Challenges, OECD Social,
Employment and Migration Working Papers, No. 147, OECD, 2013 and Global Entrepreneurship Monitor,
Global Entrepreneurship Monitor 2012 Women’s Report”, Global Entrepreneurship Monitor Consortium,
2013. 56 Carree, M.A. and I. Verheul, What makes entrepreneurs happy? Determinants of satisfaction among
founders, Journal of Happiness Studies 13, 371-387, 2012.

98
The impact of women on society is further confirmed by their motivations to start an
enterprise but also by the sectors in which women entrepreneurs choose to be active.
Policies could focus on measures in specific fields such as easing access to finance,
training and support services specifically aiming at the motivations of and barriers
women face in choosing for entrepreneurship.

99
9 Inclusive entrepreneurship
Paul Vroonhof and Amber van der Graaf - Panteia
9.1 Introduction
Promoting entrepreneurship constitutes an important part of the Lisbon agenda and
the Europe 2020 strategy which treats entrepreneurship as a key component of smart,
sustainable and inclusive growth.57 With regards to the inclusive part of the strategy,
in the contribution of entrepreneurship a distinction can be made between social
entrepreneurship (for instance, hiring people who have difficulty participating in
society) and inclusive entrepreneurship. This chapter concerns inclusive
entrepreneurship.
There is no clear definition of inclusive entrepreneurship available. In many cases,
social entrepreneurship and even elements of (good) general working conditions are
included58. Even more often, it is defined or referred to as a policy or intervention
rather than entrepreneurial activities per se. Based on a project run by Syracuse
University59 we propose to define it as entrepreneurship by people with diverse
disabilities and/or economic and social disadvantages. This definition also fits to the
implicit definition used by the OECD.60
Ideally, we would include in this ‘target group’ all persons who are disadvantaged in
terms of participating on the labour market or in society as a whole. In practice,
various groups of people are included that are known to have an (on average)
disadvantage. In this chapter, we will use young people, people with disabilities and
migrants/people from ethnic minorities to illustrate the topic.
9.2 Prevalence and characteristics of inclusive entrepreneurship
As discussed, there is no measurable definition of inclusive entrepreneurship available.
The group characteristics we could use would cause overestimating (not all group
members are disadvantaged) and underestimating (not all persons with a
disadvantage are likely to be covered). To illustrate, if one would include all female,
young, older, lower educated, ethnical or previously unemployed persons, it would
refer to a large majority of all entrepreneurs. Still, someone without all these
characteristics who has been fired 10 times in the last few years would not be
included.
Moreover, the various subgroups are very different, also in terms of prevalence. For
instance, where a person with a lower education would normally stay in that group,
someone on benefits would leave it when becoming a (successful) entrepreneur.
Having said that, the same person might still be part of another sub-group, or might
still be socially disadvantaged, or might be at a relative disadvantage making a living
as an entrepreneur or might still have a disadvantage at the labour market would he
(or she) start looking for a job.
57 http://ec.europa.eu/europe2020/index_en.htm 58 See for example http://www.mvonederland.nl/event/netwerkbijeenkomst-inclusief-ondernemerschap-ieder-
talent-telt. 59 Inclusive Entrepreneurship is the name of a project which evolved from the ‘Start-Up NY’ Pilot Project
funded by US Department of Labor/Office of Disability Employment Policy in Onondaga County run by
Syracuse University. 60 The Missing Entrepreneurs; Policies for inclusive entrepreneurship in Europe, OECD/European Commission,
2013. Strangely enough, this report does not contain a definition, nor does it explain why it does not.

100
These problems are reflected in the available literature covering (parts of) the topic.
Most reports focus on the policy aspect, with data on a limited part of the relevant
population61, present general information, but little on the real problems areas62, or
monitor sub-groups63. Various types of comparisons occur: with other subgroup
members (employees, unemployed), with other entrepreneurs, international, within
group (who is successful).
Below, we present some illustrative figures and characteristics for the sub-groups
mentioned above.
Young64
Youths have been especially badly hit by the crisis and getting young people into
employment has become a top policy priority throughout the last few years. Getting
young people into entrepreneurship could constitute an increase in jobs as well and
would counter rising youth unemployment. The OECD points out that if youth are not
helped into employment, we run the risk of losing potential human capital.
Figure 23 shows that, relative to innovation-driven economies, the Netherlands has a
high rate of established entrepreneurs, defined as entrepreneurs running a business of
at least 3.5 years old. The difference is substantial in the 25-34 group. However, in
comparison to older persons, the rate is still low.
As regards the youngest age group within the adult population (18-24 years), we note
that the established entrepreneurship rate is lowest. This is not surprising, since
people in this age category have not had much opportunity yet (in terms of time) to
have been running a business for more than 3.5 years. Nevertheless, it is remarkable
that the rate of established entrepreneurship in the Netherlands is much lower
compared to innovation-driven economies.
61 For instance: OECD/European Commission (2013), The Missing Entrepreneurs; Policies for inclusive
entrepreneurship in Europe. Strangely enough, this report does not contain a definition, nor does it explain
why it does not. 62 For instance: Francis Greene (2013), Youth Entrepreneurship; a background paper, OECD/LEED. 63 For instance: Panteia (2013), Monitor vrouwelijk en etnisch ondernemerschap. 64 Mainly based on Van Stel, A., T. Span, and J. Hessels (2014), Global Entrepreneurship Monitor; the
Netherlands 2013 National Report, Zoetermeer: Panteia.

101
figure 23 Established entrepreneurship in the Netherlands and innovation-driven economies, 2013, percentage of a given subgroup
Source: Van Stel, Span and Hessels (2014)65, based on Panteia/GEM APS 2013.
Compared to the overall Dutch total early-stage entrepreneurial activity (TEA) rate
(9.3%), but also compared to other innovation-driven economies, the TEA rate in the
Netherlands is especially high among individuals in the age category of 25-34 years
(13.1%) and among individuals with a graduate degree (16.8%), as illustrated in
figure 24. It seems that after graduation from university (i.e., in the age of 25-34),
more graduates consider to start their own business. These results suggest that the
increased attention for entrepreneurship in Dutch higher education in the past decade
is starting to pay off.
Regarding the 18-24 age category, the TEA rate is 7.6, which is much higher than the
established entrepreneurship rate for this age category, but also higher than the TEA
rate of innovation-driven economies. Apparently, entrepreneurship is not an unusual
occupation for young people in the Netherlands. However, one may wonder why, at
the same time, the rate of established entrepreneurship is so low (also relative to
other countries), as was shown in figure 23. This is a relevant question for future
research.
65 Van Stel, A., T. Span, and J. Hessels (2014), Global Entrepreneurship Monitor; the Netherlands 2013
National Report, Zoetermeer: Panteia.
11,8
5,6
0,2
5,8
10,2
14,1
9,0
6,0
8,5
9,5
13,0
9,3
4,2
1,4
3,5
8,0
10,4
8,8
5,2
6,3 7,0 7,3
0
5
10
15
Male
Fem
ale
18-2
4
25-3
4
35-4
4
45-5
4
55-6
4
Som
e s
econdary
Secondary
Post-
secondary
Gra
duate
Gender Age Education
Netherlands Innovation-driven economies

102
figure 24 Total early-stage entrepreneurial activity (TEA) in the Netherlands and innovation-driven economies, 2013, percentage of a given subgroup
Source: Van Stel, Span and Hessels (2014), based on Panteia/GEM APS 2013.
Figure 25 clearly illustrates a substantial growth of the TEA in the age category 25-34
over recent years. Especially in 2013, this is different than in the other categories.
figure 25 Total early-stage entrepreneurial activity (TEA) in the Netherlands, 2010-2013, percentage of a
given age category
Source: Van Stel, Span and Hessels (2014), based on Panteia/GEM APS 2013.
Migrant and ethnic66
Entrepreneurs with an ethnic background make up a substantial portion of the total
group of entrepreneurs in the Netherlands. Of the 1.2 million businesses in 2011 16%
belonged to first or second generation immigrants. This means that at least one of
their parents was born abroad. Migrant populations are less entrepreneurial than
native Dutch. This is evident from a comparison of the business ownership rate.
66 Taken from: Smit, L., T. Span, A. Bruins and S. Doove (2014), De economische bijdrage van etnisch
ondernemerschap, Utrecht: FORUM, Instituut voor Multiculturele Vraagstukken.
11,7
6,8 7,6
13,1
10,6 10,0
4,4 5,3
8,9
11,0
16,8
10,1
5,7 6,3
10,2 9,8
7,5
4,4 4,6
6,7
9,4 10,6
0
5
10
15
20
Male
Fem
ale
18-2
4
25-3
4
35-4
4
45-5
4
55-6
4
Som
e s
econdary
Secondary
Post-
secondary
Gra
duate
Gender Age Education
Netherlands Innovation-driven economies
6,9
11,3
7,6 6,8
3,4
7,4
9,9 9,3 9,0
4,9
7,4
11,8
13,7
11,9
5,2
7,6
13,1
10,6 10,0
4,4
0
5
10
15
18-24 25-34 35-44 45-54 55-64
2010 2011 2012 2013

103
Nearly 12% of the indigenous population is an entrepreneur, for the immigrant
population this is just over 8%.
There is a difference between Western immigrants (from Europe, North America and
Oceania) and non-Western immigrants (from other parts of the world). Of the latter
group just over 6% of the workforce is an entrepreneur.
Ethnic entrepreneurs are very active as marketmen, in business services and in other
services sectors. There seems to be a generational shift: the industry spread increases
and the second generation shows a stronger focus on more advanced sectors.
In the Netherlands, the participation of ethnic entrepreneurs to formal entrepreneurial
networks is traditionally low. This seems to be changing. The second generation ethnic
entrepreneurs are more often a member of these networks. At the same time they
stick to their informal networks. The second generation succeeds in combining and
exploiting these networks to increase their business success.
People with disabilities
We did not find useful data for the Netherlands. Kitching67 found some data for
Europe, UK and the US that is briefly summarised below. Sources referred to by
Kitching are included.
A study of 13 of the then 15 EU member states using European Community Household
Panel data for the period 1995-2001 found that self-employment rates among disabled
people are higher than among people without disabilities68. Self-employment rates for
disabled people varied across the 13 countries and by gender but, compared to males
without disability, rates were higher among males with disabilities in 11 countries
(particularly Greece, Portugal and Ireland) and, compared to females without
disability, higher among females in 11 countries (particularly Greece, Portugal, Austria
and Spain). Countries with a higher disabled/non-disabled differential, with the partial
exception of Austria, are all countries with high rates of self-employment overall. This
suggests that countries with high self-employment rates might be better placed to
absorb self-employment among disabled people.
Looking at the personal characteristics of disabled entrepreneurs, self-employment
rates vary by type and severity of impairment, gender, education and residential
location. Self-employment rates were higher among people who were severely limited
in their daily activities than among those reporting some or no limitation in daily
activities69,70.
9.3 Economic and social contributions
Inclusive entrepreneurship has a very obvious impact (in a sense: by definition) on
job creation, participation, autonomy and possibly on income/subsistence. However,
the degree to which persons from various subgroups would not, instead of being
entrepreneur, become an employee or otherwise participating (the net contribution)
has never been studied, as far as we can tell.
67 Kitching, J. (2014), Entrepreneurship and self-employment by people with disabilities; Background Paper for
the OECD Project on Inclusive Entrepreneurship, OECD. 68 Pagán, R. (2009), Self-employment Among People with Disabilities: Evidence for Europe, Disability and
Society, 24(2), 217-229. 69 Ibid. 70 Jones, M. (2011), Disability, employment and earnings: an examination of heterogeneity, Applied
Economics, 43(4), 1001-1017.

104
For the Netherlands, a report was published on the economic contribution of ethnic
entrepreneurs. Results presented in the subsection below are taken from this report.71
Ethnic minority entrepreneurs
Of all employment in private companies in the Netherlands in 2011, 14 percent is
created in the businesses of ethnic entrepreneurs. This means that more than 600,000
people are employed in businesses owned by entrepreneurs from an ethnic minority.
The gross value added that the ethnic entrepreneurs produce, is also 14% of the total
value created by entrepreneurs in the Netherlands: this amounts to € 37 billion added
value.
Both in terms of employment and added value the contribution of ethnic entrepreneurs
remains slightly behind the relative size of this group. The businesses of ethnic
entrepreneurs are on average smaller than that of indigenous entrepreneurs and the
median value is also lower.
12% of all ethnic entrepreneurs imports and 9% exports. These shares are lower than
among indigenous entrepreneurs. Adjusted for the higher import and export shares of
those ethnic entrepreneurs that do trade internationally, however, the discrepancy
between the two groups evaporates. Ethnic entrepreneurs are good for 13% of total
import and export by Dutch entrepreneurs. This means that in 2011 they imported for
€ 9 billion and exported for € 11 billion.
Non-Western immigrant entrepreneurs are less likely to be internationally active than
Western immigrant entrepreneurs. Entrepreneurs originating from Turkey and China
are exceptions to this rule. Turkish origin entrepreneurs also import relatively often.
Networks along the diaspora links (links with the country of origin that arise based on
shared history and cultural norms and values) offer ethnic entrepreneurial
opportunities to operate internationally. By products from the importing country of
origin entrepreneurs can serve a niche market, which gives them a competitive edge.
In particular, the second generation ethnic entrepreneurs know how to combine two
cultures along this road.
9.4 Barriers to entrepreneurship
In a discussion of those issues which prevent entrepreneurship amongst socially
excluded groups, it is important to mention that many of the obstacles faced by such
groups are felt by entrepreneurs in general. Steps in setting up a business such as
locating starting capital, understanding and fulfilling administrative requirements,
acquiring appropriate management skills, and finding a market can all form obstacles
to someone looking to become self-employed72. Referring to the Eurobarometer survey
on entrepreneurship from 2011, 79% of respondents felt that if they were to set up a
business, the main difficulty would be locating start-up capital; 72% felt the
administrative burden was the main difficulty73. Furthermore, starting an enterprise
can often encounter difficulty in attaining loans as the success rate of SMEs tend to lie
between 50 and 60% in Europe; this makes the risk for financial institutions higher
which makes attaining a loan more difficult.
71 Smit, L., T. Span, A. Bruins and S. Doove (2014), , De economische bijdrage van etnisch ondernemerschap,
Utrecht: FORUM, Instituut voor Multiculturele Vraagstukken. 72 Eurofound (European Foundation for Living and Working Conditions), (2002), Access to Employment for
Vulnerable Groups, Dublin, Ireland. 73 Eurobarometer, (2012), Flash Eurobarometer 354: Entrepreneurship in the EU and Beyond – Summary,
[online], available at: http://ec.europa.eu/public_opinion/flash/fl_354_en.pdf.
105
What makes these common obstacles to entrepreneurship more acute for socially
disadvantaged groups are their higher vulnerability within society. These issues tend,
for various reasons, to apply more severely to members of vulnerable groups. Most of
the subgroups tend to face discrimination for some reason or other on the labour
market, and this is also felt by such groups in their efforts to become self-employed.
Members of these groups are more likely to have lower levels of financial capital at
hand74. Though this is not always the case, this trend lowers likelihood of such groups
going into entrepreneurship. Given this vulnerability, an added key disincentive to
self-employment is the lower social protection enjoyed by entrepreneurs.
Young
The youth face many challenges common to entrepreneurs but more severely.
Gathering human and financial capital, in the case of youths this tends to be even
more difficult than the average entrepreneur. The lack of experience on the part of
young people and lack of own capital make loans to young people comparatively
riskier. Though youths do not view entrepreneurship as a bad career path, issues such
as the high administrative burden and high failure rate of SMEs, act as disincentives
to go into self-employment. For young people therefore access to capital and
transparent administrative procedures would help entrepreneurship75. This also implies
that the main help which the social security could offer to counteract these barriers
would be in the form of financial flexibility regarding insurance payments, or generous
unemployment benefit regulations.
A positive point to highlight is that Greene’s same study, carried out in the UK,
indicates that youths do appreciate the elements associated with entrepreneurship,
such as flexibility, being one’s own boss, finding new markets, etc. The study
established that there is a significant degree of “nascent entrepreneurship” amongst
young people, and that with the right encouragements and incentives, they may be
more inclined to go into self-employment.
Migrant and ethnic
The European Microfinance Network indicates in its report on Migrant Entrepreneurship
that migrants and ethnic minorities face many of the same issues as native
entrepreneurs in going into self-employment76. The specific issues faced by these two
groups of non-natives are similar though not the same; ethnic minorities are after all
more settled in their country of residence and are less inclined to be confronted with
cultural and linguistic barriers. They are also more inclined to have built up a larger
social network by virtue of having been in their country of residence for longer.
As with the young entrepreneurs, finding capital, having the appropriate human
capital, appropriate managerial skills, and business support are all issues which an
entrepreneur may wrestle with. Migrants however tend to face these issues more
extremely. Translating foreign credentials and qualifications into terms which the
migrant’s current country can relate to also proves to be an extra bureaucratic barrier
to migrants77.
74 Zissimopoulos, J.M. and L.A. Karoly (2007), Transitions to self-employment at older ages: The role of
wealth, health, health insurance and other factors, Labor Economics 14, 269-295. 75 Greene, F. J, (2005), Youth Entrepreneurship: Latent Entrepreneurship, Market Failure and Enterprise
Support, Working Paper No. 87 - June 2005. 76 EMN (European Microfinance Network), (2006), Nurturing Immigrant Entrepreneurship, Brussels, Belgium. 77 EMN (European Microfinance Network), (2006), Nurturing Immigrant Entrepreneurship, Brussels, Belgium.

106
Understanding the various requirements for setting up an enterprise is made more
difficult due to cultural and language barriers78; norms and processes in one country
may not be intuitive or evident to a migrant or member of an ethnic minority for
instance.
Entrepreneurs with a migrant or ethnic background tend to engage in more necessity
based entrepreneurship. They tend on average to have lower levels of education, face
discrimination on the job market and therefore end up in lower status jobs. Residency
and citizenship criteria79 can also limit the access to social security entitlements,
lowering the overall opportunity cost to going into self-employment. Therefore,
entrepreneurship often becomes a more attractive option for migrants.
People with disabilities
Disabled people cite the same reasons for having trouble getting into self-
employment, combined with further issues specific to those with a disability or long
term illness. Accessing starting capital, having access to training and information,
human capital, and networking are all important to undertake, but are more acute for
those with disabilities. While self-employment is an important source of income, on
average, disabled people have a lower income than non-disabled people. This can be
due to the productivity of the individual which are often lower due to health reasons
amongst disabled people, or can be down to discriminatory factors. While legislation
exists in certain countries (Austria, Germany and Ireland) making it illegal to have
wage differentials between disabled and non-disabled, these are not always very
effective80.
Other obstacles which reduce the chances of entering self-employment include the
fear of losing financial security due to a lack of own financial resources, discrimination
or disinterest from banks, lack of accessible information on grants and loans, and the
poor credit ratings of long term social security beneficiaries81. Untrained and unhelpful
employment service providers and business advisors have also been cited as obstacles
to entering self-employment for disabled people; candidates looking to start an
enterprise are often met with limiting attitudes a lack of understanding on the scope
of the person’s disability in question. Besides this, the lack of accessible information,
training and support was encountered as a problem; in most cases training on
entrepreneurial activities was not tailored to individual needs82.
9.5 Summary and policy implications
Without systematic evaluations it is difficult to provide concrete recommendations of
what types of policy measures help promote inclusive entrepreneurship. Added to this
fact is that what works for one country may not work in another; reasons for going
into entrepreneurship can vary across cultures. Furthermore, it is difficult to establish
the effectiveness of these instruments given that social security arrangements are
unlikely to have a visible effect on self-employment rates on a national scale,
notwithstanding questions around net effect, possible unfair competition.
78 Hermes, K. & Leicht, R., (2010), Scope and Characteristics of Immigrant Entrepreneurship in Europe: A
Cross-National Comparison of European Countries, Working Paper. 79 OECD, (2010), Entrepreneurship and Migrants, Report by the OECD Working Party on SMEs and
Entrepreneurship, OECD. 80 Boylan, A. & Burchardt, T., (2002), Barriers to self-employment for disabled people, Small Business Service,
October 2002. 81 Eurofound (European Foundation for Living and Working Conditions), (2003), Illness, disability and social
inclusion, Dublin, Ireland. 82 Eurofound (European Foundation for Living and Working Conditions), (2002), Access to Employment for
Vulnerable Groups, Dublin, Ireland.

107
A large scale overhaul of the social security system to provide more equal treatment
of self-employed and the employees would not be feasible in most countries. The
time, money and confusion attached to a large scale overhaul could be problematic.
Without adequate political and public support for such an exercise, such an overhaul
would not be realistic. Considering that the socially excluded self-employed consist of
generally more marginalized groups, such support may be difficult to generate.
Smaller policy changes aiming to equalize the position of both groups of workers, such
as in Spain and the Czech Republic could hold the key for changes to improve the
situation of (inclusive) entrepreneurship from within the social security system. While
the Self-Employed Workers’ Statute in Spain was by no means a small alteration, it
was not so large or contentious that it caused public or political outcry.
Smaller changes such as reducing the taxes needed from entrepreneurs (the
Netherlands) or introducing income-based social security coverage (Poland, Bulgaria,
Finland, Ireland), may also be useful in stimulating inclusive entrepreneurship. These
measures improve the flexibility experienced by entrepreneurs from a financial and
social coverage perspective. While the freedom such measures provide are attractive
to entrepreneurs, in certain cases the means or income-based coverage systems also
coincide with less coverage in the case of lower contribution payments. This is a point
which must be borne in mind and examined in each specific national context. One
must consider whether overall the entrepreneur is then better off with such flexible
social security arrangements. In the case of socially disadvantaged groups this is an
especially important aspect to consider.
Those policies which target the main problems facing entrepreneurs directly seem
most effective. In the absence of systematic evaluation this judgment is based on the
long-term continuation of such measures (despite the Euro crisis) and the statistics
which are available on the use of those measures. From this perspective the Irish Back
to Work Enterprise Allowance (BTWEA) is an excellent practice in that it has survived
throughout times of economic adversity and helped 86% of its participants (at last
count in 2002) to be weaned off of social welfare. The system is relatively
straightforward which perhaps is an added appeal for people who use it. The German
Enterprise Subsidy appears to have been quite successful given that it is the merging
of two other, long running subsidy programmes. The merging in fact took place to
reduce administrative complexity amongst other things. Considering once again the
Eurobarometer survey which pointed to “administrative” burden as being a significant
disincentive to entrepreneurs, the clear set-up of this instrument could
understandably also make it more effective. Programmes and instruments providing
financing or welfare bridges for people receiving benefits, and which do so in a clear
manner therefore appear to be amongst the more effective instruments; they target a
main problem directly and do so transparently.
Following from this point, the clarity and accessibility of measures is an important
component for their success. Measures which allow for more flexibility in the
contribution payments and coverage levels address the issue of the social and
financial risk which an entrepreneur runs when starting a business. Consider once
again the means and income-based social security coverage for instance. While these
measures have been discussed earlier in this section along with the fact that their
effectiveness is contingent on the actual coverage and contribution payments
required, another important aspect is that these measures be made clear and known
to potential beneficiaries.

108
The communication, understanding, and criteria to access such measures is crucial.
Though this is not an aspect this paper has been able to delve into, given the
administrative and bureaucratic burden associated with being an entrepreneur across
Europe, it appears that making regulations regarding the self-employed more
accessible would constitute a significant improvement.
It has been said throughout this paper that the socially disadvantaged groups suffer
from similar obstacles to entrepreneurship as entrepreneurs generally. In this vein,
those policies helping the self-employed generally are likely to also have a positive
impact on the socially excluded. In more extreme cases of socially disadvantaged
individuals however, this reasoning may not hold as well. In some cases, a more
tailored approach may be appropriate to target the specific issues relevant to a
particular social group. For instance, disabled people benefit from grants where the
equipment and disability-specific adjustments to the work environment are paid in
combination with their existing benefits.
We conclude this chapter with some recommendations:
It is important to bear in mind that issues plaguing entrepreneurs generally are
also felt by socially disadvantaged groups; thus stimulating general
entrepreneurship can help stimulate inclusive entrepreneurship as well.
Smaller scale reforms seem more feasible, indeed they are perhaps more common
as a result of the fact that they are easier to implement.
Make the social security options for the (socially excluded) entrepreneurs more
visible and clear to potential beneficiaries.
Tailoring policy instruments to specific socially disadvantaged groups could be
more effective in reaching said groups and helping to reduce the barriers to
entrepreneurship, but this must not come at the risk of increased administrative
complexity.
Political will and public support are necessary to instigate change in social security
coverage; the economic and societal value of inclusive entrepreneurship should be
communicated to generate such political will and support.
To enable this, more and better research/impact assessments are required. One
issue to look further into is the negative relationship between entrepreneurship and
the generosity of social security systems83, paying close attention to the role of the
socio-economic situation, the cultural mentality surrounding entrepreneurship and
the national attitude towards social security coverage. Such research could provide
a deeper analysis of why what works in which situation, allowing for more concrete
policy recommendations regarding inclusive entrepreneurship.
Finally, for further reading on the topic of the present chapter we refer to two recent
OECD publications.84
83
Hessels, S., A. van Stel, P. Brouwer and S. Wennekers (2007), Social Security Arrangements and Early-
Stage Entrepreneurial Activity, Comparative Labor Law & Policy Journal 28 (4), 743-774. 84 Marchese, M. (2014), "Entrepreneurial Activities in Europe - Finance for Inclusive Entrepreneurship", OECD
Employment Policy Papers, No. 5, OECD Publishing, Paris. DOI: http://dx.doi.org/10.1787/5jxrcmkgkzzs-
en
Halabisky, D. (2014), "Entrepreneurial Activities in Europe - Entrepreneurship for People with Disabilities",
OECD Employment Policy Papers, No. 6, OECD Publishing, Paris. DOI: http://dx.doi.org/10.1787/5jxrcmkcxjq4-en
109
10 Summary and conclusions
In this report we tried to shed more light on the contribution of different types of
entrepreneurs to economic and societal value creation in the Netherlands. To reach
this aim we adopted the entrepreneurial framework approach introduced by Stam
(2014). In this approach the link between different types of entrepreneurs and
aggregate value creation is studied as well as the link between structural
characteristics of an economy (framework conditions) and the various types of
entrepreneurs. We extended the approach by identifying several additional types of
entrepreneurial activity and by studying more closely to which type of value creation
the different entrepreneurial types contribute. In this regard, we used theoretical
literature about the different roles entrepreneurs play in economy and society (e.g.,
Hébert and Link, 1989). Moreover, we used empirical literature and various data
sources to corroborate the contributions of different types of entrepreneurs to
different types of value creation, and to gain insight in the characteristics and
determinants of a certain type of entrepreneurship. Finally, we also investigated how
the Netherlands perform on various types of entrepreneurship, relative to other highly
developed economies. Because international comparison was thus an important goal,
we mostly used internationally harmonized data bases such as the Global
Entrepreneurship Monitor (GEM) and other data bases, rather than Statistics
Netherlands (CBS) data bases. In comparing the Netherlands with other countries, it
is important to bear in mind that these internationally harmonized data bases are
often based on surveys (e.g., GEM), which makes that the statistics derived from
these data bases are surrounded by confidence intervals which are sometimes
relatively large.
Types of entrepreneurship can be identified on the basis of various dimensions. For
instance, when categorizing entrepreneurs on the basis of the dimension education,
the entrepreneurial types lower educated and higher educated entrepreneurs may be
identified. These dimensions may themselves also be categorized in broader classes of
dimensions, on the basis of which we may identify type groups. Specifically,
entrepreneurial types may belong to either one of three broader classes of types (type
groups): characteristics of the venture, organizational form and demographic
characteristics (see table 3 in chapter 2).
Without pretending to cover the complete spectrum of entrepreneurial types, we
selected seven relevant types for which we performed the exercise described above.
Based on our investigations, Figure 26 summarizes the main contributions to economy
and society for six of these types (younger versus older entrepreneurs excluded), as
well as their main underlying roles and intermediate linkages (see also tables 1 and 2
in chapter 2). Of course, this visualization is a highly simplified version of reality.
Figure 26 also shows the type group to which each entrepreneurial type belongs, as
well as the prevalence of each type in the Dutch economy. The main conclusions and
policy implications for each of the seven types are summarized below.
First, regarding ambitious entrepreneurs, we found that the level of ambitious
entrepreneurship (defined as the percentage of total early-stage entrepreneurial
activity that expects to grow their business with more than 19 employees in the next
five years) in the Netherlands is considerably below the average of innovation-driven
economies. Regarding characteristics, it was found that ambitious entrepreneurs are
more likely to be found among higher educated individuals and among men. Ambitious
entrepreneurs contribute disproportionally to innovation and firm growth, which, in
110
terms of value creation at the aggregate level, translates into large effects on
economic growth and job creation. Some ambitious entrepreneurs will also contribute
to a greener economy via the creation of new niche industries.
In terms of policy implications, the present state of the literature does not answer the
question whether macro-economic growth is promoted by a small number of fast-
growing firms or a higher number of firms growing at a more moderate pace. Hence,
there may be several paths (regimes) that lead to high macro-economic growth rates.
Possibly a policy emphasis on (a relatively high number of) more slowly-growing and
relatively small enterprises may be an equivalent alternative for the often advocated
emphasis on (a relatively low number of) fast-growing and relatively large SMEs (Van
Stel, Wennekers and Scholman, 2014, p. 126). Nevertheless, if policy aims at
promoting ambitious entrepreneurs and high-growth firms, it is important to take into
account that firm growth by high-growth firms is typically not persistent (Daunfeldt
and Halvarsson, 2015). Hence, rather than targeting specific firms with growth
potential, it may be better to focus on creating the right circumstances for ambitious
entrepreneurship to flourish, for instance by increasing access to finance for SMEs or
by decreasing the burden and risks of hiring and firing personnel.
In addition, ambitious entrepreneurship may be encouraged through the educational
system, by stimulating ambition levels of individuals and by stimulating ambitious
individuals to set up their own firm (Stam et al., 2012).
Second, regarding solo self-employed, it was found that the number of solo self-
employed in the Netherlands has increased rapidly over the last 15 years. The
population of solo self-employed is characterized by a high degree of heterogeneity, in
terms of gender, age, education and start-up motives. Regarding these motives, about
one quarter of solo self-employed in the Netherlands may be characterized as
necessity entrepreneurs in the sense that they started their business for lack of
alternative employment options. Still, even among this group, the majority is able to
make a living (De Vries, Liebregts and Van Stel, 2013). The main contribution of solo
self-employed to the economy is the provision of flexibility, both to the firms that use
their services, and to the labour market in general. Hence, an important part of their
economic contribution is indirect, in the sense that their flexible activities, which may
also be innovative in nature, enable the entrepreneurship of their client firms and
secure productivity increases in these firms (Burke and Cowling, 2015). Although
some solo self-employed turn into employer entrepreneurs, the (direct) contribution of
solo self-employed to aggregate job creation is more limited. In terms of contributions
to well-being, solo self-employment contributes substantially to job satisfaction, as,
on average, solo self-employed experience a higher level of job satisfaction than
employees.
Third, regarding green entrepreneurs, although a generally accepted definition does
not exist, a common element in circulating definitions is that green entrepreneurs
intentionally aim to create environmental value in the pursuit of profit. As such, they
contribute (by definition) to achieving a more ‘green’ economy. Their aim to create
environmental value is often realised by introducing innovation and by the creation of
new industries, which, at the macro level, contribute positively to the economy. Not
denying their contribution to economic growth and job creation, the main contribution
of green entrepreneurs may be described as bringing necessary eco-innovations to
markets and lowering the negative impact of businesses and consumers on the
environment. Using three different measures of green entrepreneurship, the
Netherlands were found to perform on par or slightly above average compared with

111
the average across EU-countries. Green entrepreneurship is a relatively new
phenomenon, and a better understanding of what drives green entrepreneurs is still
warranted. Similarly, although it seems clear that public policy has an important role
to play in stimulating eco-innovation by green entrepreneurs, more research is
required on how exactly this role should take shape.
Fourth, regarding younger versus older entrepreneurs, the prevalence of
entrepreneurs running new and young businesses is highest among the age category
between 25-44 years while the prevalence of entrepreneurs in incumbent businesses
is highest among individuals aged between 35-55 years. Hence, on average, higher-
aged firms tend to be run by higher-aged entrepreneurs. Regarding performance, the
consensus in the literature seems to be that successful job creators tend to be middle-
aged. Moreover, firm survival seems to increase with the age of the entrepreneur.
Focusing on the youngest age group (of people up to 25), with its high levels of youth
unemployment, various arguments have been raised why youth entrepreneurship
should be stimulated. These policies may also include continued support during the
first few years after the start, to reduce the risk of firm exit. In this regard, the
relatively low rate of incumbent entrepreneurship among the youngest age group in
the Netherlands (also when compared to other countries), may call for attention.
During the past 60 years, the age structure of the Dutch population changed
considerably and it will change even further in the coming decades. It is expected that
these changes affect the composition of the population of entrepreneurs but not so
much the number of entrepreneurs. In particular, it is expected that the average age
of the entrepreneur will increase (De Kok and Span, 2014).
Our study revealed that any relation between age and entrepreneurship is likely to be
indirect, where age is related to such characteristics as health, financial capital, and
experience. Moreover, the relation between the entrepreneur’s age and firm
performance seems to be non-linear. In sum, the entrepreneurial type relating to age
of the entrepreneur does not seem to fit in well in Figure 26. Therefore, we decided
not to include this type in Figure 26.
In fact, more in general, the effects of entrepreneurial types belonging to the type
group demographic characteristics (see table 3 in chapter 2) are often indirect in the
sense that their members are overrepresented in certain entrepreneurial types from
the type groups characteristics of the venture or organizational form. For instance, as
we will see below, higher educated entrepreneurs are overrepresented in the
entrepreneurial types ambitious entrepreneurship and solo self-employed.
Fifth, regarding higher educated entrepreneurs, it was found that the prevalence rate
of nascent and young business entrepreneurs tends to increase with the education
level of individuals. Moreover, based on figures for 2013 it was shown that the rate of
entrepreneurship among individuals with university education is especially high in the
Netherlands, relative to other innovation-driven economies. This may be related to the
increased attention for entrepreneurship in higher education programs in the
Netherlands in recent years.
Regarding labour market behaviour of highly educated individuals, the analysis
suggested that higher educated entrepreneurs operate on the extremes of the firm
size distribution. One segment operates very small firms (solo self-employment),
whereas another segment tends to run the largest firms. In Figure 26 this is visualized
by splitting the higher educated entrepreneurs in a group of solo self-employed and a
group of ambitious entrepreneurs, although we recognise that not every ambitious

112
entrepreneur realises his or her ambition of running a large firm. Nevertheless, many
empirical studies find that entrepreneurship by higher educated individuals is
associated with higher average firm size. Higher educated entrepreneurs have the
ability to coordinate larger amounts of input factors into the production process,
enabling them to run larger firms and to obtain higher returns.
Hence, apart from the considerable group of highly educated entrepreneurs who
deliberately choose to work on their own, the observation that average firm size for
employer entrepreneurs increases with a country’s level of education implies that
fewer people will eventually become employer entrepreneur and more people will end
up working as a (high quality) employee in an entrepreneurial firm. In simple terms,
the implication is that not everyone can become an employer entrepreneur. This has
policy implications for entrepreneurship education programs in institutions of higher
educations. In particular, such programs should not only focus on future
entrepreneurs but also on future entrepreneurial employees in entrepreneurial firms
(intrapreneurs). Another policy implication of our overview on highly educated
entrepreneurs is that it may be worthwhile to distinguish between solo self-
employment and employer entrepreneurship in entrepreneurship education programs,
as these two forms of entrepreneurship require different skills and attitudes, and
highly educated individuals with entrepreneurship ambitions seem to deliberately
choose for either one form or the other.
Somewhat surprisingly, the level of product innovation among highly-educated early-
stage entrepreneurs in the Netherlands was found to be only marginally higher when
compared to their lower educated counterparts. More research is needed to explain
this finding. Finally, regarding happiness, it was found that general human capital
obtained through formal education may lead to (unrealistically) high expectations,
which may not always materialize in practice. This, in turn, may contribute negatively
to entrepreneurial satisfaction. On the other hand, specific human capital directly
related to the operation of the business may positively contribute to satisfaction levels
of entrepreneurs.
Sixth, regarding women entrepreneurs, one third of entrepreneurs (including
incumbent, young business and nascent entrepreneurs) in the Netherlands are
women. With this proportion, the Netherlands rank seventh in Europe. Expressed as a
percentage of the active female labour force, 11% were entrepreneurs in 2012,
compared to 18% for men. This female rate of 11% corresponds to the ninth rank in
the EU-28. One out of five female entrepreneurs in the Netherlands in 2012 were
employers and the remaining entrepreneurs were solo self-employed. The share of
employers among female entrepreneurs in the Netherlands is lower than the EU-
average although some catching up has been observed since 2008. Female
entrepreneurship in the Netherlands is characterized by an exceptionally high share of
part-time entrepreneurship (64%). This feature combined with the low share of
employers makes that the contribution of women entrepreneurs to job creation in the
Netherlands is relatively limited. Instead, female entrepreneurship in the Netherlands
seems to contribute more to participation of women in the labour force and in society
(i.e., female entrepreneurship contributes to an inclusive economy). Regarding
characteristics, women entrepreneurs in the Netherlands are on average slightly
younger than men entrepreneurs and the average education level is higher for women.
Perhaps remarkably, in 2012 the mean net income of women entrepreneurs was
higher than that of men entrepreneurs. The main motivations for women to start an
enterprise are work-life balance, income and personal development.

113
Seventh, regarding inclusive entrepreneurship there is no common definition available,
yet in this report we focused on youths (18-24 years of age), migrants and people
with disabilities. Regarding youths it was found that the rate of early-stage
entrepreneurship among the age category 18-24 in the Netherlands was slightly
higher than the average of innovation-driven economies. On the contrary, the Dutch
rate of established entrepreneurs in this age category was far below average.
Regarding migrants, it was found that in the Netherlands, a considerably lower
proportion of the immigrant population is an entrepreneur, compared to the
indigenous population (Smit et al., 2014). On average, businesses of ethnic
entrepreneurs tend to be somewhat smaller. Regarding people with disabilities,
although no specific data for the Netherlands was available, international data showed
that the prevalence of self-employment was higher among people with disabilities than
among people without disabilities. This suggests that, particularly among people with
disabilities, entrepreneurship is an appropriate vehicle for labour market participation.
Indeed, in general, and almost by definition, the main contribution of inclusive
entrepreneurship is its effect on autonomy and participation. This does certainly not
rule out the possibility that inclusive entrepreneurs also have an important economic
contribution. However, data on the performance of inclusive entrepreneurs are rather
limited. Finally, although it seems clear that public policy has an important role to
play in stimulating inclusive entrepreneurship, more research is required on how
exactly this role should take shape. What is clear though is that an appropriate design
of the social security system is important in creating the right incentives for people
with a distance to the labour market to participate.
From our empirical overview of these seven types of entrepreneurship in chapters 3
through 9, as well as from our general discussion in chapter 2, it has become clear
that many different types of entrepreneurship may contribute to value creation. It also
became clear that these different types contribute in different degrees to different
types of value creation, i.e., to the various outcomes of the extended entrepreneurial
ecosystem as developed in Figure 2 of this report.
While some types seem to contribute more to economic goals (e.g., ambitious
entrepreneurship), other types contribute more to societal goals (e.g., inclusive
entrepreneurship). This implies that, if governments consider stimulating certain types
of entrepreneurship, they have to carefully consider which type of value creation they
are aiming to increase.

114
figure 26 Main roles, intermediate linkages and final economic and societal contributions of six entrepreneurial types
Notes: TEA (total early-stage entrepreneurial activity) is defined as the number of adults that are either actively involved in starting a new venture or are the owner/manager of a business that is less than
42 months old. Peer economies are defined as innovation-driven economies (ambitious, green, higher educated, and youth entrepreneurship), OECD countries (solo self -employment) or EU-28 (women
entrepreneurship). For exact definition of ‘green’ entrepreneurs: see chapter 5, table 6.

115
We conclude with some suggestions for future research. First, in this report seven
types of entrepreneurship were explored in some detail but clearly, it is relevant to
explore other types of entrepreneurship as well. Second, although we distinguished
between economic and societal contributions of entrepreneurs, our exploration into
societal contributions has admittedly been less extensive in nature. In particular,
future research should pay more attention to the roles of different types of
entrepreneurship in promoting a green economy and in achieving job satisfaction and
life satisfaction. Third, by comparing entrepreneurship indicators for the Netherlands
with other countries, we implicitly used the country as the spatial unit of observation.
However, entrepreneurial ecosystems may exist at different levels of spatial
aggregation, including cities (Koladkiewicz and Cieslik, 2014), regions, countries, and
supra-national zones and/or areas. These levels are often interconnected in the sense
that policy at the country or supra-national level may influence the local
entrepreneurial ecosystem as well (Stam, 2014, 2015). Future research should study
the links that exist between entrepreneurial ecosystems at these different levels, and
the role of public policy.
Literature
Burke, A. and Cowling, M. (2015), The use and value of freelancers: The perspective
of managers, International Review of Entrepreneurship 13(1), 7-20.
Daunfeldt, S.-O. and Halvarsson, D. (2015), Are high-growth firms one-hit wonders?
Evidence from Sweden. Small Business Economics 44(2), 361-383.
De Kok, J.M.P. and Span, T. (2014), Ageing and entrepreneurship across Dutch
regions, EIM Research Report H201409, Zoetermeer: Panteia/EIM.
De Vries, N., Liebregts, W. and Van Stel, A. (2013), Explaining entrepreneurial
performance of solo self-employed from a motivational perspective, EIM
Research Report H201308, Zoetermeer: Panteia/EIM.
Hébert, R.F. and Link, A.N. (1989), In search of the meaning of entrepreneurship,
Small Business Economics 1, 39-49.
Koladkiewicz, I. and Cieslik, J. (eds.) (2014), Shaping Local Business Communities,
Warsaw: Kozminski University, Center for Entrepreneurship.
Smit, L., Span, T., Bruins, A. and Doove, S. (2014) De economische bijdrage van
etnisch ondernemerschap, Utrecht: FORUM, Instituut voor Multiculturele
Vraagstukken.
Stam, E. (2014), The Dutch Entrepreneurial Ecosystem, Utrecht: Birch Research.
Available at SSRN: http://ssrn.com/abstract=2473475 or
http://dx.doi.org/10.2139/ssrn.2473475
Stam, E. (2015), Entrepreneurial ecosystems and regional policy: A sympathetic
critique, European Planning Studies 23(9), 1759-1769.
Stam, E., Bosma, N., Van Witteloostuijn, A., De Jong, J., Bogaert, S., Edwards, N. and
Jaspers, F. (2012), Ambitious Entrepreneurship: A Review of the Academic
Literature and New Directions for Public Policy. Report for the Advisory Council
for Science and Technology Policy (AWT) and the Flemish Council for Science
and Innovation (VRWI).
Van Stel, A., Wennekers, S. and Scholman, G. (2014), Solo self-employed versus
employer entrepreneurs: Determinants and macro-economic effects in OECD
countries, Eurasian Business Review 4(1), 107-136.


117
The results of Panteia/EIM's Research Programme on SMEs and Entrepreneurship are
published in the following series: Research Reports and Publieksrapportages. The most recent
publications of both series may be downloaded at: www.entrepreneurship-sme.eu.
Recent Research Reports and Scales Papers
H201417 28-04-2015 Investigating the impact of small versus large firms on
economic performance of countries and industries
H201416 28-04-2015 Do firm owner’s individual characteristics moderate the
relationship between firm age and owner’s earnings?
H201415 23-01-2015 Kenniscreatie via tijdelijke samenwerking
H201414 23-01-2015 Arbeidsmobiliteit tussen grootteklassen
H201413 23-01-2015 Is there a risk of growing fast? A study of the relationship
between firm growth and firm exit
H201412 24-12-2014 The age distribution of commercial versus non-commercial
entrepreneurs
H201411 18-12-2014 The impact of the 2008 financial crisis on European
enterprises: the role of innovation systems
H201409 27-11-2014 Ageing and entrepreneurship across Dutch regions
H201408 11-11-2014 Emerging industries! Connected Health, Local Exchange
Trading Systems and Flexible Office Spaces
H201407 14-10-2014 Global Entrepreneurship Monitor The Netherlands 2013
H201406 20-05-2014 Twee mythes over ondernemerschap ontrafeld
H201405 11-06-2014 What drives environmental practices of SMEs?
H201404 25-04-2014 Bank loan application success by SMEs: the role of
ownership structure and innovation
H201403 20-05-2014 The Empirical Scope of User Innovation
H201402 03-04-2014 Scale effects in workplace innovations
H201401 20-03-2014 Verklaringen van de overlevingskans van bedrijven,
gestart door allochtone ondernemers
H201314 27-11-2013 Global Entrepreneurship Monitor The Netherlands 2012
H201313 25-10-1013 Emerging industries! Challenges in alternative dance,
tracking devices and fast casual dining
H201312 25-10-1013 FAMOS 2013 a Size-Class based Financial Analysis Model
H201311 7-08-2013 A Cumulative Production Structure Matrix for Dutch SMEs
H201310 4-07-2013 Belemmeringen, informele samenwerking en MKB-
bedrijfsgroei
H201309 4-06-2013 Start-up motivation and (in) voluntary exit
H201308 30-05-2013 Explaining entrepreneurial performance of solo self-
employed from a motivational perspective
H201307 23-04-2013 Entrepreneurial activity, industry orientation, and
economic growth
H201306 18-04-2013 Self-employment and Job Generation in Metropolitan
Areas, 1969-2009

118
H201305 7-03-2013 The impact of the economic crisis on European SMEs
H201304 4-03-2013 Learning from Entrepreneurial Projects: A Typology
H201303 3-04-2013 Wat drijft ondernemers om maatschappelijke
vraagstukken op te pakken? (Nederlandse samenvatting)
H201302 17-04-2013 Unraveling the relationship between the business cycle
and the own-account worker’s decision to hire employees
H201301 01-02-2013 Entrepreneurship education and self-employment: the role
of perceived barriers
H201219 14-01-2013 Firm resources, dynamic capabilities, and the early growth
of firms
H201218 12-02-2014 The relationship between entrepreneurial activity the
business cycle and economic openness
H201217 17-12-2012 The Environmental Regulation Paradox for Clean Tech
Ventures
H201216 17-12-2012 How does employment protection legislation influence
hiring and firing decisions by the smallest firms?
H201215 22-11-2012 The Production Structure of Small, Medium-sized and
Large enterprises in Dutch Private Enterprise -
Analysis by economic sector
H201214 22-11-2012 The Production Structure of Small, Medium-sized and
Large enterprises in Dutch Private Enterprise -
Analysis at the aggregate level
H201213 11-02-2013 Institutions and the allocation of entrepreneurship across
new and established organizations
H201212 11-10-2012 Solo self-employed versus employer entrepreneurs:
prevalence, determinants and macro-economic impact
H201211 11-10-2012 Disentangling the effects of organizational capabilities,
innovation and firm size on SME sales growth
H201210 1-10-2012 Do firm size and firm age affect employee remuneration
in Dutch SMEs?
H201209 1-10-2012 The risk of growing fast: Does fast growth have a
negative impact on the survival rates of firms?
H201208 13-09-2012 Investigating the impact of the technological
environment on survival chances of employer
entrepreneurs
H201207 10-06-2013 Start-Up Size Strategy and Risk Management: Impact
on New Venture Performance
H201206 21-06-2012 Ageing and entrepreneurship
H201205 21-06-2012 Innoveren in het consumentgerichte bedrijfsleven
H201204 16-02-2012 Time series for main variables on the performance of
Dutch SMEs
H201203 09-04-2013 Do small business create more jobs? New evidence for
Europe
H201202 19-01-2012 Trends in entrepreneurial Activity in Central and East
European Transition Economies
H201201 9-01-2012 Globalization, entrepreneurship and the region
H201119 2-01-2012 The risk of growing fast
H201118 22-12-2011 Beyond Size: Predicting engagement in environmental
management practices of Dutch SMEs