types of motivation and their use in the management of an
TRANSCRIPT

Types of Motivation and Their Use in the Management of an Organization
Svetlana Begarisheva
Bachelor Thesis 2011


ABSTRACT
This thesis deals with the motivation of the students with a previous work experience or
working while studying at the moment. It examines how motivation of the current sample
is different from other samples. The aim of the thesis is to show the importance of
motivation by considering the main motivation factors. Also the importance of needs and
goals has been brought for close examination. The thesis also covers employee
involvement.
Keywords:
motivation, motivation factors, sample, needs, goals, employee involvement

ACKNOWLEDGEMENTS
I would like to thank my supervisor Ing. Janka Ladová, Ph.D. for her support, advice, and
encouragement.

CONTENTS
INTRODUCTION ............................................................................................................... 8
I THEORY ....................................................................................................................... 9
1 LITERATURE REVIEW .......................................................................................... 10
1.1 Defining motivation ............................................................................................... 10
1.2 Motivation and management styles ....................................................................... 12
1.2.1 Taylorism vs. Likert’s group organization ..................................................... 12
1.2.2 Other management styles ................................................................................ 13
1.3 Intrinsic and extrinsic motivation .......................................................................... 14
1.4 Major motivation theories ..................................................................................... 15
1.4.1 Need-based theories of motivation ................................................................. 15
1.4.2 Process-based theories of motivation ............................................................. 18
1.5 Employee retention and intrinsic motivation ......................................................... 20
1.6 Summary ................................................................................................................ 21
II ANALYSIS .................................................................................................................. 23
2 METHODS .................................................................................................................. 24
2.1 Survey respondents ................................................................................................ 24
2.2 Sample characteristics ........................................................................................... 25
2.3 Questionnaire structure .......................................................................................... 28
2.4 Statement of the hypotheses .................................................................................. 29
2.5 Measurement methods ........................................................................................... 30
3 PRESENTATION OF RESULTS ............................................................................. 31
3.1 Results of the motivation questionnaire ................................................................ 31
3.2 Analysis of the survey subcategories ..................................................................... 33
4 DISCUSSIONS ............................................................................................................ 37
4.1 Extra income and working students ....................................................................... 37
4.2 Higher needs and goal-based motivation ............................................................... 39
4.3 Freedom and authority at work .............................................................................. 40
4.4 Job involvement ..................................................................................................... 41
CONCLUSION .................................................................................................................. 44
BIBLIOGRAPHY .............................................................................................................. 45
APPENDICES .................................................................................................................... 52

TBU in Zlín, Faculty of Humanities 8
INTRODUCTION
It has been an ideal prerequisite to afford people a special place in management. As Lee
Iacocca said “management is nothing more than motivating other people.” (Brainy Quote).
This may serve as a useful starting point for adequate management. In reality there is no
much room for balanced management as organizations apply their own principles. The
personnel is at risk of being downgraded. The worst case scenario is employee
absenteeism, high employee turnover, degraded employee morale. Moreover the personnel
has to be literally compelled to get to work. The rates of employee detention are remaining
at a sustainable level, which raises questions about the reasons for this pathetic
phenomenon. It has long been considered that the financial factor influences people's
decision to leave their jobs. However other studies alongside stick to non-financial factors,
others take middle of the road stand on these issues. One of the things that those numerous
studies have in common is that they draw a much broader picture of how motivation is
applied. Ways to prevent above mentioned problems seems to be centered on an individual:
teamwork, job enrichment and rotation are one of the multiple tools to turn unstable
management into balanced one.
The thesis aims at studying which factors lead to a higher motivation among employees.
Additionally, the demotivating factors have been touched on as well. Particularly the study
provides insights into motivation among students with previous work experience or
currently employed.
The paper starts with a description of the main motivation concepts and approaches with a
special focus on the hierarchy of needs. The chapter also draws on statistics about
employee detention and other key facts which are going to be used in the research findings.
The analysis part is intended to determine the motivation in a particular group; the results
are summarized in tables and charts.

TBU in Zlín, Faculty of Humanities 9
I. THEORY

TBU in Zlín, Faculty of Humanities 10
1 LITERATURE REVIEW
The objective of this chapter is to give insights to the concept of motivation by targeting
selected general approaches. Additionally the chapter aims at providing a reader with a
necessary background to capture the essentials of the superior management based on the
knowledge of motivation. Given the scope of the existing motivational theories, it is
worthwhile to stay on the track and at the same time to bring about one’s own standpoint to
the successful motivational leadership. This fact explains the variety of literature on how to
motivate people, while the theory itself doesn't get much coverage. Motivation is often
misconstrued in terms of favoring a particular motivational factor, taking motivation for
manipulation, complacence, and other distorted practices. In this respect the theory
overview prevents an entrepreneur from messing up with the basic terms.
1.1 Defining motivation
Vroom (1964, 6) defines motivation as “a process governing choices, made by persons or
lower organisms, among alternative forms of voluntary behavior.” Atkinson brings to light
physical aspects, suggesting that motivation is “the contemporary (immediate) influence on
direction, vigor and persistence of action” (1964, 2). Indeed, the word “motivation” comes
from the Latin word “movere” (movement). Baron as well relates motivation to a “force
that energizes behavior and directs it towards attaining some goal” (1983, 123). Campbell
and Pritchard (1976) conceptualize motivation as based on direction and persistence. The
above mentioned definitions view motivation as a driving force and can be easily
simplified under the famous Jim Rohn’s quote: “Motivation is what gets you started. Habit
is what keeps you going” (Quotes.Net). Jim Rohn is a renowned American motivational
speaker and author.
The concept of motivation is vital and actively applied in human resources management,
management in general, and especially performance management. Lee Iacocca (Brainy
Quote) suggests that basically there are three things that are most significant in any
business, those are people, products, and profits, and stresses that the human asset is
indispensable to the rest two things. If the success of the company depends on humans
rather than elaborate programs and robots, then it is a company’s first and utmost
responsibility to “treat people right” (Lawler 2003). Lawler (2003) once again emphasized
that employees form a valuable asset of the company. The vision of employees as an asset,
contrary to a sort of expense, can be traced back to early motivation theories, for example,

TBU in Zlín, Faculty of Humanities 11
McGregor’s theory Y. In general, the 21st century views people as “an asset that should be
valued and developed” and views teamwork and creative projects as predominant (Kohan
2003, 4).
Another angle of understanding motivation is its connection with the outcomes and
behavior. Employers and employees have their own outcomes. Employers are concerned
about productivity, professional competency, on-time results and much more. As for
employees, the outcomes consist of material (salary, bonuses) and non-material benefits
(promotion, flexible job schedules, increased status). Since it is a human nature to strive for
positive outcomes, motivation as such comes to the forefront. While stating all the
importance of rewarding outcomes, Deeprose (1994, 62) advances the need for supporting
the behavior as well: rewarding behavior motivates employees to fill the gap in their
abilities and spurs them to perfect. Wegmans Food Market with its motto “Employees first,
customers second” is distinguished for its “Eat Well. Live Well Challenge” program, no
smoking policies and other diverse programs that are really awarding and make a
noticeable improvement to the company image and employee ethics (Wegmans).
As it has been stated, motivation is followed by outcomes and is dependable on abilities.
Therefore, performance is ability multiplied by motivation (Maier’s distinguished formula,
cited by Whetten, 2000). Whetten finally says that motivation is desire multiplied by
commitment (Whetten, 2000). He also states that both ability and motivation are important
to achieve high outcomes: if a person has 100% of motivation and 75% of ability, the
results would be positive; but if the abilities form only 10% with the same amount of
motivation, the outcomes are not likely to be alright (Whetten 2007, 277). This might not
be true. One could take exception to this, but as a matter of fact most manual jobs don’t
need much of ability, since it is all about the same algorithm. To do manual jobs is one of
the toughest things unlikely to the common view. There needs to be high motivation and
personal endurance to do all those monotonous tasks. On the contrary abilities are essential
for a knowledge-based company, where the major concern is about losing talents and
where the high risk of “brain drain” exacerbates the situation.
Being an eager antagonist of routine, stoic, and restrained tasks, Jim Harris brings about the
concept of “heart power”: it is the core of an organization, once the heart power is evoked,
there is no need to constantly spur an employee to do a better job (Harris 1996). Needless
to say, it is as much invigorating as it is practical to transform the mundane tasks into
creative ones. The results seem to be promising and double. Harris (1996) assumes that to

TBU in Zlín, Faculty of Humanities 12
get the heart power awaken an assembly of the three things should be present: vision, the
balance between the family and work, and turning work to fun without any boredom. As
Voltaire notices “Work spares us from three evils: boredom, vice, and need.” (Great-
Quotes).
Over a long time the theories tried to explain motivation in terms if hedonism: all
organisms strive to increase pleasure and decrease pain (the pleasure – pain principle).
Weiner notes that “reward (pleasure) does not inevitably increase the likelihood of a
response, nor does punishment (pain) assuredly decrease the probability of the
reoccurrence of the punished behavior” (Weiner 1992, 356).
To a greater extent the transition from hedonism took place which gave an extensive
ground for further research and many motivation theories were formulated to perfect the
very concept of motivation.
To summarize, motivation carries the notion of movement, but it is not movement itself; it
has to be linked with abilities, behavior and performance (outcomes). It does bring pleasure
but it is not equal to pleasure, or satisfaction itself.
1.2 Motivation and management styles
“Management is about coping with complexity.” John Kotter (Great-Quotes). Motivation at
an organization with an elaborate hierarchy would certainly differ from the one with a
simplified management structure.
1.2.1 Taylorism vs. Likert’s group organization
The concept of scientific management, or Taylorism, was first launched by Frederic W.
Taylor (Bruno 2002, 147-149). Taylor catered to extreme uniformity and simplicity of a
work process (horizontal specialization), as well as the division of labor (intellectual and
manual tasks were separated, vertical specialization) (Bruno 2002, 148). The tasks were
tailored to the workers’ skills; the decision-making was left to managers who exerted
control. The working day was meant to be intensive, but short, with few breaks in between.
Taylor was the first man who proposed the concept of wage incentives, while there were
beliefs that “workers were simply production factors without any particular needs other
than the wages they earned” (Bruno 2002, 149). Motivation was perceived as secondary
means to get people to work. It was one-sided and conditioned: only high outputs deserved
the best lot. The remnants of Taylorism are still visible at some industries, like software

TBU in Zlín, Faculty of Humanities 13
and IT. With the data-driven society and the issues about human capital versus human
resources, the possibilities to downgrade to Taylor’s unification and his concepts of
motivation are likely to be high.
Rensis Linkert replaced control with self-control and supportive relationships. He believed
that the objectives of an organization can be fulfilled by linking together the company
sectors and commitment: each member serves a “linking pin”, each member contributes to
an organization directly or indirectly (Bruno 2002, 150-159). The major condition on the
way to motivation is the awareness of employees of their contribution to a company.
Linkert argued with Taylorism and claimed that employees have their needs and
preferences that employers should conform with (Bruno 2002).
Linkert defined four management styles with differing motivation: the exploitive –
authoritative system, the benevolent-authoritative system, the consultative system, the
participative – group system (accel-team). The first type is based on force and authority,
while the second style is distinguished by rewards, but with little interaction and teamwork;
consultative management has some extent of cooperation, teamwork; the ideal type is a
participative system where all parts, starting from top managers to lower workers, combine
their efforts in order to achieve the goals of the company (accel-team).
1.2.2 Other management styles
Motivation can only occur when there are objectives; there is no need to motivate people if
no goal is at sight. Peter Drucker (1955, 110) insisted on employees being aware of their
roles and responsibilities assigned to them. He focused on self-control which means
“stronger motivation: a desire to do the best rather than just enough to get by.”(Drucker
1955, 113).
In 1930-1940 Elton Mayo carried out a series of experiments to determine the impact of
work conditions (e.g. light conditions) on a person’s performance. The bottom line was to
show that motivation is dependent on improved working conditions. In general, the theory
laid the ground to so called Hawthorne effect: motivation is two-three times higher when
an employee feels singled out of the crowd. Therefore directing efforts to search for the
needs of an employee is a basic postulate that comes out from the Hawthorne studies (Pride
2009, 283). It should be emphasized those needs don't float around as such; they need to be
identified through questionnaires and that. Appropriately enough, the polls help to raise
awareness concerning motivation.

TBU in Zlín, Faculty of Humanities 14
Autocratic management incorporates a strict control where there is no place for motivation.
Is makes a contrast with paternalistic model of management, where an employer is the
center of a company just like the head of the family and his needs are a priority (Pride
2009).
1.3 Intrinsic and extrinsic motivation
Taylor and Linker didn’t probably operate with such terms as “intrinsic” and “extrinsic”. In
today’s literature their models are viewed as intrinsic and extrinsic correspondingly.
According to Ryan and Deci (2000, 55), intrinsic motivation “refers to doing something
because it is inherently interesting or enjoyable” and extrinsic motivation “refers to doing
something because it leads to a separable outcome.”
The word “intrinsic” itself associates with an internal nature. To be intrinsically motivated
means to have internal drives to perform an activity which is expected to deliver
satisfaction. According to Deci and Ryan, these innate drives include the needs for
competence and self-determination (2000, 32). Intrinsic drives don’t have a cyclical
character and they serve as an “energizer of behavior” (2000, 32). They also stated that
intrinsic motivation “exists within individuals, in other sense intrinsic motivation exists in
the relation between individuals and activities. People are intrinsically motivated for some
activities and not others, and not everyone is intrinsically motivated for any particular
task.” (Deci and Ryan 2000, 56).
Any person who is intrinsically motivated is under the influence of external factors as well.
Skinner’s operant theory suggested that rewards spur motivation, so for intrinsic
motivation the reward is an activity itself (Deci and Ryan 2000).
Extrinsic motivation is not a degraded and “selfish” form of motivation. There is just a
high distinction between intrinsic and extrinsic rewards. Two forms exist independently or
might affect one another. A lot of studies argue about the impact of external rewards on
intrinsic motivation, for example it's believed that when there are some material rewards,
intrinsic motivation is likely to increase, but not always (Cameron 1994).
What seems to be true for both forms of motivation is that the lower motivation is the
lower is the performance. Indeed, increasing motivation can lead to higher performance to
some point. This is the part one of the process studied by Yerkes and Dodson widely
applied to sport psychology. Moran mentioned this theory in his work “Sport and Exercise
Psychology” 2004. Dodson and Yerkes examined the ratio of arousal level and task

TBU in Zlín, Faculty of Humanities 15
difficulty. The premise made by scholars was something reminding the inverted U-shape
curve: when the arousal reaches the optimal point, so does the performance; then when the
arousal becomes abnormally high, the performance drops back (Moran 2004, 87). Another
finding was that the level of arousal depends on type of work: “the performance of difficult
tasks decreases as arousal increases” and vice versa (Moran 2004, 87). The opposite can be
as well: performance followed by rewards can lead to motivation.
Moran’s theory most likely undermines the existence of external rewards because as stated
intrinsic motivation doesn’t have a cyclical character. What matter is motivation in general
and not exactly the types of motivation, but people.
Cameron and Pierce (Cameron and Pierce, 1994) were among those who conducted the
research to find out the impact of external rewards on intrinsic motivation. The findings
were opposite to the numerous studies of the past years which advocated the detrimental
impact of extrinsic rewards on intrinsic motivation. But Cameron and Pierce proved
extrinsic motivation can accompany intrinsic motivation and have even a beneficial effect
(Cameron 1994).
But some extrinsic rewards and factors can affect intrinsic motivation in a less desired way.
Gagne and Deci (2005) stated that too much of surveillance lowers intrinsic motivation.
They referred to their self-determination theory where autonomy and freedom are among
the focal points: more freedom intensifies intrinsic motivation, and vice versa (Gagne and
Deci, 2005).
1.4 Major motivation theories
There have been a lot of research about what motivates an employee and a human being in
general, yet little is proved to be more or less objective.
1.4.1 Need-based theories of motivation
The hierarchy of needs makes the basis of the motivation questionnaire.
Maslow’s hierarchy of needs theory
Maslow (1943) identified the five vital needs: physiological needs, safety needs, love
needs, esteem needs, and self-actualization needs. In the practical part of the thesis, it is
shown how those needs can be placed to the work context, just like any other theoretical
approaches provided hereafter provided that the closer examination is needed. A human
possesses make the whole bunch of basic needs like food, drink, sleep, oxygen, shelter.

TBU in Zlín, Faculty of Humanities 16
Basically, what makes the physiological needs basic is their indispensable character for a
man. Moreover, they are prevailing needs, thus “a person who is lacking food, safety, love,
and esteem would most probably hunger for food more strongly than for anything else”
(Maslow 1943, 372). It certainly doesn't mean that people hunt for job merely for benefits
aimed at sustaining or improving their condition. Safety needs include the needs for
protection and security: they arise from the deprivation of the physiological needs. Maslow
gives an example of a child in a wrecked family or a family with high level of domestic
violence where fear, let alone the physical pain, causes the child feel deprived of safety
(Maslow 1943, 377). Love needs include a sense of belonging and affection. Esteem needs
include respect for oneself and others, and the recognition from others (Maslow, 1943).
Maslow summarized the self-actualization needs in one phrase: “What a man can be, he
must be” (Maslow 1943, 382). In other words, seeing more good qualities about oneself
than ever before is what makes self-actualization.
Maslow goes on further to say:
No claim is made that it is ultimate or universal for all cultures. The claim is made
only that it is relatively more ultimate, more universal, more basic, than the
superficial conscious desires from culture to culture, and makes a somewhat closer
approach to common-human characteristics, Basic needs are more common-
human than superficial desires or behaviors. (Maslow 1943, 390).
When physiological needs are satisfied completely, a person steps to another level – safety
needs and etc. Above all, Fisher notes there is always a link between the needs described:
It seems to me that our three basic needs, for food and security and love, are so
mixed and mingled and entwined that we cannot think one without the others. So
it happens that when I write of hunger, I am really writing about love and the
hunger for it, and warmth and the love of it and the hunger for it; and then the
warmness and richness and fine reality of hunger satisfied; and it is all one.”
M.F.K. Fisher, “The Art of Eating”
Douglas McGregor theory X and Y
Theory X basically comes from Sigmund Freud’s assertions on the nature of a man: he
tends to be initially lazy, lacking initiative, and needs to be constantly spurred. His theory
doesn’t allow any display of creativity or relative freedom at work. Theory Y is ascribed to
Douglas McGregor who has been an optimist in contrast with Sigmund Freud. McGregor
believed that “human growth is self-generated” (McGregor 1987, 26). McGregor
emphasized that power is not the only means to hold the leadership. When there is a strict

TBU in Zlín, Faculty of Humanities 17
control, there is little space to develop personally. He believed a man is initially morally
prepared to work and take responsibilities (McGregor 1987).
Later on Thomas Kohan compared the 20th
and 21st centuries: the 20
th century assumes
people as “a cost that must be monitored and controlled” and work as “segmented,
industrially-based, and individual tasks” (Kohan 2003, 4). The 21st century views people as
“an asset that should be valued and developed” and puts on the first place teamwork and
creative projects (Kohan 2003, 4). Theory Y, in contrast with the theory X, satisfies the
higher needs in Maslow’s hierarchy: self-actualization, esteem and social needs while
emphasizing “people’s maturity, creativity and the need for belonging, status and self-
fulfillment” (Palmer 1998, 174).
Herzbeg’s motivation hygiene theory
Herzberg brought about his theory about motivators (satisfiers) and hygiene factors
(dissatisfiers) (or two-factor theory). The motivating factors (satisfiers) are mostly the final
results, accomplishment, success, progress, recognition, competition, teamwork etc. The
absence of hygiene factors creates dissatisfaction. Among those factors are the company
policies, supervision, working conditions, salary, security, reputation, status, work
relationship. Palmer places the hygienic factors in the pyramid of needs below the esteem
needs; everything above is the motivator group (Palmer 1998, 174).
McClelland’s achievement motivation
McClelland found that motivation depends on the level of the need for achievement,
power, and affiliation (Moore 2010, 25). Achievement is the “success in competition with
some standard of excellence” (Moore 2010, 25). Thus achievement orientated people really
care about the quality of their work and the feedback. They welcome competition but reject
money as their primary goal. Those people who choose the need for power tend to like
exercising power and correspondingly taking senior positions. The need for affiliation
affects a person’s desire to interact and be a part of team. (Moore 2010).
Alderfer’s needs modified theory
This theory is also called ERG theory (Existence, Relatedness, and Growth). Existence
needs cover the physiological and safety needs in Maslow’s hierarchy; the Relatedness
needs refer to social and esteem needs, and the Growth needs is the highest among them all
as it refers to self-actualization needs. Alderfer modified Maslow’s hierarchy while
indicating that more than one need may be present; he doesn’t accept the strict hierarchy

TBU in Zlín, Faculty of Humanities 18
(Alderfer 1969). According to Alderfer (1969), when a high-order need is not satisfied, a
person turns to a lower need.
Motivation was considered in terms of needs; other theories (process-based) suggest that
motivation is “controlled by conscious thoughts, beliefs, and judgments” (Werner, 45),
rather than needs.
1.4.2 Process-based theories of motivation
Equity theory
Equity theory suggests that a person tends to feel over-paid or under-paid under certain
conditions. An Equity theory was first formulated at Adams’ work. It defined a referent,
inputs (training, effort, professional experience) and outcomes (salary, status, appraisal,
performance ratings, job responsibilities, promotions, work schedule, work load etc.).
(Adams 1965, 267-299). There is a tendency to underestimate one’s inputs and the rewards
you get for the work done. For example, for some it wouldn’t be fair to pay two consultants
the same salary if one is working part-time and another one full-time. Basically, it is based
on what seems to be fair for a person. Further actions depend on the personality type.
Huseman (1987) identified sensitives, entitleds, and benevolents. Sensitives prefer equal
ratios of inputs and outcomes, both his own and the referral’s. This matches the equity
theory by Adams perfectly because those who get equal outcome have fewer motives to be
disgruntled: both workers can have an equal pay and be alright with this. However entitleds
aspire for greater outcomes disregarding their inputs, thus they might have more “stress”
going around the problem. Benevolents, according to Huseman (1987), accept their lower
outcome less dramatic than entitleds. Huseman’s theory (1987) partly interconnects with
the achievement theory: most of the times achievement people work for feedback and not
for money.
There arise three types of justices: distributive, procedural, and interactive justices. Fields
(2002), after Greenberg (2001) defines distributive justice with “the extent to which an
employee believes that his or her work outcomes, such as rewards and recognition, are fair”
(Fields 2002, 170). Procedural justice connects with the decision-making process: if the
demands were satisfied or not. At last, interactional justice is about the respect and general
dignity.
Vroom’s expectancy theory

TBU in Zlín, Faculty of Humanities 19
Expectancy theory has three elements: expectancy, instrumentality, and valence (Vroom,
1964).
Expectancy element is the relationship between efforts and performance: whether high
efforts can lead to productive performance (Green 1992, 2). Instrumentality is understood
as whether high performance causes high outcomes. If the outcomes are accepted with
satisfaction, then it’s all about valence (Green 1992, 2-3). Therefore expectancy theory
bases itself on the premise that there is an interconnection between efforts, performance,
outcome, and satisfaction. Motivation mainly comes with satisfaction and the whole cycle
repeats. For example, satisfied employees at the car factory can get the free driving pass
and then they are given further incentives, e.g. a discount to buy a car. Green notices that
motivation doesn’t guarantee high performance. “Motivation and effort are required for
performance, but alone do not guarantee it” (Green 1992, 5).
Performance = f (effort, skill, environment)
Effort = f (motivation)
As Green (1992) suggests, performance is the function of effort, necessary skills and
environment (working conditions, schedule etc.); effort is the function of motivation,
whereas motivation is the function if the three elements of the expectancy theory.
Porvazník specifies other motivation factors such as notion of work, influence of other
people, compliments and criticism (Porvazník 1941, 186). According to Porvazník (1941),
the notion of work is to be in accordance with the company’s vision.
Knowledge of this gives the opportunity to affect expectancy, instrumentality, or
valence for employers.
Reinforcement theory
Reinforcement theory holds that “behavior that is rewarded is likely to be repeated,
whereas behavior that is punished is likely to recur” (Pride 2009, 287). This theory takes it
origin from Skinner’s studies on operant conditioning (Skinner 1953) where he suggested
the effect of the reinforcement stimulus. He practically proved his studies first on rats with
his famous Skinner box (Skinner 1953).
According to Lussier (2008) there are four reinforcement methods such as positive
reinforcement, avoidance (or negative reinforcement), punishment, and extinction. Positive
reinforcement includes feedback, bonus, a few extra days off. Negative reinforcement
exists when a negative factor exists, such as constant reminder to an employee to do his/her
job which may be effective or not. Another example is that a soon-leaving employee avoids

TBU in Zlín, Faculty of Humanities 20
the consequent troubles by informing the employer about his leave decision beforehand.
Punishment is used to “decrease the undesired behavior” (Lussier 2008, 399). It may come
in the form of fines, infractions, the written notice, discussing the matter under the general
committee. Extinction is defined as “withholding reinforcement when an undesirable
behavior occurs”, specifically ignoring (Lussier 2008, 399).
1.5 Employee retention and intrinsic motivation
Looking back to the year 2010, one could see a certain leak in the human management.
According to the Deloitte/Forbes Insight Survey, released on Dec.8, 2010 “Talent Edge
2020”, found the lack of the personnel possessing R&D skills (Research and Development)
and executive leadership.
A brief summary of the results: 40% shortage of R&D talent – technology, media, telecom
industry; 39% consumer/industrial companies; 37% life science and healthcare.
56% executives admitted the average shortfall of leadership skills, while 63% are highly
concerned about employee retention. 64% of the companies surveyed are open and show
the desire to hire professionals worldwide (Deloitte).
The demand for special skills had been captured in the Czech republic as well, when in
2007 the Research Institute for Labor and Social Affairs and Masaryk University Brno
have released the statistics regarding foreign workers: 327 specialists, 224 administrative,
technical, and accounting work. 652 manual workers also were a part of the survey
(EWCO). That supports the fact that technical professional skills are more welcomed than
sales and administrative skills. The survey found that the workers were motivated to some
degree, also with a disadvantage: 23% of employers provide further training and education
to foreigners, compared with 37% doing the same to native workers (EWCO).
The bottom line the increasing number of companies is finally getting to broaden the
definition of an equal employer. What caused the decreased number of professionals?
Among those factors are cracked economic situations, the urge to cut the budget and
respectively to reduce the costs directed to research, the lack of financial and moral
support. If the quantity was the only factor for prosperity, then the whole system would
have been trapped under over-production and an increase of public demand. As it has been
stated by Kathleen Brush, there should be “a dual focus on driving productivity”, indeed
3% automation, 97% leadership (Brush 2010). These figures don’t happen to be real for the
past decades.

TBU in Zlín, Faculty of Humanities 21
What would come after blocking the non-routine workers and stranding them from other
work groups? The first thing that comes to mind is the illegal ventures. As in the popular
film “Jingle All the Way” the Santas of different background formed sort of illegal venture;
it might have been possible to direct the potential into doing something legal in real.
Absolutely, motivating people and giving them a sort of freedom prevents a company from
turning into a worm depending on the public demand. It has been stated there should be an
internal drive at any company. For example, it can be a drive for commitment which is the
general outcome of motivation (intrinsic motivation). (Thomas 2000).
Commitment enhances motivation and increases employee productivity, counting to
organizational performance. According to Thomas, there are four intrinsic rewards: a sense
of choice, a sense of competence, a sense of meaningfulness, a sense of progress. A sense
of choice lets people select what they are interested in and make sensible choices therefore.
Competence is all about a sense of accomplishment about a done task. Meaningfulness is
about being adherent to the task. Progress is about a feeling of contribution and that your
efforts really lead to the advancement of an organization (Thomas 2000).
The motivation yields commitment. Management, in general, is a kind of practice of
throwing the boomerang: investing motivating people gives back commitment. According
to the survey by Watson Wyatt, companies with highly committed workers deliver much
higher returns to shareholders. The exact numbers can be seen in the full survey (Watson
Wyatt). High commitment – 112% for three years, average – 90%, low – 76%
Certainly commitment is not enough to retain employees. They should understand the
essence of their work and what core values they are helping to create. Communication is
another cost effective solution. According to another survey Communication ROI Report
companies “good communicators” had 47% higher returns over the last five years than
companies with stumbling communication (towerswatson).
1.6 Summary
It seems to be an easier option to blame the majority of leaders for their insufficient
motivation skills and marginalizing motivation in general. When autocracy entered the
management, the new style of an autocratic management emerged as mentioned previously.
The theoretical part was intended to show that apart from poor leadership skills, there are
individual characteristics on the other side of the scale which result in anyone being
motivated or less motivated. This stress on individual can be found in many motivation

TBU in Zlín, Faculty of Humanities 22
theories (Maslow's hierarchy of needs, McClelland achievement motivation and others).
The theories of motivation have led to understanding that types of motivation revolve
around individual and intrinsic rewards should be studied in particular. These views were
the result of the previous studies and also were accelerated with decreased employee
retention rates and high turnover costs.
Since motivation is about the pursuit of a driving force, various motivation factors should
be studied particularly. Understanding of motivation types is essential for developing
motivation strategies that last. It is vital to have all parts of organization function together,
and motivation has become an inseparable part of any management.
Motivation types should be immune to any bias, for example motivation and manipulation.
The dynamic nature of motivation was stated in this aspect to differ it form any other
misinterpretations.
Commitment and communication help to battle high employee turnover as supported by
case studies and polls.

TBU in Zlín, Faculty of Humanities 23
II. ANALYSIS

TBU in Zlín, Faculty of Humanities 24
2 METHODS
This chapter intends to report on the preliminary preparations for the survey and describe
the research tools utilized. The identification of the respondents, a summary of the most
relevant statistic methods, and the hypotheses have been drawn together under this chapter.
It is vital for the survey to be valid in order to get accurate and reliable results.
2.1 Survey respondents
Thompson (2002, 1) defines sampling as, “selecting some part of a population to observe
so that one may estimate something about the whole population.” The survey was
administered to thirty part-time/full-time students of the Tomas Bata University in Zlín
who are proceeding further beyond a bachelor's or master's degree. The participants were
selected on a random and voluntarily basis which was done deliberately for the purpose of
proving the hypotheses of this study. All the respondents have previous work experience or
working while studying. Another reason for the present sample selection is to bring about
more objectivity and diversity to the research conducted. The students have been employed
with different companies, which certainly widens the scope of the research. To deal with a
specific company would be irrelevant as it increases the risk of ambiguity and therefore
unreliable results with regard to the topic of the study.
Among the major prerequisites of the questionnaire is a proper and succinct formulation of
the questionnaire items, which in no manner should affect the respondents' thinking. In this
regard the sampling is distinct from a simple experimental design which tests the sample
on an effect produced by an action (Thompson 2002, 1). Thompson (2002, 2) also
separates observational studies which have its data “observed by happenstance,
convenience, or other uncontrolled means “unrepresentative”. In this case the survey is
certainly not observational because it happened on an agreed date and wasn't simultaneous.
Another objective of the survey was to maintain the response rate as high as possible by
eliminating distracting factors, such as excessive noise and time pressure. Since the length
of the survey was far from short, each of the respondents confirmed that the time allotted to
fill in the questionnaire was sufficient. The primary goal was to bring down the NR (no
response) rate to a minimum, and this goal was handled as the percentage of the non-
response items was kept at minimum at 4.1%. Human errors were also taken into account,
such as the items marked twice.
The participants and the area of work remained anonymous.

TBU in Zlín, Faculty of Humanities 25
The Code of Standards and Ethics for Survey Research (CASRO) may be efficiently used
in any survey of this kind. The code summarizes some of the points mentioned above and
says that the participants should be:
a. willing participants in survey research; b. appropriately informed about the
survey's intentions and how their personal information and survey responses will
be used and protected; c. sufficiently satisfied with their survey experience; d.
willing to participate again in survey research. (CASRO: The Voice and Values of
Research.)
Confidentiality is what makes a real research. At the end of the survey the respondents
were welcomed to give a feedback.
2.2 Sample characteristics
The background of the recipients is represented in a graphical format.
17
13
0
2
4
6
8
10
12
14
16
18
Male Female
Male
Female
Figure 1. Gender distribution of the sample
Figure 1 represents the gender distribution of the sample of students. The figure indicates
that the majority of the sample are men (56.7%, or 17), and the remainder are females
(43.3%, or 13). The willingness of men to participate in the survey is more likely explained
by random circumstances, however Foster Thompson admitted that there has been a lack of
focus on the personal characteristics of the survey takers: his research found that identical
twins are less willing to take research than fraternal twins,. That spurred the further
research on how predisposition to take surveys varies between males and females
(Thompson 2011).

TBU in Zlín, Faculty of Humanities 26
13 13
3
0
2
4
6
8
10
12
14
21-30 31-40 41-50
21-30
31-40
41-50
Figure 2. Age distribution
As can be seen from the figure, the same number of respondents is observed for the age
categories of 21-30 and 31-40 (44.8%, or 13). Only 3 respondents aged 41-50 participated
in the survey. There were no respondents of the minimum and maximum age ranges (under
20 and over 50). One participant didn't mark his age. The age differences are explained
with the fact that most of the respondents are still continuing their education.
As it has been observed in the theoretical part, the motivation and goals are interconnected.
Juniors might be more goal-oriented as they start working, that's why this age range (21-30)
and (31-40) are of a particular interest as well. However concrete conclusions are drawn on
the data and statistics. In general, any company should have senior workers as well;
otherwise that is the violation or even age discrimination. According to the Australian
newsletter not only people above 40 complain of “ageism”, younger employees have also
been ignored in job hunting because employers think they are too young and inexperienced
(Smart Manager).

TBU in Zlín, Faculty of Humanities 27
2
20
7
10
5
10
15
20
<1 1 to 5 6 to 10 >10
<1
1 to 5
6 to 10
>10
Figure 3. Experience distribution
About 67% (20) of the respondents have worked at a company for 1-5 years. 7 participants
(23.3%) indicated work experience exceeding 5 years but less than 10. Only one
respondent had work experience more than 10 years.
Experience contributes a lot to the validity of the results on motivation as participants
before starting a work career might look at motivation and motivation factors from a
different angle. The initial viewpoints are more likely to be raw.
23
1
5
0
5
10
15
20
25
S B M
Secondary
Bachelor
Master
Figure 4. Education distribution
Without experience there is no a right understanding of motivation, and without motivation
any experience fails to be important (Nobilis, 2008). 79.3% or 23 respondents with
secondary education comprised the majority. The remaining 5 students (17.2%) already got

TBU in Zlín, Faculty of Humanities 28
their master degree and only 1 participant indicated possession of a bachelor's degree. One
non-response was observed as well.
16
10
3
0
2
4
6
8
10
12
14
16
SP LM C/A
Specialist
Line manager
Clerical/Admin.
Figure 5. Job category distribution
As seen from the chart, the majority of the respondents (55.2%, or 16) worked as
specialists, 10 respondents (3%) as line managers; there were only 3 respondents who
occupied administration/clerical posts.
To avoid mixing up with two terms (line manager and specialists), the definition is
provided: “someone who is responsible for managing someone else in a company or a
business; one of the managers who are responsible for the most important activities of a
large company, such as production.” (Cambridge Advanced Learner's Dictionary Online,
s.v. “Line manager”). It's obvious that specialists is a contrast group, because they provide
services to line managers.
Due to an insufficient number of recipients with administration/clerical positions, this
group hasn't been considered in details.
In this section, the background information about the recipients was presented in the form
of charts. Some of these data were used in the findings.
2.3 Questionnaire structure
In the course of the survey the respondents were asked to complete a 43-item questionnaire
with a five point scale employed by Likert (See Appendix 1). The respondent was asked to
rate the importance of the items included in the questionnaire by circling one item. The
range of responses varied from 1 to 5 (1 “unimportant”, 2 “not so important”, 3 “somewhat

TBU in Zlín, Faculty of Humanities 29
important”, 4 “important”, and 5 “very important”). A biographical questionnaire (work
experience, age, gender, job category and education background) was also included in the
survey.
The items of the questionnaire were presented in a seemingly detached and chaotic order.
For the research purposes, they had been previously sorted out into five subcategories: the
factors related to the physiological, security, social, esteem and self-actualization needs. As
it was stated, the results are based on the hierarchy of needs (See Maslow's Hierarchy of
Needs). The respondents were unaware of the subcategories but informed of the general
theme of the survey, as it is one of the regulations of the The Code of Standards and Ethics
for Survey Research (CASRO) (See 2.1 Survey respondents). They were also asked to fill
in the questionnaire at a definite point of time, which is the 28th
February, Monday. This is
a one take survey which aims at immediate results. It should be mentioned that some
surveys apply a technique of asking the same questions at two or more points of time. That
has been a part of comparable experimental and longitudinal survey designs which are
found to be less cost effective than traditional questionnaires. Another setback is the risk of
losing the valuable data as with the time and numerous survey phases some pieces of
information may become obsolete (De Vaus 2001). This approach is good for those who
want to proceed with the further research, drawing on data obtained at different times.
The questionnaire items mostly represent noun phrases as it makes them more readable and
laconic. The aim was to get the imminent reaction rather than getting respondents to rack
the brains over the complicated question structures. Thompson's books on survey serves as
an excellent manual for advanced survey makers (Thompson 2002).
The proportion of the items in each subcategory was almost equal (13:12:12:12), Some
esteem items may also fall into a self-actualization group and vice versa.
2.4 Statement of the hypotheses
(1) Earning additional income is one of the main motivating factors for students who work
while studying. Extrinsic motivation is as essential as intrinsic motivation.
(2) There is a significant relationship between self-actualization needs and motivation. The
basic needs tend to matter less for the working students than self-actualization needs.
(3) Freedom and authority at work are the most significant factors for most respondents.
(4) Motivation based on gender, age, and job category is almost similar.
(5) Teamwork plays an important role in motivating.

TBU in Zlín, Faculty of Humanities 30
2.5 Measurement methods
The survey employed also called Likert scale developed by Rensis Likert in 1932. The
respondents were asked to rate items by using the following abbreviations: U
(“unimportant”), NI (“not so important”), SI (“somewhat important”), I (“important”), VI
(“very important”). The grades 1-5 were given correspondingly. The Likert scale varies
depending on the research design and research goals. One can regularly find a scale with
“undecided” or “neutral” in it. There have been some debates over whether to include
“undecided” to the scale. Respondents don't need to be impelled to give an answer (Ary
2009, 208-211). However they are encouraged to give their takes. If the survey is organized
voluntarily and it is known that the respondents are quite responsive, there is no need to
include “undecided” in a scale. The decision is finally left after the survey maker, because
the diversity has always been appreciated and if all the surveys followed the same structure,
there wouldn't be any interest and motivation to take them.
The data collected were entered into the Statistical Package for the Social Sciences (SPSS)
version 12 and analyzed using the frequency analysis. This software is unique by its
multiple features that allow an advanced research go further than just measuring the
frequency (multiple regression analysis, chi-squares, log-linear analysis, etc. (Pearson).
The enhanced intake of inferential statistics methods is what makes the SPSS a powerful
research tool.
As for descriptive statistics, it is also used to consolidate large amounts of information
(Thompson 2002). Calculating a simple frequency, means and standard deviation are good
examples of descriptive statistics:
Standard deviation uses the mean of the distribution as a reference point and
measures variability by considering the distance between each score and mean. It
determines whether the scores are generally near or far from the mean … In
simple terms, the standard deviation approximates the average distance from the
mean. (Gravetter 2008, 109).
The study uses mainly descriptive statistics as it deals mainly with one sample of working
students.

TBU in Zlín, Faculty of Humanities 31
3 PRESENTATION OF RESULTS
This chapter reports on the results of the survey. All the data have been previously double
checked. The data are entered into tables for a better view. The analysis of variables, such
as education, job, age, gender, and job category are included as well.
3.1 Results of the motivation questionnaire
The means and standard deviations were calculated for each of the questionnaire item. This
process was facilitated with the use of the above mentioned SPSS software. The missed, so
called “no response, or non-response” items were also taken into consideration, while
calculating the means and standard deviations.
In the left column VAROOO... stands for the questionnaire item, for example VAR00021
refers to the questionnaire item number 21 (“promotion”), etc.
The full table is given in the appendix (See Appendix 2).
After sorting out the data in an ascending order, the variables with the lowest and highest
means were identified. The factors with the highest and lowest means have been
summarized in the table below:
Table 1. Selected factors in an ascending order
No.a
Mean SDb
29 Company softball outings 2.14 1.079
42 Security guards, building patrols 2.21 1.146
6 Good canteen 2.33 1.241
16 Job stress consultants 2.38 1.237
43 Good performance feedback 4.03 .778
34 Trust in making decisions 4.03 .778
36 Working on projects on your own 4.10 .673
18 A higher salary 4.13 .900
2 Responsibility for the work done 4.14 .789
37 Importance of your opinion 4.14 .693
13 Extra money 4.23 .679
4 More freedom/authority at work 4.24 .636
aNo. refers to the numbered list of the questionnaire items.
bSD=Standard Deviation

TBU in Zlín, Faculty of Humanities 32
Those are the immediate results of the survey with the majority of respondents placing
extra money and more freedom/authority at work on the highest level (with the means of
4.23 and 4.24 correspondingly). The less mean is, the less motivated the respondents were
about the other factors. The items, such as softball outings, security guards/building
patrols, good canteen, job stress consultants received the lowest means, and therefore they
were less attractive for the current sample of the survey. Good performance feedback and
trust in making decisions have equal means of 4.03. Working on projects on your own,
passion to contribute, a higher salary, responsibility for the work done and importance of
your opinion were evaluated in a mean range of 4.10 – 4.14.
The standard deviation for the last eight factors varied from 0.6 to 0.8. That says the
participants voted almost wholeheartedly to approve the items. But there was a
considerable disparity in responses which received the lowest means. The respondents
might have had their own takes on the questionnaire items. This tendency is shown by the
rate of variance in the table below:
Table 2. Range, minimum and maximum of the selected items
No. Range Min.a
Max.b
Var.c
29 Company softball outings 4 1 5 1.164
42 Security guards, building patrols 3 1 4 1.313
6 Good canteen 4 1 5 1.540
16 Job stress consultants 3 1 4 1.530
1 Adequate working hours 3 2 5 1.154
43 Good performance feedback 3 2 5 .606
34 Trust in making decisions 3 2 5 .606
36 Working on projects on your own 2 3 5 .453
18 A higher salary 3 2 5 .809
2 Responsibility for the work done 3 2 5 .623
37 Importance of your opinion 3 2 5 .480
13 Extra money 2 3 5 .461
4 More freedom/authority at work 2 3 5 .404
aMin. refers to the minimum rating
bMax. refers to the maximum rating
cVar. Variance

TBU in Zlín, Faculty of Humanities 33
As can be seen, the variance decreases towards the item number 4.
Table 3.2 (See Appendix 3) compiles the total ratings of the scale from “unimportant” (I)
to “very important” (VI). There were no negative responses for the items 4 (more
freedom/authority at work), 6 (good canteen), 13 (extra money), 15 (participating at project
contests within the company), 36 (working on projects on my own). Some items got either
one “unimportant” or one “not so important” rating: 18 (a higher salary), 37 (importance of
your opinion), etc. The entries with the rating “very important” are 18 (a higher salary), 13
(extra money), 4 (more freedom/authority at work), 2 (responsibility for the work done).
Some of the primary results with one of the ratings more or equal to 15 can be shown on
the chart.
16
10
16
5
15
11
18
3
16
8
16
8
18
8
0
2
4
6
8
10
12
14
16
18
4 8 13 25 27 36 37
I
VI
Figure 6. The top ratings of the selected questionnaire items
4 (more freedom/authority at work), 8 (more recognition), 13 (extra money), 25
(medical&vision, and dental insurance), 27 (work content), 36 (working on projects on
your own), 37 (importance of your opinion). Some of the items also received no negative
responses (such as freedom/authority at work and working on projects on your own).
For the full picture of the ratings refer to the table 3.3 (See Appendix 3).
The results don't indicate that the respondents are not motivated about some factors. They
are just motivated less.
3.2 Analysis of the survey subcategories
As it has been mentioned in the thesis, the questionnaire items had been previously sorted
into five groups (factors corresponding to physiological, security, social, esteem, and self-
actualization needs). In the previous part the individual factors that were more or less

TBU in Zlín, Faculty of Humanities 34
relevant for a survey participant have been identified. This section shows the overall
subcategory rating.
Table 3. Subcategories analysis
Means
Physiolog. a3.13 3.40 2.33 2.47 4.23 4.13 3.54 3.25 2.86 3.33
3.27
Security b3.03 2.38 2.79 3.20 3.12 3.25 3.13 2.21
2.89
Social c3.31 3.30 3.97 3.97 3.63 3.60 3.52 2.14
3.44
Esteem d4.14 2.87 3.73 3.40 3.25 4.03 3.59 4.03
3.63
Self-Act. e4.24 3.93 3.87 3.83 3.48 3.43 3.37 4.10 4.14
3.83
aRefers to the questionnaire items adequate working hours, the opportunity to have paid holidays,
good canteen, a smoking ban at a workplace, extra money, a higher salary, work content, a
separable and enclosed office.
bRefers to injury and illness prevention programs, job stress consultants, medical&vision, and
dental insurance, job security, grievance procedures, retirement benefits, no stress at work,
security guards/building patrols.
cRefers to opportunities to travel, a strong influence among others, feeling of being accepted
within the company, good relations with supervisors, teamwork, assisting colleagues when
needed, companionship at the company, company softball outings.
dRefers to responsibility, job title, promotion, being aware of the objectives of the company, trust
in making decisions, free communicating of your views, good performance feedback.
eRefers to freedom/authority at work, job enrichment/job rotation, more recognition,
participating at project contests within the company, aiming at excellence at work, achievement
orientation, passion to contribute, working on projects on your own, importance of your opinion.
In this table the means and standard deviations for each subcategory have been calculated.
The categories can be put in order of significance: Self-actualization (3.83), Esteem (3.63),
Social (3.44), Physiological (3.27), and Security (2.89).

TBU in Zlín, Faculty of Humanities 35
3,31
3,42
3,36
3,44
3,31
3,2
3,25
3,3
3,35
3,4
3,45
Male/Female SP/LM
Male
Female
21-30
31-40
SP
LM
Figure 7. Means for gender, age and job categories
The average means of the responses within each group (males and females, those aged 21-
30 years and 31-40 years, specialists and line managers). Administration/clerical
respondents were considered in a group with the line managers. As seen from the chart, the
men have got slightly lower means than females, while the total mean for two age groups
was almost identical; the mean for the specialist a bit exceeded that of the line managers. In
general, the gap is not high in the mathematical logic, the difference is about 1/10 of the
number.
Table 4. Differences in means based on gender and job category
No.a
Subcategoriesb
F M SP LM
43 Good performance feedback 4.42 4.00 4.50 3.77
36 Working on projects on your own 4.18 4.17 4.31 3.92
32 Passion to contribute 2.91 3.45 3.08 3.33
18 A higher salary 4.33 4.08 4.15 4.15
2 Responsibility for the work done 4.08 4.00 4.25 4.08
37 Importance of your opinion 4.18 4.08 4.08 4.17
13 Extra money 4.17 4.17 4.08 4.38
4 More freedom/authority at work 4.27 4.25 4.08 4.42
aNo. refers to the numbered list of the questionnaire items.
bSubcategories: F=female, M=male, SP=specialist, LM= line manager, AC =
Administration/Clerical

TBU in Zlín, Faculty of Humanities 36
About an equal number of males/females, specialists/line managers has been used to
calculate the means. Some means equaled each other (more freedom/authority at work,
extra money, a higher salary, working on projects on your own).
Table 5. Differences in means based on gender and job category
Subcategoriesa
F M SP LM/AC
Physiological needs 3.50 3.32 3.39 3.43
Security needs 2.88 3.15 3.12 2.83
Social needs 3.59 3.30 3.50 3.40
Esteem needs 3.66 3.52 3.71 3.45
Self-actualization needs 3.72 3.71 3.77 3.56
Note: Data based on the table 7.
aSubcategories: F= female, M = male, SP=specialist, LM= line manager, AC
= Administration/Clerical

TBU in Zlín, Faculty of Humanities 37
4 DISCUSSIONS
This chapter serves to refer to the results of the research to the existing motivation studies.
There has been a resurgence of interest on the ways of how to maintain and boost
motivation.
Summary on the background of the respondents
The research was conducted among 30 working students mainly with a secondary
education (or those who had previous work experience). The proportion of males and
females happened to be slightly unequal: 17 men and 13 women. The majority was aged
between 21-30 years and had at least 5 years of work experience, nearly a quarter had a
broad experience of more than 6 years. Almost all recipients were specialists.
4.1 Extra income and working students
As can be seen from the previous chapter, the mean for extra money was one of the highest
(M=4.23, SD=0.679). That indicates that the respondents were highly motivated about it.
As a matter of fact, one should consider the education system in the Czech Republic. The
education is funded by the government, at the same time a family support is a
supplemented feature of education. Besides the support, there is an extensive package of
benefits such as exemption from or reduction in tuition fees, sponsored accommodation
and meals, a scholarship, etc. (Matějů 2007).
The benefit which is most relevant to the students is a scholarship. Taking into the account
the likelihood that not every student had a scholarship on the time of the survey, the
importance of the monetary factor increases twice. According to Caroll (1998) another
important factor is obviously a time factor; students would rather attend part time than full
time: they could have more time for work while studying. Caroll (1998) extensively
examined the undergraduate students who worked while being enrolled. He also studied
the issues of borrowing in the context of work and study.
In fact, the monetary factor is not the only driving force here. Students are getting more
motivated if they are certain that they are on a firm ground, if they know that their part time
job might turn to a long-term one and they wouldn't face the risks of choosing the wrong
career upon completing their studies. The evidence proving that extrinsic motivation in this
case doesn't stand alone will be presented further on.

TBU in Zlín, Faculty of Humanities 38
Caroll (1998) also brings about individual characteristics such as age and marital status,
stating that married and more independent applicants are more motivated to work. This
point doesn't hold much for this study because the marital status wasn't considered as a part
of the questionnaire.
Another study supporting the finding is the Education Work Survey which was executed by
the ABS (Australian Bureau of Statistics). As indicated on the Australian Bureau of
Statistics' website in the years from 1990 to 1995 and 2000, the total percentage of working
students increased from 54.8% to 57.0% and 57.8% in the years correspondingly. Among
the part time students the percentage of females, married, born overseas, with post-school
qualifications, attending higher education and other institutions has increased (Australian
Bureau of Statistics).
Material benefits matter the same way for workers with lower income (Porvazník 2008,
87). It is suggested that after a period of time the workers become less attracted by money,
it happens during so called a culmination point (Dolanský, as cited in Porvazník 2008, 87).
After this culmination point workers feel a stronger need in having more leisure time
(preference of leisure time) rather than in material rewards (preference of material reward)
(Porvazník 2008, 87-88).
Some of the material rewards listed are “stimulating basic salary and personal assessment,
regular salary increases, rewards and bonuses for objectives achieved, shares on the profit
… company car also for private purposes, payment of all phone bills … solution of
accommodation issue (flat), … material present for the anniversaries and working
jubilees... .” (Porvazník 2008, 188).
The statistics for these material rewards can be extracted from the results. For example, the
mean for a higher salary in the current study is as high as 4.13.
To conclude, the material rewards, especially bonuses and extra money, have been found to
have an impact on working students which is explained by growing opportunity costs and
desires to afford superior needs. Also high ambitions might be a reason. “Your people
should be encouraged to earn as much bonus as they can and then spend it on clubs,
limousines, other corporate luxuries, or save it or give it to charity. However the choice
should be theirs. Don't ask your people to subsidize the ego of fat cats at the top.”
(Townsend 1970, 82).

TBU in Zlín, Faculty of Humanities 39
4.2 Higher needs and goal-based motivation
Looking back to the table 3.3 (subcategories analysis) it was found in general that self-
actualization need factors have got the highest ranking. For example, aiming at excellence
was ranked as high as 3.48. Before considering particular self-actualization factors, one
should say a few words about goals because the working students as it has been mentioned
previously tend to be driven not only by material rewards, but goals, to make sure of
having a stable job in the future. What it is like to have a stable job and what a goal based
company means for the working students. This can be taken from the questionnaire results,
as well as from real company observations.
With the growing pace of industry and technology the needs tend to develop as well, from
the simplest needs described by Maslow, to the highest ones. It is widely known that the
needs can act as a stepping stone towards over-indulgence when satisfied in excess. There
are two types of companies, those focusing on the short-term goals and those going with
the long-term objectives. Short-term success may be occasionally attributed to successful
satisfaction of selected needs within a company staff, while the long-term success is
achieved both by catering to the employee needs and inspiring them to finish more distant
but far more prospective goals. To prevent the employees to flee from a company is twice
beneficial than to fill the lacking vacancies later in turmoil, because recruiting employees at
a major spell can severely impede the realization of the set up goals set by a company.
Nevertheless one should consider personal goals as well, which should be in concordance
with a company’s goals. That being said a company with employees who have impaired
visions or lack goals resembles a ship going against the current. Associating the current
with the goals, it’s quite easier to compile the driving forces at any company: one’s
personal success, a sense of being worth, and the company’s overall healthy approach.
Therefore the questionnaire items, such as 32 “passion to contribute”, 23 “achievement
orientation”, 15 “participating at project contests within the company”, and some others
were included as well. The means equaled to 3.37, 3.43, 3.83 correspondingly (See
Appendix 2).
It is sometimes misunderstood how important those little observations are until firing off
the employee turns to a major financial expenditure. Among the company’s goals is
increasing the profit, gaining the leading positions in industry. But in fact, behind the
company there are people who perform the roles prescribed to them. To make sure that the
goals are clearly interpreted to the staff, effective communication comes in between. It is

TBU in Zlín, Faculty of Humanities 40
visible in a management structure with senior and junior managers who are supposed to
maintain interactive communication links so that the employees wouldn’t become at odds
with the top management and there wouldn’t be much of discrepancy and demotivation
going on. Good relations with supervisors have got a mean of 3.97 which is a way too high.
The plight can always be turned to blessing if there is just more attention to the company
ethics and employee morale rather than to the figures and data. According to Messmer
(2001), open communication, keeping employees challenges is what leads to a more
positive company ethics. Schermerhorn (2002) rightfully emphasized the presence of two
major company layers: an observable culture and the core culture. Motivation and the ways
to foster it come under the core culture also because of the fact that it isn’t observable from
the first sight. The core values have been identified as “underlying assumptions and beliefs
that shape and guide people’s behaviors” (Schermerhorn 2010, 184). This being said,
motivation guides to help achieve the vision and the goals of the company and also brings
about a personal satisfaction and a sense of achievement.
4.3 Freedom and authority at work
In the chapter 1 the definition of extrinsic and intrinsic rewards was fairly given to get a
better understanding of what these terms are in essence. The intrinsic rewards might seem
to carry lower monetary value for the fortune hunters and the audience less aware of the
terms as intrinsic and extrinsic. The reason number one to fret over which rewards are
better and correspondingly which motivation patterns to follow is quite simple and
straightforward: all this introduces major changes to the company’s policy. For some
employees the value is in money mainly, for others the value is in non-material things, like
an extended holiday leave to stay longer with dear ones. On top of this, any company
would find itself obliged to prevent the loopholes derived from demotivation, namely
shirking from job responsibilities, constant delays, etc.
The Starbucks Company and the Miller Brewer Company can serve as bright examples to
show the top level which many companies have a long way to reach it. The renowned
employment practices haven’t been giftwrapped for the company: it is the result of a long
run policy. Any employee would justify how hard it is to have a boring and monotonous
day and stick it out. Seemingly that doesn’t sound about right for the Starbucks company
with its multiple and diverse employee programs many of which focus on keeping
employees fit and healthy: on site-fitness services, childcare consulting, a flexible work
TBU in Zlín, Faculty of Humanities 41
schedule, and the programs linking employees with the common hobbies. Starbucks'
benefits are represented in a so called “Special Blend” (full medical and dental insurance,
paid time off, adoption assistance, disability and life insurance, sick pay, time off, and
others). As an example, Starbucks states that “time away from work is essential to our
partners’ health and productivity, whether it’s time spent with family and friends, or
contributing to our communities or favorite causes” (Starbucks). It is really impressing to
see the company calling its employees partners. Meanwhile the first step on the way to
employee ownership was made in 1991 with the opportunity for workers to get a Starbucks
share. On the flip side, the internal rewards are clearly obvious here as well. Take for
example, internal recognition programs. Warm regards program advocates personal
achievement, Mission Review gets the feedback from the partners who work there. “We
are profitable because of the value system of our company … Starbucks is about people – a
humanistic approach to doing business that produces bottom-line results”, says Howards
Schulz, the founder of the renowned company (McCuddy 2005).
What distinguishes these companies from others is a certain amount of freedom. The
employers believe that they have some authority to add to the company’s vision. These
examples were just the examples proving the importance of some freedom for workers.
The mean for freedom and authority at work, as it has been mentioned, was 4.24.
Certainly, freedom and authority were considered as one branch of self-actualization need
factors, but in general there have been enough surveys proving the point that self-
actualization can exist together with the monetary rewards, but on the minus side the
monetary rewards tend to be temporary. “Once the rewards run out, people revert to their
old behaviors.” (Kohn 1993, 3).
The bottom line is that when some authority is combined with material rewards, the effect
is tremendous. The example of Starbucks also showed the importance of teamwork defined
by Cohan as “work together to advance the interests of the corporation” (Cohan 2003, 81).
The mean for the teamwork was 3.63 which is relatively high.
4.4 Job involvement
Job involvement is understood as “the degree to which individuals identify psychologically
with their work” (DuBrin 2008, 231). The questionnaire results showed the teamwork has
the mean of 3.63 which is considered relatively high. However the standard deviation
equaled to 1.066: that says about the variety of responses.

TBU in Zlín, Faculty of Humanities 42
According to the first findings of the 2004 Workplace Employment Relations Survey, the
team work is one of the factors leading to high work involvement after cross-training and
the use of problem-solving groups (Kersley 2004). The survey showed that in 2002 the
percentage of the employees engaged in a team was 72% (including public and private
sectors) (Kersley 2004). Kersley et al. refer to those employees as core employees –
“permanent employees comprising the central and foundational group that provides the
skills essential to the survival and growth of an organization.” Moreover Kersley brought
about the data for cross-training and “the use of problem-solving group”. “Cross-training
involves training staff to undertake jobs other than their own.”(Kersley 2004). In fact cross-
training is interconnected with job rotation: whenever there is a need in job rotation, there
is a need in cross-training. The mean for job rotation in the present survey mounted to 3.93
(SD=0,799) that slightly exceeds the teamwork mean.
The use of the problem-solving groups is represented by “job stress consultants” with the
mean of 2.38 (SD=1.237). This category also relates to ergonomics and many other factors
can be brought under this group, such as anti-smoke, health nutrition, absenteeism
management programs, etc. In the conditions of the employee high involvement, job stress
consultants are as necessary as job rotation. There is always a risk of high employee
involvement turning to workaholism: the measures need to be observed and therefore the
job stress consultants are included in the survey as well. “Ill health and damaged family
relations” are some of the outcomes of workaholism (Perrewé 2007, 253).
Teamwork implies the presence of a leader. In reality it is nearly impossible for two or
more leaders to work together. More freedom by one person might humiliate other team
members. That’s it would be fair to have an informal leader of the team rather than formal,
that would give the opportunity to other to exercise their own freedom. The data showed
that the mean for freedom and authority comprised about 4.24 (SD=0,636) and working on
projects on your own 4.1 (SD=0,673). That says teamwork and freedom at work can
coexist and a sort of autonomy within teams makes employees more motivated and
enthusiastic about the job they are doing.
The participants have shown a relatively active approach to the company activities.
Participating at project contests within the company got 3.83 (0.711). This tendency to
compete contributes a lot to the image of the company. These competitive orientations may
lead to higher motivation to do the job.
TBU in Zlín, Faculty of Humanities 43
Any competition requires realizing the goals and vision of the company. The respondents
had a relatively high level for “being aware of the objectives of the company” 3.25
(SD=0.799). One of the management tasks is to have employees aware of the reasons they
are doing their jobs. A sense of contributing to a large company is of importance. The
importance of communication was mentioned in the theory part. The mean 3.52
(SD=0,753) (companionship at the company).
As for the differences in gender, education and job category the study there are almost no
differences in that. See the results.

TBU in Zlín, Faculty of Humanities 44
CONCLUSION
The study provided the overview of the main motivation factors and how important they
are for the current sample. The nature of motivation is shaped by motivation factors. The
findings contributed to the importance of the monetary factor limited to the students who
are working while studying or had a previous work experience.
The study reported a total high ranking of the self-actualization needs as motivation factors
with the freedom and authority at the top. The students were also encouraged about
teamwork and interaction with the senior staff, which are the parts of the social needs. It
was also found that team members can have considerable authority at work but still stay
within the team.
Organizations are welcomed to put their focus on the teamwork and consider other aspects
(such as feedback, creative approach, involving more employees at the projects).
Motivation strategies can be adjusted depending on the context, but it would be less
effective to have physiological needs on the top. The present study showed the respondents
are goal-oriented individuals.
The range of answers varied deeply most of the times. Motivation is also about individuals
and it should never be regarded absolutely and based on data only.
To cater to the needs of employees is a general priority for companies. The issues related to
employees should be addressed first of all. One tiny step on the way to company
improvement may be fist striving to realize what employees need first of all and having the
will to commit to various motivation techniques of today.
Whatever it costs, the physical and emotional health should be protected. There is always a
respect for companies that not only deliver outstanding services but also try to increase
motivation.

TBU in Zlín, Faculty of Humanities 45
BIBLIOGRAPHY
Accel Team. Employee motivation: Theory and Practice. http://www.accel-
team.com/motivation/index.html (accessed January 23, 2011).
Adams, S. J. 1965. Inequity in social exchange. In L. Berkowitz (Ed.), Advances in
experimental social psychology, 2, 267-299). New York: Academic Press.
Alderfer, C. P. 1969. An empirical test of a new theory of human needs. Organizational
Behavior and Human Peformance, 4(2), 142-175.
Armstrong, M. 2003. A handbook of human resource management practice. London:
Kogan Page.
Ary, Donald, et al. 2009. Introduction to research in education. Wadsworth: Cengage
Learning.
Australian Bureau of Statistics. Combining work and study.
http://www.abs.gov.au/ausstats/[email protected]/Previousproducts/1301.0Feature%20Article1
32002?opendocument&tabname=Summary&prodno=1301.0&issue=2002&num=&vie
w=%29 (accessed March 20, 2011).
Baron, R. A.1983. Behaviour in organisations. New York: Allyn & Bacon.
Bělohlávek, F. 2008. Jak vest a motivovat lidi. Brno: Computer Press.
Bruno, S. F., and M. Osterloh. 2002. Successful management by motivation: balancing
intrinsic and extrinsic incentives. Heidelberg: Springer.
Brush, Kathleen. 2010. American Management Association, Leaders Edge: Supersize
Productivity Now: 3% Automation, 97% Leadership.
Brush, Kathleen. How to boost employee productivity.
http://www.foxbusiness.com/personal-finance/2010/11/30/boost-employee-
productivity/ (accessed March 2, 2011).
Byars, Lloyd L. and Leslie W. Rue. 1987. Human resourse management. Homewood:
Irwin.
Campbell, J. P., and R. D. Pritchard. 1976. Motivational theory in industrial and
organizational psychology. In Handbook of industrial and organizational psychology,
ed. M. D. Dunnette, 63-130. Chicago: Rand McNally.
Caroll, C. Dennis, Susan P. Choy, and Stephanie Cuccaro-Alamin. (1998). Postsecondary
financing strategies how undergraduates combine work, borrowing, and attendance.
N.p.: Diane Publishing.

TBU in Zlín, Faculty of Humanities 46
CASRO. CASRO Code of Standards and Ethics for Survey Research.
http://www.casro.org/codeofstandards.cfm (accessed April 1, 2011).
Cohan, P. S. 2003. Seven principles that drive corporate value in economy. San Francisco:
Jossey-Bass.
De Vaus, D. A. 2001. Research design in social research. London: SAGE
Deeprose, D. 1994. How to recognise and reward employees. New York: AMACOM.
DuBrin, A. J. 2008. Essentials of management. N.p.: Cengage Learning.
Drucker, P. F. 1955. The practice of management. Oxford: Butterworth - Heinemann.
Fields, Dail L. 2002. Taking the measure of work: a guide to validated scales for
organizational research and diagnosis. Thousand Oaks: SAGE.
Forbes. Talent edge 2020: Blueprints for the new normal.
http://www.forbes.com/forbesinsights/TalentEdgeDecember2010/index.html
(accessed January 1, 2011).
Gravetter, F. J. and L. B. Wallnau. 2008. Statistics for the behavioral sciences. Wadsworth:
Cengage Learning.
Green, T. B. 1992. Performance and motivation strategies for today's workforce: A guide
to expectancy theory applications. Westport: Greenwood Publishing Group.
Greenberg, J. 2006. Losing sleep over organizational justice: Attenuating insomniac
reactions to underpayment inequity with supervisory training in interactional justice.
Journal of applied psychology, 91, 58-69.
Greenberg, J. and R. Cropanzano. 2001. Advances in organizational justice. Stanford
University Press.
Hoegl, M. and H. G., Gemuenden, 2001. Teamwork quality and the success of innovative
projects: A theoretical concept and empirical evidence. Organization Science, 12(4),
435-449.
Huseman, R. C., Hatfield, J. D., Miles, E. W. (1987). A new perspective on equity theory:
The equity sensitivity construct. Academy of Management Review, 12, 222-234.
Job quality for foreign workers. EWCO (European Working Conditions Observatory).
http://www.eurofound.europa.eu/ewco/2008/12/CZ0812019I.htm (accessed April 12,
2011).
Lee Iacocca. BrainyQuote.com, Xplore Inc, 2011.
http://www.brainyquote.com/quotes/quotes/l/leeiacocca149257.html, accessed May 1,
2011.

TBU in Zlín, Faculty of Humanities 47
Lee Iacocca. BrainyQuote.com, Xplore Inc, 2011.
http://www.brainyquote.com/quotes/quotes/l/leeiacocca164296.html, accessed May 1,
2011.
Jenkins, Jr. et al. 1998. Are financial incentives related to performance? Journal of Applied
Psychology, 83, 777-787.
Katz, Nancy R. 2000. Incentives and performance management in the public sector.
http://www.hks.harvard.edu/visions/performance_management/katz_incentives.htm
(accessed January 5, 2011).
Kohan, A.1993. Why incentive plans cannot work. Harward Business Review. September-
October, 54-63.
Latham, Gary P. 2007. Work motivation: History, theory, research, and practice. Thousand
Oaks: SAGE.
Lawler, E.E. 2003. Treat people right. San Francisco: Jossey-Bass Inc.
Lussier, R. N. 2008. Management fundamentals: Concepts, applications, skill development.
Mason: Cengage learning.
Maslow, A. H. 1943. A theory of human motivation. Psychological Review. 50. 370-396.
http://psychclassics.yorku.ca/Maslow/motivation.htm (accessed March 7, 2011).
Maslow, A.H. 1987. Motivation and personality. New York: Harper & Row.
Matějů, P. 2007. Country report Czech Republic. In Schwarzenberger, A. (Ed.),
Pubic/private funding of higher education: A social balance (pp. 109-135). Hannover:
HIS.
McCuddy, Michael K., The Louis S. and Mary L. Morgal. Motivating partners at
Starbucks. http://www.swlearning.com/management/nelson-
quick/uob2e/isc/cases/case05.html (accessed March 15, 2011).
McGregor, D. 1987. The human side of enterprise. Harmondsworth.: Penguin.
Messmer, M. 2001. Capitalizing on corporate culture. Internal Auditor, 58(5), 71-84.
Miller, L. M. 1989. Barbarians to bureaucrats: Corporate life cycle strategies. New York:
Fawcett Columbine.
Moore, Lori L., Dustin K. Grabsch, Craig Potter. (2010). Using achievement motivation
theory to explain student participation in a residential leadership learning
community. Journal of Leadership Education. 9(2), 22-34.
http://www.fhsu.edu/jole/issues/JOLE_9_2/Moore%20Grabsch%20and%20Rotter.p
df (accessed February 15, 2011).
Moran, Aidan P. (2004). Sport and exercise psychology: A critical introduction. New York:

TBU in Zlín, Faculty of Humanities 48
Routledge.
Nobilis, Laurus. 2008. Employee Motivation. Biz-Development. http://www.biz-
development.com/HumanResources/3.13.Employee-Motivation.htm (accessed April 9,
2011).
Nuttin, J. 1984. Motivation, planning, and action: A relational theory of of behavior
dynamics. Translated by Raymond P/ Lorion, Jean E. Dumas. Routledge.
Palmer, S. 1998. People and self-management. Oxford: Butterworth Heinemann.
Pearson.Introduction to SPSS Statistics in Psychology:For version 19 and earlier.
http://www.pearson.ch/HigherEducation/Psychology/SocialandAppliedPsychology/14
71/9780273734260/Introduction-to-SPSS-Statistics.aspx
Porvazník, J. et al. 1941. Holistic management : pillars of competence in management.
Bratislava : IRIS.
Postrel, Virginia. 1999. Dilbert's doctrines: cartoonist Scott Adams on cubicles, capitalism,
and the angst of the knowledge worker. Interview.
http://findarticles.com/p/articles/mi_m1568/is_9_30/ai_53747405/pg_3/?tag=content;c
ol1 (accessed January 11, 2011).
Quotes.Net. „Lee Iacocca quotes: Famous Lee Iacocca quotations“. STAND4
LLC
http://www.quotes.net/authors/Lee+Iacocca (accessed May 1, 2011).
Ryan, R. M. and Deci, E. L. 2000. Intrinsic and extrinsic motivation: classic definitions and
new directions. Contemporary educational psychology, 25, 54-67. Available online
http://www.psych.rochester.edu/SDT/documents/2000_RyanDeci_IntExtDefs.pdf
(accessed April 3, 2011).
Ryan, R. M., Deci E. L. 1985. Intrinsic motivation and self-determination in human
behavior. New York: Plenum.
Shermerhorn, John R. 2002. Exploring management. 2nd ed. New York: John Wiley &
Sons.
Skinner, B.F. 1953. Science and human behavior. Oxford, England: Macmillan.
Smart Manager by Kelly Services. Work needs age diversity but ageism is alive and
kicking.
http://www.smartmanager.com.au/web/au/smartmanager/en/pages/111_age.html
(accessed April 9, 2011).
TBU in Zlín, Faculty of Humanities 49
Starbucks. A look at total pay. http://assets.starbucks.com/assets/total-pay-guide-12-06-
10.pdf (accessed March 2, 2011).
Thompson, Lori Foster, Z. Zhang and Richard D. Arvey. 2010. Genetic underpinnings of
survey response. Journal of Organizational Behavior 32.
http://onlinelibrary.wiley.com/doi/10.1002/job.692/pdf (accessed April 9, 2011).
Thompson, Steven K. 2002. Sampling. 2nd ed. New York: John Wiley & Sons.
Towers Watson. 2008/2010 Communication ROI study report: Capitalizing on effective
communication. http://www.towerswatson.com/research/670 (accessed April 6, 2011).
Townsend, R. 1970. Up the organization. New York: Alfred A. Knopf.
Voltaire. Great-Quotes.com, Gledhill Enterprises, 2011.
http://www.great-quotes.com/quote/64031, accessed December 1, 2011.
Vroom, V. H. 1964. Work and motivation. New York: Wiley.
Vroom, V. H. 1990. Manage people, not personnel: Motivation and performance
appraisal. Harvard Business Press.
Vroom, V. H. 1964. Work and motivation. New York: Wiley.
Watson Wyatt
Weiner, Bernard. 1992. Human motivation: metaphors, theories, and research. Thousand
Oaks: SAGE.
Werner, Jon M. and Randy L. DeSimone. 2008. Human resource development. Mason:
Cengage Learning.
Whetten, D. A., K. S. Cameroon, and M. Woods. 2000. Developing management skills for
Europe. 2nd ed. N.p.:Pearson Education.
Ziglar, Z. 2006. Better than good: Creating a life you can't wait to live. Nashville,
Tennessee: Thomas Nelson.
TBU in Zlín, Faculty of Humanities 50
LIST OF FIGURES
Figure 1. Gender distribution of the sample ........................................................................ 25
Figure 2. Age distribution .................................................................................................... 26
Figure 3. Experience distribution ........................................................................................ 27
Figure 4. Education distribution ......................................................................................... 27
Figure 5. Job category distribution ..................................................................................... 28
Figure 6. The top ratings of the selected questionnaire items ............................................. 33
Figure 7. Means for gender, age and job categories ........................................................... 35
III

TBU in Zlín, Faculty of Humanities 51
LIST OF TABLES
Table 1. Selected factors in an ascending order .................................................................. 31
Table 2. Range, minimum and maximum of the selected items ........................................... 32
Table 3. Subcategories analysis ........................................................................................... 34
Table 4. Differences in means based on gender and job category ...................................... 35
Table 5. Differences in means based on gender and job category ...................................... 36
Table 6. Means and standard deviations of the questionnaire items ................................... 55
Table 7. The number of U (“unimportant”), NI (“not so important”), SI (“somewhat
important”), I (“important”), VI (“very important”) responses ......................................... 57

TBU in Zlín, Faculty of Humanities 52
APPENDICES
P I Motivation questionnaire.
P II Means and standard deviations.
P III Ratings.
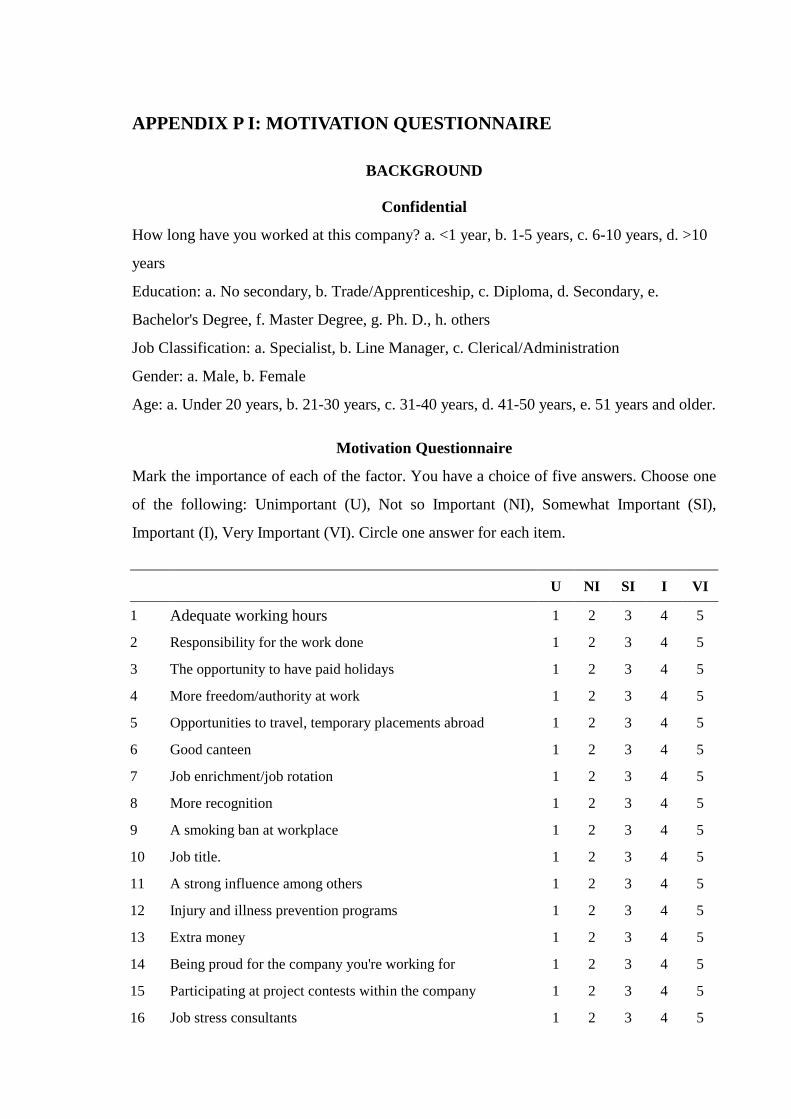
APPENDIX P I: MOTIVATION QUESTIONNAIRE
BACKGROUND
Confidential
How long have you worked at this company? a. <1 year, b. 1-5 years, c. 6-10 years, d. >10
years
Education: a. No secondary, b. Trade/Apprenticeship, c. Diploma, d. Secondary, e.
Bachelor's Degree, f. Master Degree, g. Ph. D., h. others
Job Classification: a. Specialist, b. Line Manager, c. Clerical/Administration
Gender: a. Male, b. Female
Age: a. Under 20 years, b. 21-30 years, c. 31-40 years, d. 41-50 years, e. 51 years and older.
Motivation Questionnaire
Mark the importance of each of the factor. You have a choice of five answers. Choose one
of the following: Unimportant (U), Not so Important (NI), Somewhat Important (SI),
Important (I), Very Important (VI). Circle one answer for each item.
U NI SI I VI
1 Adequate working hours 1 2 3 4 5
2 Responsibility for the work done 1 2 3 4 5
3 The opportunity to have paid holidays 1 2 3 4 5
4 More freedom/authority at work 1 2 3 4 5
5 Opportunities to travel, temporary placements abroad 1 2 3 4 5
6 Good canteen 1 2 3 4 5
7 Job enrichment/job rotation 1 2 3 4 5
8 More recognition 1 2 3 4 5
9 A smoking ban at workplace 1 2 3 4 5
10 Job title. 1 2 3 4 5
11 A strong influence among others 1 2 3 4 5
12 Injury and illness prevention programs 1 2 3 4 5
13 Extra money 1 2 3 4 5
14 Being proud for the company you're working for 1 2 3 4 5
15 Participating at project contests within the company 1 2 3 4 5
16 Job stress consultants 1 2 3 4 5

U NI SI I VI
17 Feeling of being accepted at my company 1 2 3 4 5
18 A higher salary 1 2 3 4 5
19 Good relations with supervisors 1 2 3 4 5
20 Aiming at excellence at work 1 2 3 4 5
21 Promotion 1 2 3 4 5
22 Teamwork 1 2 3 4 5
23 Achievement orientation 1 2 3 4 5
24 Assisting colleagues when needed 1 2 3 4 5
25 Medical & vision, and dental insurance 1 2 3 4 5
26 Job security 1 2 3 4 5
27 Work content 1 2 3 4 5
28 Companionship at the company 1 2 3 4 5
29 Company softball outings 1 2 3 4 5
30 Being aware of the objectives of the company 1 2 3 4 5
31 A separable and enclosed office 1 2 3 4 5
32 Passion to contribute 1 2 3 4 5
33 Home loan assistance as an additional benefit 1 2 3 4 5
34 Trust in making decision 1 2 3 4 5
35 Grievance procedures 1 2 3 4 5
36 Working on projects on your own 1 2 3 4 5
37 Importance of your opinion 1 2 3 4 5
38 Retirement benefits 1 2 3 4 5
39 Innovative workplace solutions 1 2 3 4 5
40 Free communicating your views 1 2 3 4 5
41 No stress at work 1 2 3 4 5
42 Security guards/building patrols 1 2 3 4 5
43 Good performance feedback 1 2 3 4 5
Thanks for filling in this questionnaire. Your efforts are much appreciated.

APPENDIX P II: MEANS AND STANDARD DEVIATIONS
Table 6. Means and standard deviations of the questionnaire items
Variable Mean SD N
Adequate working hours VAR00001 3.13 1.074 30
Responsibility for the work done VAR00002 4.14 .789 29
The opportunity to have paid holidays VAR00003 3.40 1.221 30
More freedom/authority at work VAR00004 4.24 .636 29
Opportunities to travel, temporary placements
abroad
VAR00005 3.31 .930 29
Good canteen VAR00006 2.33 1.241 30
Job enrichment/job rotation VAR00007 3.93 .799 29
More recognition VAR00008 3.87 .681 30
A smoking ban at a workplace VAR00009 2.47 1.570 30
Job title VAR00010 2.87 1.074 30
A strong influence among others VAR00011 3.30 .702 30
Injury and illness prevention programs VAR00012 3.03 .765 30
Extra money VAR00013 4.23 .679 30
Being proud for the company you are working
for
VAR00014 3.73 1.015 30
Participating at projects contests within the
company
VAR00015 3.83 .711 29
Job stress consultants VAR00016 2.38 1.237 29
Feeling of being accepted within the company VAR00017 3.97 .850 30
A higher salary VAR00018 4.13 .900 30
Good relations with supervisors VAR00019 3.97 .765 30
Aiming at excellence at work VAR00020 3.48 .829 29
Promotion VAR00021 3.40 .770 30
Teamwork VAR00022 3.63 1.066 30
Achievement orientation VAR00023 3.43 .836 28
Assisting colleagues when needed VAR00024 3.60 .968 30
Medical&vision, and dental insurance VAR00025 2.79 1.048 29
Job security VAR00026 3.20 1.186 30
Work content VAR00027 3.54 .838 28
Companionship at the company VAR00028 3.52 .753 27
Company softball outings VAR00029 2.14 1.079 28
Being aware of the objectives of the company VAR00030 3.25 .799 28
A separable and enclosed office VAR00031 3.25 1.076 28

Variable Mean SD N
Passion to contribute VAR00032 3.37 .688 27
Home loan assistance as an additional benefit VAR00033 2.86 .891 28
Trust in making decisions VAR00034 4.03 .778 29
Grievance procedures VAR00035 3.12 .516 26
Working on projects on your own VAR00036 4.10 .673 29
Importance of your opinion VAR00037 4.14 .693 29
Retirement benefits VAR00038 3.25 .928 28
Innovative workplace solutions VAR00039 3.33 .784 27
Free communicating of your views VAR00040 3.59 .747 27
No stress at work VAR00041 3.13 1.252 30
Security guards/building patrols VAR00042 2.21 1.146 29
Good performance feedback VAR00043 4.03 .778 29

APPENDIX P III: RATINGS
Table 7. The number of U (“unimportant”), NI (“not so important”), SI (“somewhat
important”), I (“important”), VI (“very important”) responses
No. U NI SI I VI
1 Adequate working hours 3 5 8 13 1
2 Responsibility for the work done 0 1 4 14 10
3 The opportunity to have paid holidays 3 4 6 12 5
4 More freedom/authority at work 0 0 3 16 10
5 Opportunities to travel, temporary placements
abroad 0 6 11 9 3
6 Good canteen 0 0 11 15 4
7 Job enrichment/job rotation 9 10 5 4 2
8 More recognition 0 0 9 16 5
9 A smoking ban at a workplace 13 3 4 4 5
10 Job title 3 8 11 6 2
11 A strong influence among others 0 2 19 7 2
12 Injury and illness prevention programs 0 7 16 6 1
13 Extra money 0 0 4 15 11
14 Being proud for the company you are working
for
0
5
5
13
7
15 Participating at projects contests within the
company
0
0
10
14
5
16 Job stress consultants 10 6 5 8 0
17 Feeling of being accepted within the company
0
1
8
12
9
18 A higher salary 0 1 7 9 13
19 Good relations with supervisors 0 1 6 16 7
20 Aiming at excellence at work 0 3 14 11 2
21 Promotion 7 12 7 2 2
22 Teamwork 5 12 7 5 0
23 Achievement orientation 1 3 9 10 7
24 Assisting colleagues when needed 1 0 16 8 3
25 Medical&vision, and dental insurance 1 4 4 18 3
26 Job security 3 8 12 4 2
27 Work content 1 0 5 16 8
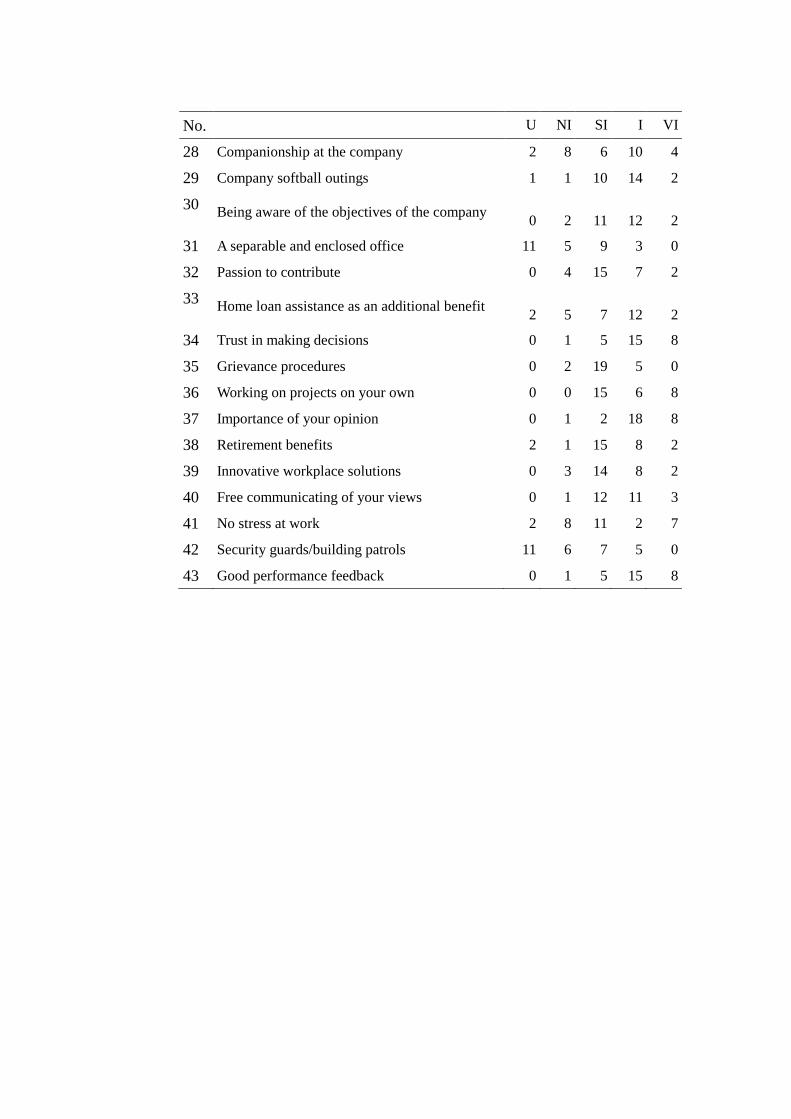
No. U NI SI I VI
28 Companionship at the company 2 8 6 10 4
29 Company softball outings 1 1 10 14 2
30 Being aware of the objectives of the company
0
2
11
12
2
31 A separable and enclosed office 11 5 9 3 0
32 Passion to contribute 0 4 15 7 2
33 Home loan assistance as an additional benefit
2
5
7
12
2
34 Trust in making decisions 0 1 5 15 8
35 Grievance procedures 0 2 19 5 0
36 Working on projects on your own 0 0 15 6 8
37 Importance of your opinion 0 1 2 18 8
38 Retirement benefits 2 1 15 8 2
39 Innovative workplace solutions 0 3 14 8 2
40 Free communicating of your views 0 1 12 11 3
41 No stress at work 2 8 11 2 7
42 Security guards/building patrols 11 6 7 5 0
43 Good performance feedback 0 1 5 15 8