u. s. fish and wildlife service early detection and ...€¦ · 1 executive summary 5 2...
TRANSCRIPT

1
U. S. Fish and Wildlife Service
Early Detection and Monitoring of Non-Native Fishes in Lake Huron, 2017
March 2018
Anjanette Bowen, Jessica Bowser, Steven Gambicki, Kaley Genther, Anton Gereau II,
Janine Lajavic, Matthew McLean, and Patricia Thompson
U. S. Fish and Wildlife Service Alpena Fish and Wildlife Conservation Office
480 West Fletcher Street Alpena, Michigan 49707

2
Suggested citation: U. S. Fish and Wildlife Service. 2018. Early detection and monitoring of non-native fishes in Lake Huron, 2017. U. S. Fish and Wildlife Service, Alpena Fish and Wildlife Conservation Office, Alpena, Michigan. 29 pp.
On the cover: (Left photo): Invasive Tubenose Goby collected from Potagannissing Bay on the St. Marys River. Photo credit: USFWS. (Right photo): U.S. Fish and Wildlife Service, Alpena FWCO sampling vessel R/V Sentinel prepped for sampling. Photo credit: USFWS.

3
Table of Contents
1 Executive Summary 5
2 Introduction 6
3 Study Areas 9 3.1 Lower St. Marys River .......................................................................................................9 3.2 Saginaw Bay ....................................................................................................................10
4 Methods 10 4.1 Adult/Juvenile Fish Sampling ...........................................................................................10 4.2 Data Analysis: Species Accumulation and Extrapolated Richness ..................................12
5 Results 12 5.1 Lower St. Marys River .....................................................................................................12 5.2 Saginaw Bay ....................................................................................................................13
6 Discussion 14
7 References 15
8 Tables 20 9 Figures 24
4
ACKNOWLEDGEMENTS
We thank our partners and staff who assisted with planning, sampling, and analysis associated with this effort including: J. Cochran of U.S. Fish and Wildlife Service, Lower Great Lakes FWCO who performed rarefaction analysis and prepared related graphics for this document; M. McLean of USFWS, Alpena FWCO who prepared maps for this document; S. Chong, I. Senecal, T. Noseworthy, and Arnold of Ontario Ministry of Natural Resources and Forestry, Upper Great Lakes Management Unit who coordinated field electrofishing in Canadian waters; N. Moorman, K. Skubik, J. Block, and T. Gronda volunteers from Lake Superior State University who assisted with sampling; A. Briggs of Michigan Department of Natural Resource, Lake St. Clair Fisheries Research Station with J. Hoffman of U. S. Environmental Protection Agency, Mid-Continent Ecology Division and S. Hensler of Cerulean Center who provided insight on early detection to help guide this effort. This project was funded in part by the Great Lakes Restoration Initiative.
5
1 Executive Summary
The Laurentian Great Lakes have encountered numerous aquatic non-native and invasive species introductions since Europeans settled in North America (Mills et al. 1994). The impact of aquatic invasive species (AIS) on the Great Lakes has been widely documented by the scientific community (Leung et al. 2002; Mills et al. 1993; Rosaen et al. 2012). Despite increasing regulations aimed at reducing the likelihood of the introduction and spread of AIS into the Great Lakes, there remains a need to monitor for and detect new species before they become established (GLRI 2014; GLWQA 1987). This is especially true given the costs and difficulty of attempting to control or eradicate a non-native species once it is established (Trebitz et al. 2009). If a non-native species is detected prior to becoming well established, rapid response decisions can be made in an effort to eradicate or control the species from further spread. Furthermore, continuous monitoring also allows resource managers to document the baseline community, look at historical data, and assess the impact of future invasions (Trebitz et al. 2009). This report summarizes the 2017 efforts for early detection of non-native fishes in Lake Huron as implemented by the U. S. Fish and Wildlife Service (USFWS), Alpena Fish and Wildlife Conservation Office and partner agencies. Two locations in Lake Huron, the lower St. Marys River and Saginaw Bay, were selected for sampling during 2017 using the best information available. These locations were chosen following an in-house ranking of a suite of locations across U.S. waters of Lake Huron. Location ranking took into account the likelihood of a new non-native species to become introduced at a location and locations where non-native species were historically introduced (USFWS 2016a). Consideration was also given to at-risk locations provided by The Nature Conservancy (Chadderton et al. 2016). Sites within sampling locations were stratified by suitable gear type according to sampling depth and randomly selected from all sites meeting each depth criteria. Gear used to target juvenile and adult fish were utilized and included night electrofishing, paired fyke nets, and bottom trawls. All three gears were fished in the lower St. Marys River during 2017 in continuation of annual sampling initiated during 2013. Saginaw Bay was first sampled in 2017 and only paired fyke nets and bottom trawls were used during sampling. A new sighting of invasive Tubenose Goby Proterorhinus semilunaris was collected in the lower St. Marys River during sampling in 2017. Tubenose Goby have been collected within the Great Lakes Basin, and the St. Marys River finding indicated a range expansion for this species.
Crews examined 17,735 juvenile and adult fish over 72 sampling sites for the presence of undocumented non-native species. Catch information was recorded on all fish examined comprising 44 species. Previously established non-native species were captured often (e.g., Common Carp Cyprinus carpio, Rainbow Smelt Osmerus mordax, Round Goby Neogobius
6
melanostomus, Threespine stickleback Gasterosteus aculeatus, and White Perch Morone americana). Species accumulation analysis and extrapolated species richness was used to gauge juvenile and adult fish species diversity (observed species versus predicted extrapolated species richness). Non-native species may be low in abundance, or rare, early during invasion. The goal is to detect as many species as possible that are predicted to be present at a given location. Detecting rare species present at low abundances is beneficial for the sampling regime to be most effective (Hoffman et al. 2011). Early detections reinforce the critical nature of this monitoring program as an essential part of non-native and invasive species management. This program discovered range expansion of Tubenose Goby into the St. Marys River on Lake Huron in 2017 and range expansion of Blueback Herring Alosa aestivalis on Lake Erie during similar early detection efforts conducted by the USFWS during 2016 (USFWS 2017a). The USFWS Ashland FWCO detected a range expansion of bloody red shrimp Hemimysis anomala into Lake Superior where they were collected at Allouez Bay near the St. Louis River in western Lake Superior during 2017 (Jared Myers, USFWS, personal communication). These detections reinforce the importance of the USFWS early detection and monitoring program across the Great Lakes.
2 Introduction
The establishment of aquatic non-native species in the Great Lakes has caused major economic and ecological impacts (Mills et al. 1993; Vanderploeg et al. 2002; Rosaen et al. 2012; Rothlisberger et al. 2012). The Great Lakes support a valued $7 billion fishery (ASA 2008) that is threatened by the existing and continued establishment of aquatic invasive species. The current cost of aquatic non-native species to the Great Lakes Region is well over $100 million annually (Rosaen et al. 2012). Mitigation for damages can be costly, for example damage costs generated by a single introduction vector - ship-borne non-native species (which represents a vector for only a portion of invasive species introduced into the Great Lakes) is an estimated $138 million each year (Rothlisberger et al. 2012). Additional costs are associated with other vectors by which non-native species have entered the Great Lakes including aquarium releases, bait releases, and recreational activities (Mills et al. 1994). The Great Lakes currently contain at least 182 identified nonindigenous aquatic species (Ricciardi 2006), 88 of which are present in Lake Huron (NOAA 2016). The impacts of historical non-native introductions in Lake Huron have been widely documented. Sea Lamprey Petromyzon marinus presumably entered Lake Huron in the 1930s (Smith and Tibbles 1980). Ecological and economic impacts from the lamprey invasion have been observed

7
as losses in commercial and recreational fishing income, tourism, and costs associated with control measures (Smith and Tibbles 1980; Jones 2007). The United States and Canada spend over $20 million per year on sea lamprey control measures alone (Dissanayake et al. 2016). Zebra mussels Dreissena polymorpha and quagga mussels D. bugensis have altered trophic dynamics by competing for resources with native bivalves, promoting conditions favorable to harmful algal blooms, and concentrating energy resources into benthos causing oligotrophication (Vanderploeg et al. 2002). Additionally, these mussels negatively impact industries such as power plants and water treatment facilities (Lovell et al. 2006). The total economic costs associated with zebra mussels are estimated around $5 billion (Lovell et al. 2006). The introduction of Rainbow Smelt into Lake Huron caused declines of recruitment in native planktivores such as Lake Whitefish Coregonus clupeaformis and Lake Herring (Cisco) Coregonus artedi (Evans and Loftus 1987). Alewife Alosa pseudoharengus has been linked to reproductive failure in Lake Trout Salvelinus namaycush and Atlantic Salmon Salmo salar (Fisher et al. 1996). Great Lakes Basin waterways continue to face the threat of new invasions. Some non-native species have been documented as present but are not yet abundant, while others are not present but pose a high risk of invasion. The most notable potential invaders of the Great Lakes basin are four species of Asian Carp – Bighead Carp Hypophthalmichthys nobilis, Silver Carp Hypophthalmichthys molitrix, Grass Carp Ctenopharyngodon idella, and Black Carp Mylopharyngodon piceus. Bighead and Silver Carp are large, planktivorous fish that, once established, have been reported to dominate fish assemblages (they represented up to 97% of the total fish biomass in invaded portions of the Mississippi River basin; MICRA 2002) and alter the structure and species composition of native plankton communities (Laws and Weisburd 1990; Vörös et al. 1997; Stone et al. 2000). Asian Carp species pose greatest threat of invasion into the Great Lakes via connecting waterways to Lake Michigan and/or to Lake Erie. Bighead and Silver Carp are known to inhabit Lake Erie rivers that indirectly connect to the Great Lakes Basin during high water events (GLMRIS 2011). Adult Bighead Carp individuals have been captured from the western basin of Lake Erie (Morrison et al. 2004); however, there has been no evidence of establishment. Grass Carp feed on submerged aquatic macrophytes and may threaten vegetation associated with coastal wetlands, which provide spawning and rearing habitat for many species (Chapman et al. 2013). Grass Carp have been captured at isolated locations within Lake Erie, and natural reproduction was recently documented there (Chapman et al. 2013; Embke et al. 2016); however, they are not abundant (Baerwaldt et al. 2013; USGS 2017). If Asian Carps enter one of the Great Lakes, they pose a threat to all due to the connected nature of the system. Populations of Asian Carp have expanded and have been found closer to the Great Lakes (for recent information on Asian Carp populations visit http://www.asiancarp.us).
In an attempt to protect the ecological and economic value of the Great Lakes region, Federal and state agencies plan to spend over $25 million in Asian Carps prevention and research in the
8
coming year alone (ACRCC 2016). Many additional species have been identified that are at risk of introduction to the Great Lakes through ballast water, aquarium trade, and other vectors outside of immediately connected waterways (Kolar and Lodge 2002; NOAA 2016). Minimizing introductions of non-native species to the Great Lakes has become increasingly important given the significant impacts past invaders have had on this ecosystem. Recent initiative and legislative actions address the threat of invasive species to the Great Lakes. Two of note are the Great Lake Restoration Initiative (GLRI) and the reauthorization of the Great Lakes Water Quality Agreement. The Great Lakes Restoration Initiative (GLRI 2014) was first implemented in 2010 and is focused on restoring and protecting the integrity of the Great Lakes. The GLRI provides a plan of action that focuses funding and resources to address Great Lakes issues and threats. The threat of invasive species is addressed by GLRI and GLRI’s invasive species component includes a charge to “conduct early detection and monitoring activities”. Preventing the transfer of species between ecosystems is the most effective tool to conserve the integrity of existing ecosystems and reduce invasive species. When complete prevention is not possible, monitoring for the arrival of new species and controlling their spread are the next most effective options (USEPA 2008; Trebitz et al. 2009, Hoffman et al. 2016). The Great Lakes Water Quality Agreement (1987) was amended in 2012 and included a number of annexes to address issues in the Great Lakes. One such is Annex 6, an Aquatic Invasive Species Annex whose purpose is to “… establish a binational strategy to prevent the introduction of Aquatic Invasive Species (AIS), to control or reduce the spread of existing AIS, and to eradicate, where feasible, existing AIS within the Great Lakes Basin Ecosystem”. Included in the Programs and Measures component of Annex 6 is the task to develop and implement an early detection and rapid response initiative that: “(a) develops species watch lists; (b) identifies priority locations for surveillance; (c) develops monitoring protocols for surveillance”. The Annex also noted a need for “development and evaluation of technology and methods, including genetic techniques, that improve the ability to detect potential AIS at low levels of abundance”. To address pervasive invasive species issues across the Great Lakes, the U.S. Fish and Wildlife Service (USFWS) developed a strategic framework for the early detection of non-native fishes and select benthic macroinvertebrates in the Great Lakes (USFWS 2014b). Fish and Wildlife Conservation Offices (FWCOs) throughout the Great Lakes lead and coordinate this program. This report describes efforts devoted to the early detection of non-native fishes at locations in the lower St. Marys River and the Saginaw Bay area of Lake Huron during 2017. This sampling is a continuation of coordinated efforts initiated in 2013 (USFWS 2016b, USFWS 2017b).

9
3 Study Areas Study areas were chosen through the use of a vector risk analysis for species at risk to become introduced into the Great Lakes. A suite of locations across Lake Huron and Lake Erie including their connecting waterways were evaluated for risk of invasion by non-native species (USFWS 2014a; USFWS 2016a). These areas were combined in the risk analysis evaluation because the Alpena FWCO station’s area of coverage includes Lake Huron, western Lake Erie, and their connected waterways. We also took into consideration a similar Great Lakes risk assessment conducted by The Nature Conservancy (Chadderton et al. 2016). Two Lake Huron study areas, the lower St. Marys River and Saginaw Bay (Figure 1) were selected for sampling in 2017 in addition to four other high risk locations on Lake Erie. The lower St. Marys River has been sampled annually 2013-2017, and Saginaw Bay was added to the sampling regime in 2017 as a result of an adaptive approach.
3.1 Lower St. Marys River
The St. Marys River is 120 km in length and forms the connecting channel between lakes Superior and Huron. It is an international boundary between the U. S. state of Michigan and the Canadian province of Ontario. The river is an integral shipping link between Lake Superior and lakes Huron, Michigan, Erie, and Ontario, and the St. Lawrence Seaway. A number of locks (MacArthur, Poe, Davis and Sabin Locks) were built on the upper river at the rapids to allow ship passage. Historically the river and the St. Marys Rapids were important to aboriginal peoples and early settlers as a meeting place and as a source of fish and wildlife for subsistence and trade. The river continues to be an important resource for recreational anglers, subsistence fishermen, recreational boaters, and tourism. A variety of natural features exist within the St. Marys River including islands (e.g., Sugar Island, Neebish Island, and St. Joseph Island), lakes (e.g., Lake Nicolet, Lake George, and Munuscong Lake), bays (e.g., Waiska Bay, Potagannissing Bay, Raber Bay, and Worsley Bay), and channels (e.g., North Channel, Munuscong Channel, and St. Joseph Channel). The river also consists of a variety of habitats and structures, both man-made and natural including the locks, water diversion canals, seawalls, dredged channels for shipping, wetlands, aquatic vegetation beds, and sand or cobble substrates. Pollution along the river led to impaired water quality, sediment, and biota; and the St. Marys River was designated an Area of Concern (AOC) as part of the Great Lakes Water Quality Agreement of 1987. The study area encompassed U. S. and Canadian waters of the river from the compensating works at Sault Ste. Marie, Michigan and Ontario downstream to Lake Huron at De Tour Village, Michigan and to the North Channel at the connection with the St. Joseph Channel in Canadian waters. The study area will be hereafter referenced as the lower St. Marys River. The lower St. Marys River is managed as part of Lake Huron.
10
3.2 Saginaw Bay
Saginaw Bay is a large, 2,960 km2 bay located along the western Lake Huron shoreline in mid-Michigan. The bay provides valuable recreational angling for Walleye and Yellow Perch, recreational boating, and a commercial fishery. The Saginaw River is the main tributary to Saginaw Bay, and drains into the southwest portion of Bay County at Essexville, Michigan. The river is an important navigational shipping route connecting inland areas of eastern mid-Michigan and the Great Lakes. There are a number of shipping ports situated along the Saginaw River in Essexville, Bay City, and Saginaw, Michigan. The river and its tributaries drain densely populated areas including the cities of Flint and Saginaw, Michigan, yet also support vast wetland areas that include Shiawassee National Wildlife Refuge and State Game Areas along the watershed. The Saginaw River and Bay was designated an Area of Concern (AOC) as part of the Great Lakes Water Quality Agreement of 1987 due to contaminated sediments and fish consumptive advisories resulting from pollution. Efforts are underway to restore the area and remove beneficial use impairments. The study area covered approximately 5,335 hectares and encompassed the nearshore area of Saginaw Bay within approximately 7.5 km radius of the river mouth and the lower 2.2 km of the Saginaw River.
4 Methods
4.1 Adult/Juvenile Fish Sampling
Adult and juvenile fish were targeted for early detection in Lake Huron (USFWS 2016a). Fish were sampled using diverse sampling gears deployed at a range of water depths in an attempt to collect as many species present in the fish community as possible. Sampling gears used to target adult and juvenile fish included paired fyke nets, nighttime boat electrofishing, and bottom trawling; however only paired fyke nets and bottom trawls were used to sample the Saginaw Bay area in 2017. Paired fyke nets consisted of two 0.91 m x 1.22 m fyke nets constructed of 4.69 mm (3/16” delta) stretch mesh netting that were attached together with a 15 m x 0.91 m lead resulting in a paired net. Each individual net consisted of two rectangular frames 0.91 m x 1.22 m, followed by four circular rings 0.91 m in diameter. Paired fyke nets were set parallel to the shoreline or in “weed pockets” in water depths of 1.0-2.0 m. Nets were set during the day and remained in the water overnight for a period of 18-26 hours. Effort was standardized to the number of fish collected per net night. Boat electrofishing consisted of a 60 Hz pulsed DC electrical current with sufficient power to induce taxis in fish. Electrofishing was conducted during night hours in water depths of
11
approximately 1.0-2.5 m. Electrofishing was conducted along one 600s transect near each predetermined randomly selected waypoint. A Midwest Lake Electrofishing System control box was used to generate electrical impulses used during electrofishing. The electrofishing power was dependent upon water conductivity and the level of boat-hull oxidation. Effort was standardized to the number of fish collected per hour of electrofishing. Bottom trawls were Marinovich design and consisted of a 4.9 m head rope, 3.8 cm stretch mesh body, and a 3.125 mm stretch mesh cod end. Trawl tows were performed during the day, for five minutes in duration at a speed of approximately 4 km/h. Trawl tows were conducted on contour at water depths of 1.9-15.7 m. They were recovered using a hydraulic winch. Bottom trawls were conducted on even substrate composed of soft material such as sand, silt, or vegetation. Trawling was not conducted on rocky, uneven substrates, or at locations with underwater obstructions. Effort was standardized to the number of fish collected per minute of trawling.
ArcGIS 10.2 was used to select sampling sites across water depth strata (<2 m, 1-2 m, and > 2 m) present in each study area according to a stratified randomized design (Hoffman et al. 2011). Study areas were predefined using polygon shapefiles in ArcGIS. A bathymetry data layer was used to define depth strata within the polygon. Random points, corresponding to GIS coordinates, were selected within each depth strata using the Create Random Points function in ArcGIS 10.2. Due to lack of available bathymetric data for many of the areas to be sampled (shallow, nearshore, outside of dredged areas), shape files were modified for estimated depth ranges corresponding to gear types. Gears used during this study and the amount of effort deployed was based on recommendations from Trebitz et al. (2009) and USFWS (2014c). When a randomly selected point was unable to be sampled (e.g. wrong depth, inaccessibility), an alternate site was selected from a list of previously allocated randomized alternate locations. All fish collected during sampling were identified to species and total length measurements (mm) were recorded on 50 random specimens per species. All species of fish were released unharmed except Round Gobies and Tubenose Gobies. Gobies were euthanized in accordance with state regulations and the terms of scientific collection permits. When a fish could not be identified in the field, it was preserved in 95% ethanol and retained for identification in the lab. Tissue samples were also collected from select fish whose identification was questionable. Tissue samples were taken by clipping a small portion of a fin and placing it in a vial of ethanol. Tissue sample confirmations are pending analysis conducted by the USFWS, Whitney Genetics Laboratory (Onalaska, WI). Water quality data was collected at each site and included surface temperature (°C), dissolved oxygen (mg/l), and conductivity (µS/cm; at electrofishing sites).

12
4.2 Data Analysis: Species Accumulation and Extrapolated Richness
Catch per unit effort was determined for all fish species captured. Species accumulation theory was used to estimate juvenile and adult species richness and species accumulation at each location across the data series, 2013-2017. Any unique or new species collected in 2017, but not seen in previous years, were noted. Also noted were singletons, a species that was captured on a single occasion over the sampling series (2013-2017), and doubletons, a species that was captured on two occasions over the sampling series (2013-2017). Singletons and doubletons identify rare species and contribute to rarefaction analysis because they can affect the number of predicted species. If there are many singletons and/or doubletons the number of species predicted will increase. Sample-based rarefaction and extrapolation were calculated with R-2.0.12 using the “iNEXT” package Chao asymptotic richness estimator (Chao et al. 2014; Hsieh et al. 2016; R Core Team 2016). Species accumulation curves were generated using species abundance data (randomized pooling of data) from 2013-2017 and the Chao asymptotic richness estimator was applied for 300 sample extrapolations at 100 replications. The methods used followed Chao et al. (2009). Estimated species richness is the asymptote of the extrapolated rarefaction curve.
5 Results
Early detection and monitoring efforts for adult and juvenile fish were conducted on Lake Huron from July 10, 2017 to September 20, 2017. Surveillance crews examined a total of 17,735 fish across 72 sampling events in two areas for undocumented species. A total of 44 species were observed. One previously undocumented species, Tubenose Goby, was captured from the lower St. Marys River. Tubenose Goby have been captured at other locations within the Great Lakes Basin. A number of existing invasive and non-native species were collected including Common Carp, Rainbow Smelt, Round Goby, Threespine Stickleback, and White Perch. Results for each of the sampling areas follow.
5.1 Lower St. Marys River
A total of 7,109 fish from 37 species were collected across 42 sampling events during July and September 2017 (Table 1, Figure 2). One Tubenose Goby, an invasive species, was collected in a new sighting for the St. Marys River. Tubenose Goby are found elsewhere within the Great Lakes. The five most abundant species captured were Mimic Shiner Notropis volucellus (47.1% of total catch), White Sucker Catostomus commersonii (13.4% of total catch), Bluntnose Minnow Pimephales notatus (5.7% of total catch), Common Shiner Luxilus cornutus (4.9% of total catch ), and Yellow Perch Perca flavescens (4.9% of total catch).

13
A total of 308 fish representing 22 species were captured as a result of 15 nighttime electrofishing transects over 2.50 hours of effort sampled between July 17-July 26, 2017 and September 12-September 13, 2017 at water temperatures between14.9 and 22.3°C. The most abundant species were Emerald Shiner Notropis atherinoides (27.6% of total catch), Rainbow Smelt (17.2% of total catch), and Bluntnose Minnow (13.6% of total catch).
A total of 6,101 fish representing 31 species were captured as a result of 18 paired fyke net sets overnight between July 11 and July 21, 2018 at water temperatures between 16.1 and 23.8°C. The most abundant species were Mimic Shiner (50.5% of total catch), White Sucker (15.4% of total catch), Bluntnose Minnow (6.0% of total catch), Common Shiner (5.7% of total catch), and Yellow Perch (5.3% of total catch).
A total of 700 fish representing 15 species were captured as a result of nine bottom trawl tows over 45 minutes of effort conducted between July 10 and July 21, 2017 at bottom water temperatures between 10.0 and 19.7°C. The most abundant species observed were Mimic Shiner (37.1% of total catch), Johnny Darter Etheostoma nigrum (20.9% of total catch), Ninespine Stickleback Pungitius pungitius (12.7% of total catch), and Trout-perch Percopsis omiscomaycus (11.9% of total catch).
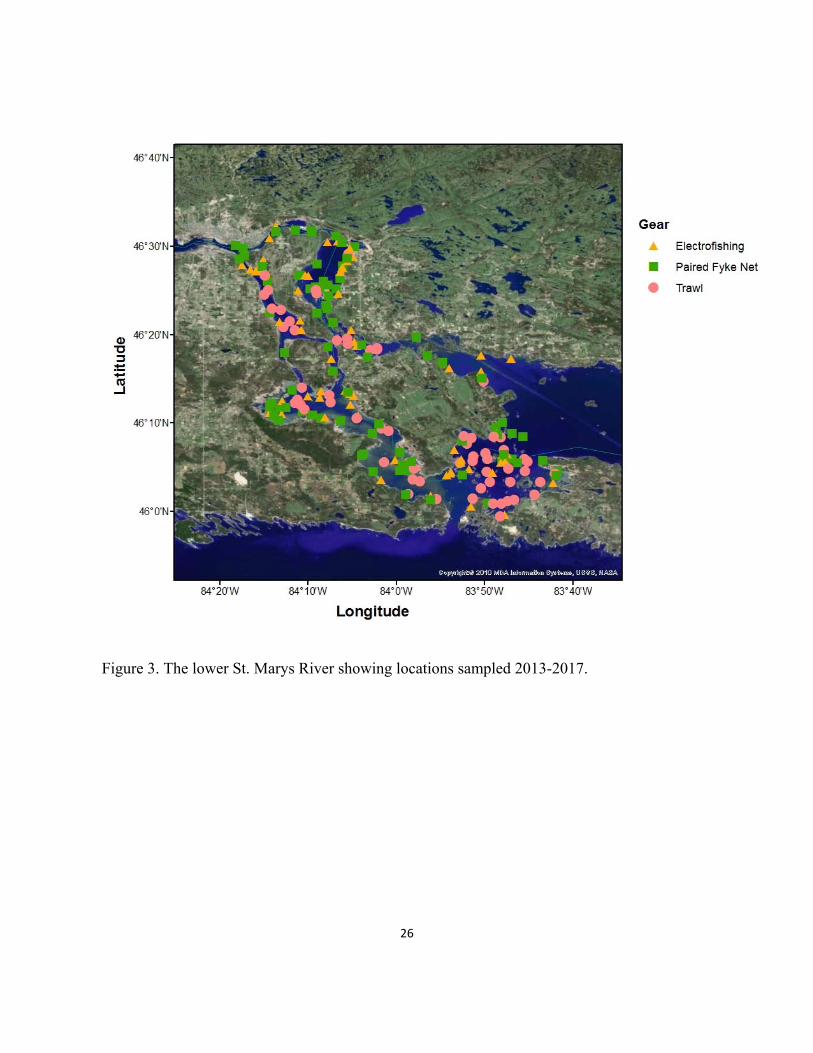
A total of 58 species were captured in the lower St. Marys River from 2013 to 2017 across 211 sampling events using all gears (Figure 3). A total of 66 species are estimated to be present (Table 2, Figure 4).
5.2 Saginaw Bay
A total of 10,626 fish from 27 species were collected across 30 sampling events during August and September 2017 (Table 3, Figure 5). The five most abundant species collected were Yellow Perch (69.1% of total catch), Round Goby (9.2% of total catch), Gizzard Shad Dorosoma cepedianum (5.5% of total catch), Trout-perch (4.4% of total catch), and Channel Catfish Ictalurus punctatus (2.1% of total catch).
A total of 8,061 fish representing 25 species were collected as a result of 15 paired fyke net sets sampled between August 1 and August 10, 2018 at water temperatures between 23.0 and 27.0°C. The most abundant species were Yellow Perch (86.8% of total catch), Round Goby (5.9% of total catch), Bluegill Lepomis macrochirus (2.2% of total catch), and Black Crappie Pomoxis nigromaculatus (2.1% of total catch).
14
A total of 2,565 fish representing 18 species were collected as a result of 15 bottom trawl tows over 1.25 hours of effort sampled between September 18 and September 20, 2018 at bottom water temperatures between 20.4 and 23.5°C. The most abundant species were Gizzard Shad (22.5% of total catch), Round Goby (19.3% of total catch), Trout-perch (18.2% of total catch), Yellow Perch (13.6% of total catch), and Channel Catfish (8.6% of total catch).
A total of 27 species were captured in Saginaw Bay from during 2017 across 30 sampling events using all gears (Figure 5). A total of 30.9 species were estimated to be present (Figure 6, Table 4). This was the first year of sampling at Saginaw Bay and more samples are required to better estimate species present.
6 Discussion
The 2017 field season was the fifth year of sampling for the early detection of non-native species at the lower St. Marys River location and the first year of sampling at the Saginaw Bay location.
A number of juvenile and adult fish species (both native and non-native) were collected with an assortment of gears from the lower St. Marys River during 2013-2017. One new collection of Tubenose Goby was captured from the Potaganissing Bay area of the St. Marys River during 2017. Tubenose Goby are established within the Great Lakes Basin, however this was the first confirmed capture of Tubenose Goby from the St. Marys River. No other previously undocumented non-native species were captured. Non-native species, likely present at low abundance or rare within the first years of invasion, can be difficult to detect as juveniles or adults. Gear avoidance, refined habitat requirements, and fish behavior make sampling for juvenile and adult fish challenging. Multiple gear types, and both passive and active gears, were used during sampling in an effort to collect fish found in a variety of habitats and account for diversity in fish behavior.
A long-term monitoring program for rare or unique species is challenging due to the need to balance available resources with adequate detection (Trebitz et al. 2009). Exorbitant amounts of effort are required for detection of rare species or to gather the entire species richness available at a given location. An adaptive approach is beneficial because results from previous sampling can be incorporated to improve future survey design and sampling effectiveness. Hoffman et al. (2011) found that re-sampling using a targeted sampling design (i.e. resampled areas with high species richness) in Lake Superior’s Duluth-Superior Harbor resulted in greater species richness and a significantly higher probability of detecting non-native species than using a spatially balanced random design (also see Trebitz et al. 2009). Although the effort required to detect rare

15
(i.e. non-natives at first introduction) species remained large, non-metric multi-dimensional scaling analysis could be used to determine whether gear types were capturing redundant species (cf. Ruetz et al. 2007; Frances et al. 2014). Where two gear types captured redundant species assemblages, the least efficient gear (according to the ability to catch unique species) could be reduced, allowing additional effort towards the more efficient gear type, and increase sampling efficiency. Despite high performance with reduced gears, it is recognized that a single sampling gear approach only provides a partial representation of the juvenile and adult fish assemblage (Murphy and Willis 1996), and multi-gear approaches are required to adequately characterize fish communities (Jackson and Harvey 1997; Eggleton et al. 2010; Hoffman et al. 2011; Ruetz et al. 2007). These strategies have been incorporated into our adaptive sampling regime (although not detailed in this document).
Early detection and monitoring for non-native species will continue in Lake Huron and across Alpena FWCO’s area of coverage during 2018. The survey design will continue to be critically evaluated in an effort to enhance detection of non-native species. Options for increasing sampling efficiency will be considered in order to provide the most comprehensive non-native species early detection and monitoring program.
7 References
ACRCC (Asian Carp Regional Coordinating Committee). 2016. Fiscal Year 2017 Asian carp control strategy framework. URL: http://www.asiancarp.us/documents/2017ActionPlan.pdf. ASA (American Sportfishing Association). 2008. Today’s angler: a statistical profile of anglers, their targeted species, and expenditures. American Sportfishing Association, Alexandria, Virginia. Baerwaldt, K., A. Benson, and K. Irons. 2013. Asian Carp distribution in North America. Report to the Asian Carp Regional Coordinating Committee, April 2013. Chadderton, L., G. Annis, A. Tucker, A. Dahlstrom, D. Kashian, J. Hoffman, A. Trebitz, T. Strakosh, S. Hensler, M. Hoff, J. Bossenbroek, S. Le Sage, N. Poppoff, R. Wakeman, and J. Navarro. 2016. Development of a Regional Surveillance Plan for the U.S. Waters of the Laurentian Great Lakes. Symposium conducted at the meeting of International Conference on Aquatic Invasive Species, Winnipeg, Manitoba, Canada. Chao, A., R. K. Colwell, C. W. Lin, and N. J. Gotelli. 2009. Sufficient sampling for asymptotic minimum species richness estimators. Ecology 90(4):1125-1133.

16
Chao, A., N. J. Gotelli, T. C. Hsieh, E. L. Sander, K. H. Ma, R. K. Colwell, and A. M. Ellison. 2014. Rarefaction and extrapolation with Hill numbers: a framework for sampling and estimation in species diversity studies. Ecological Monographs 84:45-67. Chapman, D. C., J. J. Davis, J. A. Jenkins, P. M. Kocovsky, J. G. Miner, J. Farver, and P. R. Jackson. 2013. First evidence of Grass Carp recruitment in the Great Lakes Basin. Journal of Great Lakes Research 39:547-554. Dissanayake, A. A., C. M. Wagner, and M. G. Nair. 2016. Chemical characterization of lipophilic constituents in the skin of migratory adult sea lamprey from the Great Lakes region. PloS one 11(12):e0168609. Eggleton, M. A., J. R Jackson, and B. J. Lubinski. 2010. Comparison of gears for sampling littoral-zone fishes in floodplain lakes of the Lower White River, Arkansas. North American Journal of Fisheries Management 30(4):928-939. Embke, H. S., P. M. Kocovsky, C. A. Richter, J. J. Pritt, C. M. Mayer, and S. S. Qian. 2016. First direct confirmation of grass carp spawning in a Great Lakes tributary. Journal of Great Lakes Research 42(4):899-903. Evans, D. O. and D. H. Loftus. 1987. Colonization of inland lakes in the Great Lakes region by Rainbow Smelt, Osmerus mordax: their freshwater niche and effects on indigenous fishes. Canadian Journal of Fisheries and Aquatic Sciences 44:249-266. Fisher, J. P., J. D. Fitzsimmons, G. F. Combs, and J. M. Spitsbergen. 1996. Naturally occurring thiamine deficiency causing reproductive failure in Finger Lakes Atlantic Salmon and Great Lakes Lake Trout. Transactions of the American Fisheries Society 125:167-178. Frances, J. T., J. A. Chiotti, J. C. Boase, M. V. Thomas, B. A. Manny, and E. F. Roseman. 2014. A description of the nearshore fish communities in the Huron-Erie Corridor using multiple gear types. Journal of Great Lakes Research 40:52-61. GLMRIS (Great Lakes Mississippi River Interbasin Study). 2011. Non-native species of concern and dispersal risk for the Great Lakes and Mississippi River Interbasin Study. GLRI (Great Lakes Restoration Initiative). 2014. Great Lakes Restoration Initiative Action Plan II. URL: https://www.glri.us//actionplan/pdfs/glri-action-plan-2.pdf. GLWQA (Great Lakes Water Quality Agreement). 1987. Protocol amending the agreement between Canada and The United States of America on Great Lakes water quality, 1978, as amended on October 16, 1983 and on November 18, 1987 and on September 7, 2012. Hoffman, J. C., J. R. Kelly, A. S. Trebitz, G. S. Peterson, and C. W. West. 2011. Effort and potential efficiencies for aquatic non-native species early detection. Canadian Journal of Fisheries and Aquatic Sciences 68:2064-2079.

17
Hoffman, J. C., J. Schloesser, A. S. Trebitz, G. S. Peterson, M. Gutsch, H. Quinlan, and J. R. Kelly. 2016. Sampling design for early detection of aquatic invasive species in Great Lakes ports. Fisheries 41(1):26-37. Hsieh, T. C., K. H. Ma, and A Chao. 2016. iNEXT: iNterpolation and EXTrapolation for species diversity. R package version 2.0.12. URL: http://chao.stat.nthu.edu.tw/blog/software-download/. Jackson, D. A., and H. H. Harvey. 1997. Qualitative and quantitative sampling of lake fish communities. Canadian Journal of Fisheries and Aquatic Sciences 54:2807-2813. Jones, M. L. 2007. Toward improved assessment of Sea Lamprey population dynamics in support of cost-effective Sea Lamprey management. International Association of Great Lakes Research 33:35-47. Kolar, C. S., and D. M. Lodge. 2002. Ecological predictions and risk assessment for alien fishes in North America. Science 298:1233-1236. Laws, E. A., and R. S. J. Weisburd. 1990. Use of silver carp to control algal biomass in aquaculture ponds. Progressive Fish-Culturist 52:1-8. Leung, B., D. M. Lodge, D. Finnoff, J. F. Shogren, M. A. Lewis, and G. Lamberti. 2002. An ounce of prevention or a pound of cure: bioeconomic risk analysis of invasive species. Proceedings of the Royal Society of London B 269:2407-2413. Lovell, S. J., S. F. Stone, and L. Fernandez. 2006. The economic impact of aquatic invasive species: a review of the literature. Agricultural and Resource Economics Review 35:195-208. MICRA (Mississippi Interstate Cooperative Resource Association). 2002. Asian carp threat to the Great Lakes. River Crossings: the Newsletter of the Mississippi Interstate Cooperative Resource Association 11(3):1-2. Mills, E. L., J. H. Leach, J. T. Carlton, and C. L. Secor. 1993. Exotic species in the Great Lakes: a history of biotic crises and anthropogenic introductions. International Association of Great Lakes Research 19:1-54. Mills, E. L., J. H. Leach, J. T. Carlton, and C. L. Secor. 1994. Exotic species and the integrity of the Great Lakes: lessons from the past. Bioscience 44:666-676. Morrison, B. J., J. C. Casselman, T. B. Johnson, and D. L. Noakes. 2004. New Asian Carp genus (Hypophthalmichthys) in Lake Erie. Fisheries 29:6, 7, 44. Murphy, B. R., and D. W. Willis, editors. 1996. Fisheries techniques, 2nd edition. American Fisheries Society, Bethesda, Maryland.

18
NOAA (National Oceanic and Atmospheric Administration). 2016. Great Lakes Aquatic Nonindigenous Species Information System. URL: http://www.glerl.noaa.gov/res/Programs/ glansis/glansis.html. R Core Team. 2016. R: A language and environment for statistical computing. R Foundation for Statistical Computing, Vienna, Austria. URL: https://www.R-project.org/. Riccardi, A. 2006. Patterns of invasion in the Laurentian Great Lakes in relation to changes in vector activity. Diversity and Distributions 12:425-433. Rosaen, A. L., E. A. Grover, and C. W. Spencer. 2012. The cost of aquatic invasive species to Great Lakes states. Anderson Economic Group, East Lansing, Michigan. Rothlisberger, J. D., D. C. Finnoff, R. M. Cooke, and D. M. Lodge. 2012. Ship-borne nonindigenous species diminish Great Lakes ecosystem services. Ecosystems 15(3):1-15. Ruetz, C. R. III, D. G. Uzarski, D. M. Kreuger, and E. S. Rutherford. 2007. Sampling a littoral fish assemblage: comparison of small-mesh fyke netting and boat electrofishing. North American Journal of Fisheries Management 2793:825-831. Smith, B. R., and J. J. Tibbles. 1980. Sea lamprey (Petromyzon marinus) in Lakes Huron, Michigan, and Superior: history of invasion and control, 1936-78. Canadian Journal of Fisheries and Aquatic Sciences 37:1780-1808. Stone, N. C., E. D. Heikes, and D. Freeman. 2000. Bighead Carp. Southern Regional Aquaculture Center Publication 438. Southern Regional Aquaculture Center, Stoneville, Mississippi. Trebitz, A. S., J. R. Kelly, J. C. Hoffman, G. S. Peterson, and C. W. West. 2009. Exploiting habitat and gear patterns for efficient detection of rare and non-native benthos and fish in Great Lakes coastal ecosystems. Aquatic Invasions 4:651-667. USEPA (U. S. Environmental Protection Agency). 2008. Predicting future introductions of nonindigenous species to the Great Lakes. EPA/600/R-08/066F. National Center for Environmental Assessment, Washington, DC. URL: http://www.epa.gov/ncea. USFWS (U. S. Fish and Wildlife Service). 2014a. Lake Erie implementation plan for the early detection of non-native fishes and select benthic macroinvertebrates. U. S. Fish and Wildlife Service, Alpena Fish and Wildlife Conservation Office, Alpena, Michigan and Lower Great Lakes Fish and Wildlife Conservation Office, Basom, New York. USFWS. 2014b. Strategic framework for the early detection of non-native fishes and select benthic macroinvertebrates in the Great Lakes. Great Lakes Comprehensive Aquatic Invasive Species Early Detection Monitoring Plan. USFWS. 2014c. Recommended sampling gear types and standard operating procedures for the early detection of non-native fishes and select benthic macroinvertebrates in the Great Lakes.

19
USFWS. 2016a. Lake Huron Implementation Plan for the Early Detection of Non-native Species. U.S. Fish and Wildlife Service, Alpena Fish and Wildlife Conservation Office, Alpena, Michigan. 28 pp. USFWS. 2016b. Early detection and monitoring of non-native fishes in Lake Huron, 2013-2015. U.S. Fish and Wildlife Service, Alpena Fish and Wildlife Conservation Office, Alpena, Michigan. 30 pp. USFWS. 2017a. Early detection and monitoring of non-native fishes and benthic macroinvertebrates in Lake Erie, 2016. U. S. Fish and Wildlife Service, Alpena Fish and Wildlife Conservation Office, Alpena, Michigan and U. S. Fish and Wildlife Service, Lower Great Lakes Fish and Wildlife Conservation Office, Basom, New York. 89 pp. USFWS. 2017b. Early detection and monitoring of non-native fishes in Lake Huron, 2016. U.S. Fish and Wildlife Service, Alpena Fish and Wildlife Conservation Office, Alpena, Michigan. 32 pp. USFWS. 2018. Early detection and monitoring of non-native juvenile and adult fishes in Lake Erie, 2016. U. S. Fish and Wildlife Service, Alpena Fish and Wildlife Conservation Office, Alpena, Michigan and U. S. Fish and Wildlife Service, Lower Great Lakes Fish and Wildlife Conservation Office, Basom, New York. N pp. USGS (U. S. Geological Survey). 2017. Nonindigenous Aquatic Species Database, Gainesville, Florida. URL: http://nas.er.usgs.gov. Vanderploeg, H. A., T. F. Nalepa, D. J. Jude, E. L. Mills, K. T. Holeck, J. R. Liebig, I. A. Grigorovich, and H. Ojaveer. 2002. Dispersal and emerging ecological impacts of Ponto-Caspian species in the Laurentian Great Lakes. Canadian Journal of Fisheries and Aquatic Sciences 59:1209-1228. Vörös, L., I. Oldal, M. Présing, and K. V. Balogh. 1997. Size-selective filtration and taxon specific digestion of plankton algae by Silver Carp (Hypophthalmichthys molitrix Val.). Hydrobiologia 342/343:223-228.
20
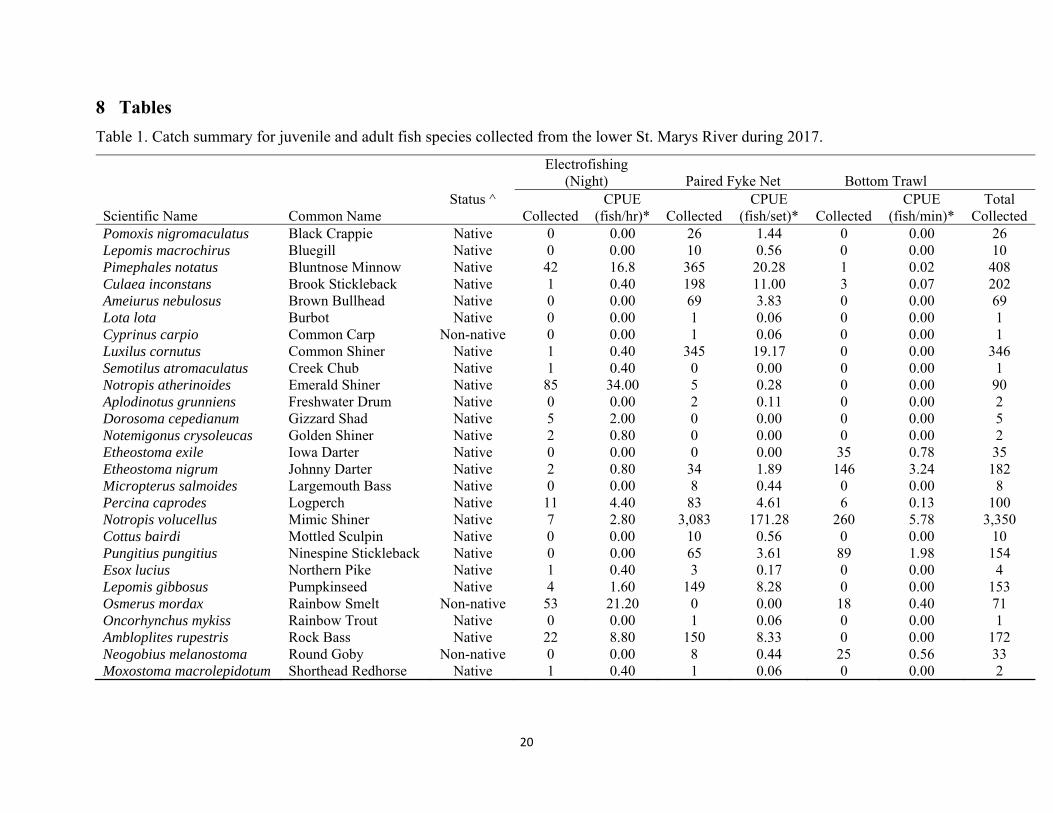
8 Tables
Table 1. Catch summary for juvenile and adult fish species collected from the lower St. Marys River during 2017.
Scientific Name
Common Name
Electrofishing (Night) Paired Fyke Net Bottom Trawl
Status ^ Collected
CPUE (fish/hr)* Collected
CPUE (fish/set)* Collected
CPUE (fish/min)*
Total Collected
Pomoxis nigromaculatus Black Crappie Native 0 0.00 26 1.44 0 0.00 26 Lepomis macrochirus Bluegill Native 0 0.00 10 0.56 0 0.00 10 Pimephales notatus Bluntnose Minnow Native 42 16.8 365 20.28 1 0.02 408 Culaea inconstans Brook Stickleback Native 1 0.40 198 11.00 3 0.07 202 Ameiurus nebulosus Brown Bullhead Native 0 0.00 69 3.83 0 0.00 69 Lota lota Burbot Native 0 0.00 1 0.06 0 0.00 1 Cyprinus carpio Common Carp Non-native 0 0.00 1 0.06 0 0.00 1 Luxilus cornutus Common Shiner Native 1 0.40 345 19.17 0 0.00 346 Semotilus atromaculatus Creek Chub Native 1 0.40 0 0.00 0 0.00 1 Notropis atherinoides Emerald Shiner Native 85 34.00 5 0.28 0 0.00 90 Aplodinotus grunniens Freshwater Drum Native 0 0.00 2 0.11 0 0.00 2 Dorosoma cepedianum Gizzard Shad Native 5 2.00 0 0.00 0 0.00 5 Notemigonus crysoleucas Golden Shiner Native 2 0.80 0 0.00 0 0.00 2 Etheostoma exile Iowa Darter Native 0 0.00 0 0.00 35 0.78 35 Etheostoma nigrum Johnny Darter Native 2 0.80 34 1.89 146 3.24 182 Micropterus salmoides Largemouth Bass Native 0 0.00 8 0.44 0 0.00 8 Percina caprodes Logperch Native 11 4.40 83 4.61 6 0.13 100 Notropis volucellus Mimic Shiner Native 7 2.80 3,083 171.28 260 5.78 3,350 Cottus bairdi Mottled Sculpin Native 0 0.00 10 0.56 0 0.00 10 Pungitius pungitius Ninespine Stickleback Native 0 0.00 65 3.61 89 1.98 154 Esox lucius Northern Pike Native 1 0.40 3 0.17 0 0.00 4 Lepomis gibbosus Pumpkinseed Native 4 1.60 149 8.28 0 0.00 153 Osmerus mordax Rainbow Smelt Non-native 53 21.20 0 0.00 18 0.40 71 Oncorhynchus mykiss Rainbow Trout Native 0 0.00 1 0.06 0 0.00 1 Ambloplites rupestris Rock Bass Native 22 8.80 150 8.33 0 0.00 172 Neogobius melanostoma Round Goby Non-native 0 0.00 8 0.44 25 0.56 33 Moxostoma macrolepidotum Shorthead Redhorse Native 1 0.40 1 0.06 0 0.00 2

21
Table 1 continued.
Scientific Name
Common Name
Electrofishing (Night) Paired Fyke Net Bottom Trawl
Status ^ Collected
CPUE (fish/hr)* Collected
CPUE (fish/set)* Collected
CPUE (fish/min)*
Total Collected
Moxostoma anisurum Silver Redhorse Native 0 0.00 1 0.06 0 0.00 1 Micropterus dolomieu Smallmouth Bass Native 17 6.80 85 4.72 0 0.00 102 Notropis hudsonius Spottail Shiner Native 12 4.80 56 3.11 14 0.31 82 Gasterosteus aculeatus Threespine Stickleback Non-native 1 0.40 51 2.83 13 0.29 65 Percopsis omiscomaycus Trout-perch Native 2 0.80 20 1.11 83 1.84 105 Proterorhinus semilunaris Tubenose Goby Non-native 0 0.00 0 0.00 1 0.02 1 Sander vitreus Walleye Native 6 2.40 4 0.22 0 0.00 10 Morone americana White Perch Non-native 0 0.00 5 0.28 0 0.00 5 Catostomus commersonii White Sucker Native 14 5.60 938 52.11 3 0.07 955 Perca flavescens Yellow Perch Native 18 7.20 324 18.00 3 0.07 345
* Sampling effort for electrofishing was 15 transects for 2.50 hours, paired fyke nets was 18 overnight sets, and bottom trawls was 9 trawl tows for 45 minutes. ^ Species not native to Lake Huron according to the Great Lakes Aquatic Nonindigenous Species Information System (USGS 2017).
Table 2. Species richness, number of unique species, and efficiency for juvenile and adult sampling gears fished from 2013-2017 in the lower St. Marys River.
Sampling Dataset
Observed Species
Richness
Unique Species
Estimated Species
Richness SE LCL
Sampling Efficiency (%) UCL
All gears 58 - 66.292 6.874 60.009 92.221 87.5
Paired fyke nets 45 6 59.938 12.324 48.639 106.32 75.1
Bottom trawls 27 3 33.018 5.98 28.186 57.543 81.8
Electrofishing 46 8 74.441 19.508 54.422 142.05 61.8 * SE is standard error, LCL is lower confidence limit, and UCL is upper confidence limit.

22
Table 3. Catch summary for juvenile and adult fish species collected from Saginaw Bay during 2017.
Scientific Name
Common Name
Paired Fyke Net Bottom Trawl
Status ^ Collected
CPUE (fish/set)* Collected
CPUE (fish/min)*
Total Collected
Fundulus diaphanus Banded Killifish Native 1 0.07 0 0.00 1 Pomoxis nigromaculatus Black Crappie Native 172 11.47 19 0.25 191 Lepomis macrochirus Bluegill Native 175 11.67 0 0.00 175 Amia calva Bowfin Native 3 0.20 0 0.00 3 Ameiurus nebulosus Brown Bullhead Native 1 0.07 0 0.00 1 Ictalurus punctatus Channel Catfish Native 2 0.13 220 2.93 222 Cyprinus carpio Common Carp Non-native 5 0.33 3 0.04 8 Notropis atherinoides Emerald Shiner Native 5 0.33 11 0.15 16 Pylodictus olivaris Flathead Catfish Not-native 2 0.13 0 0.00 2 Aplodinotus grunniens Freshwater Drum Native 1 0.07 123 1.64 124 Dorosoma cepedianum Gizzard Shad Native 4 0.27 578 7.71 582 Lepomis cyanellus Green Sunfish Native 2 0.13 0 0.00 2 Etheostoma nigrum Johnny Darter Native 1 0.07 0 0.00 1 Micropterus salmoides Largemouth Bass Native 9 0.60 6 0.08 15 Percina caprodes Logperch Native 7 0.47 34 0.45 41 Notropis volucellus Mimic Shiner Native 17 1.13 124 1.65 141 Lepomis gibbosus Pumpkinseed Native 38 2.53 0 0.00 38 Carpiodes cyprinus Quillback Native 0 0.00 3 0.04 3 Ambloplites rupestris Rock Bass Native 42 2.80 18 0.24 60 Neogobius melanostoma Round Goby Non-native 477 31.80 496 6.61 973 Micropterus dolomieu Smallmouth Bass Native 8 0.53 0 0.00 8 Notropis hudsonius Spottail Shiner Native 40 2.67 13 0.17 53 Percopsis omiscomaycus Trout-perch Native 0 0.00 468 6.24 468 Sander vitreus Walleye Native 6 0.40 67 0.89 73 Morone chrysops White Bass Native 1 0.07 4 0.05 5 Morone americana White Perch Non-native 45 3.00 29 0.39 74 Perca flavescens Yellow Perch Native 6,997 466.47 349 4.65 7,346
* Sampling effort for paired fyke nets was 15 overnight sets and bottom trawls was 15 trawl tows for 75 minutes. ^ Species not native to Lake Huron according to the Great Lakes Aquatic Nonindigenous Species Information System (USGS 2017).

23
Table 4. Species richness, number of unique species, and efficiency for juvenile and adult sampling gears fished during 2017 in Saginaw Bay.
Sampling Dataset
Observed Species
Richness
Unique Species
Estimated Species Richness SE LCL
Sampling Efficiency (%) UCL
All gears 27 - 30.9 5.128 27.537 54.847 87.5
Paired fyke nets 25 9 30.6 6.079 25.993 56.572 81.7
Bottom trawls 18 2 18.6 1.235 18.052 25.409 96.7 * SE is standard error, LCL is lower confidence limit.

24
9 Figures
Figure 1. The Lake Huron Basin showing areas sampled during 2017.

25
Figure 2. The lower St. Marys River showing locations sampled during 2017.
26
Figure 3. The lower St. Marys River showing locations sampled 2013-2017.

27
Figure 4. Species accumulation curve for all gears combined in the lower St. Marys River, 2013-2017. Schao = total number of species estimated based on the Chao asymptotic richness estimator (horizontal dotted line). Sobs = total number of species caught. Shaded regions represent 95% confidence intervals.

28
Figure 5. Saginaw Bay showing locations sampled during 2017.

29
Figure 6. Species accumulation curve for all gears combined in Saginaw Bay for 2017. Schao = total number of species estimated based on the Chao asymptotic richness estimator (horizontal dotted line). Sobs = total number of species caught. Shaded regions represent 95% confidence intervals.