udk 343.35(474.5) li542 pilietin` aljansÀ prie— … · doc. dr. vladas gaidys, ... from findings...
TRANSCRIPT

ISBN 9955-682-44-2
PILIETINÁ ALJANSÀ PRIEÐ KORUPCIJÀ REMIA JUNGTINËS KARALYSTËS AMBASADA
UDK 343.35(474.5)Li542
Edited by SERGEJ MURAVJOVDesigned by ALGIMANTAS DAPÐYS
© Translated by Metropolio vertimai, 2006© Transparency International
Lithuanian Chapter, 2006© Eugrimas Publishing House, 2006
All rights reserved. No part of this publication may be reproduced, stored in or introducedinto a retrieval system, or transmitted, in any form, or by any means, electronic, mechanical,photocopying, recording, or otherwise, without the prior permission of the copyright holder.

CONTENTS
FOREWORD BY TRANSPARENCY INTERNATIONALLITHUANIAN CHAPTER ................................................................................. 7
LITHUANIAN MAP OF CORRUPTION 2001�2004
INTRODUCTION .................................................................................................... 11
I. EXPERIENCE OF BRIBERY ........................................................................... 191.1. Experience of Bribery by Lithuanian Residents ...................................... 211.2. Experience of Bribery by Lithuanian Company Managers .................... 37
II. ATTITUDE TOWARDS CORRUPTION ...................................................... 602.1. Lithuanian Residents� Opinion about Corruption ................................... 622.2. Lithuanian Company Managers� Opinion about Corruption ................. 81
III. ANTI-CORRUPTION POTENTIAL ............................................................. 953.1. Anti-Corruption Potential of Lithuanian Residents ................................ 983.2. Anti-Corruption Potential of Lithuanian Company Managers ............ 112
CONCLUSIONS ..................................................................................................... 127
LITHUANIAN MAP OF CORRUPTION 2005
PEOPLE SEE INCREASINGLY MORE CORRUPTION ............................ 133
LITHUANIAN MAP OF CORRUPTION 2005 ............................................... 136
COMPARING THE LITHUANIAN MAP OF CORRUPTION 2005TO THE DATA OF PREVIOUS SURVEYS ............................................. 146
SUMMARY AND FINDINGS ............................................................................ 156


FOREWORDBY TRANSPARENCY INTERNATIONAL
LITHUANIAN CHAPTER
The aim of this publication is to introduce an international audienceto the anti-corruption discourse in Lithuania. This book consists of twoparts: an analytical study �Lithuanian Map of Corruption 2001-2004�; anda compilation of results and insights of the latest Map of Corruptioncomposed in 2005, which together offer the latest and most detailedinsight into the perception and experience of corruption by Lithuanianresidents and company executives.
Transparency International Lithuanian Chapter (TILS) views suchsociological surveys as the most reliable and effective tool to identifycorrupt practices in Lithuania, learn about personal experiences of con-fronting bribery and evaluate anticorruption potential. While its activi-ties range from raising anti-corruption awareness to active engagementinto transparency-related state policies, the Chapter has made a consciouseffort to base its rhetoric on hard sociological data.
TILS would like to thank the United Nations Development Programfor its kind and wholehearted support of anti-corruption activities inLithuania and in making this publication possible.
This is the first TILS publication in English and hopefully not thelast. Lithuania is now a member of the European Union but there is stillconsiderable work to be done in the field of transparency by bridgingthe gap between the acqui and actual practices. At the same time, thereis an increasing external demand for information about democratizationprocesses in Lithuania.

Reviewed by:Doc. Dr. VLADAS GAIDYS,
Prof. Dr. ALGIS KRUPAVIÈIUS

LITHUANIANMAP OF CORRUPTION
2001�2004
Rasa AliðauskienëAleksandras Dobryninas
Laima Þilinskienë


INTRODUCTION
There is hardly any need to prove that corruption is a relevant and,alas, painful problem of Lithuanian society. It is illustrated by re-occur-ring corruption scandals, assessments of various influential internationalorganisations, and finally, the Lithuanian residents themselves who seecorruption as one of the most aching vices of today�s social life.1 Thereis also hardly any need to explain that curbing corruption is one of themost important priorities of the state: it is not just a formal requirementof the European Commission, but rather a well comprehended internalneed documented in several Lithuania�s political and legal instruments.
However, it is hardly possible not to see that the so-called fight againstcorruption takes the form of vain and desperate political rhetoric. Cor-ruption is considered a social evil at which the radically thinking popu-lation suggests aiming cannons. All of these ideas lack understanding thatcorruption is not some sort of a monster the destruction of which is justa matter of good will and heroic resolution. It is rather a complex phe-nomenon entailing moral, legal, political and management issues.
Although there is no universally recognised definition of corruption,this social phenomenon is often described as an abuse of power for pri-vate gain. Such a concept of corruption places an emphasis on the sourceof corruption: a conflict of public and private interests. Resolution ofthe conflict in every society depends on a number of factors: establishedmoral values, administrative and management capacities as well as po-litical and legal systems that mould them. Most often corruption occurswhen the principles of responsibility, accountability, transparency andopenness are put into jeopardy.
1 The 2004 social survey Corruption Map in the City of Vilnius conducted by the Trans-parency International Lithuanian Chapter of and Baltijos tyrimai showed that corruptionhits the top ten list of the most painful social problems.

12 INTRODUCTION
Traditionally, corruption is associated with the governmental sector;however, recently it has also been referred to when talking about thenon-governmental sector (private companies, mass media, public bodies,etc.). Corruption can be sorted by its range (grand and petty corruption);goal (political, state capture, and administrative corruption, the latterreferring to the application of favourable laws and regulations); the modeof operation (bribery, nepotism, abuse of office, etc.), the context ofoperation (monetary corruption in a market economy and favouritismin a traditional or planned economy), and the mode of conduct (activeor passive corruption), etc.
Corruption is often claimed to be an inevitable response to unsoundmanagement and defective public administration, a natural attempt toavoid decision-making routine, red-tape obstacles and incompetence ofpublic officials. As if it were to facilitate, though illegitimately, achieve-ment of concrete and positive results by corruption participants. Forinstance, a company that corruptly obtains a grand contract in a publicprocurement tender ensures profit and earnings both for its owners andemployees; moreover, �benefits� are granted to those who help to winthe contract. However, does such practice favour the other members ofsociety? The answer is simple and straightforward: in the long run suchpractice has a destructive impact upon the general public as it under-mines public confidence, making public management chaotic and unpre-dictable and eventually resulting in poverty and demoralisation.
This is particularly characteristic of those societies that due to cer-tain reasons are not rich or their welfare has suffered from various po-litical and economic �experiments�. In such societies the wish to createeffective market economy mechanisms, modern management and admin-istrative principles inevitably are confronted with the problem of the wayin which to tackle corruption. However, corruption is not just a problemof developing or transitional societies. No country is immune from itsscandals irrespective of the level of the country�s development. There-fore, it is wrong to think that organising anti-corruption efforts is just aspecial challenge for Lithuania or the other former �communist� Centraland Eastern European states. The 2003 United Nations Conventionagainst Corruption lays down that �corruption is no longer a local matterbut a transnational phenomenon that affects all societies and economies,making international co-operation to prevent and control it essential.�2
2 United Nations Convention Against Corruption. United Nations, 2003.

13INTRODUCTION
Forestalling corruption requires more than adoption of anti-corruptionlegislation, establishment of appropriate units in the law enforcementagencies or public declaration of good intentions. Anti-corruption effortsare as complex as corruption is, embracing various political, economic andcultural areas of life and calling for specific mechanisms to control andprevent corruption. The fight against corruption will not be effective if itlacks a clear definition of the objects and subjects of corruption activities.Therefore, one of the key components of anti-corruption efforts is cor-ruption diagnosis that includes various surveys of the corruption phenom-enon and helps identify corruption prone areas of public life.
Currently, many surveys disclosing manifestation of corruption areconducted on a global, regional or national scale. Their range is also verywide, from findings of investigative journalism to analysis of macroeco-nomic indicators. One of the most famous surveys of the kind is the Cor-ruption Perceptions Index (CPI). Since 1995 it has been annually con-ducted by an international non-governmental organisation, TransparencyInternational (TI). The CPI is an important source for international politi-cal bodies, business and financial structures. It is a composite index basedon the internationally recognised social and other experimental surveys.
TI requires at least three sources to be available in order to rank acountry in the CPI. In 2004, Lithuania�s index, drawn upon the findingsof nine surveys, scored 4.6 out of 10. Lithuania ranked 44 out of 146surveyed countries failing to get on the TI list of the least corrupt stateswith the index of more than 5 scores.
The other well-known diagnostic surveys of business representativesfrom various countries were conducted by the World Bank in 1999 and2002. It analysed two forms of corruption: state capture and administra-tive corruption. The first one has an impact upon the �rules of the game�of public life shaping them to favour one or another interest group. Thesecond type does not attempt to change those �rules of the game� tar-geting those who are responsible for the implementation of those rules.The recent survey findings showed that the index of administrative cor-ruption in Lithuania is medium and is not much different from suchCentral and Eastern European states like the Czech Republic, Estonia,Hungary or Poland.3
3 Ch. Gray, J. Hellman, R. Ryterman. Anti-corruption in Transition 2; Corruption inEnterprise-State Interactions in Europe and Central Asia 1999�2002. Washington: TheWorld Bank, 2004, p. 32.

14 INTRODUCTION
On a global scale, many more diagnostic surveys of corruption areconducted by such prominent international organisations like FreedomHouse, World Economic Forum, World Markets Research Centre andthe Gallup Organisation. One of the most recent ones is the TI GlobalCorruption Barometer 2004 conducted in 64 countries, including Lithua-nia. The total number of respondents surveyed was 52,682.4 The surveyshowed that in Lithuania, like in Argentina, Mexico, Latvia, Poland,South Korea, and Ukraine, from 51 to 70 per cent of the populationthinks that corruption has a major impact upon political life. From 31to 40 per cent of the Lithuanian population, similarly to Kenya, Nigeriaand Moldova, said that during last 12 months they or their family mem-bers had given a bribe.5
Admittedly, TI conducts regional and national as well as internationalsocial surveys of corruption. One of the key tasks of this non-govern-mental organisation, which co-ordinates anti-corruption efforts in theentire world, is to examine and analyse corruption. In recent years, ithas performed the following surveys: a regional survey of Corruption inSouth Asia (carried out in 2002 in Bangladesh, India, Nepal, Pakistanand Sri Lanka, evaluating citizen perception and experience of corrup-tion in public institutions), a national Transparencia Brasil survey (whichassessed citizens� perception of corruption), Kenya Bribery Index (whichhas been carried out annually since 2002), national Mexican CorruptionSurvey, etc. These surveys help establish the aspects of corruption whichare the most painful to society and organise a more effective anti-cor-ruption public campaign by establishing the target and concrete ways oftackling cases of corruption.
With this regard, Transparency International Lithuanian Chapter (fur-ther referred to as TILS) is not an exception. Since its establishment in2000, Lithuania�s surveys and analyses have become one of its strategicobjectives. In co-operation with such public opinion research companieslike Baltijos tyrimai, Vilmorus and Spinter, governmental organisations likethe Special Investigations Service, Customs Department, State BorderProtection Service, local authorities and academic establishments, TILSconducted more than ten different social diagnostic surveys of corrup-
4 In Lithuania, the national representational population survey was carried out by themarket research company TNS Gallup, July 2004; N=504.
5 R. Hoddes, M. Wolkers. Report on the Transparency International Global Corrup-tion Barometer 2004. Berlin: Transparency International, 2004, p. 10, 12.

15INTRODUCTION
tion. It does not mean, however, that TILS was the first or the onlyorganisation to carry out national corruption surveys in the country.6 Yetthese surveys were mostly random, patchy, having no special purpose toexamine the phenomenon of corruption in Lithuania in a most elabo-rate manner.
In 2001, TILS launched its first social diagnostic survey in Lithuaniacalled the Map of Corruption. Its purpose was to identify, on the basisof national opinion polls, the institutional and geographic spread of cor-ruption and the areas of Lithuanian society and institutions where cor-ruption is most rampant. The survey attempted to assess the following:
� public position towards corruption, its level and role in the state;� personal experience of confronting instances of corruption (brib-
ery);� sources of information about corruption and attitude towards anti-
corruption efforts.
While developing the survey methodology, consideration was takenboth of international and national experience of conducting social, val-ues and victimological surveys of corruption. Analysis of attitudes towardscorruption and corrupt institutions is a common subject matter of dif-ferent social surveys. Certainly, the authors of the Map of Corruptioncould disregard this fact. Therefore, next to traditional questions aboutthe assessment of corruption the questionnaire included a question aboutthe level of corruptibility in all the key Lithuanian institutions (90 of themwere listed in the 2001 questionnaire). Besides that, corruption was alsoassessed from the geographical point of view.
Another new aspect to the Map of Corruption is that the spread ofcorruption was measured, besides the traditional way of analysing atti-tudes towards corruption, by examining, which is not so commonly done,personal confrontation with corruption, or to be more precise, one formof it, bribery. The respondents were asked to share their experiencesabout different aspects of corruption, including the institutional one. Thiscourse of investigation allowed to make an indirect assessment of thepossible scale of the spread of bribery in Lithuania on the one hand, andalthough corruption and bribery are not the same (the latter is just one
6 One example is a Phare project report Preliminary Evaluation of Corruption Situa-tion in Lithuania and Preparation of Outline of Strategy for Fight against Corruption, Vilnius,1999.

16 INTRODUCTION
form of corruption), compare the general assessment of corruption andpersonal experience, on the other hand.
Another feature of the survey was that it chose two groups of respon-dents: common Lithuanian residents and company managers. The respon-dents of the first group were asked about their personal opinion, assess-ment and experiences. The respondents of the second group were givensimilar although somewhat different questions to show the company�s,as well as personal, experience or attitude towards corruption. The ap-proach of having two groups was based on the presumption that theirattitude towards corruption and experience of corruption may be differ-ent because their social positions are different: businessmen, due to themode of their operation, are closer to governmental institutions and aredependent upon their decisions. As a result, they may assess corruptionand bribery differently than Lithuanian residents.
The questionnaire was developed taking in account the general so-cial demographic features of the respondents and, in case of businessrepresentatives, the specificity of companies: geographic region, size ofthe company, type of activity, etc.
During the period of 2001�04, three opinion polls were conductedamong the residents and company managers in 2001, 2002 and 2004. Thesocial survey of residents, following the questionnaire developed by theauthors of this book, was carried out by a joint British-Lithuanian pub-lic opinion and market research company Baltijos tyrimai. The survey ofresidents used the random sampling, whereas the company representa-tives were subject to the quota sampling. The first survey took place inJuly 2001, involving 2,028 residents (in two waves: 1,025 residents sur-veyed during the 1st one and 1,003 during the 2nd one) and 1,005 com-pany managers. The second survey was conducted in November 2002,including 1,012 residents and 1,017 company managers. The last one wasarranged in March 2004: 1,015 residents and 1,047 company managers.All the surveys were based on anonymous personal interviews. Analysisof the survey findings showed that statistical error did not exceed 3.1per cent.
The book discusses three types of survey results. Chapter 1 focuseson the bribery related geographical and institutional experience of resi-dents and company managers. Chapter 2 analyses the attitude of resi-dents and company managers towards corruption as a social phenom-
17INTRODUCTION
enon, assesses the level of corruption among Lithuanian institutions andpoints out the sources of assessment. Finally, Chapter 3 takes a look atthe anti-corruption potential of Lithuanian society, i.e. resolution ofcommon people and company managers to curb corruption in Lithua-nia in a number of ways. The conclusions provide a summary of thesurvey findings.
The findings of the Map of Corruption were presented in the follow-ing international conferences:
� 10th International Anti-Corruption Conference (2001, Prague, theCzech Republic)7,
� 11th International Anti-Corruption Conference (2003, Seoul, Re-public of Korea),
� 2nd Annual Conference of the European Society of Criminology(2003, Helsinki, Finland)8,
� Seminar on Corruption and Public Interest: Strategies, Practices andIdentification of Prevention, conducted by the United States De-partment of Justice and the National Institute of Justice in 2004,Washington D.C.,
� the other events organised by international organisations in GreatBritain, Germany, Turkey, Ukraine, Russia, Kazakhstan, Romania,Bulgaria, etc.
Besides that, survey findings were regularly presented to thePresident�s Office of the Republic of Lithuania, Seimas, Government,local authorities, law enforcement agencies, business and academic es-tablishments, and the mass media. They were also provided to the em-bassies of foreign countries and offices of international organisationsestablished in Lithuania.
The survey was taken into account while developing the NationalAnti-Corruption Programme of Lithuania; its findings have been often
7 A. Dobryninas, L. Þilinskienë. Corruption and Business in Lithuania from Small andMedium Enterprises Perspective. Kn: 10th International Anti-Corruption Conference, Prague,Czech Republic, 7�11 October, 2001. Berlin: Transparency International: 2002, CD-ROMedition.
8 A. Dobryninas, L. Þilinskienë. Map of Corruption in Lithuania: The Residents� View.Kn: S. Nevala, K. Aromaa (eds.) Organised crime, Trafficking, Drugs: Selected paperspresented at the Annual Conference of the European Society of Criminology, Helsinki2003. HEUNI. Publication Series No. 42. Helsinki. 2004, p. 38�48.

18 INTRODUCTION
referred to by international organisations making analytical reports9; andits description has been included in the TI Anti-Corruption Toolkit.10
The surveys were sponsored by the Government of the Republic ofLithuania, Finnish, British and United States embassies, United NationsDevelopment Programme, the Lithuanian Confederation of Industrial-ists, companies Lietuvos Draudimas, Omnitel, etc. Publication of the bookwas sponsored by the United Nations Development Programme.
The authors are grateful to Messrs. Joel Helmann (the World Bank,USA), Kauko Aromaa (HEUNI, Finland), Miklos Marschall (TI, Ber-lin) and Ms. Nijolë Steiblienë (Seimas) for their advice and practicalassistance in conducting and presenting diagnostic surveys of corruption,Ms. Viktorija Ðerðniovaitë from Baltijos tyrimai for counting the surveyresults and Ms. Jolanta Piliponytë, a PHD student of Department ofSociology, Vilnius University, for the assistance in developing the book.The authors also sincerely thank everybody for their comments and pro-posals expressed during presentation of the survey findings.
9 See Monitoring the EU Accession Process: Corruption and Anti-corruption Policy.Hungary: OSI, 2002; GRECO, Evaluation Report on Lithuania, adopted by GRECO atthe 8th Plenary Meeting, Strasbourg, 4-8 March 2002.
10 TI Anti-corruption Toolkit. Berlin: Transparency International, 2003.

19INTRODUCTION
I. EXPERIENCE OF BRIBERY
There are many forms of corruption; yet one of the best known andrampant one is bribery. This form of corruption is directly associated withadministrative corruption which serves as the baseline for assessing trans-parency of public institutions and their efficiency in dealing with importantpublic tasks. A survey on the experience of bribery was not chosen simplybecause it is said to be a �quintessential form of corruption�11 but alsobecause it is a type which the respondents understand best. If people avoid-ing laws and regulations offer kickbacks to a public official for the servicesrendered, they do realise what they are doing: they are giving a bribe.
Yet even in a situation like that, researchers of bribery experience runinto inevitable difficulties. Bribery is not a straightforward phenomenon.A public official charged with the abuse of office usually assumes personalliability for his illicit actions. However, bribery is a two-way deal: wherethere is a taker, there is a giver, and both are engaged in a criminal act.In other words, a question posed to the respondents whether they hadgiven a bribe is not just a standard question of victimological surveys try-ing to figure out if the respondent had become a victim of a crime. Thequestion here is of somewhat self-reporting character12, i.e. the respon-dent is provoked to say whether he or she has committed an illicit act.
The first difficulty is that the respondent, due to various reasons, maytake a psychological self-defence position and deny his or her participa-tion in bribery. In such a case, one has to look for alternative ways toovercome the psychological barrier and attempt at assessing bribery in-directly. To that end, the 2001 questionnaire included the following ques-tion: �Have you ever heard about a bribe given to a public official byyour relative or someone you know?�
11 F. Anechiarico, B. J. Jacobs. The Pursuit of Absolute Integrity: How CorruptionControl Makes Government Ineffective. Chicago: Chicago University Press, 1996, p. 7.
12 A survey method traditionally used in the Anglo-Saxon criminology.

20 I. EXPERIENCE OF BRIBERY
The second difficulty lies in the definition of bribery. Respondentsare not experts of criminal justice and should not necessarily be awareof the definition of bribery used in criminal law and know how to applyit in practice. What makes it more complicated is the concept of a �gift�.The problem was well formulated by a famous Norwegian criminologist,Nils Christie, in a private conversation: �Where is the limit where brib-ery ends and kindness starts?�
In this case, the decision was made to leave it for the respondents toassess their own actions and make a distinction between a bribe (whichshould be noted) from a gift (which should be left out). A bribe has anegative connotation in the respondent�s mind, whereas a gift is positive,which makes it difficult to mix the two concepts. Certainly, such a con-cept of a bribe is not a legal one, yet it is very close to the primary under-standing of corruption which is considered a moral and social evil. Irre-spective of the manner in which the public official was rewarded (a boxof chocolate worth 10 litas or 50 hundred litas notes placed in an enve-lope), if it is identified as a �bribe�, it is considered a bribe, i.e. a socialand moral evil which the respondent was forced to commit or committedvoluntarily in exchange for the desired services or goods. Those who dis-like the socio-psychological concept of a bribe and who want �real� statis-tics on bribery, may refer to criminal statistics reports. However, they willnot find corruption or bribery identified there as a widespread social phe-nomenon in Lithuania. This, as a matter of fact, does not really coincidewith the social experience that many of us have. Admittedly, corruptionand one of its forms, bribery, have been for many years considered one ofthe most painful problems of Lithuanian society.
As mentioned earlier, the experience of bribery was shared by twogroups of the respondents: Lithuanian residents and company manag-ers. They were given similar questions with certain reservation to accom-modate the operational particularities of business representatives. Besidesthat, with a view to having a better understanding of the field examined,some of the questions asked during the surveys in 2001-04, were elabo-rated, deleted or added later. This is a normal procedure of searchingfor the optimum methodology, particularly bearing in mind that this wasthe first social survey of bribery experience in Lithuania. The final analy-sis included only the data which were homogeneous and ensured reli-ability of social interpretation. For example, while making an assessmentof certain aspects of bribery experience by residents in 2001, data of the

21I. EXPERIENCE OF BRIBERY
first wave were taken into account, whereas for the other aspects, dataof the second wave were used. The questions asked in each wave weredifferent, but the samples were the same and the margin of statisticalerror was almost equal.
1.1. EXPERIENCE OF BRIBERY BY LITHUANIAN RESIDENTS
The first bribery related question was about demanding a bribe. Therespondents were asked if anyone had expected or demanded a bribefrom them over the past five years. Certainly, this assessment is far moresubjective than the statement about giving a bribe. The respondent mayreact inadequately thinking that a bribe was demanded although theother party had no intention of the kind. Admittedly, the survey makesan assessment of a real life situation. Therefore, demanding a bribe isnot treated according to the criteria established by criminal law or theactual motives of the other party but from the perspective of the respon-dent himself of herself who communicates with the public official. Theanswers of the respondents are given in Table 1.1.1.
Table 1.1.1. DURING RECENT FIVE YEARS, HAS ANYONE EXPECTEDOR DEMANDED A BRIBE FROM YOU? (residents, %)
2001* 2002 2004
No, never 52.7 48.4 57.0Yes, once 11.9 13.9 10.4Yes, 2�3 times 15.3 19.3 18.4Yes, 4�9 times 4.2 5.5 5.5Yes, 10 and more times 3.7 3.6 2.2Has no opinion 12.2 9.3 6.6
* 1st wave estimates: N=1025.
As indicated in the table above, the majority of Lithuanian residentshave not encountered any bribe demanding situations or felt that some-one has expected it from them over the recent 5�8 year period. In 2002,as compared to 2001, the number of the respondents claiming that abribe was demanded from them fell by 4.3 percentage points to growagain by 8.6 percentage points in 2004. During the latter year, as com-pared to 2002, the number of those who said that a bribe had beendemanded from them once decreased by 3.5 percentage points. In 2002

22 I. EXPERIENCE OF BRIBERY
and 2004, the number of the respondents who said that they had beenasked to give a bribe 2�3 times was 3�4 percentage points higher thatin 2001. Admittedly, the number of the respondents who did not answerthe question was rather high, though during the comparative period itdecreased almost two times to reach 6.6 per cent. As one could antici-pate, the rarest social group to encounter the situation when a bribe isdemanded or expected is the one which has little to do with variouspublic bodies: young and senior people.
The 2004 questionnaire included a new question about bribe demandsduring the past 12 months. 71.3 per cent of the respondents said thatno-one had demanded a bribe from them, 10.7 per cent said that it hadhappened once, 8.8 per cent noted 2�3 times, 1.3 per cent indicated 4�9 times, 0.7 per cent remembered 10 and more times and 7.2 per centhad no opinion. No special social demographic features could be identi-fied apart from the group of the respondents aged 30�49 who were de-manded to give a bribe more often than the other age groups.
Lithuanian residents were asked a question whether they had givena bribe over the past five years. Table 1.1.2 below shows the findings ofthe surveys conducted in 2001, 2002 and 2004.
Table 1.1.2. DURING THE RECENT FIVE YEARS, HAVE YOU GIVEN ABRIBE? (residents, %)
2001* 2002 2004
No, never 54.5 61.6 59.5Yes, once 13.6 12.6 11.4Yes, 2�3 times 15.3 19.3 17.5Yes, 4�9 times 4.8 4.5 5.2Yes, 10 and more times 2.4 1.7 1.9Has no opinion 9.4 0.2 4.5
* 1st wave estimates: N=1025.
The survey findings show that in 2001, almost 36 per cent of theresidents had given a bribe over the past five years; in 2002, the num-ber of positive answers went up insignificantly (without exceeding thestatistical error) to reach 38 per cent, and in 2004 it went back to thesame 36 per cent. Moreover, in 2002 and 2004, as compared with 2001,respectively 7 and 5 per cent more respondents claimed that they hadnot given a bribe over the last five years. Yet such a sudden increasecould be explained by the fact that in 2002 and 2004, as compared to

23I. EXPERIENCE OF BRIBERY
2001, the number of the respondents who had no opinion concerningthe matter went down by 9 and 5 percentage points respectively.
A socio-demographic analysis of the respondents shows that duringthe period surveyed the majority of those who admitted having given abribe are women, young and middle-aged people, having higher incomeand living in cities. Geographically, residents of Panevëþys and Telðiaicounties claimed to have given a bribe rarer (i.e. their number is lowerthat the statistical mean) and Alytus, Tauragë (in 2001 and 2002) andKaunas (2004) county residents said it more often.
The 2001 questionnaire contained a question about bribes given bythe respondent�s relatives and acquaintances. A positive answer was givenby 47.9 per cent of the respondents, a negative response was providedby 30.8 per cent and those having no opinion or refusing to answer ac-counted for 21.3 per cent. The percentage of the latter is too high to beable to make a judgement about the ratio of bribe-givers and non-giversamong relatives and acquaintances. The same could be said about com-paring personal experience of bribery with that of relatives and acquain-tances. The 2002 and 2004 questionnaires left out the question.
Admittedly, the 2004 questionnaire had an additional question aboutone�s recent experience of bribery.
Table 1.1.3. WHEN WAS THE LAST TIME YOU HAD TO GIVE A BRIBE?(residents, %)
%
Have never given a bribe 44.1This year (2004) 10.4Last year (2003) 14.12�3 years ago 8.14�5 years ago 4.16�14 years ago 8.215 years ago or earlier than that 3.9Not stated 7.1
As indicated in Table 1.1.3 above, almost half (48.8 per cent) of therespondents admitted that they had given a bribe at least once in theirlife; a slightly smaller percentage, 44.1, claimed they had never given abribe and 7.1 per cent refused to respond. Figure 1.1.1 shows the distri-bution of responses by those residents who had admitted giving a bribeat least once in their life.

24 I. EXPERIENCE OF BRIBERY
Fig. 1.1.1. WHEN WAS THE LAST TIME YOU HAD TO GIVE A BRIBE?(bribe-givers N=495; residents, %)
Noteworthy, the number of the respondents who said they had givena bribe during the Soviet times account for as little as 7.9 per cent,whereas almost half of those who had given a bribe mentioned the pe-riod of 2003�04. One could state that the majority of the respondentsdo not associate bribery with the Soviet past as they most often referredto the last 15-year period. However, a question arises in relation to thedata illustrated in Figure 1.1.1 (which shows an increase of bribe-givingsituations in recent years), whether they are in line with the data men-tioned earlier (See Table 1.1.2) showing that during the period surveyedthe scale of bribe-giving remained the same.
The following explanation could be provided. The fact that the lastbribe given by the respondent happened during previous or the currentyear does not mean that he or she had not given bribes earlier. Thusit would not be correct to state that bribery is increasing. However, an-other fact that the percentage of those who admitted giving a bribe overthe past 5 years remained the same (without exceeding the statisticalerror) (see Table 1.1.3 and Figure 1.1.1) shows not only the bribery ex-perience by the respondent but also his or her awareness of it. Admit-tedly, people tend to remember better recent events; therefore the state-ment �I have given a bribe in recent five years� could be interpreted asfollows: about 60 per cent of the bribery experience is associated withrecent years (2004-03) and only about 40 per cent is referred to earlierthree years. Analysis of another question corroborated the assumption.
The 2004 questionnaire included a question about the experience ofbribery over recent 12 months. 73.1 per cent of the respondents said they

25I. EXPERIENCE OF BRIBERY
had never given a bribe; 10.7 per cent admitted they had given a bribeonce; 8.9 per cent noted 2�3 times; 1.3 per cent mentioned 4�9 times;0.5 per cent admitted 10 and more times and 5.5 per cent had no opin-ion. This shows that 21.4 per cent (more than every fifth respondent) ofthose surveyed admitted having given a bribe over the last 12 months.Similarly to the five year period, those who said they had given a bribeduring the past 12 months belong to the socio-demographic group aged30�49 with higher income (LTL 1,200 and more).
Analysis of the respondents� bribery experience according to the scaleof 5 years and 12 months showed that 59 per cent of the respondents whohad bribery experience during the last 5 years had also given a bribe dur-ing the past 12 months, which is in line with the trends mentioned before.
In that respect, more accurate findings are obtained when analysingthe bribery experience over the last 12 months rather than 5 years. Bear-ing in mind, that the experience of 12 months accounts for approximately60 per cent of the 5 �year experience and having an aim to retain statis-tical reliability when analysing cases of bribery, it is necessary to reducethe maximum statistical error in the whole sample from 3.1 to 1.8 percent. As a result, the size of a minimum sample grows from 1,000 to 3,000respondents.
Table 1.1.4. WHY DID YOU GIVE A BRIBE? (residents, %)
Year 2001* 2002 2004
Because it was demanded by a person whohad an impact upon positive resolutionof your problem 12.5 22.0 22.6
Because you thought that it would helpspeed up the resolution of your problem 36.2 34.0 33.5
Because you thought it would be difficultto solve the problem without a bribe 30.7 29.3 27.3
Because it is common practice,the majority does it 30.8 25.6 20.7
Because you wanted to thank the personwho helped you 34.5 17.6 19.8
Other 0.0 0.0 0.2
Has no opinion 1.0 3.7 2.5
*2nd wave estimates (N=1003; bribe-givers in recent five years Nk=405).

26 I. EXPERIENCE OF BRIBERY
Yet the scale of 5-year experience, though not as accurate, also dis-closes important aspects of bribery experience.
The purpose of another question to those who mentioned havinggiven a bribe over the past five years was to identify the motives of sucha conduct.
As seen from the table above, the main motive of the respondentsfor giving a bribe in 2001�04 was a belief that a bribe may speed up theresolution of their problems (slightly more than one third) and if theyrefuse to give a bribe they risk to have their problems unsolved (slightlyless than one third). In 2001, as many as 35 per cent of the respondentsindicated their willingness to thank the person concerned, although thefollowing years showed a sharp decrease by almost one half. Moreover,in 2002 and 2004, as compared to 2001, the percentage of those whoclaimed that a bribe was demanded by a person who could influence apositive resolution of the problem grew almost two times. However, thepercentage of those who saw bribery as a common, �usual� practice wassteadily decreasing to reach about one fifth of all the bribe-givers in 2004.
The respondents who said they had given a bribe over the last fiveyears were asked to say when the bribe was given.
Table 1.1.5. DID YOU GIVE A BRIBE...? (residents, %)
Year 2001* 2002 2004
before the service provided 52.2 53.7 57.1after the service provided 20.3 16.5 14.5during the provision of the service 22.1 18.8 24.4Has no opinion 5.4 11.1 4.0
*2nd wave estimates (N=1003, bribe-givers in recent five years Nk=405).
Table 1.1.5 shows that the majority of the respondents give bribesbefore the service is provided. In 2001 and 2002, there was no signifi-cant statistical difference between those who gave a bribe before theservice and during it. They accounted for one fifth of the respondents.However, the 2002 survey findings should be interpreted with certainreservation as they include quite a high number of those who gave noresponse, 11 per cent. In 2004, the percentage of those who gave a bribeduring the provision of the service grew to a quarter of the respondents.Such a bribe-giving �strategy� indicates an attempt to ensure a positive

27I. EXPERIENCE OF BRIBERY
result rather that a wish to thank �a person who helped�. The years 2002and 2004 saw an interesting trend: women more than men were morelikely to give a bribe before the service, whereas men more often thanwomen would give a bribe during the service.
The respondents were also asked to reply about the form of settlementwith public officials. The survey results are summarised in Table 1.1.6.
Table 1.1.6. IF YOU EVER SOUGHT A FAVOURABLE DECISION OFA PUBLIC OFFICIAL, HOW DID YOU REWARD HIM OR HER? (resi-dents, %)
Year 2001* 2002 2004
By giving cash 68.6 73.1 75.1By giving gifts 28.5 23.3 19.8Services 4.4 1.1 1.5Other 5.0 8.5 10.0Has no opinion 12.9 7.7 6.9
* 1st wave estimates (N=1025, bribe-givers in recent five years Nk=371).
As shown above, the main form of settlement is cash: three quartersof the respondents who admitted giving a bribe over the last five yearschose this form. Another form, yet far less popular, is gifts. Admittedly,the former is a more frequent form of rewarding an official by men,whereas the latter is more popular among women. The most commongifts are alcoholic beverages, sweets and chocolate.
The survey analysed administrative regional aspects of bribery expe-rience. First of all, the respondents were asked to answer a questionabout the level of public officials whom they had given a bribe. Theresults are provided in Table 1.1.7 below.
Table 1.1.7. WHAT IS THE LEVEL OF PUBLIC BODIES WHERE THEPUBLIC OFFICIAL IS WORKING WHOM YOU GAVE A BRIBE? (resi-dents, %)
Year 2001* 2002 2004
National public body 21.3 21.9 19.9County level public body 31.5 23.9 27.5Municipal body 46.5 54.1 46.3Has no opinion 17.9 19.6 20.6
* 1st wave estimates (N=1025, bribe-givers in recent five years Nk=371).

28 I. EXPERIENCE OF BRIBERY
Noteworthy, the percentage of those who refused to answer is high,18�20. The reason could be that it was difficult for the respondents toestablish the level at which the respective public official operates. Theanswers provided show the following trends: first, local officials were paidbribes most frequently, the percentage is lower of those who work incounties and the lowest (about one fifth) are employed on the nationallevel. The latter percentage was stable throughout the period surveyed.Yet the first two, in comparison to 2001, changed insignificantly in 2002and went back to the three-year old position in 2004.
Another question was put forward in relation to the geography ofbribery experience. The attempt was made to assess the 2001 and 2002geographical distribution by making a difference between major townsand regional centres, whereas in 2004 the distinction was made betweencounties and their centres. Tables 1.1.8 a and 1.1.8 b summarise theanswers provided.
Table 1.1.8 a. DID YOU GIVE A BRIBE TO A PUBLIC OFFICIAL WORK-ING IN A PUBLIC BODY LOCATED IN VILNIUS OR SOME OTHERPLACE? (residents, %)
Year 2001* 2002
Vilnius 30.5 29.8Kaunas 20.7 23.9Klaipëda 10.1 11.6Ðiauliai 3.5 5.6Panevëþys 4.3 3.3Another regional centre 26.9 26.6Some other place 8.2 3.7Has no opinion 15.5 19.2
* 1st wave estimates (N=1025, bribe-givers in recent five years Nk=371).
Table 1.1.8 b. DID YOU GIVE A BRIBE TO A PUBLIC OFFICIAL WORK-ING IN A PUBLIC BODY LOCATED IN VILNIUS OR SOME OTHERPLACE? (residents, %)
Year 2004
Vilnius, Vilnius county 29.4Kaunas, Kaunas county 25.9Klaipëda, Klaipëda county 11.3Ðiauliai, Ðiauliai county 6.1Panevëþys, Panevëþys county 6.4Alytus, Alytus county 4.3

29I. EXPERIENCE OF BRIBERY
Table 1.1.8 b continued
Year 2004
Marijampolë, Marijampolë county 4.6Utena county 4.7Telðiai county 3.3Tauragë county 1.1Has no opinion 14.4
Since the sample of bribe-givers of the three surveys did not exceed400 and the percentage of those who refused to respond was rather high(14�19), the difference between Tables 1.1.8 a and 1.1.8 b should beevaluated with due care. However, it is clearly seen that the main cen-tres of bribery based on the respondents� experience are Vilnius, Kaunasand Klaipëda (although the latter is slightly lagging behind from the firsttwo �leaders�). The three towns were mentioned by two thirds of therespondents.
When analysing the distribution of bribes, one has to identify insti-tutional as well as geographical particularities of bribery. Table 1.1.9provides a list of public bodies (about 90 public bodies were covered bythe survey) whose public officials were given a bribe over the past fiveyears, as stated by more than 3.1 per cent13 of the respondents. Thepublic bodies are listed according to the 2004 survey results.
Table 1.1.9. TO EMPLOYEES OF WHICH INSTITUTIONS HAVE YOUGIVEN A BRIBE? (residents, %)
Year 2001* 2002 2004
Out-patient departments 11.6 12.7 12.5Local hospitals 12.5 13.2 11.0National hospitals 7.6 12.2 10.9Traffic police 12.4 11.6 8.6Vehicle technical inspection centres** � 5.0 5.0Local authorities** � 3.7 3.5Customs 5.6 5.1 2.9
* 2nd wave estimates (N=1003).** Institutions not included in the 2001 survey.
13 This figure corresponds to the statistical error; it is some sort of the minimum sta-tistical �visibility� of the respondents� bribery experience.

30 I. EXPERIENCE OF BRIBERY
As seen from the findings above, most often to be offered bribes areemployees of medical institutions, including out-patient departments,local and national hospitals, whereas the percentage of bribe-taking staffis lower in traffic police, customs, vehicle technical inspection centres andlocal authorities. During the period surveyed, the institutional briberyexperience of residents stayed almost the same in local hospitals, out-patient departments, vehicle technical inspection centres and local au-thorities. In 2002 and 2004, as compared to 2001, the number of therespondents who claimed to have given a bribe in national hospitals,increased. However, customs in 2004, as compared to 2001 and 2002,stepped down from the position of the most statistically prominent (�vis-ible�) institutions.
The analysis of the situation of bribery in the bodies mentioned abovecan be facilitated by putting additional questions to the respondents asfollows:
� During the last five years, have you had to deal with matters inthose bodies or communicated with the staff of those bodies whiledealing with your matters?
� When you were dealing with your matters, employees of whichinstitutions demanded or expected a bribe from you?
� Did a bribe help you deal with your problem?
Table 1.1.10 shows the respondents� answers to the questions putabove.
Noteworthy, the experience of the respondents in such institutions likelocal hospitals, out-patient departments, customs, vehicle technical inspec-tion centres and local authorities is almost the same during the periodsurveyed. In 2004, there were fewer respondents who said they had todeal with matters in traffic police in the last five years14 , and, in 2002and 2004, as compared to 2001, the number of those who admitted hav-ing dealt with their matters in national hospitals, went slightly up.
According to the respondents, the practice of demanding bribes prin-cipally stayed the same in customs, vehicle technical inspection centresand local authorities. Yet in 2002 and 2004, it saw a sudden increase inout-patient departments and national hospitals. This is contrary to traf-fic police, where the practice of bribery went down in 2004. During 2002
14 This can be explained by institutional change.

31I. EX
PERIEN
CE O
F BR
IBERY
Table 1.1.10. INSTITUTIONAL EXPERIENCE OF RESIDENTS IN 2001�04 (residents, %)
Dealt with matters Demanded a bribe Bribe helped
Year 2001* 2002 2004 2001* 2002 2004 2001**** 2002 2004
Out�patient departments 56.3 57.4 59.0 9.1 13.4 12.9 � 10.4 10.7
Local hospitals 32.7 33.0 32.3 10.2 14.6 9.7 � 9.9 9.2
National hospitals 16.6 20.9 19.4 5.9 11.5 10.0 � 9.5 8.4
Traffic police 24.4 23.1 18.1 12.1 12.3 9.0 � 10.5 8.2
Vehicle technicalinspection centres** � 17.0 16.6 � 5.6 4.8 � 4.6 4.8
Local authorities** � 20.8 19.0 � 5.5 4.7 � 3.1 3.0
Customs*** 14.9 14.3 � 6.1 6.3 � � 4.4 �
* 2nd wave estimates (N=1003).** Institutions not included in the 2001 survey.*** The 2004 customs indices were not included as non�compliant with statistical requirements.**** No estimate of the 2001 index was made.

32 I. EXPERIENCE OF BRIBERY
and 2004, almost the same number of the respondents said that bribeshelped them solve their problem.
Admittedly, Tables 1.1.9 and 1.1.10 show the difference between therespondents in their overall institutional experience as well as their in-stitutional bribery experience. For example, institutional experience of therespondents in national hospitals and local authorities is rather similar:over the recent five year period, every fifth of those interviewed claimedhe or she had dealt with matters in those bodies, whereas the experi-ence of bribery (including the situations where a bribe is demanded andproves �effective� as well as giving a bribe) differs substantially.
The survey findings are easier to interpret by introducing the so-calledbribery indices: demanding, giving, effectiveness and initiative.
The index of demanding is estimated according to the following for-mula:
Ip= Sp/Si, where (F1)
Sp is the percentage of the respondents who claimed that a bribe hadbeen demanded from them, and
Si is the percentage of those who claimed they had dealt with theirmatters in the body concerned.
The index of giving is estimated according to the following formula:
Id= Sd/Si, where (F2)
Sd is the percentage of the respondents who admitted they had givena bribe and
Si is the percentage of those who claimed they had dealt with theirmatters in the body concerned.
The index of effectiveness is estimated according to the following for-mula:
Ie= Se/Sd, where (F3)
Se is the percentage of the respondents who claimed the bribe hadhelped them and
Sd is the percentage of the respondents who said they had given abribe.

33I. EXPERIENCE OF BRIBERY
The index of initiative is estimated according to the following formula:
Ii= (Sd-Sp)/Si, where (F4)
Sd is the percentage of those who claimed they had given a bribe,Sp is the percentage of the respondents who said that a bribe was
demanded from them,Si is the percentage of the respondents who said they had dealt with
matters in the body concerned.
It is easy to notice that the first two indices show some sort of theminimum risk either in being asked to give a bribe or simply giving abribe: the higher are the first two indices, the higher the probability ofa bribe-demanding or bribe-giving situation. The third index shows theeffectiveness of a bribe: �1� equals absolute effectiveness, whereas �0�means total ineffectiveness. The fourth index points out at the dominantpower in the �market of bribery�: it is either the bribe-taker or the bribe-giver. In this case, �0� indicates the balance between the latter two, anegative figure means that initiative is taken by the taker, whereas apositive figure refers to the giver. Table 10 shows bribery indices, dis-closing various aspects of institutional bribery experience by residents.
Table 1.1.11 highlights the respondents� communication with trafficpolices during the period surveyed: both demanding and giving indicesstood at about 0.5, which means that at least every second person inter-viewed claimed to have given or demanded to give a bribe. In that case,the effectiveness of the bribe was also rather high: 0.90�0.95. A slightlyhigher effectiveness index is exhibited by the vehicle technical inspec-tion centres. The respondents� replies show that in 2002 and 2004, thenumber of bribes demanded exceeded the number of bribes given.
Another distinctive institution in this regard is national hospitals.Since 2002, this institution has showed a slightly higher index of bribe-demanding and a substantially higher index of bribe-giving than the re-spective indices in traffic police. The effectiveness index of the formeris one of the smallest among the bodies assessed. However, nationalhospitals have the highest index of initiative.
A high index of bribery effectiveness illustrates a widespread opin-ion that bribes help to solve problems and that people are ready to paybig amounts for such illicit actions of �problem-solving�. Since the distri-bution of financial amounts is usually not normal and big amounts which

34I. EX
PERIEN
CE O
F BR
IBERY
Table 1.1.11. BRIBERY INDICES IN 2001�04. (residents)
Demanding Index (Ip) Giving Index (Id) Efficiency Index (Ie) Initiative Index (Ii)
Year 2001* 2002 2004 2001* 2002 2004 20014* 2002 2004 2001* 2002 2004
Local hospitals 0.31 0.44 0.30 0.38 0.40 0.34 � 0.75 0.84 0.07 -0.04 0.04
Out-patientdepartments 0.16 0.23 0.22 0.21 0.22 0.21 � 0.82 0.86 0.04 -0.01 -0.01
National hospitals 0.36 0.55 0.52 0.46 0.58 0.56 � 0.78 0.77 0.10 0.03 0.05
Traffic police 0.50 0.53 0.50 0.51 0.50 0.48 � 0.90 0.95 0.01 -0.03 -0.02
Vehicle technicalinspection centres** � 0.33 0.29 � 0.29 0.30 � 0.92 0.96 � -0.04 -0.01
Local authorities** � 0.26 0.25 � 0.18 0.18 � 0.84 0.86 � -0.09 -0.06
Customs*** 0.41 0.44 � 0.38 0.36 � � 0.86 � -0.03 -0.08 �
* 2nd wave estimates (N=1003).** Institutions not included in the 2001 survey.*** The 2004 customs indices were not included as non-compliant with statistical requirements.**** No estimate of the 2001 index was made.

35I. EXPERIENCE OF BRIBERY
are paid rarer outweigh small and medium amounts that are paid morefrequently, the current survey estimates the payment amounts by usingthe following indices: maximum and minimum means of paymentamounts.
The mean of maximum payment amount (Md) is estimated accordingto the following formula:
n
Md = (SSid)/n, where (F5)
i=1
Sid is the maximum amount paid by the i-respondent, and
n is the number of the respondents who paid the biggest amounts.
The mean of the minimum payment amount mean is estimated ac-cording to the following formula:
n
Mm = (SSim)/n, where (F6)
i=1
Sim is the smallest amount paid by the i-respondent, and
n is the number of the respondents who paid the smallest amounts.
On their basis, the estimate of the absolute payment mean Ma is madeas follows:
Ma=(Md+Mm)/2, where (F7)
Md is the mean of maximum payment amount,Mm is the mean of minimum payment amount.
Table 1.1.12 shows the summary of the respondents� answers to thequestion about the biggest and the smallest amount of the bribe paid.Like previously, the results are presented according to the most distinc-tive institutions statistics-wise.
During the period surveyed, the biggest amount paid by the respon-dents were in local authorities and customs. The 2004 maximum pay-ment mean was LTL 958 and represented a much higher amount thanthe 2002 mean. Interestingly enough, the minimum payment mean de-creased 2.5 times over the period surveyed.
In 2001-02, the trend of the absolute mean reducing is seen in localhospitals and traffic police. In 2002�04, it is observed in vehicle techni-

36I. EX
PERIEN
CE O
F BR
IBERY
Table 1.1.12. MAXIMUM AND MINIMUM MEANS OF BRIBES PAID IN RECENT FIVE YEARS (residents, LTL)
Yearr 2001* 2002 2004
Maximum Minimum Absolute Maximum Minimum Absolute Maximum Minimum Absolutepayment payment payment payment payment payment payment payment paymentmean mean mean mean mean mean mean mean mean(Md) (Mm) (Ma) (Md) (Mm) (Ma) (Md) (Mm) (Ma)
Localhospitals 214 82 148 191 68 130 195 53 124
Out-patientdepartments 84 35 60 101 33 67 82 29 56
Nationalhospitals 370 129 250 417 103 260 420 96 258
Traffic police 242 69 156 224 69 147 198 42 120
Vehicletechnicalinspectioncentres** _ _ _ 118 75 97 98 58 78
Localauthorities** _ _ _ 654 201 428 958 80 519
Customs*** 663 169 416 617 144 381 _ _ _
* 1st wave estimates (N=1025).** Institutions not included in the 2001 survey.*** The 2004 customs indices were not included as non-compliant with statistical requirements.

37I. EXPERIENCE OF BRIBERY
cal inspection centres. In 2001-02, the absolute mean was shrinking incustoms. In out-patient departments and national hospitals the absolutepayment mean went slightly up in 2002, but in 2004, it stayed practicallythe same in national hospitals and fell down in out-patient departments.In 2004, as compared with 2002, the absolute payment mean in localauthorities increased by almost LTL 100.
1.2. EXPERIENCE OF BRIBERY BYLITHUANIAN COMPANIES MANAGERS
Lithuanian company managers were given similar questions to thoseof residents. The businessmen interviewed represent their company ratherthan act in person; therefore, the survey had to pay special attention tospecific economic features of the companies rather than socio-demo-graphic characteristics of the respondents.
First, company managers were asked about the types of corruptionthey happen to encounter most frequently. Their replies are summarisedin Table 1.2.1.
Table 1.2.1. WHICH TYPE OF CORRUPTION DOES YOUR COMPANYHAPPEN TO ENCOUNTER? (company managers, %)
Year 2001 2002 2004
Abuse of office 35.8 35.6 40.9
Bribe-giving, bribe-taking 23.6 26.0 17.6
Self-seeking resolution of conflicts betweenprivate and public interests 17.5 20.2 16.3
Nepotism (favouring relatives or friends)* _ _ 8.0
Other 1.8 0.6 0.3
Has no opinion 21.3 17.7 16.9
* This index was included in the 2004 survey only.
In 2001 and 2002, more than one third of the respondents said thatpublic officials tend to abuse their office. Similar opinion was held by small,medium and large company managers. In 2004, the number of the respon-dents who thought this way grew to account for 40.9 per cent. The major-ity of those who referred to the abuse of office were private companymanagers.

38 I. EXPERIENCE OF BRIBERY
In 2001 and 2002, almost the same number of the respondents (23.6and 26 respectively) stated bribe-giving and bribe-taking as the type ofcorruption which they encountered most often. This time again, no dif-ference in the opinion was expressed by the companies different in sizeand business type. In 2004, the number of the respondents thinking thisway went down to 17.6 per cent. Those who mentioned bribe-giving andtaking were managers of small enterprises and sole proprietorships.
17.5 per cent of company managers in 2001 and every fifth respon-dent in 2002 encountered a self-seeking resolution of conflict betweenpublic and private interests. The type of corruption was mentioned bymanagers of large and medium companies, as well as private and publiccompanies. In 2004, their number accounted for 16.3 per cent, mostlyreferred to by managers of large enterprises and public companies.
In the 2004 survey, 8 per cent of company managers claimed thatnepotism was the type of corruption which they had encountered mostfrequently.
A relatively high rate of those who gave no response could be ex-plained by the fact that they did not confront corruption. In that case,businessmen see bribe-taking and giving as the second most popular typeof corruption after the abuse of office.
Similarly to residents, company managers were asked about theirexperience of a bribe demanded or expected in the last five-year period.The survey results are presented in Table 1.2.2.
Table 1.2.2. DURING RECENT FIVE YEARS, HAS ANYONE EXPECTEDOR DEMANDED A BRIBE FROM YOUR COMPANY? (company man-agers, %)
Year 2001 2002 2004
No, not once 42.0 43.0 43.4Yes, once 11.5 12.6 12.6Yes, 2�3 times 23.6 24.9 22.6Yes, 4�9 times 9.5 9.6 11.3Yes, 10 and more times 12.1 9.3 8.6Has no opinion 1.3 0.6 1.5
The table above shows that during the period of 2001�04 surveyed,the experience of company managers remained the same: about 43 percent of managers were demanded or expected to give a bribe and about56 per cent did not encounter such situations. Most frequently compa-

39I. EXPERIENCE OF BRIBERY
nies were asked to give bribes 2�3 times. No consistent pattern showingthe difference between companies on the basis of their type, profit orother parameters was spotted during the years of survey.
Company managers were asked to share their experience of bribe de-mands in recent 12 months. Their responses are summarised in Table 1.2.3.
Table 1.2.3. DURING RECENT 12 MONTHS, HAS ANYONE EXPECTEDOR DEMANDED A BRIBE FROM YOUR COMPANY? (company man-agers, %)
Year 2001 2002 2004
No, not once 61.3 61.3 67.8Yes 37.1 38.7 28.6Has no opinion 1.6 0.0 3.6
In contrast to Table 1.2.2 above, the 2004 survey results were differ-ent from those of 2001�02. In 2004, the respondents who said they hadencountered bribe demanding or expecting situations was 10 percentagepoints smaller than during surveys of earlier years. A more thoroughanalysis shows that 2004 also saw a change in the frequency of bribedemands. In 2001�02, the number of the respondents who said that abribe had been demanded from them 2�3 times was 8 percentage pointshigher than the number of those who indicated one time. Yet in 2004,the first group of the respondents was 4 percentage points smaller thanthe second group. Noteworthy, the 2004 survey showed that bribes de-mands were mostly claimed by managers of companies with an annualturnover of LTL 2 million and representatives of foreign firms.
Confronted with bribe demanding situations, company managers couldopt for one of the following alternatives: pay no attention to such de-mands, report about them to the bodies concerned or start playing bythe bribery �rules of the game�. The first two options are discussed inChapter 3 and here we will attempt to analyse the bribery experience ofcompany managers.
The survey asked the respondents about the bribery experience bybusinessmen they knew. Similarly to the residents� survey, this was acontrolling question which served as the basis for a qualitative assess-ment of openness of responses concerning the bribery experience by therespondents. In case of residents, the question did not prove effectivedue to a small number of responses received. Whereas the number of

40 I. EXPERIENCE OF BRIBERY
company managers who did not respond is much smaller as shown inTable 1.2.4 below.
Table 1.2.4. HAVE YOU EVER HEARD ABOUT A BRIBE GIVEN TO APUBLIC OFFICIAL BY A BUSINESSMAN YOU KNOW? (company man-agers, %)
Year 2001 2002 2004
Yes 75.9 81.0 72.9No 23.3 18.2 16.7Has no opinion 0.8 0.8 10.4
In 2002, as compared to 2001, the number of the respondents whoheard about their acquaintances participating in bribery went up. Yet itwould be too bold to claim that their number in 2004 decreased to reachthe level 2001 as those respondents who gave no answer or had no opin-ion account for quite a high percentage, about 10. Therefore, it wouldbe more accurate to say that the situation in 2004 was as good as thesituation in 2002. The response given by the absolute majority of com-pany managers about the relevant issue of bribery in the business sectoris an important social background which can facilitate or justify the actof bribe-giving (as discussed later).
The experience of bribery by businessmen is shown in Table 1.2.5which summarises company managers� responses to a direct questionabout their company�s bribe-giving experience.
Table 1.2.5. DURING RECENT FIVE YEARS, HAS ANY REPRESENTA-TIVE OF YOUR COMPANY GIVEN A BRIBE TO SECURE ITS SUCCESS-FUL OPERATION IN LITHUANIA? (company managers, %)
2001 2002 2004
No, not once 60.3 47.8 52.2Yes, once 8.3 8.8 11.9Yes, 2�3 times 18.2 17.3 18.6Yes, 4�9 times 5.1 10.7 9.4Yes, 10 and more times 5.7 7.5 6.4Has no opinion 2.5 0 1.4Given by company managers* � 7.9 �
* Estimated only in 2002.
The table above shows that in 2002, as compared to the previous year,the number of those companies who gave no bribes decreased signifi-

41I. EXPERIENCE OF BRIBERY
cantly by 13 percentage points to grow again by 4 percentage points in2004. The 2004 analysis of the companies whose employees had given abribe discloses an even stronger trend: in 2002, in comparison to 2001,the share of bribe-giving companies increased by 15 percentage points(from 37.3 to 52.2 per cent) and in 2004, as compared to 2002, it felldown by 6 percentage points (from 52.2 to 46.3 per cent). Thus a pre-sumption is that the bribe-giving situation in 2004 was somewhat morefavourable than in 2002, although it was worse (with the number of bribe-givers 9 percentage points bigger) in 2001.
Noteworthy, the period surveyed showed quite a lot of companies(about 18 per cent) whose employees said they had given bribes 2�3times. Furthermore, from the year 2001, the number of companies whoseemployees gave bribes 4-9- times went up. Presumably, such types ofcompanies and their managers consider bribe-giving a certain businesspractice.
Analysis of the distribution of regional companies, where, accordingto company managers, bribe had been given, showed no particular pat-terns. For example, in 2001 bribes were mostly given by Vilnius andKaunas county company employees, in 2002 their position was occupiedby new �leaders�, Alytus and Klaipëda county companies, and in 2004Vilnius county companies came back to join Alytus and Ðiauliai countycompanies in giving bribes to public officials most frequently. In 2001and 2002, company employees from Marijampolë and Panevëþys coun-ties gave fewer bribes than their counterparts in other towns and coun-ties. In 2004, the smallest amount of bribes was given by the companystaff from Tauragë (in 2001, they were also among those who were therarest to offer bribes), Telðiai and Klaipëda counties.
This time again, no pattern could be established linking bribe-givingwith characteristics of companies, including the area of operation, size ofthe company, turnover, type, etc. All the differences either do not exceedstatistical error or are peculiar of one particular year but not the entireperiod surveyed. What could be noted though is that foreign companiesmentioned fewer instances of giving bribes in 2004. However, this param-eter was not measured in 2001 and 2002, which does not allow us to statethat such firms had such a characteristic during the entire period surveyed.
Company managers were also asked to answer a question about theirexperience of bribe-giving in the last 12 months. Their answers aresummarised in Table 1.2.6.

42 I. EXPERIENCE OF BRIBERY
Table 1.2.6. DURING RECENT 12 MONTHS, HAS ANY OF YOUR COM-PANY STAFF MEMBERS GIVEN A BRIBE TO SECURE SUCCESS-FUL OPERATION OF YOUR COMPANY IN LITHUANIA? (company man-agers, %)
Year 2001 2002 2004
No 70.8 72.9 67.8Yes 26.4 27.1 28.6Has no opinion 2.8 _ 3.6
As compared to Table 1.2.5, one could see that bribe-giving in thepast 12 months was far more stable and is not statistically distinctivethroughout the period surveyed: approximately 27 per cent of companymanagers said they had to give bribes. A somewhat bigger difference,accounting for 3 percentage points, is seen among those who gave anegative response about their bribery experience in 2001 and 2004.However, bearing in mind similar percentage of those who did not an-swer the question, one could not consider the difference seriously.
In 2001 and 2002, the most frequent answer of the respondents wasthat they had to give bribes 2-3 times, yet in 2004, their number wassmaller by 4 percentage points than those who mentioned one time (10.5and 14.8 per cent accordingly). Similarly to the analysis of a 5-year pe-riod, no pattern could be established linking bribe-giving during the past12 months with the structural characteristics of companies.
In 2004, company managers, like residents, were asked to remember thelast time they had given a bribe. Their responses are shown in Table 2.2 7.
Table 1.2.7. WHEN WAS THE LAST TIME YOUR COMPANY (COMPANYREPRESENTATIVES) GAVE A BRIBE TO SECURE ITS SUCCESSFULOPERATION IN LITHUANIA? (company managers, %)
Has never given a bribe 42.2This year (2004) 15.6Last year (2003) 17.22�3 years ago 7.24�5 years ago 3.86�14 years ago 2.815 years ago or earlier 0.4Not stated 10.9
About 47 per cent of the respondents mentioned that their companyrepresentatives had to give a bribe at least one time throughout the years

43I. EXPERIENCE OF BRIBERY
of their operation. Those who denied ever giving bribes account for asmaller percentage, 42. Quite a high percentage of those who gave noresponse could be explained by the fact that new companies could havebeen excluded from the period surveyed, whereas old companies, wherethe respondent had been employed, might have been engaged in brib-ery. The distribution of bribe-giving, time-wise, is shown in Figure 1.2.1.
This time again we observe the phenomenon discussed in section 2.1:the respondents primarily tend to register instances of bribery that hap-pened this or previous year. In the time-scale of five years they account foras much as 75 per cent of all the instances of bribery mentioned. Thedifference in the dynamics of bribery in the 5-year and 12-month periodsshown in tables 1.2.5 and 1.2.6, could be explained by presuming that sucha distribution reflects not only the experience of businessmen but ratherthe awareness of it (people tend to remember recent events better).
The 2004 questionnaire of company managers included a questionabout the bribe-giving �technique�, i.e. they were asked to indicate a stageat which the bribe was usually given. 46.1 per cent of managers who hadadmitted giving bribes over the past 5 years, mentioned that they offereda bribe before the service was provided, 29.2 per cent said they commit-ted the act during the provision of the service, 15.1 per cent noted afterthe service and 9.7 per cent either refused to answer or pointed outanother way. Those who �rewarded� the public official before the servicewas provided include production companies, having 50 or more employ-
Figure 1.2.1. WHEN WAS THE LAST TIME YOUR COMPANY (COMPANYREPRESENTATIVES) GAVE A BRIBE TO SECURE ITS SUCCESSFULOPERATION IN LITHUANIA? (bribe-giving companies N=491, companymanagers, %)

44 I. EXPERIENCE OF BRIBERY
ees, also those with the annual turnover of more than LTL 2 million andjoint Lithuanian-foreign firms.
After this, company managers were asked to answer a question aboutthe type of bribe-giving. Their responses are summarised in Table 1.2.8below.
Table 1.2.8. HOW DID YOU REWARD THE PUBLIC OFFICIAL IN EX-CHANGE FOR HIS FAVOURABLE DECISION? (company managers, % ofthe bribe-givers in recent five years)
Year 2001 2002 2004
In cash 49.9 69.7 75.1Giving presents 29.4 40.1 31.6Providing services 16.9 18.8 13.3Other 0.3 0.2 0.0Not stated 3.6 � 7.2
As seen from the table above, the main form of bribe-giving is cashwhich was becoming more and more popular throughout the periodsurveyed: in 2004, three out of four bribe-giving companies chose thisform for �rewarding� public officials. A less widespread form is gifts whichwas practised by almost one third of the bribe-giving companies. Therarest form of settlement is services. The most popular gifts mentionedby the respondents were alcoholic beverages and sweets, and the mostpopular services were the production of a good or provision of services.Services were mostly offered by companies operating in the services sec-tor, whereas gifts were most frequently given by production companies.
Besides that, company managers were asked to answer a questionabout the level of public officials whom their staff had given bribes inthe past five years.
Table 1.2.9. WHAT IS THE LEVEL OF THE PUBLIC BODY WHERE THEPUBLIC OFFICIAL IS WORKING WHOM YOU HAVE GIVEN A BRIBE?(company managers, %)
Year 2001 2002 2004
National public body 24.9 19.2 28.0County level public body 49.7 34.1 37.2Municipal level 64.2 55.6 49.3Not stated 10.4 � 20.1
A high percentage of those who refused to answer distorts an exactpicture of bribe-giving dynamics and structure. Yet Table 1.2.9 shows that

45I. EXPERIENCE OF BRIBERY
companies would more often give bribes to municipal officials, less of-ten to county level officials and finally to national public officials.
While examining companies, similarly to residents, the attempt wasmade to assess the geographical distribution of bribery. The 2001 and2002 surveys looked at big towns and regional centres, whereas the 2004survey (like that of residents) focused on counties and their centres.Tables 1.2.10 a and 1.2.10 b show responses of company managers ac-cording to the bribe-giving geography.
Table 1.2.10 a. DID YOU GIVE A BRIBE TO A PUBLIC OFFICIAL WORK-ING IN A PUBLIC BODY LOCATED IN VILNIUS OR SOME OTHERPLACE? (company managers, %)
Year 2001 2002
Vilnius 54.0 37.7Kaunas 22.5 17.5Klaipëda 14.2 13.0Ðiauliai 4.5 6.8Panevëþys 7.0 5.1Another regional centre 24.9 27.1Some other place 5.1 5.3Not stated 8.3 �
Table 1.2.10 b. DID YOU GIVE A BRIBE TO A PUBLIC OFFICIAL WORK-ING IN A PUBLIC BODY LOCATED IN VILNIUS OR SOME OTHERPLACE? (company managers, %)
Year 2004
Vilnius, Vilnius county 45.5Kaunas, Kaunas county 21.3Klaipëda, Klaipëda county 11.5Ðiauliai, Ðiauliai county 8.7Panevëþys, Panevëþys county 7.4Alytus, Alytus county 6.0Marijampolë, Marijampolë county 6.6Utena county 4.0Telðiai county 2.8Tauragë county 2.0Not stated 9.3
As seen from the tables above, bribes were most frequently given inVilnius, Kaunas and slightly less often paid in Klaipëda and the coun-

46 I. EXPERIENCE OF BRIBERY
ties of these towns. The other county centres are seriously lagging be-hind from the �leaders�.
The institutional bribery experience by company representatives wasassessed in the same way as the respective experience of residents. Table1.2.11 shows the bodies (out of the total 90 state bodies surveyed) whichwere referred to by 3.1 per cent of the respondents as those whoseemployees were given bribes in the last five years. The results have beenranked according to the 2004 survey findings.
Table 1.2.11. TO EMPLOYEES OF WHICH INSTITUTIONS HAS YOURCOMPANY (OR ITS REPRESENTATIVES) GIVEN A BRIBE? (companymanagers, %)
Year 2001 2002 2004
Traffic police 13.2 23.2 18.2
Customs 10.0 13.1 12.7
State Tax Inspectorate (STI) 10.1 12.6 10.5
Town and regional municipalities* � 12.6 8.1
Vehicle technical inspection centres* � 12.0 7.4
National hospitals* � 11.0 5.6
Out-patient departments* � 10.5 5.6
Local hospitals* � 8.8 5.6
County and regional state food andveterinary services 2.2 5.6 5.1
State Labour Inspectorate 3.7 5.9 4.9
State Social Insurance Fund Board 4.7 5.7 3.9
Fire prevention and rescue services 4.3 6.3 3.6
Non-Food Products Inspectorate 2.0 3.2 2.4
Public Health Centre 3.6 3.8 2.2
Land and other real estate cadastreand registry companies 3.1 5.9 2.1
High educational establishments* � 3.8 1.1
Wards** 3.1 3.8 �
State Quality Inspectorate** 2.7 3.4 �
Financial police*** 3.5 � �
* Public institutions not included in the 2004 survey.** Public institutions not included in the 2001 survey.*** Public institution not included in the 2002 and 2004 survey as subject toreorganisation.
47I. EXPERIENCE OF BRIBERY
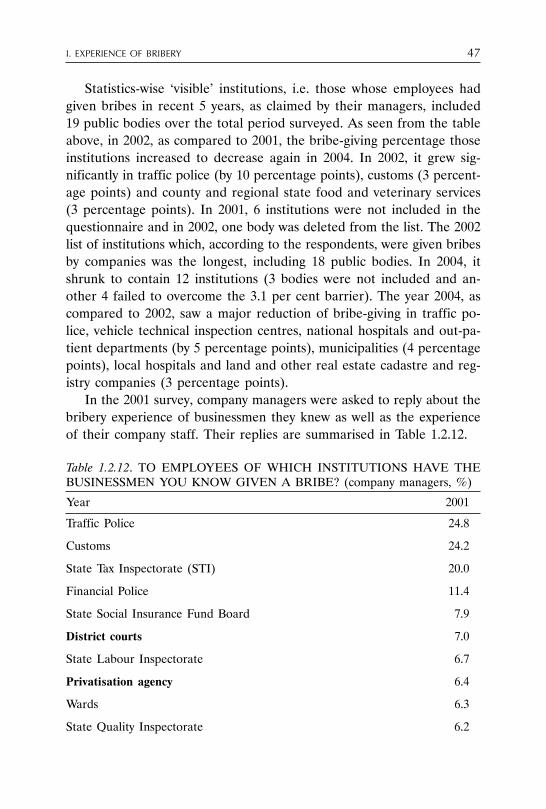
Statistics-wise �visible� institutions, i.e. those whose employees hadgiven bribes in recent 5 years, as claimed by their managers, included19 public bodies over the total period surveyed. As seen from the tableabove, in 2002, as compared to 2001, the bribe-giving percentage thoseinstitutions increased to decrease again in 2004. In 2002, it grew sig-nificantly in traffic police (by 10 percentage points), customs (3 percent-age points) and county and regional state food and veterinary services(3 percentage points). In 2001, 6 institutions were not included in thequestionnaire and in 2002, one body was deleted from the list. The 2002list of institutions which, according to the respondents, were given bribesby companies was the longest, including 18 public bodies. In 2004, itshrunk to contain 12 institutions (3 bodies were not included and an-other 4 failed to overcome the 3.1 per cent barrier). The year 2004, ascompared to 2002, saw a major reduction of bribe-giving in traffic po-lice, vehicle technical inspection centres, national hospitals and out-pa-tient departments (by 5 percentage points), municipalities (4 percentagepoints), local hospitals and land and other real estate cadastre and reg-istry companies (3 percentage points).
In the 2001 survey, company managers were asked to reply about thebribery experience of businessmen they knew as well as the experienceof their company staff. Their replies are summarised in Table 1.2.12.
Table 1.2.12. TO EMPLOYEES OF WHICH INSTITUTIONS HAVE THEBUSINESSMEN YOU KNOW GIVEN A BRIBE? (company managers, %)
Year 2001
Traffic Police 24.8
Customs 24.2
State Tax Inspectorate (STI) 20.0
Financial Police 11.4
State Social Insurance Fund Board 7.9
District courts 7.0
State Labour Inspectorate 6.7
Privatisation agency 6.4
Wards 6.3
State Quality Inspectorate 6.2

48 I. EXPERIENCE OF BRIBERY
Table 1.2.12 continued
Year 2001
Border Police 5.8
Public Health Centre 5.1
Land and other real estate registration companies 5.1
County and district state food and veterinary services 4.9
Fire Prevention and Rescue Department 4.3
Land-Use Planning and Law Department 4.0
Territory Planning and Construction Inspectorate 4.3
County courts 3.7
Uniformed Police 3.6
Ministry of Health 3.5
Public Procurement Agency 3.4
Incarceration institutions 3.2
As compared to Table 1.2.11, Table 1.2.12 included 10 new statistically�visible� institutions: law enforcement and law and order institutions (uni-formed and border police, county and district courts and incarcerationinstitutions), the Ministry of Health, Privatisation agency, Territory Plan-ning and Construction Inspectorate, Land-Use Planning and Law Depart-ment. Contrary to the responses presented in Table 1.2.11, this table doesnot reflect the experience of companies, mostly showing its problematicareas, as spotted by company managers. Noteworthy, all the 12 statisti-cally �visible� institutions listed in Table 1.2.11 were included in Table 1.2.12.The correlation of responses of both of these tables is rather high (0.95).The mean ratio of the responses about those 12 institutions is M=2 (i.e.the respondents were two times more eager to mention the experience ofother businessmen rather than their own). A higher mean ratio is betweenthe responses about the financial police (3.3), customs (2.4), State Qual-ity Inspectorate (2.3) and county courts (2.2).
A presumption could be made that the responses of company man-agers about the bribery experience of their staff reflect the overall con-frontation of the business sector with the trends of bribery practices(obviously, as seen by the Lithuanian business leaders). As a result, thesurveys of 2002 and 2004 did not include a question about the experi-

49I. EXPERIENCE OF BRIBERY
ence of their colleagues businessmen as an overlapping question concern-ing the experience of company representatives.
The attempt was made to examine the bribery experience of companyrepresentatives in the bodies listed in table 1.2.11 by asking them thefollowing additional questions:
� During the last five years, have your company staff had to dealwith matters in those bodies or communicated with the staff ofthose bodies while dealing with their matters?
� When your company staff were dealing with their matters, employ-ees of which institutions demanded or expected a bribe from them?
� Did a bribe help solve the problem which your company had en-countered?
Table 1.2.13 includes the summary of the respondents� answers tothese questions.
As seen from the data above, in 2002 and 2004 about two thirds ofcompany managers dealt with their matters in the tax inspectorate andSocial Insurance Fund Board; about half of the respondents mentionedlocal authorities and traffic police. Those bodies, except for the SocialInsurance Fund, were also most frequently mentioned as those wherebribes had been demanded. Another institution of the kind is customs.In 2002, the frequency of bribe demands from company managers intraffic police jumped by 6 percentage points. In the other bodies men-tioned, such bribe demanding situations remained principally the same.When talking about the effectiveness of bribes, most often companymanagers mentioned traffic police.
A comprehensive analysis of the data presented in tables 1.2.11 and1.2.13 could be made by estimating the so-called bribery indices: demand-ing (Ip), giving (Id), effectiveness (Ie) and initiative (Ii). The indices areestimated in the same way as in case of measuring the bribery experienceof residents.15 In 2001, no indices were estimated due to the lack of esti-mates of companies dealing with their matters in the respective institu-tions. Furthermore, no estimate of indices was made if at least one of theirelements failed to meet the statistical error criterion (K<3.1) or if one ofthe elements had no percentage expression in tables 1.2.11 or 1.2.13.
Final estimates are presented in Table 1.2.14.
15 See formulas (F1)�(F4).

50I. EX
PERIEN
CE O
F BR
IBERY
Table 1.2.13. INSTITUTIONAL EXPERIENCE OF COMPANY STAFF IN 2001�04 (company managers, %)
Dealt with matters Demanded a bribe Bribe helped
Year 2001* 2002 2004 2001 2002 2004 2001* 2002 2004
Traffic police - 51.5 47.5 12.3 18.1 19.7 - 20.2 17.3Customs - 39.8 34.7 12.5 11.8 14.0 - 11.2 12.3State Tax Inspectorate (STI) - 68.0 64.9 10.0 9.3 11.8 - 10.3 9.1City and district authorities** - 57.0 48.6 - 10.3 10.5 - 10.3 7.5Vehicle technical inspection centres** - 43.0 41.5 - 8.5 8.4 - 10.8 6.7National hospitals** - 25.6 15.9 - 6.5 5.7 - 8.5 5.0Out-patient departments** - 47.7 37.5 - 4.9 5.7 - 7.9 4.9Local hospitals** - 26.2 20.2 - 5.6 5.2 - 7.1 3.8County and district state food and veterinaryservices - 14.2 15.2 2.6 3.7 5.1 - 4.7 4.3State Labour Inspectorate - 37.4 42.6 4.1 3.4 6.0 - 4.5 4.3State Social Insurance Fund Board - 61.2 66.1 3.7 3.7 5.4 - 4.8 3.7Fire Prevention and Rescue Services - 23.2 21.0 5.3 5.7 4.2 - 5.5 3.3State Non-Food Products Inspectorate - 14.9 16.4 2.2 2.0 3.1 - 2.9 2.0Public Health Centre - 17.1 14.8 3.0 1.9 2.3 - 2.9 1.8Land and other real estate cadastre and registrycompanies - 27.4 21.8 2.4 4.4 4.0 - 5.4 1.7High educational establishments** - 17.0 7.9 - 2.4 1.5 - 3.2 1.1Wards*** - 26.6 - 2.8 2.9 - - 3.3 -State Quality Inspectorate*** - 16.8 - 2.7 2.9 - - 2.9 -Financial police**** - - - 4.1 - - - - -
* No estimate of the 2001 survey was made.** Institutions not included in the 2001 survey.*** Institutions not included in the 2004 survey.**** The institution was subject to reorganisation and hence excluded from the surveys of 2002 and 2004.

51I. EX
PERIEN
CE O
F BR
IBERY
Table 1.2.14. BRIBERY INDICES IN 2002 AND 2004 (company managers)
Demanding Giving Efficiency InitiativeIndex (Ip) Index (Id) Index (Ie) Index (Ii)
Year 2002 2004 2002 2004 2002 2004 2002 2004
Traffic Police 0.35 0.41 0.45 0.38 0.87 0.95 0.10 -0.03Customs 0.30 0.40 0.33 0.37 0.85 0.97 0.03 -0.04State Tax Inspectorate (STI) 0.14 0.18 0.19 0.16 0.82 0.87 0.05 -0.02City and district authorities 0.18 0.22 0.22 0.17 0.82 0.93 0.04 -0.05Vehicle technical inspection centres 0.20 0.20 0.28 0.18 0.90 0.91 0.08 -0.02National hospitals 0.25 0.36 0.43 0.35 0.77 0.89 0.18 -0.01Out-patient departments 0.10 0.15 0.22 0.15 0.75 0.88 0.12 0.00Local hospitals 0.21 0.26 0.34 0.28 0.81 0.68 0.12 0.02County and district state food and veterinaryservices 0.26 0.34 0.39 0.34 0.84 0.84 0.13 0.00State Labour Inspectorate 0.09 0.14 0.16 0.12 0.76 0.88 0.07 -0.03State Social Insurance Fund Board 0.06 0.08 0.09 0.06 0.84 0.95 0.03 -0.02Fire Prevention and Rescue Services 0.25 0.20 0.27 0.17 0.87 0.92 0.03 -0.03State Non-Food Products Inspectorate * - - 0.21 - - - - -Public Health Centre * - - 0.22 - - - - -Land and other real estate cadastreand registry companies * 0.16 0.18 0.22 - 0.92 - 0.05 -High educational establishments * - - 0.22 - 0.84 - - -Wards* - - 0.14 - 0.87 - - -State quality inspectorate * - - 0.20 - - - - -
* The index was not estimated if one of its elements did not meet the statistical error criterion or one of its elements was notincluded into estimation.

52 I. EXPERIENCE OF BRIBERY
Judging from the comparison of two years experience, it is difficultto identify substantial quantitative patterns. Yet both in 2002 and 2004,the biggest index of bribe-demanding (as well as bribe-giving) was intraffic police. The former (bribe-demanding) is seen to grow, whereasthe latter (bribe-giving) was reducing. Accordingly, the initiative indiceschanged from positive in 2002 to negative in 2004. The highest index ofeffectiveness in 2002 was in the land and other real estate cadastre andregistry companies and in 20004, in customs (0.97).
Noteworthy, all the initiative indices were positive in 2002 (the high-est was in national hospitals), whereas in 2004, they were mostly nega-tive and rather low.
Company managers were asked (as an open question) to estimate theshare of bribery in their company�s annual turnover. Unfortunately, thepercentage of those who gave no response was rather high and uneven:from 30 to 70 per cent. Therefore, the results summarised in Table 1.2.15represent only a small part of the respondents� estimates.
Table 1.2.15. WHAT IS THE APPROXIMATE SHARE (%) OF YOURCOMPANY�S ANNUAL TURNOVER PAID AS BRIBES? (company managers)
Year 2001 2002 2004
In the business Number of thosesector who responded 386 289 571
Share of turnover 4.2 4.1 4.7
In the company Number of thosewho responded 445 321 702Share of turnover 2.1 2.0 1.3
On the basis of those findings one could presume that bribery fundsmay account to 1-2 per cent of the annual turnover of the company. Thefact that bribery in the business sector is considered two times biggershould not come as a surprise, bearing in mind that such an assessmentis made on the basis of the experience of colleagues. Yet this was theratio that the 2001 survey established between personal experience ofinstitutional bribery and that of colleagues.16 Therefore, the previouslymentioned 1-2 per cent of the annual turnover spent on bribery may beconsidered a certain indicator of the cost of bribery in Lithuania.
16 See commentary to tables 2.2.11 and 2.2.12.

53I. EX
PERIEN
CE O
F BR
IBERY
Table 1.2.16. MAXIMUM AND MINIMUM MEANS OF BRIBE PAYMENT IN RECENT FIVE YEARS (LTL)
Year 2001 2002 2004
Maximum Minimum Absolute Maximum Minimum Absolute Maximum Minimums Absolutepayment payment payment payment payment payment payment payment paymentmean mean mean mean mean mean mean mean mean(Md) (Mm) (Ma) (Md) (Mm) (Ma) (Md) (Mm) (Ma)
Traffic police 331 55 193 273 63 168 708 64 386
Customs 3061 563 1812 1043 257 650 1006 199 603State TaxInspectorate(STI) 1680 332 1006 895 303 599 978 160 569
City anddistrictauthorities* � � � 1323 230 777 1361 339 850
Vehicletechnicalinspectioncentres * � � � 161 93 127 203 78 141
Nationalhospitals* � � � 1021 128 575 596 98 347
Out-patientdepartments* � � � 129 29 79 100 40 70
Localhospitals* � � � 342 79 211 223 55 139
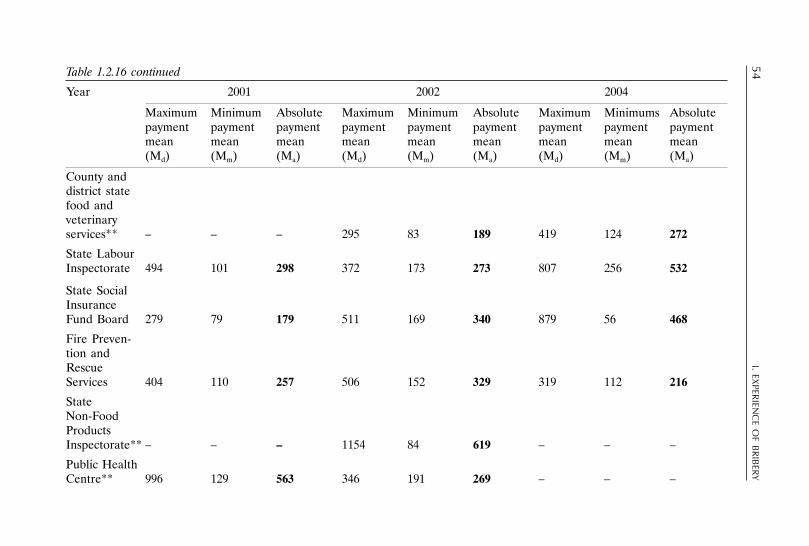
54I. EX
PERIEN
CE O
F BR
IBERY
Table 1.2.16 continued
Year 2001 2002 2004
Maximum Minimum Absolute Maximum Minimum Absolute Maximum Minimums Absolutepayment payment payment payment payment payment payment payment paymentmean mean mean mean mean mean mean mean mean(Md) (Mm) (Ma) (Md) (Mm) (Ma) (Md) (Mm) (Ma)
County anddistrict statefood andveterinaryservices** � � � 295 83 189 419 124 272
State LabourInspectorate 494 101 298 372 173 273 807 256 532
State SocialInsuranceFund Board 279 79 179 511 169 340 879 56 468
Fire Preven-tion andRescueServices 404 110 257 506 152 329 319 112 216
StateNon-FoodProductsInspectorate** � � � 1154 84 619 � � �
Public HealthCentre** 996 129 563 346 191 269 � � �

55I. EX
PERIEN
CE O
F BR
IBERY
Table 1.2.16 continued
Year 2001 2002 2004
Maximum Minimum Absolute Maximum Minimum Absolute Maximum Minimums Absolutepayment payment payment payment payment payment payment payment paymentmean mean mean mean mean mean mean mean mean(Md) (Mm) (Ma) (Md) (Mm) (Ma) (Md) (Mm) (Ma)
Land andother realestatecadastreand registrycompanies** � � � 472 172 322 � � �High educa-tional estab-lishments* � � � 1112 241 677 � � �Wards*** � � � 227 94 161 � � �State QualityInspec-torate*** 414 203 309 262 70 166 � � �FinancialPolice**** 655 164 410 � � � � � �
* Institutions not included in the 2001 survey.** Means have not been estimated as their constituent elements were non-compliant with statistical requirements.*** Institutions not included in the 2004 survey (The 2001 means of wards were non-compliant with statistical requirements).**** The institution was subject to reorganisation and therefore not included in the 2002 and 2004 surveys

56 I. EXPERIENCE OF BRIBERY
The survey conducted allows assessment of micro- as well as macro-economic aspects of bribery. Furthermore, those aspects could becharacterised by the amount of bribes offered to various institutions.Similarly to residents, company managers were asked to specify the big-gest and the smallest amount of the bribe they had paid. Table 1.2.16shows the mean of maximum and minimum amounts of bribes (Md irMm) given in the statistically �visible� institutions as well as the absolutepayment mean (Ma) estimated on their basis.17
Table 1.2.16 above shows that during the period surveyed companyrepresentatives paid the biggest amounts in customs and local authori-ties. In 2001, particularly large sums, judging from the responses givenby company managers, were paid in customs: the maximum paymentmean was LTL 3061. In 2002 and 2004, the �leader� of unofficial pay-ments was the local authorities with the highest maximum paymentmeans. The 2002 survey shows a high maximum payment mean in na-tional hospitals and State Non-Food Products Inspectorate.
Analysis of the dynamics of absolute payment mean discloses that itwas steadily decreasing in two bodies only: customs and the tax inspec-torate. Curiously enough, the absolute payment mean in those bodies wentradically down in 2002: almost three times in customs and more than oneand a half times in the tax inspectorate. The 2004 decline is not as signifi-cant. Certain similarities could be observed in the fluctuation of the ab-solute mean index in traffic police and labour inspectorate: a minor re-duction in 2002 and the double growth in 2004. The situation in the FirePrevention and Rescue Service is quite the opposite: showing an increaseof the absolute payment mean in 2002 to drop by 1.5 times in 2004.
In 2002, as compared to 2001, absolute payment indices fell almosttwo times in public health centres and quality inspectorates. In 2004, incomparison to 2002, the absolute mean was falling substantially in na-tional and local hospitals; a drop in out-patient departments was not assignificant. However, in 2004, the growth of the absolute payment meanwas rather big in the Social Insurance Fund Board, local authorities andslightly smaller in vehicle technical inspection centres as well as food andveterinary services.
As seen from the survey findings of residents and company manag-ers, bribery in society and its one specific sector, business, is consideredan aching and significant problem.
17 All the indices mentioned above are estimated following formulas (F5) � (F7).

57I. EXPERIENCE OF BRIBERY
An assessment of bribe demands over the period of last five yearsshows that residents face the problem less frequently than business rep-resentatives. Besides that, the bribery situation in the business sectorstayed almost the same during the period surveyed, yet the 2004 surveyof residents witnessed a small improvement. Admittedly, the survey ofthe bribery experience by company managers in the last 12 months showsthat the situation got better in 2004.
In recent five years, residents and company managers also had dif-ferent bribe-giving experience. The experience of residents over the pe-riod surveyed was more or less stable, whereas that of company manag-ers was getting worse. In 2001, the percentage of residents and companymanagers who gave a bribe was almost the same (36�37) and in 2004,the number of the bribe-giving company managers was 10 percentagepoints higher that that of residents. However, while measuring the ex-perience of company managers in the last 12 months, the worsening ofthe situation is not as radical as in the last five years without practicallyexceeding the statistical error.
Analysis of bribe-giving motives (this question was put to the resi-dents only) showed that the main reason for bribery is the unwillingnessto �be on a waiting list� and the willingness to secure �quality� of services.In other words, these are the problems related to public administration.Thus in order to curb or reduce bribery, one should primarily think abouthow to optimise the market of public services, meet the demands ofresidents communicating with public officials more effectively to preventboth parties from entering into conspiracies or looking for compromisesbeyond law.
Comparison of the bribe-giving �technique� used by residents andcompany managers (the latter were given the question in the 2004 sur-vey only) suggests that residents, more than company managers, take arisk and more frequently pay bribes before the service is rendered. The2004 survey showed the difference of 10 per cent between those twogroups. Yet both residents and company managers prefer such a formof settlement to the payment during the service or after it is performed.
In recent years, cash was a predominant form of unofficial paymentfor services both among residents and company managers: it was men-tioned by about three fourths of the respondents. However, companymanagers, in contrast to residents, were more in favour of other forms,such as �gifts� or services. The most popular gifts both among business-men and residents were alcoholic beverages and sweets.

58 I. EXPERIENCE OF BRIBERY
Both businessmen and residents showed similar preferences, in termsof bribe-giving, to administrative entities: most frequently bribes weregiven in local authorities, less often in counties and the rarest cases werein national bodies. However, businessmen, as compared to residents, gavemore bribes to the county level public officials.
Similarities are also seen in the bribe-giving geography. The lion�s shareof residents and company managers said they gave bribes in Vilnius,Kaunas, and Klaipëda. In 2004, those towns and their counties were men-tioned by 65 per cent of all residents and 80 per cent of company manag-ers. The latter gave more bribes in Vilnius, and the difference of bribe-giving by those two groups in Kaunas and Klaipëda is not as significant.
The institutional bribe-giving �geography� of residents and companymanagers is also different. All the seven statistically �distinct� bodies atwhich the residents admitted having given bribes over the period sur-veyed are among nineteen bodies mentioned by company managers. Yetthe top five includes only two bodies mentioned by both of these groups:traffic police and vehicle technical inspection centres. Residents tend togive bribes more often in medical establishments: out-patient depart-ments, local and national hospitals. Contrary to that, company manag-ers bribe institutions that are more related to the business sector, includ-ing customs, tax police and local authorities.
There is a gap of difference between the internal institutional brib-ery experience by residents and company representatives. In 2002 and2004, residents experienced a bigger risk of bribe demanding and bribe-giving in national hospitals, whereas company representatives felt it whiledealing with traffic police. During the same period, bribes mostly helpedresidents in vehicle technical inspection centres and company managersin land and other real estate cadastre and registry company (2002) aswell as customs (2004). Both residents and businessmen showed biggerinitiative in offering bribes in hospitals.
Analysis of the amounts of bribes offered suggests that the bribery�market� of residents is more stable and predictable than that of com-pany representatives. Obviously, company representatives pay biggeramounts than residents. Yet here some qualitative similarities can bespotted: both residents and company representatives paid the biggestamounts in the local authorities. The other two �most expensive� bodieswere customs and tax inspectorate for company representatives and na-tional as well as local hospitals for residents.

59I. EXPERIENCE OF BRIBERY
Consequently, the business of corruption has its own logic, motiva-tion, structure and even payment rates. What is the price of bribery paidby Lithuanian society? Without going too much into moralisation, we willmake one simple assessment. If, judging from what has been assessed,Lithuanian companies spend 1.3% of the annual turnover funds on brib-ery and Lithuania�s gross value added (excluding banks and other finan-cial companies) in 2004 amounted to LTL 100 billion, the percentagementioned above totals LTL 1.3 billion. This could be an estimate of theprice of bribery in Lithuania.18
18 Information about the Lithuanian gross value added the authors were kindly givenby famous Lithuanian financial expert dr. Gitanas Nausëda. Noteworthy is his commentabout the price of bribery: �Admittedly, the total price of bribery in 2004 exceeded theamount of profit tax collected in the national budget, LTL 1.17 billion.�

60 II. ATTITUDE TOWARDS CORRUPTION
II. ATTITUDE TOWARDS CORRUPTION
The first regular representational public opinion surveys were con-ducted in 1910-20s examining residents� attitude towards various impor-tant public issues. In the beginning they became widely used in the USA,later spread to other Western democracies. Lithuania started conduct-ing consistent representational public opinion surveys immediately afterthe restoration of its independence. The recent fifteen years saw a hugenumber of public surveys conducted in Lithuania, including general pub-lic opinion surveys and various focus groups (businessmen, young people,politicians, etc.), examining their attitude towards a variety of issues.
The aim of most of these surveys is to find out the respondents� at-titude towards different issues. Attitudes are important phenomena of aperson�s consciousness. These are more or less permanent individualjudgements guiding the person in the social environment and allowinghim or her to react in different situations, to various phenomena orobjects in a faster and more effective way. Theorists have been longanalysing the link between attitudes and behaviour. It is stated to bemutual: in usual situations a person tends to behave according to hisattitudes (positive or negative, determining different actions). On theother hand, there are certain life situations in which an individual, dueto some reasons, acts contrary to his or her attitudes. In that case, he orshe gets into the so-called cognitive dissonance situation, which usuallyresults in the change of attitudes (i. e. behaviour determines attitudes).
Attitudes are formed and change throughout the entire life of a hu-man being. Their formation is based on a number of factors. One of thekey factors is personal experience, opinion and experience of otherpeople whom he or she considers important, and the growing importanceof the mass media. The latter informs the person about such events andphenomena with which he or she has no direct contact. To have thisinformation influence the person�s attitudes, the degree of trust in thesource of information has to play an important role. Lithuanian public

61II. ATTITUDE TOWARDS CORRUPTION
opinion surveys of the last fifteen years show that residents tend to trustthe Lithuanian mass media as a public institution (during the entireperiod of the recent fifteen years, 60-70 per cent of the Lithuanian popu-lation have shown their trust in the mass media; this institution retainedits position among the three most trusted institutions by the Lithuanianpopulation).19
Social surveys of Lithuanian Map of Corruption analysed in this bookare different from usual public surveys as they are probably the first onesto attempt examine not just the residents� attitude towards corruptionas a social phenomenon but also to find out the peculiarities of residents�behaviour and their experience of communication with various institu-tions. Certainly, every survey is based on the information provided bythe respondents. Therefore, analysis of residents� behaviour and experi-ence is based on their responses to the questionnaire presented, ratherthan observation or registration of real life behavioural patterns. Thequality of the information collected depends on the openness and sin-cerity of the respondents answering the questions. The fifteen year ex-perience of conducting surveys in Lithuania shows that those who agreeto take part in them usually answer the questions honestly, particularlybeing aware of confidentiality and anonymity of the surveys, i.e. know-ing that the answers are never associated with a concrete person. Thefact that the information provided by the respondents could be trustedis verified by the analysis of other surveys whose results can be comparedwith the information received from other sources (various product pur-chasing surveys, pre- and post-election surveys, household surveys, etc.).
Chapter II of this book analyses the dynamics of public attitude to-wards corruption, i.e. assessment of corruption as a phenomenon, inten-tions to behave in one or another way in various situations and sourcesof information about corruption. Similarly to Chapter I, the attitudes ofthe Lithuanian residents will be compared with the attitude of business-men. It will also analyse the link between the respondents� attitudes andbribery. Such analysis is important because, as we mentioned before,attitudes and behaviour (experience) are interrelated and interact witheach other. Bribery is one form of corruption, yet it is the easiest tocomprehend for the majority of the population. Besides that, social sur-
19 Baltijos tyrimai, 1992�2005. Project Lithuanian Barometer. Information is periodi-cally publicised at www.eurovalstybe.lt .

62 II. ATTITUDE TOWARDS CORRUPTION
veys are the simplest way in which they can answer questions about it.A more comprehensive description of the concepts of corruption andbribery is provided in the Introduction and Chapter I. With regard toattitudes, the experience of bribery will be considered as one of the fac-tors helping to realise the difference between various attitudes towardscorruption held by various population groups.
2.1. LITHUANIAN RESIDENTS� OPINIONABOUT CORRUPTION
Most frequently residents receive information about corruption fromtelevision, national press, their own experience and the experience oftheir acquaintances. In recent three years, the role of television, friendsand relatives has grown. Thus the key sources of information about cor-ruption are national media and closest friends. The experience of friendsand acquaintances is equally important to all the population groups.Personal experience was mostly mentioned by the most active popula-tion groups: middle-aged people with higher income. Television is themost important source of information for young people.
Table 2.1.1. WHICH SOURCE OF INFORMATION ALLOWS YOU TOFORM THE MOST RELIABLE OPINION ABOUT THE SCALE OF COR-RUPTION IN LITHUANIA? (%)20
Year 2001 2002 2004
Television 27 33 42
Personal experience 23 16 18
National press 22 16 18
Friends, acquaintances 18 24 32
Radio 3 3 8
Local press 2 3 5
Special publications, reports 2 1 1
Seminars, conferences, special events 1 0 0
Internet 1 1 2
Has no opinion 7 5 0
20 Data about the respondents� attitude shown in part 1 and 2 have been traditionallyrounded to the nearest whole number.

63II. ATTITUDE TOWARDS CORRUPTION
Obviously, personal experience is the main source of informationabout corruption to those who had given a bribe themselves. Whereasthe experience of friends and acquaintances as well as the nationalpress are equally important sources of information both for those whohave and those who have not given a bribe. Television is a more im-portant source of information for those who have no bribe-giving ex-perience.
Table 2.1.2. WHICH SOURCE OF INFORMATION ALLOWS YOU TOFORM THE MOST RELIABLE OPINION ABOUT THE SCALE OF COR-RUPTION IN LITHUANIA? (%)
Year 2001 2002 2004
Have Have Have Have Have Havenot given given not given given not given givena bribe a bribe a bribe a bribe a bribe a bribe
Television 29 24 39 24 50 31
Personal experience 14 35 8 28 5 38
National press 25 20 16 17 19 16
Friends, acquaintances 18 20 23 25 33 31
Radio 4 1 3 3 9 5
Local press 2 2 4 2 6 4
Special publications, reports 2 2 1 1 1 1
Seminars, conferences,special events 1 1 0 0 0 0
Internet 1 1 2 1 2 2
Has no opinion 8 2 7 3 0 0
We will begin analysing residents� attitudes towards corruption byprimarily looking at the general level, i.e. by measuring the overall pub-lic attitude towards the impact of corruption (positive or negative) topublic life.
Findings of three surveys show that Lithuanian residents have a firmand constant opinion concerning the issue and it does not depend onthe difference of their life styles (determined by such social demographicfeatures like the gender, age, type of residential area, income, etc.).
The absolute majority of Lithuanian residents think that corruption isan obstacle in public life. More than half of the respondents consider

64 II. ATTITUDE TOWARDS CORRUPTION
corruption a major obstacle. Comparison of survey findings of three yearsshows that public opinion about the issue remained the same: in 2001-04,eight people out of ten in Lithuania thought that corruption is an obstacleto public life (see Table 1.2.3).
Table 2.1.3. WHICH OF THE FOLLOWING STATEMENTS DOES MOSTLYCORRESPOND TO YOUR OPINION? (%)
Year 2001 2002 2004
Corruption is a major obstacle in public life 56 61 59
Corruption is more of an obstacle in public life 21 19 20
Corruption is neither an obstacle to nor a facilitatorof public life 6 6 6
Corruption is more of a facilitator of solving publicproblems 1 4 5
Corruption facilitates solution of public problems 1 2 2
Has no opinion 15 9 9
All the three surveys showed that male and female assessments arethe same. Middle-aged people (30�49 years old) hold the most nega-tive opinion about corruption out of all the age groups (61 per cent in2001, 69 per cent in 2002 and 63 per cent in 2004 thought that cor-ruption is a major obstacle in public life). Young people (up to 30 yearsold) were the rarest age group to agree with this statement (45 per centin 2001, 47 per cent in 2002 and 49 per cent in 2004). Furthermore,the surveys show that the level of income has little impact upon theresidents� assessment, yet residents with smaller income could not statetheir opinion concerning the matter more often than those who arebetter-off.
The attitude of town-dwellers towards corruption is far stricter thanthat of rural residents. Asked whether corruption is a major obstacle inpublic life, a positive answer was given by the majority of city-dwellers,including 59 per cent in 2001, 64 per cent in 2002 and 61 per cent in2004. Residents of small towns who held the same opinion accountedfor 58 per cent in 2001, 64 per cent in 2002 and 62 per cent in 2004.However, the percentage of positive answers among rural population is

65II. ATTITUDE TOWARDS CORRUPTION
lower, making up 48 per cent in 2001, 56 per cent in 2002 and 56 percent in 2004 of all the respondents.
Noteworthy, those who had no opinion concerning the matter in 2001represented 15 per cent of all the respondents (24 per cent in rural ar-eas), whereas in 2002 and 2004, the number of such people decreasedto 9 per cent (showing major change in villages and small towns). Onecould presume that processes which were taking place in Lithuaniansociety over the period of last three years (since 2001) unveiling publiccorruption and political scandals (President�s impeachment, bribery al-legations against members of the Seimas) did not change residents� atti-tude towards corruption�s impact to society (this attitude had been al-ready negative), yet they drew the attention of some of them to thisphenomenon.
How important in forming the residents� attitude towards corruptionis the source of information about the phenomenon? We compared theanswers of those who said that the most reliable source of informationfor them is their personal experience and the experience shared by theirfriends and acquaintances with the answers of those who pointed at themass media. Both of these groups think that corruption is a major ob-stacle in public life. In 2001, 50 per cent of those who base their opin-ion on their own experience and 63 per cent of those who rely on themass media said that corruption is a major obstacle; 23 and 19 per centaccordingly said it is an obstacle. In 2002, the first group of the respon-dents gave the following answers: corruption was considered a majorobstacle by 63 per cent and an obstacle by 18 per cent. During thesame year, the second group saw corruption as a major obstacle (61 percent) and an obstacle (20 per cent). In 2004, the following responseswere given: those for whom experience is important stated that corrup-tion is major obstacle (60 per cent) and an obstacle (19 per cent) andthose who rely on the mass media gave the same answers representing59 and 20 per cent accordingly. Consequently, for those two groups ofthe respondents the key source of information has no impact upon theiropinion.
Does personal experience play a role in forming the opinion aboutcorruption�s impact upon society? We have compared the answers ofthose residents who said they had given a bribe in the last five years withthose who said that they had not (see Table 2.1.4).
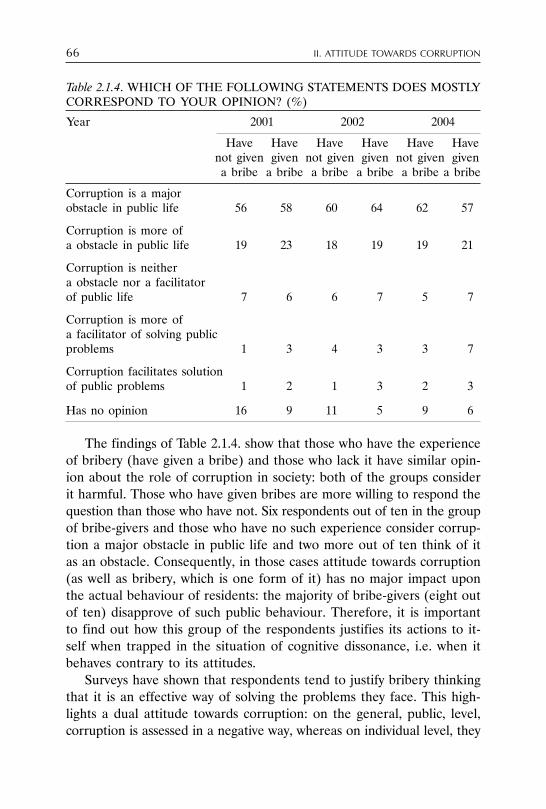
66 II. ATTITUDE TOWARDS CORRUPTION
Table 2.1.4. WHICH OF THE FOLLOWING STATEMENTS DOES MOSTLYCORRESPOND TO YOUR OPINION? (%)
Year 2001 2002 2004
Have Have Have Have Have Havenot given given not given given not given givena bribe a bribe a bribe a bribe a bribe a bribe
Corruption is a majorobstacle in public life 56 58 60 64 62 57
Corruption is more ofa obstacle in public life 19 23 18 19 19 21
Corruption is neithera obstacle nor a facilitatorof public life 7 6 6 7 5 7
Corruption is more ofa facilitator of solving publicproblems 1 3 4 3 3 7
Corruption facilitates solutionof public problems 1 2 1 3 2 3
Has no opinion 16 9 11 5 9 6
The findings of Table 2.1.4. show that those who have the experienceof bribery (have given a bribe) and those who lack it have similar opin-ion about the role of corruption in society: both of the groups considerit harmful. Those who have given bribes are more willing to respond thequestion than those who have not. Six respondents out of ten in the groupof bribe-givers and those who have no such experience consider corrup-tion a major obstacle in public life and two more out of ten think of itas an obstacle. Consequently, in those cases attitude towards corruption(as well as bribery, which is one form of it) has no major impact uponthe actual behaviour of residents: the majority of bribe-givers (eight outof ten) disapprove of such public behaviour. Therefore, it is importantto find out how this group of the respondents justifies its actions to it-self when trapped in the situation of cognitive dissonance, i.e. when itbehaves contrary to its attitudes.
Surveys have shown that respondents tend to justify bribery thinkingthat it is an effective way of solving the problems they face. This high-lights a dual attitude towards corruption: on the general, public, level,corruption is assessed in a negative way, whereas on individual level, they

67II. ATTITUDE TOWARDS CORRUPTION
separate themselves from corruption as a social phenomenon and lookat it from the point of view of its effectiveness. In other words, attitudestowards corruption gain two new characteristics: one is terminal (as anend-state, following the Rokeach value system), another is instrumental(as a means of achieving the end-state).
The absolute majority of the respondents think that bribes help solvethe problems they face. During the period of three years, the residents�opinion stayed unchanged concerning the issue (the question was putforward to both residents and company managers in 2002 and 2004)(Table 2.1.5).
Table 2.1.5. DOES BRIBE-GIVING HELP SOLVE PROBLEMS YOUFACE? (%)
Year 2001 2002 2004
Yes 72 76 73No 16 11 14Has no opinion 12 13 13
The table above shows that seven respondents out of ten claim thatbribes is an effective way of solving problems. The same opinion is heldby various social groups. However, personal experience has a majorimpact upon the assessment of bribery effectiveness: during all the threesurveys almost all the respondents who had given a bribe in past fiveyears said that bribe-giving helps solve problems. Although those whohad not given a bribe said that bribery is an effective problem-solvingtool less often than bribe-givers yet more than half of them admitted thisto be true (Table 2.1.6).
Table 2.1.6. DOES BRIBE-GIVING HELP SOLVE PROBLEMS YOUFACE? (%)
Year 2001 2002 2004
Have Have Have Have Have Havenot given given not given given not given givena bribe a bribe a bribe a bribe a bribe a bribe
Yes 60 90 65 92 65 89No 24 7 14 7 18 7Has no opinion 16 3 20 1 17 4

68 II. ATTITUDE TOWARDS CORRUPTION
Those who rely more on their own experience and the experience oftheir friends and acquaintances tend to think more often that the oth-ers that bribes help solve problems (in 2002, they accounted for 81 percent and in 2004, they represented 78 per cent of all the respondents ofthis group).
The majority of residents think that corruption does harm to publiclife, yet they consider bribes an effective problem-solving tool and hencewould give a bribe to fix their important problem. This attitude over threeyears was not subject to change: six respondents out of ten are disposedto give a bribe and only every fifth resident is against such action.
Table 2.1.7. WOULD YOU GIVE A BRIBE IF YOU HAD TO SOLVE AVERY IMPORTANT PROBLEM AND A BRIBE WERE EXPECTED FORTHAT? (%)
Year 2001 2002 2004
Yes 61 60 59No 22 21 22Has no opinion 16 19 19
Those who gave a bribe over the past five years said they would giveit again to solve an important problem. Their opinion did not change inthree years. One third of the non-givers said they would not give a bribeto solve a problem and four respondents out of ten admitted they would(see Table 2.1.8 below).
Table 2.1.8. WOULD YOU GIVE A BRIBE IF YOU HAD TO SOLVE AVERY IMPORTANT PROBLEM AND A BRIBE WERE EXPECTED FORTHAT? (%)
Year 2001 2002 2004
Have Have Have Have Have Havenot given given not given given not given givena bribe a bribe a bribe a bribe a bribe a bribe
Yes 43 90 44 86 46 81No 37 4 29 7 31 9Has no opinion 20 6 27 7 24 10
Admittedly, those who have bribery experience are firmly determinedabout their intentions: they include a very small percentage of those whohave no opinion concerning the matter. On the other hand, one fifth

69II. ATTITUDE TOWARDS CORRUPTION
respondent out of those who have no experience of the kind could notsay how they would behave in such a situation. Bearing in mind theoverall negative attitude towards corruption and a strong instrumentalcharacteristic of the attitude towards it, one could presume that quite afew of those who gave no response would be inclined to give a bribe;they refuse to respond due to normative reasons (trying to avoid a con-flict between their attitude and anticipated behaviour).
Although the legislation provides for the liability of both the bribe-giver and the taker, a �justifying� attitude is predominant among the resi-dents. They tend to see a bribe-giver as a victim who is forced by cir-cumstances or a public official to give a bribe and hence he or she isless of a criminal than the bribe-taker.
The 2004 survey asked the residents about who should bear biggerbribery liability: a giver or a taker. Half of the residents think it is thebribe-taker and every fourth respondent ascribed it to both partiesequally. Bigger liability for the bribe-giver was stated by as little as 6 percent of the respondents.
Those who have bribe-giving experience exhibit a bigger tendency toassociate bribery liability with the taker and those who have not givenbribes more often than bribe-givers ascribe liability to both partiesequally.
Table 2.1.9. WHO DO YOU THINK BEARS BIGGER LIABILITY IN CASEOF BRIBE-GIVING? (2004, %)
All residents Have not given Have givena bribe a bribe
A bribe-giver 6 8 5A bribe-taker 51 48 56Both equally 25 27 22Depends on circumstances 11 10 14Has no opinion 7 8 4
Those who rely on experience tend to link liability with the bribe-taker.
Another comparison, of the situation in Lithuania and other coun-tries, discloses the influence of the mass media and other opinion-form-ing sources (acquaintances, persons of authority, etc.) that help mouldattitudes. Admittedly, people asked about the level of corruption inLithuania and abroad also show their overall attitude towards the stan-

70 II. ATTITUDE TOWARDS CORRUPTION
dard of living, democratic traditions, etc. in their own and other coun-tries, because the majority of the respondents have no direct experienceof corruption in foreign countries (except for the CIS which they associ-ate with the former USSR).
In three years Lithuanian population did not change its opinion aboutthe level of corruption in their country as compared to its neighbours.They predominantly think, representing 40 per cent of the respondents,that the level of corruption in Western countries is lower than in Lithua-nia. Less then one tenth of the respondents consider the situation worsein Western countries than in Lithuania and every fifth respondent saidthat the situation is similar. Unfortunately, every fourth respondent couldnot state his or her opinion when asked the question.
Comparing the situation in Lithuania and Central and Eastern coun-tries, Lithuanian residents tend to think that the level of corruption issimilar. In this case again, every tenth respondent thinks that there isless corruption in Lithuania and every fourth-fifth said it is bigger in thiscountry.
Lithuania�s position corruption-wise is regarded better as comparedwith the CIS countries. Yet these assessments in three years becameworse. In 2001, 27 per cent of the respondents thought that corruptionis bigger in the CIS than in Lithuania and 25 per cent said it is similar.Whereas in 2004, 28 per cent of the respondents said the situation issimilar in those countries and 20 per cent regarded Lithuania as lesscorrupt. As a matter of fact, the number of those who saw Lithuania withbigger corruption did not increase. Noteworthy, Lithuanian residents haveno opinion about the situation in the CIS more often than talking aboutWestern countries and Central and Eastern European states.
The situation in Lithuania is worst regarded by middle-aged people(30�49 years old), and people younger than 30 and older than 50 moreoften than others have no opinion concerning the matter. Rural residentsfind it more difficult to respond to the question than city-dwellers.
Those who mostly receive information about corruption from theirpersonal experience and the experience of their friends and acquaintan-ces have similar judgement concerning the issue like those who rely oninformation provided by the mass media. Both of those groups think thatcorruption in Lithuania is bigger than in Western states (in 2001, suchopinion was expressed by 49 per cent of the group which indicated ex-perience as the main source of information, 42 per cent of the group

71II. ATTITUDE TOWARDS CORRUPTION
which referred to the mass media; in 2002, they represented 52 and 47per cent accordingly and in 2004, they accounted for 45 and 41 per centrespectively).
Table 2.1.10. DO YOU THINK CORRUPTION IN LITHUANIA, AS COM-PARED TO THE OTHER COUNTRIES, IS SMALLER, BIGGER OR THESAME? (%)
Year 2001 2002 2004
As compared with Western countries:Smaller in Lithuania 10 8 7The same 20 19 24Bigger in Lithuania 43 48 43Has no opinion 27 25 27
As compared with Central and Eastern European states:Smaller in Lithuania 9 10 8The same 38 34 37Bigger in Lithuania 20 27 24Has no opinion 33 29 31
As compared with the CIS countries:Smaller in Lithuania 27 23 20The same 25 28 28Bigger in Lithuania 13 19 16Has no opinion 35 30 36
While comparing the situation in Lithuania and Central and EasternEuropean states those groups also expressed similar opinion. In 2001, thosewho said that experience was the main source of their information thoughtthat the level of corruption in Lithuania was the same as in Central andEastern Europe (42 per cent) or bigger (23 per cent) and those who re-lied on the mass media as the main source of information were of the sameopinion representing 38 and 20 per cent accordingly. In 2002, 34 per centof the experience group (35 per cent of the media group) saw the situa-tion the same in Lithuania and Central and Eastern European countriesand 30 per cent (26 per cent of the media group accordingly), thought ofLithuania as more corrupt. In 2004, the two groups held similar opinions:36 per cent of the first group and 37 per cent of the second group saw theLithuanian situation the same as in other Central and Eastern Europeancountries and 25 per cent of the first group and 22 per cent of the secondgroup considered it worse in Lithuania.

72 II. ATTITUDE TOWARDS CORRUPTION
While comparing the Lithuanian situation to that of the CIS, the firstgroup which relied on their own experience and that of their friends andacquaintances had the same views like those who trusted the mass mediamost: the opinions in both of the groups split into three almost equal parts.
The opinion of bribe-givers and non-givers over the last five yearsabout the level of corruption in Lithuania as compared to Central andEastern European countries and the CIS is the same. However, thosewho have not given a bribe more often than bribe-givers could not statetheir opinion concerning the issue. Comparison of the situation in Lithua-nia and other Western states shows that those who have personal bribe-giving experience are more categorical about the issue: they tend to thinkmore often than those who have not given a bribe that corruption is morewidespread in Lithuania than in other Western countries.
Table 2.1.11. DO YOU THINK CORRUPTION IN LITHUANIA, AS COM-PARED TO THE OTHER COUNTRIES, IS SMALLER, BIGGER OR THESAME? (%)
Year 2001 2002 2004
Have Have Have Have Have Havenot given given not given given not given givena bribe a bribe a bribe a bribe a bribe a bribe
As compared with Western countries:Smaller in Lithuania 12 8 9 8 6 7The same 21 21 18 20 25 24Bigger in Lithuania 37 52 42 58 40 48Has no opinion 30 19 31 14 29 21
As compared with Central and Eastern European states:Smaller in Lithuania 9 9 10 10 9 7The same 38 43 32 37 34 43Bigger in Lithuania 18 22 23 34 25 24Has no opinion 36 26 35 19 32 26
As compared with the CIS countries:Smaller in Lithuania 28 29 23 22 19 24The same 24 27 25 32 28 31Bigger in Lithuania 11 15 16 25 16 17Has no opinion 37 29 36 21 38 28
The assessment of any processes taking place in the country hugelydepends on the concrete situation during which the assessment is made.Admittedly, with the improvement of the economic situation, Lithuanian
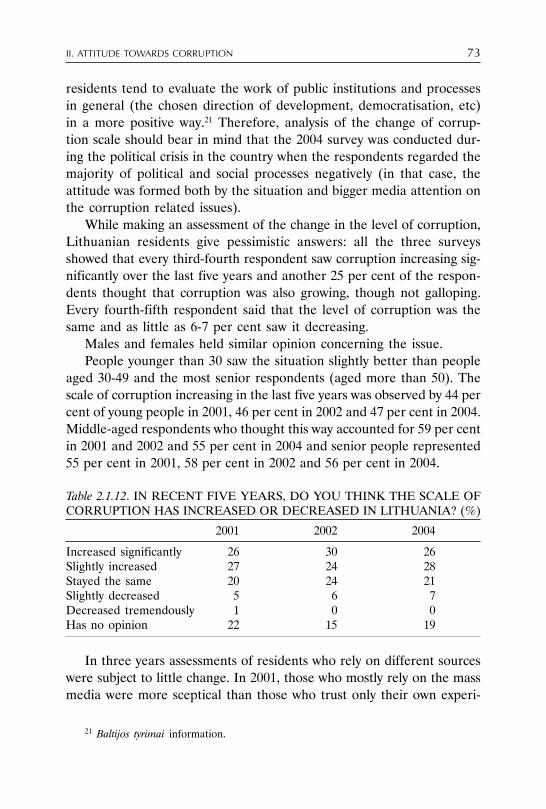
73II. ATTITUDE TOWARDS CORRUPTION
residents tend to evaluate the work of public institutions and processesin general (the chosen direction of development, democratisation, etc)in a more positive way.21 Therefore, analysis of the change of corrup-tion scale should bear in mind that the 2004 survey was conducted dur-ing the political crisis in the country when the respondents regarded themajority of political and social processes negatively (in that case, theattitude was formed both by the situation and bigger media attention onthe corruption related issues).
While making an assessment of the change in the level of corruption,Lithuanian residents give pessimistic answers: all the three surveysshowed that every third-fourth respondent saw corruption increasing sig-nificantly over the last five years and another 25 per cent of the respon-dents thought that corruption was also growing, though not galloping.Every fourth-fifth respondent said that the level of corruption was thesame and as little as 6-7 per cent saw it decreasing.
Males and females held similar opinion concerning the issue.People younger than 30 saw the situation slightly better than people
aged 30-49 and the most senior respondents (aged more than 50). Thescale of corruption increasing in the last five years was observed by 44 percent of young people in 2001, 46 per cent in 2002 and 47 per cent in 2004.Middle-aged respondents who thought this way accounted for 59 per centin 2001 and 2002 and 55 per cent in 2004 and senior people represented55 per cent in 2001, 58 per cent in 2002 and 56 per cent in 2004.
Table 2.1.12. IN RECENT FIVE YEARS, DO YOU THINK THE SCALE OFCORRUPTION HAS INCREASED OR DECREASED IN LITHUANIA? (%)
2001 2002 2004
Increased significantly 26 30 26Slightly increased 27 24 28Stayed the same 20 24 21Slightly decreased 5 6 7Decreased tremendously 1 0 0Has no opinion 22 15 19
In three years assessments of residents who rely on different sourceswere subject to little change. In 2001, those who mostly rely on the massmedia were more sceptical than those who trust only their own experi-
21 Baltijos tyrimai information.

74 II. ATTITUDE TOWARDS CORRUPTION
ence and the experience of their friends and acquaintances. In 2001, 51per cent of those who rely on experience and 58 per cent of those whotrust media saw corruption growing in the country. In 2002, the propor-tion of sceptical responses changed, representing 67 per cent of thosewho rely on experience and 56 per cent of those who rely on the massmedia. In 2004, the number of the two groups thinking similarly ac-counted for the same 52 per cent.
Views about the change of corruption scale depend on the personalexperience of the respondents: bribe-givers have a firmer opinion con-cerning the issue than the respondents who have not given bribes (thelatter group constitutes a higher percentage of people who did not re-spond to the question).
The residents who gave a bribe in the last five years think more fre-quently than those who did not that the scale of corruption is growing.In 2001, the increase of corruption was noted by 49 per cent of thosewho did not give a bribe and 59 per cent of bribe-givers, in 2002 theyaccounted for 49 and 64 per cent respectively and in 2004 they repre-sented 51 and 60 per cent accordingly. The presumption is that real lifeexperience (bribe-giving) helps form a negative attitude towards theoverall scale of corruption in Lithuania.
Table 2.1.13. IN RECENT FIVE YEARS, DO YOU THINK THE SCALE OFCORRUPTION HAS INCREASED OR DECREASED IN LITHUANIA? (%)
Year 2001 2002 2004
Have Have Have Have Have Havenot given given not given given not given givena bribe a bribe a bribe a bribe a bribe a bribe
Increased significantly 23 30 27 37 24 30Slightly increased 26 29 22 27 27 30Stayed the same 22 20 24 23 20 22Slightly decreased 4 6 6 6 7 8Decreased tremendously 1 1 0 0 0 0Has no opinion 24 15 20 7 22 11
Talking about the operation of various institutions the respondentsrely on their own experience, on the experience of their friends andacquaintances as well as the information presented by the mass media.The latter is the main source for those people who have no direct con-tact with the institution concerned. The mass media usually provides

75II. ATTITUDE TOWARDS CORRUPTION
negative information by unveiling scandals of corruption rather thandrawing attention to its incorruptibility. When people have direct con-tact with institutions, they first of all rely on their own negative experi-ence. For example, if a person had to give a bribe to at least one publicofficial of that body, that person would probably tend to think of all thebody being corrupt irrespective of whether further contacts with its staffcorroborates or not his or her presumptions. However, if the persondealing with his or her matters did not face corruption, this does notnecessarily mean that he or she will have a positive opinion about thebody because he or she may rely on the indirect information (providedby other people or the mass media).
The surveys asked the residents to list the institutions which theyconsider the most corrupt.
The findings show (see Table 2.1.14) that the institutions and areasmentioned most frequently were changing their positions. The Govern-ment was mentioned less frequently in 2002 and 2004 than in 2001,whereas the situation in the police is regarded contrary to that. The big-gest change in terms of perceived corruption is observed among medi-cal institutions: in 2001 and 2002, every tenth respondent saw them asthe most corrupt and in 2004, every third respondent thought of themthis way. In 2004, more often than before the local authorities werementioned in the list of the most corrupt institutions in the country.
People younger than 30 more often than more senior respondentsconsider the police as the most corrupt (in 2004, they mentioned thepolice as a corrupt body more often than medical institutions).
Table 2.1.14. WHICH INSTITUTIONS ARE THE MOST CORRUPT? (10 IN-STITUTIONS MOST FREQUENTLY MENTIONED BY THE RESPON-DENTS THEMSELVES) (%)
Year 2001 2002 2004
Medical institutions 12 11 31Customs 18 22 22Police 13 20 22Courts 20 21 21Seimas 12 13 12Local authorities 3 5 8Law enforcement and law & order in general 4 9 7Traffic police 3 2 5Government 13 6 3Tax inspectorate 3 4 2

76 II. ATTITUDE TOWARDS CORRUPTION
People with bribery experience (i.e. those who had given a bribe inthe last five years) are of worse opinion about medical institutions (par-ticularly in 2004), courts and police (2002 and 2004), local authorities(2004) than those who had not given a bribe (see Table 2.1.15).
Table 2.1.15. WHICH INSTITUTIONS ARE THE MOST CORRUPT? (10 IN-STITUTIONS MOST FREQUENTLY MENTIONED BY THE RESPON-DENTS THEMSELVES) (%)
Year 2001 2002 2004
Have Have Have Have Have Havenot given given not given given not given givena bribe a bribe a bribe a bribe a bribe a bribe
Medical institutions 10 17 17 27 24 45Customs 19 16 21 23 21 24Police 10 20 18 24 22 23Courts 19 22 18 28 20 23Seimas 11 16 12 13 12 11Local authorities 4 3 5 5 6 11Law enforcement and law& order in general 4 5 8 9 5 10Traffic police 3 4 2 2 5 6Government 11 16 6 6 4 2Tax inspectorate 3 4 5 4 2 2
Does the source of information play a role in forming the opinion?In 2001, those who relied on the mass media more than the experienceof their friends, acquaintances and their own saw biggest corruption inthe customs, local authorities, tax inspectorate, privatisation services, andthe law enforcement. Whereas those who mostly relied on experienceindicated the police, government, medical institutions and traffic police.
In 2002, the media group, more often than the experience group,mentioned Seimas, government, privatisation service, prisons, privatecompanies, and the President�s office, whereas the experience groupreferred to the courts, police, medical institutions, educational establish-ments and land-use planning bodies.
In 2004, due to the change of the political situation, those who relyon the mass media more than experience mentioned the police, Seimas,President�s office, law & order and prosecution offices. Those who placemore trust in experience saw more corruption in medical institutions, lawenforcement bodies in general and the traffic police in particular.
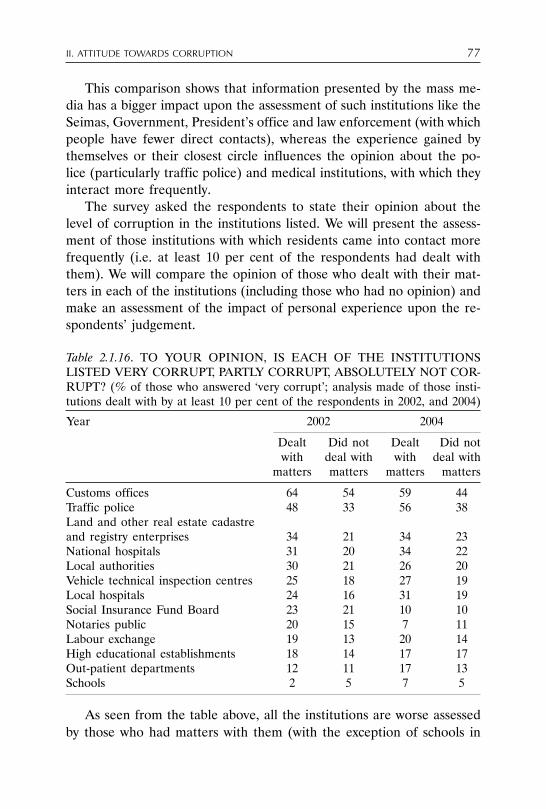
77II. ATTITUDE TOWARDS CORRUPTION
This comparison shows that information presented by the mass me-dia has a bigger impact upon the assessment of such institutions like theSeimas, Government, President�s office and law enforcement (with whichpeople have fewer direct contacts), whereas the experience gained bythemselves or their closest circle influences the opinion about the po-lice (particularly traffic police) and medical institutions, with which theyinteract more frequently.
The survey asked the respondents to state their opinion about thelevel of corruption in the institutions listed. We will present the assess-ment of those institutions with which residents came into contact morefrequently (i.e. at least 10 per cent of the respondents had dealt withthem). We will compare the opinion of those who dealt with their mat-ters in each of the institutions (including those who had no opinion) andmake an assessment of the impact of personal experience upon the re-spondents� judgement.
Table 2.1.16. TO YOUR OPINION, IS EACH OF THE INSTITUTIONSLISTED VERY CORRUPT, PARTLY CORRUPT, ABSOLUTELY NOT COR-RUPT? (% of those who answered �very corrupt�; analysis made of those insti-tutions dealt with by at least 10 per cent of the respondents in 2002, and 2004)
Year 2002 2004
Dealt Did not Dealt Did notwith deal with with deal with
matters matters matters matters
Customs offices 64 54 59 44Traffic police 48 33 56 38Land and other real estate cadastreand registry enterprises 34 21 34 23National hospitals 31 20 34 22Local authorities 30 21 26 20Vehicle technical inspection centres 25 18 27 19Local hospitals 24 16 31 19Social Insurance Fund Board 23 21 10 10Notaries public 20 15 7 11Labour exchange 19 13 20 14High educational establishments 18 14 17 17Out-patient departments 12 11 17 13Schools 2 5 7 5
As seen from the table above, all the institutions are worse assessedby those who had matters with them (with the exception of schools in

78 II. ATTITUDE TOWARDS CORRUPTION
2002 and notaries public in 2004). Thus one could presume that in thiscase a negative opinion is formed on the basis of direct experience ratherthan information provided by the mass media or other intermediaries.
In 2001 and 2002, the majority of the respondents thought that po-litical and administrative corruption was equally widespread in Lithua-nia. However, the 2004 survey differences in the way of thinking: onethird of the respondents continued to think in the same way (i.e. thatadministrative and political corruption were equally rampant), yet thenumber of those who thought of administrative corruption more wide-spread increased from 18 to 28 per cent, and those who regarded politi-cal corruption more rampant grew from 12 to 21 per cent.
The opinion of women and men, as well as various age groups wasthe same. However, people with different income held different views.Residents with higher income thought more often than poorer respon-dents that administrative corruption is more widespread. This type ofcorruption has been also more often indicated by city-dwellers. One ofthe possible reasons for having different opinions about the issue is moreexperience of city-dwellers and better-off residents of dealing with pub-lic officials.
Table 2.1.17. WHICH FORM OF CORRUPTION IS THE MOST WIDE-SPREAD IN LITHUANIA? (%)
2001 2002 2004
Political corruption 10 12 21Administrative corruption 12 18 28Both equally 62 58 34Has no opinion 16 12 16
In 2002, those residents who mostly relied on the mass media thoughtmore often than the group of residents relying on experience that bothforms of corruption are equally rampant (those who trust their experi-ence more than the mass media mentioned political corruption morefrequently). In 2002 and 2004, the former group more often than thelatter mentioned political corruption as a more widespread type of cor-ruption than administrative corruption. Thus the political scandals of2002�04 which were widely covered by the mass media had a majorimpact on the opinion of the group of residents who mostly trust theinformation received from the mass media.

79II. ATTITUDE TOWARDS CORRUPTION
In the period of five years, the opinion of bribe-givers and those whogave no bribes differed: those who had personal bribery experience hada more resolute opinion concerning the matter (they constitute a smallernumber of those who gave no answer). Since 2002 bribe-givers haveconsidered administrative corruption more widespread than those whohave not given bribes.
Table 2.1.18. WHICH FORM OF CORRUPTION IS THE MOST WIDE-SPREAD IN LITHUANIA? (%)
Year 2001 2002 2004
Have Have Have Have Have Havenot given given not given given not given givena bribe a bribe a bribe a bribe a bribe a bribe
Political corruption 11 9 11 14 24 19Administrative corruption 11 17 17 20 24 38Both equally 60 66 55 62 34 34Has no opinion 18 8 17 4 19 9
The assessment of harm done by various forms of corruption wassubject to change in three years. In 2001 and 2002, residents mostly sawpolitical and administrative corruption as equally harmful. In general,political corruption was more frequently mentioned as the most harm-ful. In 2004, the number of those who thought of both corruption formsequally harmful decreased, whereas the number of those who distin-guished one form (particularly administrative corruption) went up. Theopinion change coincides with the change in attitude towards both formsof corruption. As mentioned earlier, the 2004 survey, more often thanthe surveys of previous years, showed administrative corruption devel-oping. In 2004, residents� opinion concerning the matter divided intothree almost equal parts (Table 2.1.19).
Men and women held similar opinions concerning the issue. Middle-aged and senior people more often than the youth thought that bothforms of corruption are equally harmful (in 2004, the response was cho-sen by 30 per cent of residents younger than 30 and 42�43 per cent ofpeople older than 30). Younger people more often than senior residentsmentioned administrative corruption. City-dwellers opted for one formof corruption, whereas residents of smaller towns and rural areas thoughtmore often that both forms of corruption are equally harmful.

80 II. ATTITUDE TOWARDS CORRUPTION
Table 2.1.19. WHICH FORM OF CORRUPTION IS THE MOST HARMFULTO SOCIETY? (%)
2001 2002 2004
Political corruption 15 18 24Administrative corruption 8 8 20Both equally 62 63 39Has no opinion 15 11 17
In 2001 and 2002, the resident groups who rely both on the massmedia and experience saw both forms of corruption as equally harmfulto society. In 2004, the media group indicated political corruption moreoften and the experience group mentioned administrative corruptionmore frequently. Those differences could be explained by the fact thatthe latter group confronts administrative corruption more often, whereasthe mass media unveiling political scandals makes an impact upon theresidents who rely on it as the main source of information.
In 2001 and 2002 those who had given a bribe in five years and thosewho had not treated the damage done by various forms of corruption asequally harmful. However, in 2004 those with personal experience men-tioned administrative corruption more often.
Table 2.1.20. WHICH FORM OF CORRUPTION IS THE MOST HARMFULTO SOCIETY? (%)
Year 2001 2002 2004
Have Have Have Have Have Havenot given given not given given not given givena bribe a bribe a bribe a bribe a bribe a bribe
Political corruption 15 16 18 19 24 26Administrative corruption 8 11 8 9 17 27Both equally 60 64 59 68 41 36Has no opinion 18 9 16 4 19 12
Further we will analyse the opinion of business representatives aboutcorruption, its geographical and institutional spreading.

81II. ATTITUDE TOWARDS CORRUPTION
2.2. LITHUANIAN COMPANY MANAGERS� OPINIONABOUT CORRUPTION
For businessmen, the main source of information is their personalexperience and the experience gained by their friends and acquaintan-ces. The three years during which surveys were conducted saw the re-duction of importance of the national press as the main source of infor-mation about corruption. Television remains to be one of the key sourcesof information but it is not as important to businessmen as it is to com-mon people.
Table 2.2.1. WHICH SOURCE OF INFORMATION ALLOWS YOU TOFORM THE MOST RELIABLE OPINION ABOUT THE SCALE OF COR-RUPTION IN LITHUANIA? (%)
2001 2002 2004
Personal experience 31 24 27National press 27 24 14Experience of friends, acquaintances 22 21 23Television 16 20 22Has no opinion 4 4 4Special publications, reports 3 2 6Radio 2 1 1Local press 1 1 1Seminars, conferences, special events 1 2 2Internet 1 3 1
Similarly to the case of residents, personal experience is the mainsource of information about corruption for those businessmen who havegiven a bribe. To them, information conveyed by the mass media has lessimpact than to those businessmen who have not given bribes. Yet theexperience of friends and acquaintances is equally important both tobribe-givers and those who have not committed bribery (see Table 2.2.2).
The 2001�04 surveys of the Lithuanian Map of Corruption showed thatcontrary to common residents, the opinion of businessmen (companymanagers) about the role of corruption in society was subject to change,i.e. they became more tolerant of this phenomenon. In 2001 and 2002,72 per cent and in 2004, 61 per cent of company managers surveyed saidthat corruption constitutes a major obstacle for business. Furthermore,the number of businessmen who thought that corruption has no impactupon business or facilitates its development grew steadily (from 21 per

82 II. ATTITUDE TOWARDS CORRUPTION
cent in 2001 and 25 per cent in 2002 to 34 per cent in 2004). Notewor-thy, businessmen assessing the negative impact of corruption to theirbusiness show more tolerance than common residents.
Table 2.2.2. WHICH SOURCE OF INFORMATION ALLOWS YOU TOFORM THE MOST RELIABLE OPINION ABOUT THE SCALE OF COR-RUPTION IN LITHUANIA? (%)
Year 2001 2002 2004
Have Have Have Have Have Havenot given given not given given not given givena bribe a bribe a bribe a bribe a bribe a bribe
Television 20 11 24 16 29 14Personal experience 22 47 15 32 19 36National press 30 20 30 19 17 10Friends, acquaintances 21 24 18 23 22 25Radio 3 1 1 1 1 1Local press 1 1 1 0 1 1Special publications, reports 4 1 3 1 6 6Seminars, conferences, specialevents 1 1 2 1 2 2Internet 1 1 3 2 1 1Has no opinion 4 3 4 4 3 5
Table 2.2.3. WHICH OF THOSE STATEMENTS DOES MOSTLY CORRE-SPOND TO YOUR OPINION? (%)
Year 2001 2002 2004
Corruption is a huge obstacle for business 40 38 28
Corruption is more of an obstacle forbusiness 32 34 33
Corruption is neither an obstacle nor afacilitator of business development 17 21 22
Corruption is more of a facilitator ratherthan an obstacle for business development 3 3 9
Corruption facilitates business development 1 1 3
Has no opinion 9 4 5
Those businessmen who had given a bribe in the last five years weremore critical of corruption than those who had not committed bribery,

83II. ATTITUDE TOWARDS CORRUPTION
yet the opinion of the former about corruption was becoming less categori-cal. In 2001, corruption was considered an obstacle by 69 per cent of thosewho had not given a bribe and 74 per cent of bribe-givers, in 2002, theyrepresented for 70 and 73 per cent accordingly and in 2004, they accountedfor 68 and 66 per cent respectively. Corruption was not seen as an ob-stacle by 24 per cent of those businessmen who had not given a bribe and16 per cent of bribers in 2001, then 27 and 23 per cent respectively in 2002and finally by 38 and 31 per cent accordingly in 2004.
Table 2.2.4. WHICH OF THE FOLLOWING STATEMENTS DOES MOSTLYCORRESPOND TO YOUR OPINION? (%)
Year 2001 2002 2004
Have Have Have Have Have Havenot given given not given given not given givena bribe a bribe a bribe a bribe a bribe a bribe
Corruption is a hugeobstacle for business 36 44 34 41 25 31
Corruption is more of anobstacle for business 33 30 36 32 33 35
Corruption is neither anobstacle nor a facilitatorof business development 21 12 23 19 28 16
Corruption is more of afacilitator rather than anobstacle for businessdevelopment 2 4 3 3 7 11
Corruption facilitates businessdevelopment 1 0 1 1 3 4
Has no opinion 9 9 3 4 5 4
Those businessmen who rely on their personal experience and theexperience of their friends and acquaintances and those who trust themass media as the main source of information make similar assessments.In 2001, corruption was considered an obstacle to business by 41 per centof those who rely on experience and 39 per cent of those who trust themass media. In 2002, they made up 37 and 39 per cent respectively andin 2004, they represented 30 and 23 per cent accordingly. In the year

84 II. ATTITUDE TOWARDS CORRUPTION
2004, the opinion of businessmen who rely on the mass media aboutcorruption�s impact on business remained negative, yet slightly less cat-egorical (the number of those who thought of corruption as a majorobstacle decreased and the number of those who considered it an ob-stacle increased).
Consequently, quite a few businessmen, similarly to residents, findthemselves in the cognitive dissonance situation, i.e. they act contraryto what they believe in (that corruption is negative phenomenon). Thisdissonance is more apparent among businessmen than among commonpeople because bribe-givers assess the impact upon business more nega-tively than those who had not given bribes. On the other hand, thechange in attitudes of businessmen during the period of four years fol-lows a different pattern than that of common people. If, due to certainreasons, businessmen have to act contrary to their initial attitude (i.e.by giving a bribe although thinking that corruption damages their busi-ness), they gradually start changing their behaviour rather than attitude.
Similarly to the case of common residents, it is worth analysing theattitudes which the bribe-giving businessmen adopt to justify theirbehaviour.
Such businessmen hold similar opinion to that of common people,emphasising the instrumental characteristic of bribes, i.e. believing thatbribes help solve the problems they face. In two years, the opinion ofbusinessmen did not change: seven company managers out of ten said thatthey believed in the problem-solving power of bribes (see Table 2.2.5).
Table 2.2.5. DOES BRIBE-GIVING HELP SOLVE THE PROBLEMS YOUFACE? (%)
2002 2004
Yes 76 75No 12 22Has no opinion 12 2
The businessmen who have given bribes in the past five years aremore confident than those who lack such experience that bribes helpsolve problems (see Table 2.2.6).
Those who mostly rely on experience more frequently than those whotrust the mass media consider bribes an effective problem-solving tool.

85II. ATTITUDE TOWARDS CORRUPTION
In 2002, such opinion was held by 83 per cent of the first group respon-dents and 71 per cent of the second group businessmen, in 2004, theyrepresented 83 and 66 per cent accordingly. Admittedly, the 2004 sur-vey revealed almost twice the number of the mass media group repre-sentatives (as compared to those who mostly rely on experience) whodo not believe in the ability of bribes to solve problems (32 and 15 percent respectively).
Table 2.2.6. DOES BRIBE-GIVING HELP SOLVE THE PROBLEMS YOUFACE? (%)
Year 2002 2004
Have Have Have Havenot given given not given givena bribe a bribe a bribe a bribe
Yes 61 89 63 90No 19 6 34 9Has no opinion 20 5 3 1
As seen from the responses provided above, businessmen justify theirbehaviour in cognitive dissonance situations by pointing at the instrumen-tal characteristics of bribes. Hence this group exhibits both general andinstrumental aspects of the attitude towards corruption.
The instrumental aspect of the attitude is in accord with the behaviourof businessmen who have bribery experience, hence a conflict betweenthe attitude and behaviour is avoided. On the other hand, while antici-pating the possible changes in the public behaviour in the respective areaone should consider the intentions of the survey participants. In otherwords, when confronted with a corruption situation, will they be willingto behave in line with their generally negative attitude towards corrup-tion or follow its instrumental aspect (when a bribe is seen as an effec-tive problem-solving tool)? The 2001�04 surveys showed that the secondoption is more likely, i.e. businessmen tend to commit bribery becausethey believe in the effectiveness of bribes.
Surveys show that faced with a problem company managers usuallygive a bribe to have it solved. During the period of two years, the num-ber of businessmen who said they would not give a bribe increased, yetthe number of those who would resort to bribery did not decrease(Table 2.2.7).

86 II. ATTITUDE TOWARDS CORRUPTION
Table 2.2.7. WOULD YOU GIVE A BRIBE IF YOU HAD TO SOLVE AVERY IMPORTANT PROBLEM AND A BRIBE WERE EXPECTED FORTHAT? (%)
Year 2002 2004
Yes 63 67No 18 29Has no opinion 19 3
The table above shows the reduction in the number of businessmenhaving no opinion concerning the matter.
Businessmen who consider whether bribe-giving is a worthy practiceusually follow their own experience. Bribe-givers more often that thosewho lack such experience tend to solve the problems important to theircompany by resorting to bribery (see Table 2.2.8).
Table 2.2.8. WOULD YOU GIVE A BRIBE IF YOU HAD TO SOLVE AVERY IMPORTANT PROBLEM AND A BRIBE WERE EXPECTED FORTHAT? (%)
Year 2002 2004
Have Have Have Havenot given given not given givena bribe a bribe a bribe a bribe
Yes 44 81 50 87No 29 9 46 11Has no opinion 27 10 4 3
Admittedly, in two years time the number of those who have no opin-ion about the issue decreased among those businessmen who lack bribe-giving experience. In 2004, this category of businessmen said they wouldnot give a bribe more often than during previous surveys, yet the numberof those who admitted they would resort to bribery did not go down.
Those who rely on the mass media less frequently that those who trustexperience tend to give a bribe to solve problems. In 2002, they repre-sented 57 per cent of the first group and 72 per cent of the second groupbusinessmen, in 2004, they made up 54 and 78 per cent accordingly.
The opinion of businessmen about the scale of corruption in Lithua-nia and other countries remained the same during the three years sur-veyed. They mostly think that corruption is bigger in Lithuania than in

87II. ATTITUDE TOWARDS CORRUPTION
Western countries, the same like in other Central and Eastern Europeanstates and smaller or similar to the CIS.
Table 2.2.9. DO YOU THINK CORRUPTION IN LITHUANIA, AS COM-PARED WITH OTHER COUNTRIES, IS SMALLER, BIGGER, OR THESAME? (%)
Year 2001 2002 2004
As compared with Western countries:Smaller in Lithuania 11 10 9The same 25 23 33Bigger in Lithuania 60 61 51Has no opinion 3 7 7
As compared with Central and Eastern European states:Smaller in Lithuania 13 12 13The same 60 55 58Bigger in Lithuania 22 25 20Has no opinion 6 9 9
As compared with the CIS countries:Smaller in Lithuania 46 38 46The same 38 36 34Bigger in Lithuania 11 17 12Has no opinion 5 9 8
Businessmen who had given bribes in the past five years think moreoften than those who lack such experience that the scale of corruptionin Lithuania is bigger than in Western countries. Non-bribers think morefrequently than bribers that the situation in Lithuania and Western coun-tries corruption-wise is the same. However, both groups predominantlythink that the situation in Lithuania is worse.
While comparing the situation in Lithuania and Central and EasternEuropean countries businessmen who have given a bribe and those whohave not hold similar opinions. Noteworthy, in 2004, those businessmenwho have not given a bribe thought more often than in 2001 and 2002that the situation in Lithuania and Central and Eastern European statesis similar and less frequently that the Lithuanian situation is worse. Theopinion of bribe-givers concerning the issue stayed the same during thosethree years.
While comparing the Lithuanian situation to that of the CIS, bribe-givers think more often than their counterparts without such experiencethat the level of corruption is smaller in Lithuania.

88 II. ATTITUDE TOWARDS CORRUPTION
Table 2.2.10. DO YOU THINK CORRUPTION IN LITHUANIA, AS COM-PARED WITH OTHER COUNTRIES, IS SMALLER, BIGGER, OR THESAME? (%)
Year 2001 2002 2004
Have Have Have Have Have Havenot given given not given given not given givena bribe a bribe a bribe a bribe a bribe a bribe
As compared with Western countries:Smaller in Lithuania 13 7 10 9 10 8The same 28 21 25 21 36 29Bigger in Lithuania 55 70 55 66 46 58Has no opinion 4 2 10 5 8 6
As compared with Central and Eastern European states:Smaller in Lithuania 14 10 10 14 14 11The same 58 63 55 54 60 56Bigger in Lithuania 21 23 24 26 16 26Has no opinion 6 4 12 6 10 8
As compared with the CIS countries:Smaller in Lithuania 42 51 34 42 43 49The same 41 35 39 34 36 32Bigger in Lithuania 11 11 15 18 12 12Has no opinion 6 3 12 6 9 8
In 2001 and 2002, those businessmen who rely on the mass mediaand experience held similar opinions while comparing the situation inLithuania and other countries. In 2004, their opinions differed concern-ing the situation in Lithuania and the CIS. 52 per cent of those who relyon the mass media and 40 per cent of those who trust experience thoughtthat corruption is smaller in Lithuania. 14 per cent of the experiencegroup and 10 per cent of the media group businessmen thought of thesituation in Lithuania corruption-wise worse than in the CIS.
While assessing the change in the scale of corruption, businessmengive similar responses as common residents. Admittedly, the former con-stitutes a smaller number of those who have no opinion and a biggernumber of those who think that the level of corruption remained thesame. Another distinctive character of businessmen is that in 2004 theysaid more often than in 2001 and 2002 that the level of corruption stayedthe same and they thought less frequently that it is increasing (in 2001,the level of corruption was seen increasing by 52 per cent of business-

89II. ATTITUDE TOWARDS CORRUPTION
men, in 2002 and 2004 by 49 and 31 per cent respectively). Table 2.2.11shows that the opinion of businessmen about the scale of corruption inLithuania was steadily improving in three years.
Table 2.2.11. IN RECENT FIVE YEARS, DO YOU THINK THE SCALE OFCORRUPTION HAS INCREASED OR DECREASED IN LITHUANIA? (%)
Year 2001 2002 2004
Increased significantly 25 21 15Slightly increased 27 28 26Stayed the same 32 34 37Slightly decreased 14 15 19Decreased tremendously 1 1 2Has no opinion 1 2 1
Interestingly enough, the opinion of those who have given a bribe andthose who have not changes similarly, taking the same direction in threeyears (see Table 2.2.12).
Table 2.2.12. IN RECENT FIVE YEARS, DO YOU THINK THE SCALE OFCORRUPTION HAS INCREASED OR DECREASED IN LITHUANIA? (%)
Year 2001 2002 2004
Have Have Have Have Have Havenot given given not given given not given givena bribe a bribe a bribe a bribe a bribe a bribe
Increased significantly 23 26 19 23 16 14Slightly increased 28 25 27 28 24 27Stayed the same 33 31 34 34 37 37Slightly decreased 14 15 17 14 18 19Decreased tremendously 1 1 1 0 3 1Has no opinion 1 1 2 1 1 1
In 2004, 40 per cent of businessmen who had given bribes and thosewho had not saw corruption increasing, 37 per cent thought that thesituation stayed the same and 20 per cent said that corruption was re-ducing.
In 2001, corruption growth was spotted by 49 per cent of business-men who rely on experience, in 2002 and 2004 they accounted for 47and 42 per cent respectively. The same trend was noticed by business-men relying on the mass media, representing accordingly 54, 48 and 38

90 II. ATTITUDE TOWARDS CORRUPTION
per cent. Hence in the period of three years the number of those whosaw corruption growing in both groups went down.
Analysis of businessmen�s opinion about the most corrupt institutionsand areas shows that they tend to enumerate the same institutions likecommon residents. Furthermore, their opinion was subject to the samechange like the opinion of residents, i.e. they point at medical institutionsmore often than at the government. However, businessmen see the po-lice and medical institutions less frequently corrupt than ordinary residents.
Table 2.2.13. WHICH INSTITUTIONS ARE THE MOST CORRUPT? (10 in-stitutions most frequently mentioned by the respondents themselves) (%)
2001 2002 2004
Customs 24 29 23Courts, law enforcement 22 20 20Police 10 11 16Seimas 10 19 13Medical institutions 5 6 13Local authorities 7 13 11Tax inspectorate 9 11 11Traffic police 4 4 6Government 9 9 4
Businessmen with bribe-giving experience see more corruption thantheir counterparts who lack such experience in the following institutions:customs (however, with Lithuania becoming an EU member in 2004 itis no longer mentioned as often as during previous years), tax inspec-torate and local authorities.
Businessmen who mostly rely on experience more frequently thantheir counterparts trusting the mass media as the main source of infor-mation mentioned the following institutions: courts, government, taxinspectorate, local authorities, Social Insurance Fund Board, mass me-dia, ministries in 2001, courts, government, tax inspectorate, local authori-ties, Social Insurance Fund Board, traffic police, land-use planning in-stitutions in 2002 and local authorities, food and veterinary services,county administration and police in 2004.
The media group businessmen mentioned the following institutions:police, law enforcement in general, prosecution offices, educational es-tablishments in 2001, Seimas, courts, ministries, medical institutions,privatisation services, President�s office in 2002, and medical institutions,

91II. ATTITUDE TOWARDS CORRUPTION
Seimas, President�s office, traffic police, land-use planning bodies,privatisation services, political parties, public procurement offices, phar-maceutical companies in 2004.
Table 2.2.14. WHICH INSTITUTIONS ARE THE MOST CORRUPT? (10 in-stitutions most frequently mentioned by the respondents themselves) (%)
Year 2001 2002 2004
Have Have Have Have Have Havenot given given not given given not given givena bribe a bribe a bribe a bribe a bribe a bribe
Customs 20 31 26 31 20 26Courts, law enforcement 22 23 20 21 20 20Police 10 12 8 13 15 18Tax inspectorate 8 10 7 15 7 15Medical institutions 6 4 5 7 13 14Local authorities 6 9 10 15 8 14Seimas 8 13 19 19 13 13Traffic police 3 5 3 4 6 7Government 8 12 8 10 4 5
Further we will compare the opinion of businessmen about the levelof corruption in some of the public institutions. We have included thoseinstitutions dealt with by at least one tenth businessman. Does the opin-ion of the latter change from those who have never dealt with theirmatters in such institutions? Table 2.2.15 provides a summary of theresponses provided by those two groups (the percentage is provided ofthose who stated �very corrupt�).
All of those institutions are seen worse by those businessmen who dealtwith their matters in them. Hence, similarly to the case of residents, per-sonal experience in this regard is an important opinion-forming factor.
Similarly to common residents, businessmen changed their opinionabout the spread of various forms of corruption in 2001�04. In 2001 and2002 they thought in the same way like ordinary residents that bothpolitical and administrative forms of corruption are equally widespreadin Lithuania. The 2004 survey revealed a split of their views into threealmost equal parts (like the opinion of residents), where one group re-gards administrative corruption as the most widespread form, anothergroup thinks of administrative and political corruption equally predomi-nant and the third group mentions political corruption more often thanduring the previous two surveys.

92 II. ATTITUDE TOWARDS CORRUPTION
Table 2.2.15. TO YOUR OPINION, IS EACH OF THE INSTITUTIONSLISTED VERY CORRUPT, PARTLY CORRUPT, ABSOLUTELY NOT COR-RUPT? (% of those who answered �very corrupt�; analysis made of those insti-tutions dealt with by at least 10 per cent of the respondents in 2002, and 2004)
Year 2002 2004
Dealt Did not Dealt Did notwith deal with with deal with
matters matters matters matters
Customs units 62 58 61 49
State Food and Veterinary services 40 16 31 16
County courts 36 21 28 22
State Tax Inspectorate 36 31 24 22
Local authorities 35 31 28 25
Non-Food Products� Inspectorate 30 15 25 15
Land and other real estate cadastreand registry companies 29 23 30 23
Vehicle technical inspection centres 28 18 25 17
Public Health Centre 28 17 15 14
State Social Insurance Fund Board 28 21 12 9
Labour inspectorate 19 16 14 13
Fire prevention and rescue service 16 10 7 6
Labour exchange 12 10 12 8
The press 11 8 25 15
Notaries public 11 11 8 8
Statistics department 5 5 3 4
Table 2.2.16. WHICH FORM OF CORRUPTION IS THE MOST WIDE-SPREAD IN LITHUANIA? (%)
Year 2001 2002 2004
Political corruption 11 10 26Administrative corruption 17 17 36Both equally 72 72 35Has no opinion 0 1 3
Bribe-givers tend to think more often than businessmen without suchexperience that administrative corruption is most widespread form of

93II. ATTITUDE TOWARDS CORRUPTION
corruption in Lithuania. In 2004, both groups of businessmen tend tomention administrative corruption more often as a more popular form ofcorruption. Bribe-givers consider the latter predominant (see Table 2.2.17).
Table 2.2.17. WHICH FORM OF CORRUPTION IS THE MOST WIDE-SPREAD IN LITHUANIA? (%)
Year 2001 2002 2004
Have Have Have Have Have Havenot given given not given given not given givena bribe a bribe a bribe a bribe a bribe a bribe
Political corruption 13 7 13 8 28 24Administrative corruption 14 21 13 21 33 41Both equally 72 72 73 72 36 33Has no opinion 1 0 1 0 3 3
In 2001�02, businessmen who rely on the mass media as well as ex-perience held the same opinion about the two forms of corruption equallyrampant, whereas in 2004, they predominantly mentioned administrativecorruption, particularly those who rely on their own experience and theexperience of their friends and acquaintances.
The opinion of businessmen about the damage brought by variousforms of corruption was subject to the same change like the opinion ofresidents. In 2001 and 2002, they mostly said that both political andadministrative forms of corruption are equally harmful and in 2004, theypoint at either political or administrative corruption as more widespread.
Table 2.2.18. WHICH FORM OF CORRUPTION IS THE MOST HARMFULTO SOCIETY? (%)
Year 2001 2002 2004
Political corruption 16 17 29Administrative corruption 16 13 24Both equally 67 70 42Has no opinion 1 1 6
The opinion of bribe-givers of those who had not given bribes about thedamage brought by various forms of corruption experienced similarchanges. In 2004, both of the groups mentioned political and administra-tive corruption. The first group thinks of the damage caused by both ofthese forms of corruption as equal less frequently than the latter (see Table2.2.19).

94 II. ATTITUDE TOWARDS CORRUPTION
Table 2.2.19. WHICH FORM OF CORRUPTION IS THE MOST HARMFULTO SOCIETY? (%)
Year 2001 2002 2004
Have Have Have Have Have Havenot given given not given given not given givena bribe a bribe a bribe a bribe a bribe a bribe
Political corruption 18 13 18 16 28 30Administrative corruption 16 17 10 15 22 26Both equally 65 70 71 68 45 38Has no opinion 1 0 1 0 5 6
In 2001�02, the businessmen who rely mostly on the mass media andthose who trust experience considered both of these forms of corrup-tion as equally harmful. In 2004, they started to single out one form outof those two, yet holding different views.
Analysis of the three survey findings showed that both common resi-dents and businessmen experience cognitive dissonance with respect tocorruption. Although having a negative attitude towards corruption, themajority of them tend to give a bribe in certain situations because it isregarded a reliable tool of solving problems (both of personal and busi-ness nature). On the other hand, the respondents try to bring into ac-cord the conflicting attitudes by refusing to assume responsibility forgiving a bribe and placing it on the bribe-taker or an institution the staffof which they deal with. Although they themselves resort to bribery as atool of solving problems, residents and businessmen consider the major-ity of institutions corrupt.
Attitude towards corruption are formed both on the basis of infor-mation provided by the mass media and the personal experience ofpeople �with authority�. Once an individual himself or herself experiencescorruption in an institution or heard about it experienced by others, heor she will tend to consider it corrupt and have a negative opinion aboutit. On the other hand, analysis of personal experience of having relationswith and solving issues in various institutions shows the importance ofpersonal experience gained by various resident groups in forming a nega-tive opinion about such institutions as well as the role played by theindirectly obtained information. (In the latter case, when the opinionabout the level of corruption in a certain institution is worse that theactual experience, one could point out at the weak public relations func-tion performed by the appropriate institution).

95II. ATTITUDE TOWARDS CORRUPTION
III. ANTI-CORRUPTION POTENTIAL
Corruption is a complex phenomenon, comprising economic, politi-cal, legal and moral issues; therefore, it would be wrong to suggest thatthe fight against corruption is feasible by resorting to criminal prosecu-tion alone. As mentioned before, the roots of corruption lie in the con-flict of public and privates interests and a just decision depends both onmoral features of the participants of the conflict and compliance withthe existing legal norms. Reference to criminal justice is the last resortwhen the other ways of curbing corruption prove to fail.
Unfortunately, the Lithuanian public discourse usually considers anti-corruption initiatives too narrowly, i.e. only in the light of criminal jus-tice. Citizens angry with the rampant public corruption demand, on theone hand, that corrupt public officials and civil servants should be sub-ject to more frequent and stricter punishment and, on the other hand,that law enforcement institutions fighting corruption should be givenmore powers. The advocates of such anti-corruption methods are con-vinced that strict punishment of corrupt public officials is intimidatingand may deter potential corruptors from illicit actions. Without gettingtoo much involved in a discussion about the role played by strict pun-ishment and criminal justice in reducing the number of crimes (includ-ing corruption)22, we will focus on two circumstances related to the cur-rent criminal rhetoric.
First, talking about criminal offences or crimes, a reference is usu-ally made to one party: an illicit service provider who has an institutionalor personal interest. There is hardly any mentioning of the second in-terested party, i.e. a person who seeks solution of an issue with speeded-up decision-making or evasion of laws. Seeking positive results, favour-able or personally beneficial to service providers decision-making is an
22 Modern criminology, and its critical part in particular, harbours serious doubts aboutits effectiveness (e.g., see N. Christie. Nusikaltimø kontrolë kaip pramonë. Vilnius, 1999).

96 III. ANTI-CORRUPTION POTENTIAL
art of corrupt �dealings�. In that case, the mode of behaviour by mem-bers of the public depends not only on the rules dictated by the service-providers but also on the public consideration of laws and moral values.
Second, corruption offences and crimes is a problem faced not onlyby the countries subject to major changes but also by the states main-taining old traditions of democracy. Recently, those states have initiatedadoption of a number of legal instruments which contain statementsfavouring strict mechanisms of corruption control (including criminalones). These states also have huge practical experience of forestallingcorruption. It is no coincidence that when joining the European UnionLithuania was urged, apart from stricter anti-corruption criminal mea-sures, to develop corruption prevention programmes including a widerspectrum than just criminal law provisions.23
Prevention of corruption in Lithuania is not a new area of activity;however, systematic attempts have been taken only in recent years. In1999, the Government of the Republic of Lithuania adopted a pro-gramme Concerning Prevention of Organised Crime and Corruption. On28 May 2002, the Seimas adopted the Law on Prevention of Corruption.The law defines corruption prevention as detection and elimination of thecauses and conditions of corruption through the development and imple-mentation of a system of appropriate measures as well as deterrence ofpersons from the commission of crimes of corruption.24
The law lays down the following key tasks of corruption prevention:� disclosure and elimination of the contributing factors and condi-
tions of corruption;� deterrence of persons from the commission of crimes of corruption;� securing a workable and effective legal regulation of corruption
prevention;� setting up of an adequate and effective mechanism of organisa-
tion, implementation, oversight and control of corruption preven-tion through legal, institutional, economic and social measures;
� involvement of the public and public organisations in the preven-tion of corruption;
23 A detailed description of the process is provided in the following publication: Moni-toring the EU Accession Process: Corruption and Anti-corruption Policy. Budapest: OSI, 2002.
24 Republic of Lithuania Law on Prevention of Corruption, 28 May 2002, No. IX-904.Official Gazette: 2003, No. 38-1728.

97III. ANTI-CORRUPTION POTENTIAL
� promotion of transparency and openness in the provision of pub-lic services.25
During the same year, in 2002, the Lithuanian Parliament adoptedthe National Anti-Corruption Programme which, among other things,highlights corruption prevention: reduction of political and administra-tive corruption, public involvement in the fight against corruption, anti-corruption education of the public and mass media.26
Yet headway in the area of anti-corruption can be achieved only byjoint agreement of the state and its citizens. Anti-corruption measuresapplicable on a state level could be effective and practically enforceable;yet without a determined position against corruption showed by citizens,the mechanism of control and prevention cannot be fully put into effect.
Bearing the latter in mind, it is worth remembering the thoughts ofLithuanian people prior to the adoption of the National Anti-Corrup-tion Programme. In 2000, Transparency International Lithuanian Chap-ter initiated a survey Does Lithuania want Political Transparency?27 Rightafter parliamentary elections Lithuanian residents were interviewed aboutthe contribution of political parties to the fight against corruption andeffectiveness of potential anti-corruption methods.
Lithuanian people were given a list of political parties registered inLithuania and asked to choose from it a political party which they thinkpays attention to the fight against corruption.
Right after the elections more than one third of the respondents couldnot identify a single party which they thought took anti-corruption ef-forts. Every third respondent expressed his general disappointment withpolitical parties. That was a clear signal that Lithuanian people do nottrust political parties and are sceptical about the contribution of the lat-ter to the fight against corruption.
The survey also asked Lithuanian people about the most effectivemeasures against corruption and they pointed at stricter criminal liabil-ity for corruption crimes, publicity and stricter administrative control.Survey participants were the most sceptical about such corruption pre-
25 Ibid.26 LR Seimas Resolution concerning the Approval of the National Anti-Corruption
Programme. 17 January 2002. No. IX-711 // Official Gazette, 2002, No. 10-355.27 On 8-14 December 2000, the survey was conducted by a joint venture of Lithua-
nia and Great Britain, Baltijos tyrimai. The survey findings are available at the website ofTransparency International Lithuanian Chapter, www.transparency.lt.

98 III. ANTI-CORRUPTION POTENTIAL
vention measures like civil servants� training and initiatives of civil soci-ety and non-governmental organisations.
The 2001�04 survey Lithuanian Map of Corruption continued analysingsocial assessment of anti-corruption efforts. It looked at the anti-corrup-tion potential of residents and business representatives.
3.1. ANTI-CORRUPTION POTENTIALOF LITHUANIAN RESIDENTS
The Survey findings discussed in Chapter I and II of this book showthat Lithuanian people despise corruption, yet they are inclined to payunofficially in the future to resolve an important issue. It seems thatLithuanian residents realise the threat of corruption as an evil, clearlyexpress their opinion about the issue and are not willing to tolerate it, yet,talking about specific circumstances relevant to the person concerned thegeneral disposition against corruption is forgotten. Behaviour is shapedpursuing own interests, even before the problem occurs, i.e. unofficialpayment is offered by foreseeing the events, i. e. before problem-solvingcomes to a standstill at some stage. Hence the question is whether anymajor changes are possible in a society with �double� thinking and whosebehaviour follows such thinking. In other words, anti-corruption initiativesin Lithuania: are they solely a concern for the Government or could theyattract public support and active involvement of their members?
Presently, discussions are less focused on the necessity of having an in-stitutional anti-corruption network. Their emphasis is on the effectivenessof criminal and prevention measures against corruption and the role ofresidents as a constituent part of corruption prevention system. With a viewto assessing the anti-corruption potential of Lithuanian people, analysisshould be made of their opinion about state policy concerning the matterand corruption control and prevention measures applied by the state.
In 2001, Lithuanian residents were asked a question about the mosteffective measures helping to reduce corruption (see Table 3.1.1).
The respondents thought that the most effective anti-corruptionmeasure is stricter punishment (28 per cent). This answer was most fre-quently chosen by men, also residents aged 50�60, with medium andhigher than average household monthly income, city-dwellers. This anti-corruption measure was seen as the least attractive by people youngerthan 30, with the smallest income and rural residents.

99III. ANTI-CORRUPTION POTENTIAL
Table 3.1.1. WHAT CORRUPTION REDUCTION MEASURES YOU THINKWOULD BE THE MOST EFFECTIVE? (%)
Year 2001
Stricter punishment 28Doesn�t know 27Increasing the standard of living, reduction of unemployment 13Stricter accountability and control 12Administrative sanctions, dismissal from work 11Improvement of law-making 7Impossible to change 7Strengthening moral values 6Publicity 5
Admittedly, every third respondent could not specify a single effec-tive anti-corruption measure, yet the majority had a clearly negative dis-position towards corruption. What type of residents have such disposi-tion? The majority constitute women, younger than 20, having the low-est income, residents of villages or small towns.
13 per cent of the respondents thought that corruption is closely re-lated to the standard of living in the state: the lower the standard of livingand the higher the rate of unemployment, the more favourable condi-tions for the spread of corruption. The necessity to raise the standardof living as an effective corruption reduction effort was mentioned bywomen, middle-aged people, the most well-off and city-dwellers.
Stricter accountability and control as a measure against corruptionwas mostly chosen by residents aged 40�50, with medium and higher thanaverage household monthly income, city-dwellers.
Administrative sanctions were mostly mentioned by people aged 60and more.
Bearing in mind, that in 2001, more than one third of Lithuanianresidents had bribe-giving experience, it is worth analysing whether opin-ion about anti-corruption measures differs between those who have givena bribe and those who have not.
The measures against corruption suggested by those two groups in2001 are included in Table 3.1.2.
Both those who had bribe-giving experience in last five years andthose who did not indicated stricter punishment as the most effective anti-corruption measure. The two groups also hold similar opinion concern-ing the other measures listed. The only difference is that a slightly big-

100 III. ANTI-CORRUPTION POTENTIAL
ger number of people without bribery experience had no opinion abouteffective corruption reduction measures.
Table 3.1.2. WHAT CORRUPTION REDUCTION MEASURES YOU THINKWOULD BE THE MOST EFFECTIVE? (% in 2001 of non bribe-givers N=558,bribe-givers N=371)
Year 2001 2001
The most effective corruption reduction Have not Have givenmeasures are the following: given a bribe a bribe
Stricter punishment 27 29Doesn�t know 29 22Increasing the standard of living,reduction of unemployment 12 17Stricter accountability and control 12 13Administrative sanctions, dismissal from work 10 13Improvement of law-making 6 8Impossible to change 7 6Strengthening moral values 6 6Publicity 7 3
On 17 January 2002, the Seimas of the Republic of Lithuania adoptedResolution No. IX-711 approving the National Anti-Corruption Pro-gramme. The task of co-ordination was given to the Special Investiga-tion Service. The programme was developed with contribution of themost famous Western and Lithuanian experts in the area. One of thekey features of the programme is particularly attention to corruptionprevention efforts. The programme was widely discussed by the massmedia. Prevention was presented as a constituent part of anti-corruptionefforts, where the role of civic initiative is of paramount importance.
In 2002 and 2004, Lithuanian residents were once again asked aboutthe most effective measures of tackling corruption. Questions about theeffectiveness of anti-corruption measures were adjusted according to theNational Anti-Corruption Programme. The 2002 and 2004 survey find-ings show the change in the opinion about effective anti-corruptionmeasures (see Table 3.1.3).
In 2002 and 2004, as compared with 2001, the opinion of Lithuanianpeople about stricter punishment remained the same. Survey respondentsthought that introduction of stricter court punishment for corruption is themost effective measure reducing its level (45 and 49 per cent respec-tively). In 2002, this measure was predominantly mentioned by women,

101III. ANTI-CORRUPTION POTENTIAL
residents aged 50 and more, living in cities. In 2004, this measure wasmostly chosen by men living in big towns. This view was most frequentlyheld by people living in Utena and Kaunas counties.
Table 3.1.3. WHAT CORRUPTION REDUCTION MEASURES WOULD BETHE MOST EFFECTIVE? (%)
The most effective corruption reduction measuresare the following: 2002 2004
Introduction of stricter court punishment for corruption,adoption of stricter laws 45 49
Prohibition for public officials who committed an offenceto work in state bodies 39 47
Introduction of stricter administrative sanctions, increaseof fines, dismissal from work 38 47
Improvement of anti-corruption legislation 36 39
More publicity in the mass media 21 25
Better operation of special services 19 24
Background checks of public officials, monitoringtransparency of their family property 18 29
More active public support, having residents reportabout bribery 17 20
The problem will get solved by itself with the standardof living increasing in the country 17 15
Public awareness raising, educational measures 13 15
Aiming at public officials having less control over variousspheres of life 12 11
Increase remuneration for public officials to make themappreciate more their employment 4 5
The second place is taken by the prohibition for public officials whocommitted an offence to work in public institutions. In 2002, this measurewas mentioned by four out of ten respondents and in 2004, it becameacceptable to every second respondent. In 2002, this measure was mostlychosen by women and city-dwellers and in 2004, it was more favouredby men, middle-aged people and city-dwellers. This measure is believedto be most effective by Telðiai, Kaunas and Klaipëda county residents.

102 III. ANTI-CORRUPTION POTENTIAL
The third most effective measure against corruption in 2002 and 2004was considered introduction of stricter administrative sanctions, increase offines and dismissal from work (by 38 and 47 per cent respectively). In2002, this measure was more favoured by people older than 30, living inbig cities and towns. In 2004, it was mentioned by residents with me-dium income and living in rural areas.
The fourth place goes for the improvement of anti-corruption legisla-tion (36 per cent in 2002 and 39 per cent in 2004). In 2002, this mea-sure was chosen by city-dwellers and in 2004, it was favoured by peoplewith higher than average household monthly income and city-dwellers.
In 2002 and 2004, more publicity in the mass media is regarded thefifth most effective anti-corruption measure (21 and 25 per cent respec-tively). In 2002, this measure was mentioned by people older than 30,living in towns and cities. In 2004, it was more acceptable to city-dwell-ers younger than 30 and older than 50.
19 per cent of the respondents in 2002 and 24 per cent in 2004 thoughtthat better operation of special investigation services could ensure moreeffective fight against corruption. In 2002, this measure was mentionedby people younger than 50, having higher than the smallest householdmonthly income and city-dwellers. In 2004, this measure was believed tobe effective by people with medium income and city-dwellers.
In 2002, 18 per cent of the respondents were in favour of backgroundchecks of public officials and monitoring of their family property trans-parency. This measure was mostly chosen by people older than 50, re-ceiving smaller than the biggest household monthly income and residentsof small towns. In 2004, the number of residents who thought this wayincreased significantly (reaching 29 per cent). It became acceptable topeople older than 30 with smaller than the biggest household familyincome and residents of cities and big towns.
In 2002, as few as 17 per cent of Lithuanian people thought thatactive public support is necessary. This was stated more often by peopleyounger than 30 and older than 50, and city-dwellers. In 2004, the num-ber of people who believed in this measure increased to 20 per cent. Theimportance of public support was emphasised by people with the big-gest household monthly income and city-dwellers.
In 2002, 17 per cent of the respondents believed that the problem ofcorruption may be solved by increasing the standard of living. Such re-spondents comprised people younger than 30, with the smallest income,
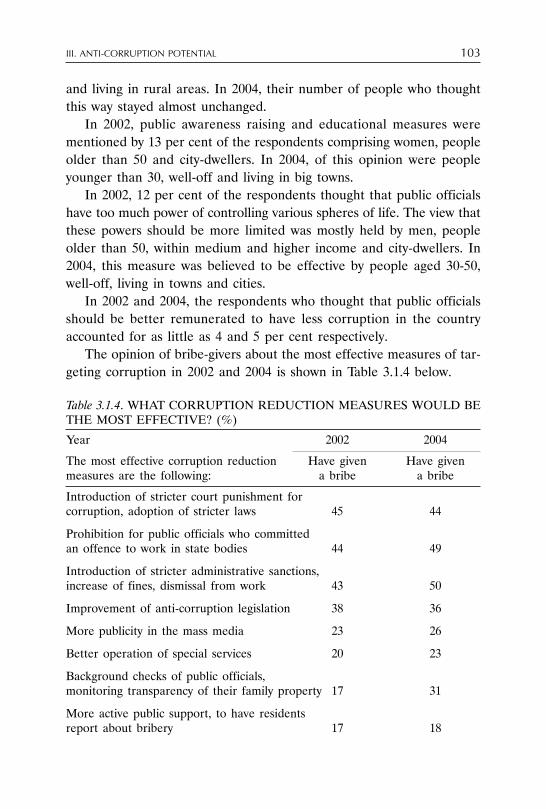
103III. ANTI-CORRUPTION POTENTIAL
and living in rural areas. In 2004, their number of people who thoughtthis way stayed almost unchanged.
In 2002, public awareness raising and educational measures werementioned by 13 per cent of the respondents comprising women, peopleolder than 50 and city-dwellers. In 2004, of this opinion were peopleyounger than 30, well-off and living in big towns.
In 2002, 12 per cent of the respondents thought that public officialshave too much power of controlling various spheres of life. The view thatthese powers should be more limited was mostly held by men, peopleolder than 50, within medium and higher income and city-dwellers. In2004, this measure was believed to be effective by people aged 30-50,well-off, living in towns and cities.
In 2002 and 2004, the respondents who thought that public officialsshould be better remunerated to have less corruption in the countryaccounted for as little as 4 and 5 per cent respectively.
The opinion of bribe-givers about the most effective measures of tar-geting corruption in 2002 and 2004 is shown in Table 3.1.4 below.
Table 3.1.4. WHAT CORRUPTION REDUCTION MEASURES WOULD BETHE MOST EFFECTIVE? (%)
Year 2002 2004
The most effective corruption reduction Have given Have givenmeasures are the following: a bribe a bribe
Introduction of stricter court punishment forcorruption, adoption of stricter laws 45 44
Prohibition for public officials who committedan offence to work in state bodies 44 49
Introduction of stricter administrative sanctions,increase of fines, dismissal from work 43 50
Improvement of anti-corruption legislation 38 36
More publicity in the mass media 23 26
Better operation of special services 20 23
Background checks of public officials,monitoring transparency of their family property 17 31
More active public support, to have residentsreport about bribery 17 18

104 III. ANTI-CORRUPTION POTENTIAL
Table 3.1.4 contined
Year 2002 2004
The most effective corruption reduction Have given Have givenmeasures are the following: a bribe a bribe
The problem will get solved by itself withthe standard of living increasing in the country 19 20
Public awareness raising, educational measures 15 17
Aiming at public officials having less controlover various spheres of life 15 13
Increase remuneration for public officials tomake them appreciate more their employment 7 7
In 2002, those who have experience of giving a bribe in the last fiveyears mentioned that the most effective anti-corruption measures arestricter punishment, prohibition to corrupt public officials to work inpublic bodies and stricter administrative sanctions.
Whereas in 2004, every second respondent who had given a bribe inthe last five years was in favour of the introduction of stricter adminis-trative sanctions. Their second choice was prohibition for corruptionpublic officials to work in state institutions and the third one was strictercourt punishment.
Admittedly, in 2004, every third respondent with bribery experiencethought that background checks of public officials and monitoring trans-parency of their family property is a very effective anti-corruption measure.In 2002, those who held the view accounted for as little as 17 per cent.
The opinion of those who denied giving a bribe about the most ef-fective anti-corruption measures in 2002 and 2004 is provided in Table3.1.5 below.
The opinion of bribe-givers in 2004 was far more stricter than in2002. The majority of the respondents in 2004 favoured stricter courtpunishment (52 per cent as compared with 45 per cent in 2002), prohi-bition for corrupt public officials to work in state institutions (45 percent, and 35 per cent in 2002), introduction of stricter administrativesanctions (45 per cent, and 35 per cent in 2002), improvement of anti-corruption legislation (40 per cent, and 34 per cent in 2002), backgroundchecks of public officials and monitoring transparency of their family

105III. ANTI-CORRUPTION POTENTIAL
property (29 per cent, and 19 per cent in 2002), better operation ofspecial services (25 per cent, and 19 per cent in 2002), more publicityin the mass media (24 per cent, and 20 per cent in 2002), more activepublic support (20 per cent, and 17 per cent in 2002) and public aware-ness raising (15 per cent, and 12 per cent in 2002). However, the year2004 saw the decreasing number of those who believe that the problemwill get solved by itself with the overall standard of living increasing inthe country (13 per cent in 2004 and 16 per cent in 2002).
Table 3.1.5. WHICH CORRUPTION REDUCTION MEASURES YOU THINKWOULD BE THE MOST EFFECTIVE? (% of those who did give a bribe in2002 N=624, gave a bribe N=386, did not give a bribe in 2004 N=571, gave abribe N=372)
Year 2002 2004
The most effective corruption reduction Have not given Have not givenmeasures are the following: a bribe a bribe
Introduction of stricter court punishmentfor corruption, adoption of stricter laws 45 52
Prohibition for public officials who committedan offence to work in state bodies 35 45
Introduction of stricter administrative sanctions,increase of fines, dismissal from work 35 45
Improvement of anti-corruption legislation 34 40
More publicity in the mass media 20 24
Better operation of special services 19 25
Background checks of public officials,monitoring transparency of their family property 19 29
More active public support to havethe public report about bribes 17 20
The problem will get solved by itself with thestandard of living increasing in the country 16 13
Public awareness raising, educational measures 12 15
Aiming at public officials having less controlover various spheres of life 10 9
Increase remuneration for public officials tomake them appreciate more their employment 2 4
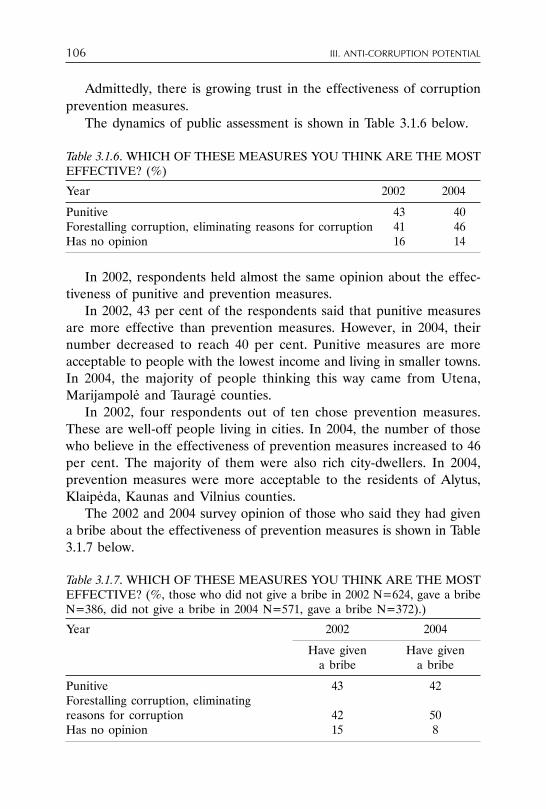
106 III. ANTI-CORRUPTION POTENTIAL
Admittedly, there is growing trust in the effectiveness of corruptionprevention measures.
The dynamics of public assessment is shown in Table 3.1.6 below.
Table 3.1.6. WHICH OF THESE MEASURES YOU THINK ARE THE MOSTEFFECTIVE? (%)
Year 2002 2004
Punitive 43 40Forestalling corruption, eliminating reasons for corruption 41 46Has no opinion 16 14
In 2002, respondents held almost the same opinion about the effec-tiveness of punitive and prevention measures.
In 2002, 43 per cent of the respondents said that punitive measuresare more effective than prevention measures. However, in 2004, theirnumber decreased to reach 40 per cent. Punitive measures are moreacceptable to people with the lowest income and living in smaller towns.In 2004, the majority of people thinking this way came from Utena,Marijampolë and Tauragë counties.
In 2002, four respondents out of ten chose prevention measures.These are well-off people living in cities. In 2004, the number of thosewho believe in the effectiveness of prevention measures increased to 46per cent. The majority of them were also rich city-dwellers. In 2004,prevention measures were more acceptable to the residents of Alytus,Klaipëda, Kaunas and Vilnius counties.
The 2002 and 2004 survey opinion of those who said they had givena bribe about the effectiveness of prevention measures is shown in Table3.1.7 below.
Table 3.1.7. WHICH OF THESE MEASURES YOU THINK ARE THE MOSTEFFECTIVE? (%, those who did not give a bribe in 2002 N=624, gave a bribeN=386, did not give a bribe in 2004 N=571, gave a bribe N=372).)
Year 2002 2004
Have given Have givena bribe a bribe
Punitive 43 42Forestalling corruption, eliminatingreasons for corruption 42 50Has no opinion 15 8

107III. ANTI-CORRUPTION POTENTIAL
The opinion of the respondents with bribe-giving experience was alsosubject to change. In 2002, almost the same number of them preferredpunitive measures as those who favoured prevention measures, whereasin 2004, every second respondent said that elimination of reasons forcorruption is a more effective way of reducing corruption.
The 2002 and 2004 survey opinion of those who had no bribe-givingexperience about the effectiveness of prevention measures is shown inTable 3.1.8 below.
Table 3.1.8. WHICH OF THESE MEASURES YOU THINK ARE THE MOSTEFFECTIVE? (%)
Year 2002 2004
Have not given Have not givena bribe a bribe
Punitive 43 39Forestalling corruption, eliminatingreasons for corruption 40 44Has no opinion 17 17
Residents without bribe-giving experience became �milder� in theperiod of 2002-04. In 2002, those who favoured punitive measures out-numbered those who believed stronger in prevention measures and in2004, the priority was given to prevention measures eliminating the rootsof corruption.
The assessment of anti-corruption measures is closely related to publictrust in state institutions, including specialised services, directly in chargeof corruption control and prevention. The surveys reveal that Lithuanianpeople do not show big trust in state institutions.
A pessimistic attitude of Lithuanian people towards reduction ofcorruption in the country is also seen from the 2004 assessment of op-eration of state and specialised institutions in Table 3.1.9.
In 2004, the absolute majority of the respondents considered anti-corruption efforts taken by the institutions listed as ineffective.
The worst assessment (the difference between �effectively� and �inef-fectively�) was that of the Seimas (-69), Government (-58) and President�soffice (-55). A slightly more positive attitude was held of the State Se-curity Department (-28), Financial Crime Investigation Service (-29) andSpecial Investigation Service (-33).

108 III. ANTI-CORRUPTION POTENTIAL
Table 3.1.9. SPEAKING ABOUT EACH OF THOSE INSTITUTIONS INDI-VIDUALLY, HOW EFFECTIVE ARE THEY IN REDUCING CORRUP-TION IN LITHUANIA? (%).
Effec- Ineffec- N/Stively tively
President�s Office 14 69 17Seimas 8 77 15Government 13 71 16Special Investigation Service 23 56 21State Security Department 24 52 24Financial Crime Investigation Service 23 52 25Non-governmental organisations 12 44 44
Those who regard performance of the State Security Department andSpecial Investigation Service effective mostly constitute residents withmedium and the biggest household monthly income and city-dwellers.
The Financial Crime Investigation Service was seen as effective bypeople younger than 30, with medium household monthly income, andliving in cities.
As mentioned in Chapter I, almost two thirds of the 2004 surveyrespondents had not given bribes in the last five years and 73 per centof people had not given a bribe in the last twelve months. What is theirmotive against giving a bribe?
The respondents were given a list of reasons and were asked to ex-plain the motives of their behaviour.
The main reasons for not giving a bribe in the last five years areshown in Table 3.1.10 below.
Table 3.1.10. WHY DIDN�T YOU GIVE A BRIBE? (% of those who did notgive a bribe in 2002; N =624, 2004 m. - N = 571)
Year 2002 2004
I have never confronted a bribe demanding situation 48 38So far I have managed to solve all the issues without
giving a bribe 0 27I had no money for that 24 16That is against my principles 12 12I didn�t believe it can help solve my problem 8 8I don�t know how to behave in such situations 7 7In that case I would violate the law 4 3Not stated 12 11

109III. ANTI-CORRUPTION POTENTIAL
The reason mentioned most frequently (by 38 per cent of the respon-dents) for not giving a bribe is the very situation when a bribe is notdemanded. Bribe demands were not encountered by people younger than30, the well-off, as well as residents of rural areas and big towns.
27 per cent of the respondents managed to solve their problems with-out bribes. This group of the respondents could be considered the �net�anti-corruption potential. In the last five years problems were solvedwithout resorting to bribery by people older than 30, with medium in-come and living in big cities.
The third most popular reason for not giving a bribe was the lack ofmoney (16 per cent). This reason was mostly mentioned by women,people older than 30, having the smallest income and living in towns.
12 per cent of the respondents did not give a bribe in the last fiveyears because that was against their principles. This was mentioned bywomen, people older than 50, having smaller and medium householdmonthly income and city-dwellers.
8 per cent of the respondents do not believe that a bribe can solvetheir problem.
7 per cent of non bribe-givers simply do not know how to behave inbribe-demanding situations.
As little as 3 per cent of those who did not give a bribe in the lastfive years said this is a violation of law.
As illustrated in Chapter II, the opinion of Lithuanian people is of-ten formed by the mass media as the main source of information. Bear-ing this in mind, it is worth analysing the degree at which informationabout prevention measures applied in this country reaches Lithuanianpeople.
First systematic anti-corruption efforts were taken several years agoin Lithuania and relate to the aforementioned National Anti-CorruptionProgramme adopted by the Seimas of the Republic of Lithuania. Sinceit was adopted only in 2002, questions about its assessment and knowl-edge about it among the members of society was included only in thesurveys of 2002 and 2004.
The level of knowledge about the programme among the membersof Lithuanian society is shown in Table 3.1.11 below.
In 2002, every third respondent of the survey had heard about theNational Anti-Corruption Programme. The most knowledgeable were thewell-off and living in big towns of Lithuania.

110 III. ANTI-CORRUPTION POTENTIAL
Table 3.1.11. HAVE YOU HEARD ABOUT THE NATIONAL ANTI-COR-RUPTION PROGRAMME ADOPTED BY THE SEIMAS? (%)
2002 2004
Heard 31 35Have not heard 63 61Not stated 6 4
In 2004, the number of people who heard about the programme in-creased by 4 percentage points. The most knowledgeable group concern-ing the issue is the most active group of the public, those who are aged30�50, well-off and city-dwellers.
In 2002�04, one third of the survey participants admitted that theyhad never heard about the National Anti-Corruption Programme. Thesewere mostly rural residents. In 2004, such response was given by peopleyounger than 30 and having the smallest income.
In 2004, those who were more informed about the National Anti-Corruption Programme were respondents from Utena, Telðiai and Vilniuscounties, and those who knew less were from Marijampolë, Ðiauliai andAlytus counties.
The level of information possessed by the residents does not alwaysimply their positive attitude towards the subject of such information.Hence it is worth analysing the opinion of the public towards the effec-tiveness of the National Anti-Corruption Programme in reducing the levelof corruption in the country.
The dynamics of the change of assessing the programme is shown inTable 3.1.12 below.
Table 3.1.12. DOES/WILL THE NATIONAL ANTI-CORRUPTION PRO-GRAMME HELP REDUCE CORRUPTION IN LITHUANIA? (%).
2002 2004
Helps 15 13Does not help 45 25Not stated 40 62
Noteworthy, in 2002, as many as four respondents out of ten had noopinion concerning the matter. The reason is the lack of information:76 per cent of those who had no opinion had not heard about the pro-gramme.

111III. ANTI-CORRUPTION POTENTIAL
Out of all the people surveyed, 15 per cent could be called optimistsas they believed in the National Anti-Corruption Programme as the cor-ruption reducer.
45 per cent were pessimistic about the effectiveness of the pro-gramme.
In 2004, as compared with 2002, the number of people who had notstated their opinion concerning the matter increased significantly (from42 to 62 per cent).
In 2004, like in previous years, the reason was the same lack of in-formation about the programme: 83 per cent of those who had no opin-ion had not heard about the programme.
In 2004, the number of optimists decreased by 2 percentage points.Yet the number of pessimists went also down significantly, from 45 to25 per cent.
In 2004, the respondents who said the National Anti-Corruption Pro-gramme does not help reduce corruption in Lithuania (constituting 25 percent), explained the actual reasons for their pessimism in Table 3.1.13below.
Table 3.1.13. WHY DO YOU THINK IT DOESN�T HELP? (% of those whoclaim that the Programme does not help reduce the level of corruption)
Reasons for pessimism Year 2004
No results are seen 31Bribes have become an inseparable part of public life 19Law enforcement officials are corrupt and are not interestedin fighting corruption 17It doesn�t work because they lie 10Ineffective laws 10The strategy was adopted not long time ago 1The majority are afraid to report 1Lack of public education, public awareness 1Low level of standard of living 1Little publicity over cases of corruption 1Low public trust of the Seimas 1Laws are amended by the will of politicians 1Not stated 14
The main reason for pessimism (constituting 31 per cent of all theanswers) is the lack of results rendered by the programme. This attitudeis held by people living in small towns, with smaller than average house-hold monthly income.

112 III. ANTI-CORRUPTION POTENTIAL
A slightly less popular answer (19 per cent) was that bribes havebecome an inseparable part of public life, that people became used tothat and act in accordance with those unofficial rules. This opinion wasexpressed by people younger than 30, having the biggest householdmonthly income, living in rural areas and cities.
17 per cent of the respondents thought that the law enforcement iscorrupt and not interested in fighting corruption. This view was mostlyheld by men, people aged 30�50, having the biggest household monthlyincome, living in the biggest towns of Lithuania.
The other reasons listed in Table 3.1.13 were mentioned by a verysmall number of the respondents (which does not exceed the statisticalerror).
As mentioned before, anti-corruption efforts cannot be effective ifthey are taken by governmental bodies alone. Substantial anti-corruptionpotential lies in the civic society and its organisations. One of such bod-ies involved in active anti-corruption activities is Transparency Interna-tional Lithuanian Chapter (further � TILS) established in 2000. One ofthe key objectives of TILS is promotion of anti-corruption initiatives andpublic intolerance towards corruption, in other words, increasing of anti-corruption potential. TILS conducts surveys, seminars, raises publicawareness, actively co-operates with governmental organisations, thebusiness sector and the mass media.
In 2004, it was decided to supplement the survey with a questionabout what people know about TILS as a body organising various anti-corruption initiatives.
9 per cent of the respondents said they had heard about TILS, 85per cent said they had not and 6 per cent gave no response.
3.2. ANTI-CORRUPTION POTENTIAL OF LITHUANIANCOMPANY MANAGERS
Business representatives is the active and dynamic social group whichhas to deal with business issues in various state institutions. Therefore,before we analyse the anti-corruption potential of business representa-tives, it is worth examining what major obstacles company managers sawfor their business during the period surveyed.
The 2001 and 2004 surveys asked company managers (as an open-ended question) to identify obstacles for their business.

113III. ANTI-CORRUPTION POTENTIAL
In 2001, the main obstacle, as seen by the respondents, was the taxpolicy (mentioned by 33 per cent), red-tape and corruption (31 per cent)and a deficient legal framework (22 per cent).
The existing tax system was mostly criticised by managers of smalland medium companies, established in Panevëþys, Kaunas and smallertowns. Red-tape and corruption was mentioned as an important obstacleby company managers from the services sector and those located inKlaipëda.
In 2004, company managers also mostly mentioned the tax policy (39per cent) and deficient legislation (21 per cent). The third position wastaken by a new problem, big competition (20 per cent).
The tax policy was seen as the most painful by small companies andsole proprietorships. Deficient legislation was identified as a major ob-stacle by managers of big and medium, public and private companies.Huge competition was considered a major concern for small and me-dium companies and sole proprietorships.
In 2004, red-tape and corruption did not hit the list of top threeobstacles. It stepped down to the fourth position, mentioned by 19 percent of the respondents, mostly managers of big and medium enterprises,public and private companies.
As seen from Table 1.2.2 of Chapter I, in 2001, about 57 per cent ofcompany managers said that in the last five years their companies didnot confront bribe-demanding situations. Company managers were askedif their companies reported bribe demands. Out 586 of those who re-sponded to the question 89 per cent said that they reported to no-oneand the majority of those who did (5 per cent) asked for support fromtheir business partners. In 2001, 2 per cent of companies managers re-ported to law enforcement agencies and 1 per cent informed the non-governmental organisations. Only in individual cases, respondents askedfor support from the Seimas, Government and the mass media.
Company managers were also asked why they refused to report bribedemands. The reasons are provided in Table 3.2.1 below.
36 per cent of the respondents did not report bribery as they do nottrust public institutions. 24 per cent were afraid that their �search forjustice� may be a financial burden and jeopardise their business in thefuture. 16 per cent of the respondents thought that it is impossible tosolve problems without giving a bribe.
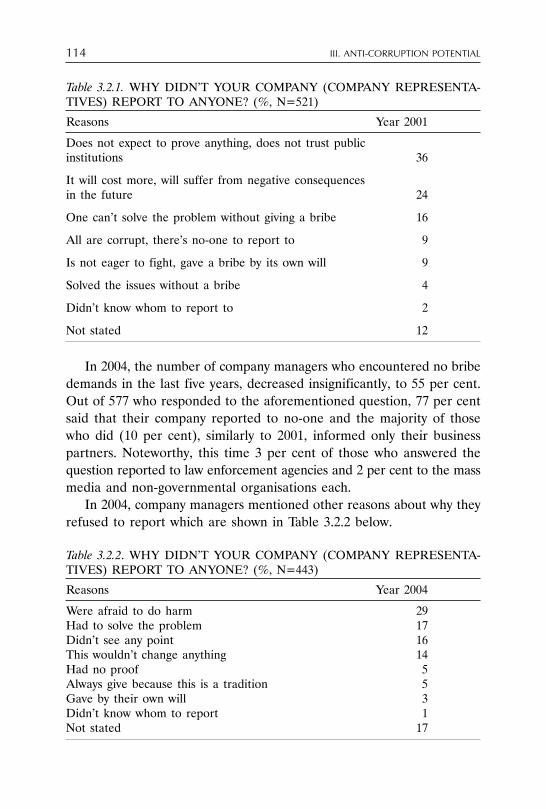
114 III. ANTI-CORRUPTION POTENTIAL
Table 3.2.1. WHY DIDN�T YOUR COMPANY (COMPANY REPRESENTA-TIVES) REPORT TO ANYONE? (%, N=521)
Reasons Year 2001
Does not expect to prove anything, does not trust publicinstitutions 36
It will cost more, will suffer from negative consequencesin the future 24
One can�t solve the problem without giving a bribe 16
All are corrupt, there�s no-one to report to 9
Is not eager to fight, gave a bribe by its own will 9
Solved the issues without a bribe 4
Didn�t know whom to report to 2
Not stated 12
In 2004, the number of company managers who encountered no bribedemands in the last five years, decreased insignificantly, to 55 per cent.Out of 577 who responded to the aforementioned question, 77 per centsaid that their company reported to no-one and the majority of thosewho did (10 per cent), similarly to 2001, informed only their businesspartners. Noteworthy, this time 3 per cent of those who answered thequestion reported to law enforcement agencies and 2 per cent to the massmedia and non-governmental organisations each.
In 2004, company managers mentioned other reasons about why theyrefused to report which are shown in Table 3.2.2 below.
Table 3.2.2. WHY DIDN�T YOUR COMPANY (COMPANY REPRESENTA-TIVES) REPORT TO ANYONE? (%, N=443)
Reasons Year 2004
Were afraid to do harm 29Had to solve the problem 17Didn�t see any point 16This wouldn�t change anything 14Had no proof 5Always give because this is a tradition 5Gave by their own will 3Didn�t know whom to report 1Not stated 17

115III. ANTI-CORRUPTION POTENTIAL
In 2001, company managers were mostly distrustful of state institutions,and in 2004, fear about the possible harm to their business done by report-ing moved from the second position to the first one (29 per cent).
In general, as shown by Table 3.2.2 above, company managers usu-ally solve the problems of corruption faced by their company on theirown. 17 per cent of the respondents said that they simply had to solvethe problem, 16 per cent did not see any point in reporting and 14 percent did not believe that reporting to various institutions may changeanything.
Similarly to the survey of residents, this survey was also interested inthe opinion of businessmen about the most effective measures of reduc-ing corruption.
The opinion of company managers about such measures in 2001 isshown in Table 3.2.3 below.
Table 3.2.3. WHICH CORRUPTION REDUCTION MEASURES YOU THINKWOULD BE THE MOST EFFECTIVE? (%)
The most effective corruption reduction measuresare the following: Year 2001
Stricter punishment 23Doesn�t know 23Increasing accountability of public officials 17Improvement of legislation 14Less control over people exercised by public officials 9Raising the standard of living, reduction of unemployment 8There�s nothing to be done 6Administrative sanctions 6Awareness raising 6Publicity, declaration of income 5Improvement of the tax system 3Staff selection 3Political will 2Necessary public support 1
Similarly to residents, Lithuanian company managers asked to namethe most effective anti-corruption measure said it is stricter punishment.It was mostly identified by managers of small and medium companies.
Although company managers mentioned many problems that ob-structed their business development and expressed their clear attitudetowards corruption as harmful to their business, 23 per cent of the re-

116 III. ANTI-CORRUPTION POTENTIAL
spondents could not suggest a single anti-corruption measure. That wasparticular characteristic of managers of small companies and those thatare engaged in trade.
17 per cent of the respondents thought that one of the most effec-tive anti-corruption measure is increasing accountability of public offi-cials. It most mostly mentioned by managers of big companies.
14 per cent of company managers said that improvement of legislationwould help reduce corruption. The legislative framework is mostly relevantfor managers of production companies, medium and big companies.
9 per cent of the respondents had a negative view about excess con-trol of public official exercised over people. Almost the same percent-age (8 per cent) of company managers said that raising the standard ofliving and reducing unemployment will help reduce corruption.
As little as 1 per cent of company managers said that to have lesscorruption in the country, active public position is necessary.
On the basis of the 2001 survey findings, we will compare the opin-ion of those company managers who had given a bribe in the last fiveyears and those who had not about effective corruption reduction mea-sures (see Table 3.2.4).
Table 3.2.4. WHICH CORRUPTION REDUCTION MEASURES YOU THINKWOULD BE THE MOST EFFECTIVE? (%)
The most effective corruption reduction Have not given Have givenmeasures are the following: a bribe a bribe
Introduction of stricter punishment 23 24Don�t know 27 16Increasing accountability of public officials 16 19Improvement of legislation 15 13Smaller control over people exercised by publicofficials 8 11Raising the standard of living, reduction ofunemployment 6 10There�s nothing to be done 4 9Administrative sanctions 6 7Awareness raising 7 4Publicity, declaration of income 4 7Improvement of the tax system 4 3Staff selection 3 2Political will 1 2Necessary public support 1 1

117III. ANTI-CORRUPTION POTENTIAL
The opinion of bribe-givers and those without such experience in thelast five years about effective corruption reduction measures is almostthe same. Both of the groups believe that stricter punishment may ren-der significant results. The only difference is that a much bigger percent-age (27 per cent) of company managers without bribery experience couldnot identify a single effective measure helping to diminish corruption.
Bearing in mind the institutional and organisation changes of the fightagainst corruption in 2004, the list of corruption reduction measures wasslightly changed. Company managers were asked to identify the mosteffective measures.
The opinion of company managers about such measures in 2004 isshown in Table 3.2.5 below.
Table 3.2.5. WHAT CORRUPTION REDUCTION MEASURES YOU THINKWOULD BE THE MOST EFFECTIVE? (%)
The most effective corruption reduction measures are the following: Year 2004
Introduction of stricter court punishment for corruption, adoptionof stricter laws 49
Introduction of stricter administrative sanctions, increase of fines,dismissal from work 47
Prohibition for public officials who committed an offence to workin state bodies 47
Improvement of anti-corruption legislation 39
Background checks of public officials, monitoring transparencyof their family property 29
More publicity in the mass media 25
Improvement of operation by special services tackling corruption 24
More active public support 19
Public awareness raising, educational measures 15
The problem will get solved by itself with the standard of livingincreasing in the country 15
Aiming at public officials having less control over various spheres of life 11
Increase remuneration for public officials to make them appreciatemore their employment 5
Not stated 5
In 2004, every second participant of the survey was in favour ofstricter court punishment for corruption and adoption of stricter laws.
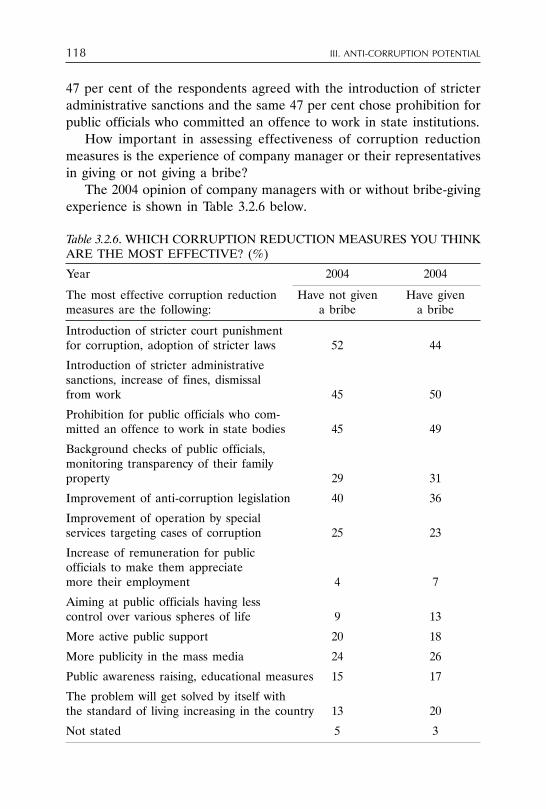
118 III. ANTI-CORRUPTION POTENTIAL
47 per cent of the respondents agreed with the introduction of stricteradministrative sanctions and the same 47 per cent chose prohibition forpublic officials who committed an offence to work in state institutions.
How important in assessing effectiveness of corruption reductionmeasures is the experience of company manager or their representativesin giving or not giving a bribe?
The 2004 opinion of company managers with or without bribe-givingexperience is shown in Table 3.2.6 below.
Table 3.2.6. WHICH CORRUPTION REDUCTION MEASURES YOU THINKARE THE MOST EFFECTIVE? (%)
Year 2004 2004
The most effective corruption reduction Have not given Have givenmeasures are the following: a bribe a bribe
Introduction of stricter court punishmentfor corruption, adoption of stricter laws 52 44
Introduction of stricter administrativesanctions, increase of fines, dismissalfrom work 45 50
Prohibition for public officials who com-mitted an offence to work in state bodies 45 49
Background checks of public officials,monitoring transparency of their familyproperty 29 31
Improvement of anti-corruption legislation 40 36
Improvement of operation by specialservices targeting cases of corruption 25 23
Increase of remuneration for publicofficials to make them appreciatemore their employment 4 7
Aiming at public officials having lesscontrol over various spheres of life 9 13
More active public support 20 18
More publicity in the mass media 24 26
Public awareness raising, educational measures 15 17
The problem will get solved by itself withthe standard of living increasing in the country 13 20
Not stated 5 3

119III. ANTI-CORRUPTION POTENTIAL
Company managers who had not given a bribe in the last five yearsare more positive about introduction of stricter punishment (52 per cent)than those who had not (44 per cent). Whereas the former group moreoften than the latter (50 and 45 per cent respectively) favour introduc-tion of stricter administrative sanctions. Moreover, company managerswith bribery experience say more often than those who lack it (20 and13 per cent accordingly) that the problem will get solved by itself withthe standard of living increasing in the country.
The two groups hold similar views concerning the other corruptionreduction measures.
In 2004, more businessmen (45 per cent) thought that more effec-tive are the measures that eliminate the roots of corruption. This wassaid by every second company manager with bribe-giving experience and44 per cent without it.
Punitive measures were acceptable to 42 per cent of bribe-givers and39 per cent of the respondents without such experience.
The findings of the surveys show that business people do realise thethreat of corruption, some of them have experience of corruption rela-tions and more than that, they have their own opinion about the effec-tiveness of anti-corruption measures and know how to behave confrontedwith different forms of corruption. Moreover, the findings show that therespondents tend to rely on themselves while solving their problems. Thisis seen from their lack of trust in state institutions. If they do not man-age to solve their problems themselves, company managers tend to re-sort to their business partners for help.
To their opinion, which institutions do have the key function of fight-ing corruption? This question was included in surveys of 2002 and 2004.The answers are provided in Table 3.2.7 below.
In 2002 and 2004, company managers most often ascribed those func-tions to the following institutions: STT (66 per cent in 2002 and 61 percent in 2004), ONTT (52 per cent in 2002) and FNTT (60 per cent in2004). The fight against corruption was thought to be one of the func-tions of the Seimas (63 per cent in 2002 and 70 per cent in 2004), Gov-ernment (58 per cent in 2002 and 65 per cent in 2004) and local au-thorities (58 per cent in 2002).
In 2004, the number of those company managers who thought thatthe fight against corruption is the main function of the Special Investi-gation Service decreased by 5 percentage points, and the number of those

120 III. ANTI-CORRUPTION POTENTIAL
who considered it the main function of the State Security Departmentincreased by the same 5 percentage points.
Table 3.2.7. Do you think the fight against corruption is the main function ofthis body, one of its function, not its function? (%)
Year 2002 2004
Main One Not N/S Main One Not N/Sfunc- of the its func- of the itstion func- func- tion func- func-
tion tion tion tion
President�s Office 8 49 33 11 5 46 36 13
Seimas 17 63 10 11 11 70 11 8
Government 26 58 6 10 17 65 10 9
Local authorities* 14 58 17 12 - - - -
Special InvestigationService (STT) 66 24 2 9 61 32 2 6
Organised CrimeInvestigation Service(ONTT)* 52 34 4 10 - - - -
State SecurityDepartment 31 42 15 12 36 47 8 10
Financial CrimeInvestigation Service(FNTT)** - - - - 60 31 2 7
Non-governmentalorganisations** - - - - 4 33 36 27
* Institutions not included in the 2004 survey.** Institutions not included in the 2002 survey.
The same year saw a decrease in the number of company managerswho thought that the Government (from 26 to 17 per cent), Seimas (from17 to 11 per cent) and President�s office (from 8 to 5 per cent) are thebodies directly dealing with corruption.
The lack of trust held by company managers in state institutionsplayed an important role in assessing the effectiveness of such insti-tutions.
The assessment of institutions in 2004 is shown in Table 3.2.8 below.

121III. ANTI-CORRUPTION POTENTIAL
Table 3.2.8. SPEAKING ABOUT EACH OF THOSE INSTITUTIONS INDI-VIDUALLY, HOW EFFECTIVE ARE THEY IN REDUCING CORRUP-TION IN LITHUANIA? (%).
Year 2004
Institutions Effective Ineffective Not stated
Special Investigation Service (STT) 25 63 12Financial Crime Investigation Service (FNTT) 25 61 14State Security Department 20 59 21Government 7 75 18President�s Office 6 64 30Seimas 6 78 16Non-governmental organisations 6 39 55
The effectiveness of the institutions listed in reducing corruption inLithuania was mostly assessed negatively.
In 2004, company managers gave the worst assessment (showing thedifference between �effectively� and �ineffectively�) of the Seimas (-72),Government (-68) and President�s Office (-58). A slightly more positiveattitude was held of non-governmental organisations, (-33), FinancialCrime Investigation Service (-36) and Special Investigation Service (-38).
Admittedly, more than half of the respondents (55 per cent.) had noopinion about non-government organisations and 30 per cent could notsay anything about the President�s office.
As mentioned in Chapter I above, in 2004, 52 per cent of companymanager said they had not given bribes in the last five years. Similarlyto residents, they were provided a list of reasons for not giving a bribeand asked to identify the ones that determined their behaviour.
Table 3.2.9 below shows the main reasons for not giving a bribe.
Table 3.2.9. WHY DID NOT YOUR COMPANY GIVE A BRIBE? (%, N=550)
Year 2004
So far I have managed to solve all the issues without giving bribes 47I have never confronted a bribe demanding situation 31That is against my principles 18I don�t believe it can help solve my problem 9That would be a violation of law 9I had no money for that 6I don�t know how to act in a situation like that 3

122 III. ANTI-CORRUPTION POTENTIAL
Almost half (47 per cent) of company managers could solve theirproblems without resorting to bribery. This reason was mostly mentionedby managers of big and small companies, as well as private and publiccompanies.
Every third respondent said he or she had not confronted a bribedemanding situation. This was mostly stated by manager of small andmedium companies as well as sole proprietorships.
18 per cent of company managers said that bribe giving is against theirprinciples. This position was mostly held by managers of big and publiccompanies.
9 per cent of the respondents did not believe in the effectiveness ofbribes and the same 9 per cent did not want to violate laws.
6 per cent of company managers said they had no resources for bribesand 3 per cent of the respondents did not know how to behave in suchsituations.
Similarly to Lithuanian residents, business representatives were askedto answer a question about the National Anti-Corruption Programmeadopted by the Seimas.
Their knowledge about the issue is show in Table 3.2.10 below.
Table 3.2.10. HAVE YOU HEARD ABOUT THE NATIONAL ANTI-COR-RUPTION PROGRAMME ADOPTED BY THE SEIMAS? (%).
Year 2002 2004
Heard 56 55Not heard 37 38Not stated 7 7
Slightly more than half of them (56 per cent in 2002 and 55 per centin 2004) said they had heard about the National Anti-Corruption Pro-grammed adopted by the Seimas in 2002. The most knowledgeable aboutit were managers of big companies, private companies, those establishedin Kaunas, Vilnius, Klaipëda and Panevëþys. In 2004, there was a biggershare of company managers who knew about the programme.
In 2002, company managers were also asked about the OECD anti-bribery convention. 17 per cent of the respondents had heard about theinstrument. The majority of them were managers of big and public com-panies. The most informed were company managers located in Kaunas.
The level of trust among company managers in the National Anti-Corruption Programme is shown in Table 3.2.11 below.

123III. ANTI-CORRUPTION POTENTIAL
Table 3.2.11. DOES/WILL THE NATIONAL ANTI-CORRUPTION PRO-GRAMME HELP REDUCE THE LEVEL OF CORRUPTION IN LI-THUANIA? (%)
Year 2002 2004
Helps 19 24Does not help 47 25Has no opinion 35 51
Noteworthy, very big number of company managers have no opinionconcerning the matter. In 2002, they accounted for 35 per cent and in2004 as much as 51 per cent. This could be explained, like in the caseof residents, by the lack of information received.
In 2002, 19 per cent of company managers were optimistic about theprogramme and they believed that it will help reduce the level of cor-ruption in the country. This opinion was mostly expressed by managersof medium and big companies, as well as public companies. The biggestoptimists were company managers from Kaunas and Vilnius.
In 2004, the number of company managers who thought this way wentup by 5 percentage points. An optimistic view was held by managers ofpublic and private companies and there were no major differences in theopinion of managers of small, medium and big companies concerningthe issue.
In 2002, almost half of company managers (47 per cent), irrespec-tive of type of business they were engaged in, were sceptical about theNational Anti-Corruption Programme. In 2004, the number of pessimistsdecreased significantly, to 25 per cent, although the number of those whohad no opinion increased. The biggest pessimists were managers of pri-vate companies.
The company managers who were sceptical about the anti-corruptionprogramme in 2004 were asked to explain the reasons for thinking this way.
The reasons for pessimism of survey participants are show in Table3.2.12 below.
Almost half of pessimistic company managers explain their attitudeby the lack of results rendered by the programme. This was mostly men-tioned by managers of private and public companies.
22 per cent of the respondents could not identify a single reason forbeing pessimistic. This is mostly characteristic of sole proprietorships.

124 III. ANTI-CORRUPTION POTENTIAL
Table 3.2.12. WHY DO YOU THINK IT DOESN�T HELP? (%., N=260)
Year 2004
No positive results are seen 46Not stated 22There is corruption in the Government itself 10Bribes have become a common and normalphenomenon in society 9Deficient legislative framework 4There�s no-one interested in implementing the strategy 4Artifice is also evolving 3Too little control 2Low standard of living 2
Company managers, like residents, were asked to answer a questionabout a body conducting anticorruption initiatives, Transparency Inter-national Lithuanian Chapter.
The level of their knowledge about TILS is shown in Table 3.2.13below.
Table 3.2.13. ARE YOU FAMILIAR WITH OR HEARD ABOUT TRANSPAR-ENCY INTERNATIONAL LITHUANIAN CHAPTER? (%)
Year 2002 2004
Know 12 25Do not know 88 66Not stated 0 9
In 2002, 12 per cent of company managers said they heard aboutTILS activities in Lithuania. These were mostly managers of big enter-prises, public and private companies.
The least informed about the TILS activities are managers of smalland medium companies and sole proprietorships.
In 2004, the number of company managers who knew about TILSdoubled (constituting 25 per cent). The best informed were managersof big companies and companies with foreign capital.
The least informed about TILS, like in 2002, were managers of smallcompanies and sole proprietorships.
The company managers who had heard about TILS were asked theevaluate its activities. Their evaluations are provided in Table 3.2.14below.

125III. ANTI-CORRUPTION POTENTIAL
Table 3.2.14. WHAT IS YOUR ASSESSMENT OF ACTIVITIES CARRIEDOUT BY THE TRANSPARENCY INTERNATIONAL LITHUANIAN CHAP-TER? (% of those who heard about the organisation).
Year 2002 2004
Very good 2 9Good 68 66Bad 18 13Very bad 2 2
In 2002, 70 per cent of the respondents who knew about TILS ac-tivities in Lithuania were positive about this body. In 2004, those whogave positive assessment of TILS increased to 75 per cent.
Since 2001, TILS has been regularly conducting a survey LithuanianMap of Corruption and presents the findings the residents and business-men of Lithuania as well as other countries. In 2004, the Lithuaniancompany managers who had heard about TILS (N=260) were asked ifthey heard about these regular surveys of TILS.
65 per cent of the respondents said they heard about these TILSprojects. More knowledgeable were managers of big companies, privatecompanies and those with foreign capital.
To summarise the Lithuanian anti-corruption potential, one shouldbear in mind that during the period surveyed the system of corruptionprevention was created in Lithuania and a lot of attention was paid tocorruption control and prevention, i.e. anti-corruption tactics becamemore focused.
Although both preventive and punitive measures are equally impor-tant in reducing corruption, Lithuanian people considered stricter pun-ishment the most acceptable and effective counter-corruption measure.Admittedly, in 2004, quite a big proportion of the public were clearly infavour of prevention measures. The tendency is to consider the systemof corruption prevention as important as criminal liability.
In 2002, business representatives, like common Lithuanian people,were mostly in favour of stricter punishment. However, in 2004, com-pany managers consider preventive measures as important as strictersanctions.
The most frequently mentioned reason for not giving a bribe is theabsence of a bribe demand itself. Yet one should not be too pessimisticabout that as less than one third of the respondents managed to solvetheir problems without resorting to bribery. On the other hand, the

126 III. ANTI-CORRUPTION POTENTIAL
number of citizens with integrity is not very big. A similar situation is inthe business sector: a slightly less than one half of company managerswho had not given bribes managed to solve their important issues with-out giving a bribe. Every third respondent did not confront a bribe de-manding situation and only 1 businessmen out of 10 did not agree toviolate laws.
Prevention activities in Lithuania are not very well known. The as-sessment of the anti-corruption programme is predominantly pessimis-tic. The main reason for that is the lack of results produced by anti-cor-ruption efforts.
To summarise, one could claim that state efforts in reducing corrup-tion have not remained unnoticed or unappreciated, yet the survey find-ings show that the public does not receive systematic information aboutthem. It is not only the lack of trust but also the lack of knowledge whichcould have a negative impact upon the anti-corruption potential ofLithuanian society.

127III. ANTI-CORRUPTION POTENTIAL
CONCLUSIONS
The authors present to the readers the Map of Corruption 2001-04,which is the first comprehensive sociological survey of corruption con-ducted in Lithuania. Surveys of the kind is also a rare phenomenon onthe international scale. The academic literature is engaged in continu-ous polemics about the accuracy and practical benefit of such surveys.Without getting involved into those disputes, we tried to show how quan-titative sociological methods can be used to measure the spread of cor-ruption in society.
While reading the book, questions may arise as to the reason whythis method of sociological survey was chosen, what it measures and howcapable it is of disclosing problems of corruption in society. Are thereany other reliable methods to identify the level of corruption in the coun-try? There exist, for example, law enforcement agencies which are di-rectly tasked to detect and investigate corruption crimes. Would not itbe easier to use the statistics collected by them, similarly the way thecrime level is measured in the country using the statistics collected bythe police and courts?
The response is, unfortunately, negative. The cases of corruption thatare institutionally documented are few and far between. For example,official statistics show that the Special Investigation Service, the main lawenforcement agency dealing with corruption crimes in Lithuania, inves-tigates about 100 cases per year. Does this figure represent the level ofcorruption in Lithuania? Hardly so. It rather shows, similarly to anyofficial law enforcement statistics, the institutional capacity to investigatecorruption following criminal laws. From the criminological point of view,corruption crimes are highly latent: they are difficult to disclose andrarely registered. With this regard, Lithuania is not one of a kind. Theinternational practice shows that while making the assessment of theoverall crime (including corruption) situation in the country, it is becom-

128 CONCLUSIONS
ing more common to resort to sociological (victimological) surveys28 ,rather than the official law enforcement statistics alone.
Presuming that the law enforcement is capable of disclosing all thecorruption crimes listed in the Criminal Code, it would be still difficultto state that criminal statistics reflect the level corruption in society. Manyacts that are corrupt in nature do not constitute a crime and are onlysubject to disciplinary sanctions or regarded as absolutely legal as, forexample, gifts for doctors when their value does not exceed 1 minimumsubsistence level.29
However, the authors of this book do not see their sociological re-search method, developed in 2000-01, as ideal and the only possible. Likeany other academic product, it is subject to the current and future de-bates and discussions which are the only way of making our knowledgemore thorough and mature. Yet while assessing the methodology, thereader should not leave out of consideration several important aspectsof this research.
First, like there is no agreement among researchers and practitionersabout what corruption is, no agreement has been reached about themethods which should be applied to investigate the spread of corrup-tion in the country. There may be various methods of diagnosing cor-ruption: from analysis of investigative journalism publications to macro-economic surveys. Even sociological methods of analysing corruption maybe different, including discussion groups, focus groups, questionnaires.The method presented in this book is not a universal one (although it isvery widespread): it simply helps disclose several aspects of corruption.
Second, the method of this sociological survey is a particular methodof modelling society and its segments. It is based on mathematical sta-tistics, and the reliability of its results depends on the selection criteriawhich should ensure representation and homogeneity of the objects sur-veyed. As important, though more subjective, is the compilation of thequestionnaire which depends on the preconditions of the survey, its goalsand objectives. All of the aforementioned aspects have a significant im-pact upon the interpretation of the survey results.
Third, the diagnostic survey Map of Corruption, is a follow-up surveyof attitudes towards corruption, which had been researched in Lithua-
28 For instance, such victimological surveys are regularly conducted in the USA orGreat Britain.
29 At present, 1 minimum subsistence level equals LTL 125 or appr. EUR 36.2

129CONCLUSIONS
nia, with the expanded institutional and geographical aspects. Yet thefocus here is made on the analysis of the most infamous forms of cor-ruption, bribery. The reader familiar with the modern methods of crimi-nological research will have no difficulty in identifying the elements usedin victimological research and analysis of delinquency self-reporting.
Fourth, public attitude towards corruption and assessments of corrup-tion do not reflect the real situation of corruption. Using the terminologyof phenomenological sociology, the knowledge of a �man of the street� maynot be the same as that of an expert, yet it remains unclear how universaland thorough the latter could be. Similarly, bribery experience does notentail all the corruption crimes, let alone all the corruption forms. Nepo-tism, abuse of office and other crimes remain unattended.
The survey does not have the ambition to make an in-depthgeneralisation, as the authors themselves are sceptical about the possibil-ity of making an accurate research of the level of corruption by quantita-tive methods. It is not only because there is no common understanding ofcorruption but first of all because the concept of corruption is measuredby values and entails a public agreement about the dangerous limit whosecrossing means that private interests overshadow public interests.
The authors tend to agree with those who think that the concept ofcorruption is a changing one30 . With this regard, it is important to findout how the social concept of corruption determines the �sensitivity� ofpeople and social institutions to the problem of corruption as well asthe possibilities of measuring it.
So why is this study called Map of Corruption? Because here we donot speak about an objective picture of corruption, but rather about itsmap as a conventional expression of this phenomenon in Lithuaniansociety. Is it worth taking it seriously or is it simply, as it is often claimedto be, an ungrounded opinion? The answer is a straightforward one: no,what was measured in 2001�04 is not just an opinion, it is a far morecomplex phenomenon which forms the basis for possible anti-corruptionstrategies and tactics. Like there are different kinds of geographic maps(including physical, political, climate and other), corruption maps can alsobe different, both from the subject matter and its scope point of view.The Lithuanian Map of Corruption, presented for readers� judgement, isjust one of them. New maps of corruption await to be drawn.
30 This view is discussed in the book: F. Anechiarico, B. J. Jacobs. The Pursuit ofAbsolute Integrity: How Corruption Control Makes Government Ineffective. Chicago:Chicago University Press, 1996, p. XV.


LITHUANIANMAP OF CORRUPTION
2005
Transparency InternationalLithuanian Chapter


PEOPLE SEE INCREASINGLYMORE CORRUPTION
From 28 November to 14 December 2005, TNS Gallup, contractedby the Special Investigation Service and employing the methodologydeveloped by Transparency International Lithuanian Chapter, interviewed1009 residents and 519 business managers in order to assess attitudesrelated to corruption, its level and role in society; analyse corruptionexperiences; evaluate the anti-corruption potential of Lithuanian society;and compare survey findings with the findings of analogous surveys per-formed in 2002 and 2004.
The new Lithuanian Map of Corruption 2005 shows that both residentsand business representatives identify corruption as one of the key prob-lems faced by a modern society. A more serious problem than corrup-tion, as seen by residents, is small salaries and crime and violence,whereas business managers say it is emigration of Lithuanian residents.
Comparison of the 2005 survey findings with those of 2004 show thatthe share of businesspeople and residents who believe that the scale ofcorruption �increased significantly� has risen dramatically, from nearly15% to 38% and from nearly 26% to 50%, respectively. While giving aforecast of the change of corruption levels over the next three years,residents are more pessimistic than business representatives: 43% ofresidents think that the scale of corruption will grow and only 17% thinkthat it will decrease. Meanwhile, 33% of businessmen forecast the in-crease of corruption over next three years and 30% of them think thatthe scale of corruption is going to shrink. Almost one third of residentsand businessmen think that the level of corruption will remain the same.
Asked to spontaneously name the most corrupt institutions in Lithua-nia, residents mostly mentioned institutions that belong to the health caresystem (58%), the police (47%), Seimas (38%) and courts (36%). Com-pany managers mentioned the following institutions: the police (38%),courts (35%), health care institutions (34%), municipalities (31%),

134 PEOPLE SEE INCREASINGLY MORE CORRUPTION
Seimas (30%) and the Government (24%). Residents and businesspeoplehold similar opinions concerning such �leaders� of the corruption sec-tor as the health care system, the police, courts, Seimas and the Gov-ernment. In addition, businesspeople mentioned municipalities andprivatisation services.
Comparison of the level of corruptibility among different branchesof the government in 2005, 2004 and 2002 show that during 2005 thenumber of those who believed that Seimas, Government and courts were�very corrupt� increased dramatically (as regards the former two, thenumber almost doubled). In 2005, as compared with 2004, the President�sOffice was regarded as less corrupt.
The majority of Lithuanian residents and company managers thinkthat a bribe helps to solve problems and in the future they intend, if aneed arises, to use it to �fix� their problems. There are more groundsfor optimism coming from the younger generation (aged 15-29), themajority of which believe that bribes do not help. Interestingly enough,33% of Lithuanian residents and 23% of company managers who thinkbribes do not solve problems still claim that they would give a bribe, ifnecessary. In 2005, as compared with 2004, the number of businesspeoplethat would give a bribe was decreasing, whereas the number of residentsready to give a bribe was growing.
In the last five years, 48% of Lithuanian residents and 37% of busi-ness managers say they have given a bribe at least once. In the last 12months, 26% of residents and 20% of company managers have given abribe. Bribes were more often given by economically active persons (aged20-39), with higher/college-type education, higher and the highest incomeper family member per month, self-employed (owners) and employed(having a paid job) residents of major towns, those who think that thematerial side of their life has improved significantly and Lithuanian resi-dents actively (every day) listening to the news.
The most active bribe-givers were among construction companies with11 to 50 employees and turnover in 2004 from 1 to 5 million litas.
The Lithuanian Map of Corruption 2005 calculated bribery indices thatallow to compare institutions according to the frequency of bribe de-mands, payment of bribes and effectiveness of bribes. Lithuanian resi-dents said that most frequently a bribe was implicitly demanded fromthem by the traffic police, in national and local hospitals, county gover-nor administrations and vehicle technical inspection centres. The respon-

135PEOPLE SEE INCREASINGLY MORE CORRUPTION
dents said that in most cases they agreed to give a bribe. The �leading�position in the area was held by the traffic police who were given bribesby 52% of residents and 40% of company managers.
The good news is that in 2005, as compared with 2004, the State TaxInspectorate was no longer included in the list of five most bribed insti-tutions and the scale of bribery decreased in town and regional munici-palities.
Participants of the social survey were asked to name the proceduresin which they had participated and then were asked to assess the levelof corruption of those procedures. Both residents and company manag-ers said the most corrupt procedures are changing the purpose of landuse, issuance of permits for construction and reconstruction. Admittedly,business representatives mentioned obtaining support from EU structuralfunds as a third most corrupt procedure, 25% of them said that it is a�very corrupt� procedure and 41% claimed it is �partly corrupt�.
The survey shows that every fifth resident of Lithuania knows whereto go to report a case of corruption. Businesspeople, as compared toresidents, are much better informed: 44% know where they would haveto report if they faced corruption. Only 23% of residents and 21% ofbusinesspeople would report a case of corruption known to them. 41%of residents and 47% of business representatives would consider notreporting such cases depending on a particular situation. 36% of resi-dents and 32% of company managers would not report a case of cor-ruption known to them. More than half of Lithuanian residents (59%)and company managers (54%) admit that they do not want to partici-pate in anti-corruption activities.

136 LITHUANIAN MAP OF CORRUPTION 2005
LITHUANIAN MAP OF CORRUPTION 2005
ORGANISATION OF THE SURVEY
Ordered by: Special Investigation Service of the Republic of Lithuania
Conducted by: TNS Gallup
Goals:� Evaluation of attitudes related to corruption, the level of corruption and its role
in society;� Analysis of cases of corruption (bribery) experience;� Evaluation of the anti-corruption potential of Lithuanian society.� Comparison of the survey findings with the findings of analogous surveys con-
ducted in 2002 and 2004.
Survey method: direct interview.
Target respondent groups and planned samples:� Lithuanian residents: 1009 respondents;� Business company managers: 519 respondents.
Type of selection applied:� The sample of Lithuanian residents representing statistical universe was ran-
domly selected using the Lithuanian Register of Residents� Addresses.� The sample of Lithuanian business companies, representing statistical universe,
was selected using the random numbers generator and the Lithuanian Regis-ter of Enterprises.

137LITHUANIAN MAP OF CORRUPTION 2005
ATTITUDES RELATED TO THE PHENOMENON OF CORRUPTION

138 LITHUANIAN MAP OF CORRUPTION 2005

139LITHUANIAN MAP OF CORRUPTION 2005
OPINION: EVALUATION OF THE LEVEL OF CORRUPTIONIN VARIOUS INSTITUTIONS

140 LITHUANIAN MAP OF CORRUPTION 2005
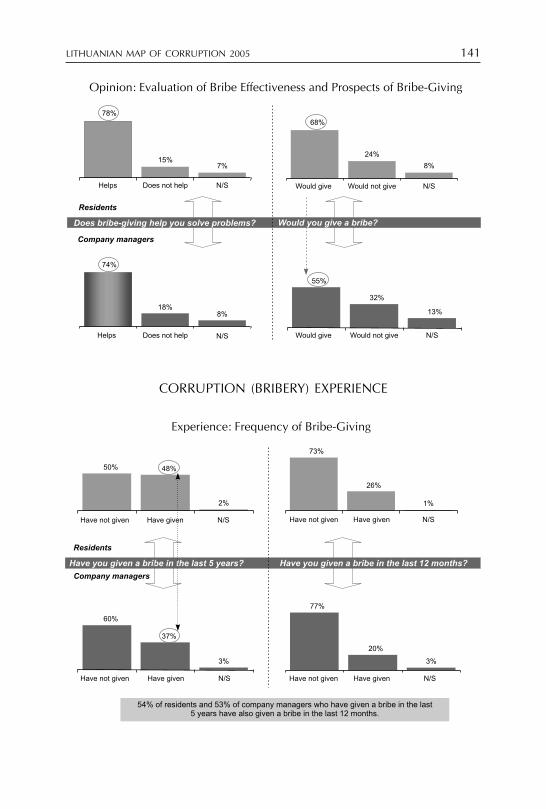
141LITHUANIAN MAP OF CORRUPTION 2005
CORRUPTION (BRIBERY) EXPERIENCE

142 LITHUANIAN MAP OF CORRUPTION 2005

143LITHUANIAN MAP OF CORRUPTION 2005

144 LITHUANIAN MAP OF CORRUPTION 2005
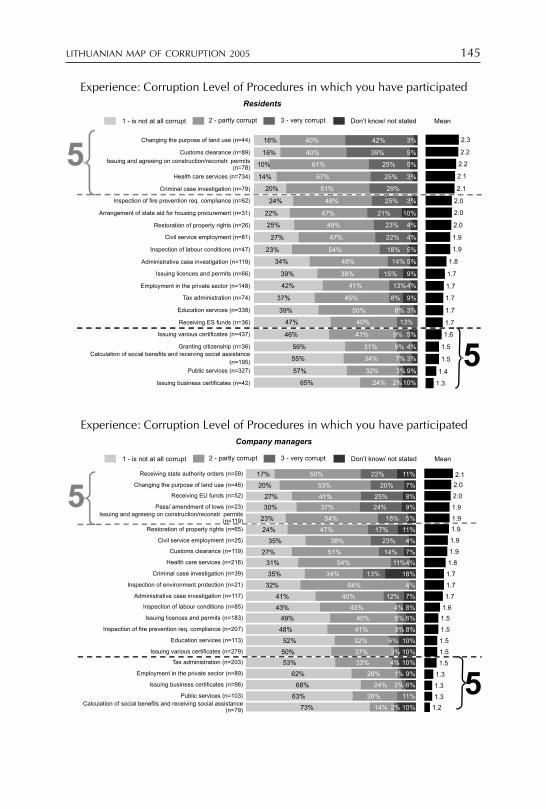
145LITHUANIAN MAP OF CORRUPTION 2005

146 COMPARING THE MAP OF CORRUPTION 2005 TO THE DATA OF PREVIOUS SURVEYS
COMPARING THE LITHUANIAN MAPOF CORRUPTION 2005 TO THE DATA
OF PREVIOUS SURVEYS
ATTITUDES
Which of these views do you share? (%)

147COMPARING THE MAP OF CORRUPTION 2005 TO THE DATA OF PREVIOUS SURVEYS
Scale of corruption during the recent five years in Lithuania... (%)

148 COMPARING THE MAP OF CORRUPTION 2005 TO THE DATA OF PREVIOUS SURVEYS
Opinion about the level of corruption in different branchesof the government (% very corrupt)

149COMPARING THE MAP OF CORRUPTION 2005 TO THE DATA OF PREVIOUS SURVEYS
Attitude of company managerstowards bribe-giving (%)
Attitude of residents towards bribe-giving (%)

150 COMPARING THE MAP OF CORRUPTION 2005 TO THE DATA OF PREVIOUS SURVEYS
EXPERIENCE
Have you given a bribe over the last five years? (%)
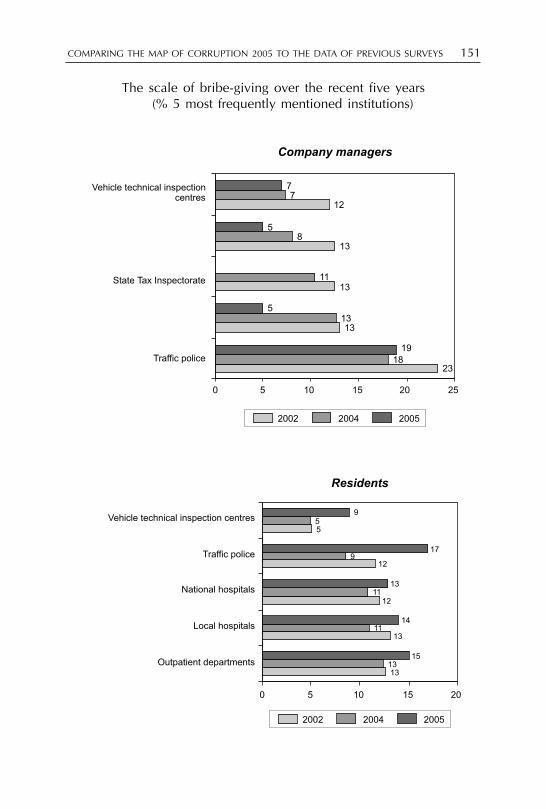
151COMPARING THE MAP OF CORRUPTION 2005 TO THE DATA OF PREVIOUS SURVEYS
The scale of bribe-giving over the recent five years(% 5 most frequently mentioned institutions)

152 COMPARING THE MAP OF CORRUPTION 2005 TO THE DATA OF PREVIOUS SURVEYS
Bribery indices (company managers)
Bribery indices (residents)

153COMPARING THE MAP OF CORRUPTION 2005 TO THE DATA OF PREVIOUS SURVEYS
ANTI-CORRUPTION POTENTIAL 2005
Would you want to participate in anti-corruption activities?

154 COMPARING THE MAP OF CORRUPTION 2005 TO THE DATA OF PREVIOUS SURVEYS
Would you be willing to report the caseof corruption you know about?

155COMPARING THE MAP OF CORRUPTION 2005 TO THE DATA OF PREVIOUS SURVEYS
Why didn�t you give a bribe?
Transparency InternationalLithuanian Chapter recommends:
156 SUMMARY AND FINDINGS
SUMMARY AND FINDINGS
General Attitudes related to the Phenomenon of Corruption:1. Attitude towards the Role of Corruption in Society
1.1. Lithuanian society, both residents and business representatives,identify corruption as one of the most important problems ofmodern society. The only other more important social problems,as seen by residents, are low salaries and the high level of crimeand violence, whereas business representatives consider it to beemigration of Lithuanian residents from Lithuania;
1.2. The majority (86%) of Lithuanian residents and businesspeople (77%) agree with the statement that corruption is a majorobstacle to a harmonious functioning society. While evaluating theimpact of corruption on social life, residents have a more categori-cal opinion than business people: corruption as a �major� obstacleto social life was seen by 58% of Lithuanian residents, whereasas few as 38% of business representatives said it was a �major�obstacle for business development. The change in the attitudes ofresidents, as compared with 2004, shows almost the same trendsof how they regard the impact of corruption on social life, whereasthe number of businessmen who view corruption as an obstacleto business development has increased;
1.3. Both residents and business representatives believe that cor-ruption has the biggest negative impact on the political life of thecountry and the least impact on personal and family life.
2. Evaluation of Changes in the Scale of Corruption2.1. Recognition of the negative impact of corruption on societyand business, which is reflected in their general attitudes towardscorruption, can be explained by the fact that identification ofchanges in the scale of corruption as �increased significantly� al-

157SUMMARY AND FINDINGS
most doubled in the last five years. In other words, the presump-tion can be made that the better the understanding of negativeimpact of corruption on the overall development of the state is,the better and the more informed is the evaluation of residentsand business people of the existing level of corruption. This isillustrated by the fact that the analogous surveys conducted in 2002and 2004 showed that 15% and 19%of Lithuanian residents, ac-cordingly, found it difficult to evaluate changes of the scale ofcorruption;
2.2. Evaluation of changes in the scale of corruption during thelast five years shows that the majority of Lithuanian residents andbusiness people believe that the scale of corruption has increasedsignificantly or slightly whereas during the last twelve months ithas remained the same;
2.3. The majority of residents and business people believe that theproblem of corruption and its current level is a distinctive featureof social life of independent Lithuania because this problem be-came particularly apparent, i.e. its level grew as compared bothto the Soviet era and early 1990s;
2.4. While making a forecast of the change in corruption over thecoming three years, residents are somewhat more pessimistic thanbusiness representatives: 43% of residents forecast further growthof the scale of corruption and only 17% of them think that thelevel of corruption will be reduced; at the same time, 33% ofbusiness people forecast the growth of corruption and 30% ofthem think that the scale of corruption in the coming three yearsis going to decrease. Almost one third of residents and businesspeople believe that the level of corruption will remain the same.
3. Opinion about the Level of Corruption of Different Institutions3.1. When asked to spontaneously name the institutions which areconsidered the most corrupt in Lithuania, the respondents mostoften mentioned medical staff and institutions that belong to thehealth care system (58%), police (47%), Seimas (38%) and courts(36%). Business managers think that the most corrupt institutionin Lithuania are the police (38%), courts (35%), health care in-stitutions and medical staff (34%), municipalities (31%), Seimas

158 SUMMARY AND FINDINGS
(30%), and the Government (24%). In general, the opinion ofresidents and business people concerning the most corrupt insti-tutions coincide, with the following institutions seen as corrup-tion �leaders� : the health care system, police, courts, Seimas andthe Government. Business people, more often than residents, alsomentioned municipalities and privatisation services;
3.2. When asked to evaluate the level of corruption of the speci-fied branches of the government, neither residents nor businesspeople were able to point to a clear-cut �leader� in corruption.Both groups named Seimas, the Government, political parties andcourts as the most corrupt institutions Residents regard thePresident�s office, mass media and non-governmental organisationsand business people view the President�s office and non-govern-mental organisations as less corrupt state authorities. Residents,as compared to business people, attributed a higher level of cor-ruption to the President�s office, whereas business people, moreoften than residents, considered mass media as corrupt.
3.3. Comparison of the level of corruption of different branchesof the government in 2002 and 2004 shows a sharp increase ofevaluations of �very corrupt� of such institutions as the Seimas,the Government and courts. Last year�s survey findings, as com-pared to 2004, also show a decrease in the perceived corruptibil-ity of the President�s office, a logical tendency when bearing inmind the Lithuanian political situation of that time.
4. Opinion about Corruptibility of Different Institutions4.1. Analysis of the respondents� evaluation of the level of cor-ruption of the Government ministries shows a general tendencyof almost all the ministries being seen as more corrupt than theaverage (all the evaluation means are higher than 1.5 out of pos-sible 3).
4.2. Residents view the Ministry of Health as the most corruptministry, which is followed by the ministries of Justice, Economy,the Interior, Finance and Agriculture. The least corrupt ministry,as seen by residents, is the Ministry of Culture.
4.3. Business people say that the most corrupt ministries are theMinistry of Economy and the Ministry of Health, followed by the

159SUMMARY AND FINDINGS
Ministry of Agriculture, the Ministry of the Interior and the Min-istry of Environment. Similar to residents, business people regardthe Ministry of Culture as the least corrupt ministry.
4.4. The biggest difference of opinion between Lithuanian resi-dents and company managers appears when evaluating the Min-istry of Finance, Ministry of Social Security and Labour and Min-istry of Justice, which are more often regarded as corrupt by resi-dents than business. Residents and business people hold similarattitudes towards the level of corruption in the ministries of En-vironment, Defence, Culture, Transport, Economy, Interior, andAgriculture.
5. Corruption (Bribery) Experience5.1. The majority of Lithuanian residents and company managersthink that bribes help solve problems and they intend, if neces-sary, to use bribery in the future to �fix� their problems. A grow-ing tendency among the younger generation (aged 15-29) whobelieve that bribes do not help solve problems creates somegrounds for optimism.
5.2. One third of Lithuanian residents (33%) and 23% of com-pany managers, who think that bribery does not solve problems,say they would give a bribe if the need arises.
5.3. Over the last five years, 48% of Lithuanian residents and 37%of business managers said they had given at least one bribe. Overthe last 12 months, 27% of residents and 20% of company man-agers have given a bribe.
5.4. Analysis of social-demographic characteristics of Lithuanianresidents shows that bribes are more often given by economicallyactive persons (aged 20-39), with further /higher education andhigher and the highest income per family member per month, self-employed (owners) and employed (having a paid job) residents ofmajor towns, those who think that the material side of life hasimproved significantly and Lithuanian residents actively (every day)listening to the news.
5.5. Those who have not given a bribe during the last five yearsare more often young (aged 15-19) or senior (aged 60-74) people,

160 SUMMARY AND FINDINGS
Lithuanian residents with primary, basic, secondary/special second-ary education, lower income per family member per month, ruralresidents who think that the material side of life remained thesame or got worse in the last five years.
5.6. The companies that have given bribes mostly include thoseoperating in the construction sector, with 11 to 50 employees andturnover in 2004 from 1 to 5 million litas.
5.7. More than half of residents (56%) and 47% of business com-pany managers who have not given a bribe say it was due to thefact that they have not faced a situation in which a bribe wouldbe demanded from them. Quite a few business people said theydid not give a bribe because �so far we have managed to solveour issues without bribes� (47%).
5.8. The survey measured not only the perceived level of corrup-tion of different institutions by residents and company managers,but also the perceived level of corruption of the institutions inwhich the respondents directly dealt with their matters. Lithuanianresidents who handled their affairs in respective institutions, evalu-ated the following bodies as the most corrupt: customs, trafficpolice, courts, county governor administrations and national hos-pitals. According to residents, the least corrupt institutions arenotaries, preschool education establishments, emergency medicalservice, state social insurance fund board and primary and second-ary schools.
5.9. The evaluation of the level of corruption by all residents andthose who handled their affairs in respective institutions does notdiffer much, except when it comes to county governor adminis-trations. Those residents who had experience with county gover-nor administrations consider them more corrupt.
5.10. According to business managers who dealt with their mat-ters in certain institutions the most corrupt institutions are Seimas,political parties, traffic police, the Ministry of Economy and theMinistry of Health. The least corrupt are considered theLithuanian Labour Exchange, social insurance fund board, pre-school establishments, State Commission of Youth Affairs andStatistics Department.

161SUMMARY AND FINDINGS
5.11. According to Lithuanian residents, they are most often im-plicitly demanded a bribe by the traffic police, in national and localhospitals, county governor administrations and vehicle technicalinspection centres. These institutions are also given bribes mostfrequently.
5.12. Company managers state that a bribe is most frequently de-manded or implied with a prospect of an easier solution to prob-lems in the following institutions: traffic police, customs, StateBorder Security Service, county prosecution offices and ministriesof Economy, Transport, Economy and Health. According to busi-ness representatives, these institutions are also given bribes mostoften.
5.13. While analysing corruption cases not only from institutionalbut also a procedural point of view, the respondents were askedto identify the procedures in which they participated and assesstheir corruptibility. Both residents and company managers saidthat the most corrupt procedures are the following: the procedureof changing the purpose of land use, issuance of permits for con-struction and reconstruction, and agreement on the text of docu-ments. Apart from the listed procedures, residents identify as morecorrupt the following: customs clearance, provision of health ser-vices; at the same time, business people say it is support from EUfunds and adoption/amendment of legislation.
5.14. The following procedures were identified as least corrupt:the procedure of granting citizenship, calculation of payment ofsocial benefits, obtaining social support, provision of public ser-vices, issuance of business certificates.
6. Anti-Corruption Potential of Society6.1. Realizing the damage of corruption to society and businessand recognising its growth, both residents and company manag-ers are not inclined to blame themselves or their friends and ac-quaintances. According to them, the guiltiest groups with regardto the existing scale of corruption are politicians and civil servants.
6.2. In the opinion of every second resident and business person,in cases of bribery, responsibility lies either with both parties orthe bribe-taker. Only 7% of residents and 3% of company man-

162 SUMMARY AND FINDINGS
agers say that the guilty party is the bribe-giver. Comparing thisopinion with the 2004 survey findings, one can observe a positivechange in attitude as more and more responsibility is attributedto both parties, i.e. a bribe-taker and a bribe-giver.
6.3. The main reason that, according to both residents and com-pany managers, could justify acceptance of bribes is that briberyis rarely punished. Another reason mentioned is the low salariesof civil servants/employees.
6.4. Talking about prevention measures that need to be taken toreduce the current scale of corruption, residents and companymanagers had different opinions: 58% of residents think that themost effective would be punitive measures, and 60% of businesspeople are in favour of prevention and educational measures.Comparison of the survey findings with those of 2004, shows thatresidents became more favourable of criminal measures and theopinion of business people remained the same.
6.5. More than half of Lithuanian residents identify the introduc-tion of stricter punishment for the acceptance of bribes as the mosteffective punitive measure. 37% of business people also believethat this preventive measure should be effective. 36% of businesspeople are in favour of improving legislation and another 36% saythat the origin of property of civil servants should be checked.
6.6. The respondents were asked to name the three most effectiveanti-corruption measures. The first most effective anti-corruptionmeasure, as identified both by residents and business people, isstricter punishment for the acceptance of bribes. The second mea-sure, mentioned by both groups of the respondents, is improvementof legislation and introduction of punishment for bribe-giving (thelatter was mentioned by residents only). The third most effectivemeasure, as seen both by residents and company managers, was thatthe problem of corruption will solve itself with the overall improve-ment of living standards. According to the respondents, the activerole of mass media in informing the pubic about corruption couldalso considerably contribute to the reduction of corruption.
6.7. 54% of residents and 61% of business people recognise theimportance of mass media as the most effective institution in re-

163SUMMARY AND FINDINGS
ducing the scale of corruption. Half of Lithuanian residents (50%)and 32% of business managers mentioned television as the mostreliable source of information about corruption. The second mostreliable source of information is personal experience or the expe-rience of friends/acquaintances.
6.8. The majority of business managers think that, apart from massmedia, the most effective fighters against corruption are specialservices. Residents say that the National Audit Office is almostas effective as mass media in fighting corruption.
6.9. Only a very small share of residents and company managersbelieve that the principal socialising agents, i.e. the church, fam-ily and education establishments, are effective in fighting corrup-tion in the country.
6.10. While bearing in mind limited resources of the state, bothresidents and company managers believe that the biggest respon-sibility for the existing level of corruption lies with politicians andcivil servants. Representatives of both groups suggest that whenfighting corruption, the focus should be on �frying big fish� or�those who get caught�. The majority of the respondents do notbelieve it is worthwhile to �fry small fish�.
6.11. As few as one fifth of Lithuanian residents (22%) know whoto contact to report a case of corruption. Business people, as com-pared with residents, are better informed: 44% of them know whothey should report to in a case of corruption. Only 23% or resi-dents and 21% of business people would report a case of corrup-tion they are aware of. 41% of residents and 47% of companymanagers would consider whether or not to report a case of cor-ruption depending on the situation and 36% of residents and 32%company managers would never report the case of corruption thatthey know about.
6.12. More than half of Lithuanian residents (59%) and more thanhalf of business people (54%) would not like to take part in anti-corruption activities.
6.13. About half of all the respondents think that the main rea-son justifying the decision to remain silent about a known case ofcorruption is that �there�s no point in reporting because people
164 SUMMARY AND FINDINGS
related to that will not get sentenced anyway� and �those whoreport in the end suffer the most�. About 37% of all respondentsemphasise �traditions�: �everybody knows about those cases butnobody reports�, and almost twice the number of residents (37%),as compared to businessmen (20%), say that they simply do notknow who to report to.
6.14. Similarly in the case of the most effective anti-corruptionmeasures, the respondents were asked to name three reasonswhich they considered as the most important in justifying thedecision to remain silent about a known case of corruption. Resi-dents identify two main reasons; which are the lack of informa-tion (they do not know who to report to) and inefficiency andunreliability of the legal system (�there�s no point in reportingbecause people related to that will not get sentenced anyway�) -the latter is also the main reason stated by business people. Thesecond reason specified both by residents and business people isthat the person reporting does not feel safe and safety is not en-sured (�those who report in the end suffer the most�). The thirdreason is unwillingness to break away from long-established �tra-ditions� (�everybody knows about those cases but nobody reportsthem�) and awareness that reporting takes up some of their owntime (�it�s difficult to report and it takes time�).
6.15. Three fourths of Lithuanian residents and half of the com-pany managers have never heard about the National Anti-Corrup-tion Programme adopted by the Seimas of the Republic of Lithua-nia. Irrespective of whether or not they are informed about theprogramme, slightly more than one third of the respondents thinkthat it does not help to reduce the level of corruption; one fifthof residents and a quarter of company managers think it helps toreduce corruption.

165SUMMARY AND FINDINGS
Transparency International Lithuanian ChapterLi-542 Lithuanian map of corruption 2001�05 / Transparency Inter-
national Lithuanian Chapter � Vilnius : Eugrimas, 2006. � 168 p.ISBN 9955-682-44-2�Lithuanian Map of Corruption 2001-2005� consists of two parts: an analytical
study �Lithuanian Map of Corruption 2001-2004�; and a compilation of results andinsights of the latest Map of Corruption composed in 2005, which together offerthe latest and most detailed insight into the perception and experience of corrup-tion by Lithuanian residents and company executives.
UDK 343.35(474.5)

LITHUANIAN MAP OF CORRUPTION 2001�05Transparency International Lithuanian Chapter
Edited by Sergej MuravjovDesigned by Algimantas Dapðys
Publishing House Eugrimas, Kalvarijø st. 98�36, LT-08211 VilniusTel./fax +370 5 2733 955, [email protected]
Printed by Pozicija, S. Þukausko st. 49, LT-09131 Vilnius