ugo tour client report final
TRANSCRIPT
UGo Tour Client Report
By: Mariah Fleming, Terrence Green & Grant Withrow

UGo Tour 2
Table of Contents EXECUTIVE SUMMARY ........................................................................................................................ 3
CLIENT PROFILE ................................................................................................................................... 4
SITUATIONAL ANALYSIS .................................................................................................................... 14
MARKET ANALYSIS ............................................................................................................................. 23
RECOMMENDATIONS ......................................................................................................................... 31
SOCIAL MEDIA ..................................................................................................................................... 31
SOCIAL ADOPTION .............................................................................................................................. 34
APP ADOPTION ..................................................................................................................................... 36
SURVEY RESULTS ............................................................................................................................................... 37
APPENDIX A (SOURCES) ................................................................................................................................... 39
APPENDIX B (SURVEY) ...................................................................................................................................... 40
APPENDIX C (IBIS WORLD REPORTS) .......................................................................................................... 43
UGo Tour 3
Executive Summary
UGo Tour is a tour guide app based in the Western North Carolina and Great Smokey Mountain areas. UGo Tour works with the Department of Transportation and National Park Services to create the unique and personalized tours that are offered within the app. Through this 2.0 version of UGo Tour, the owner has done extensive research and our team has added to the pool of information by conducting survey’s and by adding our millennial knowledge of the app world and social media tendencies.
UGo Tour is affected by technological, political, economic and social factors. Our team investigated these factors and described exactly how these factors will impact the success of UGo Tour. UGo Tour was also compared to competitors identified by both the creator and our team. The Porter’s Five exhibited a favorable outlook for the new launch of UGo Tour.
To assure the success of UGo Tour 2.0, the marketing plan consists of four parts, the social media recommendation, social adoption, app adoption and survey results. The social media portions discuss how and when users view, tweet, and upload data onto Facebook, Instagram, and Twitter. This will help those at UGo Tour to know when the app will get the most attention and publicity on other social outlets. Finally, at the end of the report our team has included the survey conducted, along with the results in their entirety. The IBIS World Report for Sightseeing Transportation in the United States is included as is the IBIS World Report for Tour Operators. Our team saw fit to include both so as to better encompass what UGo Tour is all about.

UGo Tour 4
Client Profile
UGo Tour
The goal of the platform is to present small businesses and municipalities
with a venue to tell stories of their history and heritage in an interactive and
engaging manner.

UGo Tour 5
Table of Contents
COMPANY OVERVIEW………………………………………………………………………………..……….6
KEY FACTS ............................................................................................................................................. 8
BUSINESS DESCRIPTION ....................................................................................................................... 8
HISTORY ................................................................................................................................................. 9
KEY EMPLOYEES ................................................................................................................................... 9
MAJOR PRODUCTS & SERVICES ....................................................................................................... 10
CUSTOMERS ......................................................................................................................................... 13
COMPETITION ..................................................................................................................................... 13
UGo Tour 6
Company Overview: E-Commerce Business Solutions (eCBiz Solutions) is a web development and consulting company. Paul
Hedgecock is the President and Founder of E-Commerce Solutions, which is established as an LLC S-
Corporation and operates out of Asheville, North Carolina. E-Commerce offers a variety of services
including gaining visibility to retailers such as eBay and Amazon as well as web development services
such as web design and software applications. Currently the company is redesigning the UGo Tour
application. This product is for visitors to the Western North Carolina Region. It allows users to
download a custom hike or trail. Completing the application is the primary goal of E-Commerce
Business Solutions as opposed to other services that are provided. This application is still in the late
alpha and early beta stages. The company plans to launch the application in March on the iOS and
Android markets. However before this is accomplished, Mr. Hedgecock wants to emphasize smaller and
less renowned areas as well as small businesses.
UGo Tour cost for tour development is approximately $11, 400 and it takes 165 hours to complete.
Below is a chart detailing the expenses incurred in creating UGo Tour tours.

UGo Tour 7
GOAL: Determine total cost to develop each individual tour
Line Item Talent
Required? Total Hours
Hourly Cost Total Cost
BUILD: Tour Curation (adapting from existing material) Writing 24 $25.00 $600.00 BUILD: Tour Curation (create tour from scratch) Writing 36 $25.00 $900.00
BUILD: Curation Approval Project Management 10 $100.00 $1,000.00
BUILD: OnSite Visit #1 Tour Curator 10 $30.00 $300.00 BUILD: OnSite Visit #2 Tour Curator 10 $30.00 $300.00 BUILD: OnSite Visit #3 Tour Curator 10 $30.00 $300.00 BUILD: Photography / asset development Photography 12 $75.00 $900.00 BUILD: Narration Voice Talent 3 $400.00 $1,200.00 BUILD: Data Entry Tour Curator 6 $30.00 $180.00 PLATFORM: Costs related to platform development Web Development Fixed N/A $2,000.00
MARKETING: Tour Promotion Kit Creative direction, etc. Fixed N/A $1,000.00
SALES COST ALLOCATION: Sales Team 20 $100.00 $2,000.00 MAINTENANCE: Updates and tour content adjustments Tour Curator 24 $30.00 $720.00
TOTAL COST FOR TOUR DEVELOPMENT 165 $11,400.00
Talent By Hour
Writing 60 Tour Curator 60 Project Management 10 Photography 12
Voice Talent 3
Sales Team 20
TOTAL HOURS 165
Balance Checks Out? TRUE

UGo Tour 8
Key Facts Company: E-Commerce Business Solutions
UGo Tour App and Website Location: 15 W. Walnut Street #202
Phone: (828) 390-3751
Website: Facebook:
http://ecbizsolutions.com https://www.facebook.com/ecbizsolutions?ref=hl
Email: [email protected] [email protected]
Hours of Operation: Monday to Friday 9:00 AM-5:00 PM
Industry: Electronic Commerce, Web Development, Tourism
Legal Structure: LLC S-Corp Business Description: E-Commerce Solutions is located on 15 W. Walnut Street #202 in Asheville NC in downtown. The
company was established in 2014. Paul Hedgecock is the President and Founder of the company. The
company has two partners, Paul Hedgecock and Andrew Cerillo. Mr. Cerillo was a former Vice
President of Goldman Sachs who left in order to become a partner with Mr. Hedgecock to work on this
business. The company has many primary areas of focus that they focus the business on. Some of the
services the company specializes in include increasing a company’s presence over the Internet especially
to large online retailers such as eBay and Amazon, and increase market share. The development side of
the business includes website design, eCommerce, eBay solutions, custom web applications,
SEO/SEM/Social Media Marketing, network security, and software application development.
The signature product that E-Commerce Business Solutions offers is the UGo Tour application. The
purpose of this product is to “redefine the tourism experience by making professionally generated,
UGo Tour 9
localized content accessible through a consistent mobile interface”. This will be accomplished by
combining rich content with consistent functionally during the course of a trip through the Smokey
Mountains of North Carolina.
History:
The UGo Tour app first started up about two years ago. Mr. Hedgecock and his team purchased the app
to provide planned out tour guides for the Western North Carolina Mountain Region. Due to unexpected
problems during the onset of the project, the first run at the UGo Tour app failed. Mr. Hedgecock and
his team were confident in their purchase and are now revamping the UGo Tour app 2.0, which is
currently in the final stages of development. To be able to fund this project, Mr. Hedgecock and his
business partner received donations from several sponsors. Sponsors donated anywhere from $5,000 to
$50,000 individually.
Key Employees: Paul Hedgecock: President and CEO of UGo Tour. Mr. Paul Hedgecock lives and works out of
Asheville, NC. Paul is an entrepreneur who has worked in several places across the United States Mr.
Hedgecock is also the President and founder of E-Commerce Business Solutions.
Andrew Cerillo: CEO of E-Commerce Business Solutions. Mr. Cerillo comes from a financial
background where he worked for 13 years prior to joining Mr. Hedgecock in Asheville. Mr. Cerillo
previously worked at Goldman Sachs serving as the Vice President.
Daniel Hensley: Mr. Hensley is the software engineer at E-Commerce Business Solutions as the lead
software developer. Mr. Hensley manages the cloud infrastructure and Linux machines at the company.

UGo Tour 10
Major Products and Services: UGo Tour: This app is the major focal point for Mr. Hedgecock and his partner Mr. Cerillo. The app
will provide a free and engaging experience for its users. By partnering with the North Carolina
Department of Transportation (NCDOT) as well as the NC Scenic Byways Division of the NCDOT,
UGo Tour has an exclusive advantage in possessing the most scenic and interactive tours.
Using rich content, HD video, and GPS integration, all these components are integrated to take travelers
and tourists on adventure throughout the Western North Carolina Region. UGo Tour is already the
Official and Travel and Tour Guide app for Western North Carolina Blue Ridge Mountains. Sponsors
included for UGo Tour are the Blue Ridge National Heritage Area and Smoky Mountain Host.
The solution that UGo Tour has developed is to become Platform-based (many tours, one experience),
make localized content accessible (enhance and engage, not dominate or distract), and elevate the
tourism experience by using Flex Tours, where one would be able to start a tour either at the beginning,
middle, or somewhere near the end and Tour-hopping where a user could move from tour to tour based
on where they want to go, allowing for spontaneity.

UGo Tour 11
Personalization: Users of the app will be given the opportunity to load or add their own stops on tours. Users can choose from different locales when they get to certain stops along the way. In Dillsboro they could choose between the Chocolate Factory and the Christmas Shop or both!

UGo Tour 12
Reward System: In the app there will be a sort of point system that will reward users with trophies at the end of their tours. This will give incentive to those competitive and acclamation seeking tour junkies.
Sharing: The app also allows for the user to share their experience and tours on several social media outlets. Sharing on Facebook, Twitter and Instagram will be options for users upon completion of a tour.

UGo Tour 13
Customers: The main customers for this app would be the locals of Western Carolina area or anybody who is new to the area and trying to find tourism. With this app customers would be able to find the different historical and tourist locations in the Great Smokey Mountain area. This app would also help local shops and restaurants around this area to bring in more customers to their business by advertising locations in that area. With a local business not getting much advertisement, the UGoTour app will help them with that.
Competition: UGoTour competitors consist of other mobile tour guides. The competitors of UGoTour however are not based on one or two local areas and there apps are spread out around the world. Listed are 5 different mobile tour guide apps. The apps are broken down into categories of price, service, and location. Competitors Price Service Location Quality TourPal Free app Users pay,
worldwide footprint, audio tour without navigation
Asheville, NC 1 of 5 stars on the App Store. Poor.
Stray Boots Free app users pay, North America footprint, crowd-sourced content
New York, New York
4.5 of 5 stars on the App Store. Great.
Pocket Guide Free app Users pay, worldwide footprint, local sourced content, 1 app for 1 city
Hungary No reviews found.
MyTours 1495/year or 145 per month
Users pays, offers licensing of the app as stand alone product.use
New Zealand No reviews found.
Field Trip Free app Information feed based on location, push notifications, free app
Everywhere 3 of 5 stars on the App Store. Moderate.

UGo Tour 14
Situational Analysis
Table of Contents
SUMMARY ............................................................................................................................................................. 15
ENVIRONMENTAL FACTORS .......................................................................................................................... 16
INDUSTRY ANALYSIS ........................................................................................................................................ 18
MARKET ANALYSIS .......................................................................................................................................... 23
COMPETITIVE BENCHMARKING .................................................................................................................. 26
VALUE CHAIN ANALYSIS ................................................................................................................................. 29

UGo Tour 15
Summary
The Situational Analysis for the UGo Tour app compiled by the members of Team 9 consists of
market research conducted on tourism in the form of mobile apps. The information following includes
environmental factors; a Porter’s Five, a value chain analysis, and a S.W.O.T. analysis as well as market
trends. The goal of this situational analysis is to gauge the potential success of UGo Tour in the tour app
industry.

UGo Tour 16
Environmental Factors
This section is used to discuss the economic, social, political and technological factors affecting the
UGo Tour app and how the creators will have to adapt to those factors. Within the following text is data
and information on the growth and impact these factors have had on applications similar to the UGo
Tour app.
Economic
With the US economy on an upward slope, people will be returning to old habits and doing more
traveling than they have in recent years. During the peak travel months last year, between 3 and 4
million people traveled throughout the United States.1 With gas prices on the low, people will again be
more willing to jump in the car and go on a road trip. From 2013 to 2014 travel to attractions statewide
increased by over 16%. Travel to State Parks increased by over 13% 2. With these trends, the economy
looks good for the UGo Tour to launch in the near future.
Social
Ever since the development of the smart phone, more and more apps have been added to the app
store at a quick rate. The problem seems to be in their staying power. Research shows that only 20% of
the apps submitted to the app store are considered to be successful.3 This means only 299,390 apps out
of 1,601,413 last and bring in revenue. With this second step into the market, UGo Tour is more
prepared and ready for the challenges it will face in the marketing of the app.
1 “Monthly Departures to International Destinations.” Monthly Departures to International Destinations. U.S. Department of Commerce, 20 Feb. 2015. Web. 16 Mar. 2015. 2 “Travel Tracker.” Travel Tracker. North Carolina Department of Commerce. 2015. Web. 16 Mar. 2015. 3 P. Hedgecock, personal communication, February 3, 2015.

UGo Tour 17
Political
The Federal Trade Commission (FTC) has regulations regarding the making and marketing of
apps. Truthful Advertising and Privacy are the main issues to consider. Things such as disclosing key
information and keeping your user data secure are some of the points highlighted by the FTC.4 Making
sure that the apps are properly licensed and keeping up with the regulations set forth are the most
pressing political factors.
Technological
Advances in technology will factor in to the capabilities and marketability of the app.
Technology has and continues to make advances which will impact the way that the app is used and will
need to be updated as the Apple and Android phones update. The thousands of apps that are created and
put in the app stores make for stiff competition and difficulty for the UGo Tour app. After years in
development, the UGo Tour creators are now prepared and have solutions to the past problems.
4 “Marketing Your Mobile App: Get It Right from the Start.” Marketing Your Mobile App: Get it Right from the Start. Federal Trade Commission, Apr.
2013. Web. 16 Mar. 2015.

UGo Tour 18
Industry Analysis
The graph below shows the correlation between resident’s income and the trips that those
residents take. The graph displays that the more money people make the more they are willing to travel.
This spike in travel will continue to increase every year as long as the economy continues to improve,
which will help to make the app successful both when it debuts and in the future.
x 5
5 "Industry Reports." Market Research Reports. IBIS World, n.d. Web. 09 Apr. 2015.

UGo Tour 19
6
Products and Services Segmentation
This graph above illustrates how most people go on tours. The data from the graph shows that
most people travel in a vehicle when they travel on tours, leading to the believe that UGO Tour should
focus on tours where travelers can experience the Great Smokey Mountains from the seat of a car.
6 "Industry Reports." Market Research Reports. IBIS World, n.d. Web. 09 Apr. 2015.

UGo Tour 20
7
Major market segmentation
The data in the above graph indicates that the majority of those that are traveling are between 18
and 50, followed by the group of adults ages 50 to 65. UGo Tour will need to focus on those two
segments of travelers and the things those individuals look for in a tour experience.
7 "Industry Reports." Market Research Reports. IBIS World, n.d. Web. 09 Apr. 2015.

UGo Tour 21
Tourism's Economic Impact on Western North Carolina, 2012 This shows all the counties in Western Carolina and how much tourists spent in them in 2012. This is very helpful for the company because it shows the counties that had the most profit from tourists and how much taxes were generated from the tourist’s spending. With this chart the company can target the counties that spend the most.
County in Western NC
Tourist Spending in the County ($ Millions)
% Change in tourist spending 2012 over 2011
Worker Paychecks Generated by Tourism ($ Millions)
Direct Jobs Generated by Tourism
NC State Taxes Generated by Tourism ($ Millions)
Local County Taxes Generated by Tourism ($ Millions
Alleghany Co.
$21.94 1.5% $3.78 180 $1.02 $1.42
Ashe Co. $46.55 2.7% $6.58 370 $2.34 $2.45 Avery Co. $103.73 5.4% $22.78 1,190 $5.08 $4.46 Buncombe Co.
$834.24 6.5% $174.71 9,360 $41.59 $27.41
Burke Co. $80.46 2.5% $11.21 620 $4.36 $2.26 Caldwell Co. $46.54 3.8% $6.72 330 $2.47 $1.40 Cherokee Co.
$35.33 4.2% $5.17 290 $1.64 $2.07
Clay Co. $12.29 5.5% $1.29 60 $0.50 $1.32 Cleveland Co.
$92.44 4.8% $12.81 650 $5.28 $1.57
Graham Co. $24.84 4.7% $4.12 260 $1.14 $1.59 Haywood Co.
$126.35 4.9% $23.71 1,310 $6.35 $5.04
Henderson Co.
$218.44 4.3% $37.81 1,960 $9.72 $9.42
Jackson Co. $69.55 4.1% $11.04 580 $3.07 $5.31 Macon Co. $135.76 7.6% $22.63 1,150 $5.97 $10.72 Madison Co.
$32.22 5.3% $6.01 310 $1.62 $1.44
McDowell Co.
$49.06 3.2% $7.05 390 $2.52 $1.73
Mitchell Co. $20.96 2.3% $3.06 160 $0.90 $0.88 Polk Co. $22.63 4.0% $3.11 170 $1.15 $1.24 Rutherford Co.
$149.69 5.6% $20.39 1,150 $8.66 $4.36
Surry Co. $107.06 4.4% $14.92 770 $5.78 $2.23

UGo Tour 22
Swain Co. $293.06 4.5% $79.75 3,340 $16.73 $6.12 Transylvania Co.
$80.92 4.7% $14.08 720 $3.07 $3.63
Watauga Co.
$210.99 6.8% $44.71 2,490 $10.33 $8.08
Wilkes Co. $63.55 2.0% $8.95 490 $3.06 $1.51 Yadkin Co. $32.38 3.4% $5.34 320 $1.70 $0.77 Yancey Co. $31.69 2.1% $4.94 230 $1.39 $2.20 8
8 “The Economic Impact of Travel on North Carolina Counties, 2012.” This study was prepared for the North Carolina Division of Tourism, Film, and Sports Development by the U.S. Travel Assosication.

UGo Tour 23
Market Analysis
Porter’s Five
Porter’s 5 Forces is a scale that is used to determine the favorability and competitiveness within a
market. Based on eight different factors, there is a total score and an average that gives a sense of how
the company stacks against the competition in its particular industry. The more favorable, the better the
likelihood there is that it will stay afloat and prosper among its competition. Using the five factors, it
was determined that the company has the potential, given they separate themselves through product
differentiation, to prosper in the app industry. The chart provided below indicates how UGo Tour stands
currently.
Market Analysis Chart
With a total score of 44 and an average of 5.5, it can be concluded that UGoTour is somewhat
favorable in the market analysis. While there is room for potential and growth in this market, the largest
threats to UGoTour are the amount of competitors (the amount of substitutes), and fragmented
customers. Since UGoTour is only limited to the Western North Carolina Region, it excludes all
PORTER'S FIVE MARKET ANAYLSIS Company Name: E-Commerce Business Solutions, LLC RATING 10-1 (FAVORABLE TO UNFAVORABLE) FEW COMPETITORS 7 PRICE-BASED COMPETITORS 3 LOW ENTRY BARRIERS 5 FEW NEW ENTRANTS 4 FEW SUBSTITUTES 8 MANY CUSTOMERS 7 FRAGEMENTED CUSTOMERS 9 FEW SUPPLIERS 4
TOTAL SCORE 44 AVERAGE 5.5

UGo Tour 24
potential customers that may be in the near or surrounding areas. Although UGo Tour only has a 5.5
average, the company will conduct a Quadratic Survey which will be provided in order to understand the
market better.
Barriers to Entry Checklist Level Competition High Concentration Low Life Style Stage Mature Capital Intensity Medium Technology Change Medium Regulation & Policy Medium
Barriers to Entry
Barriers to entry in the Sightseeing Industry are moderate with the exception of concentration,
which is rated low, and competition which is rated high. Everything else scored either a medium or
mature level. Competition is vast in this industry since sightseeing depends on the current location,
which overall determines the relevance of the application being used by the consumer. The technology
that is used to amplify the tourism experience is quite young. The company is still in the production
stages of completing the UGo Tour app. This can been seen as an advantage, since the company can
compare the current status of the product in relation to that of their competitors.
UGo Tour 25
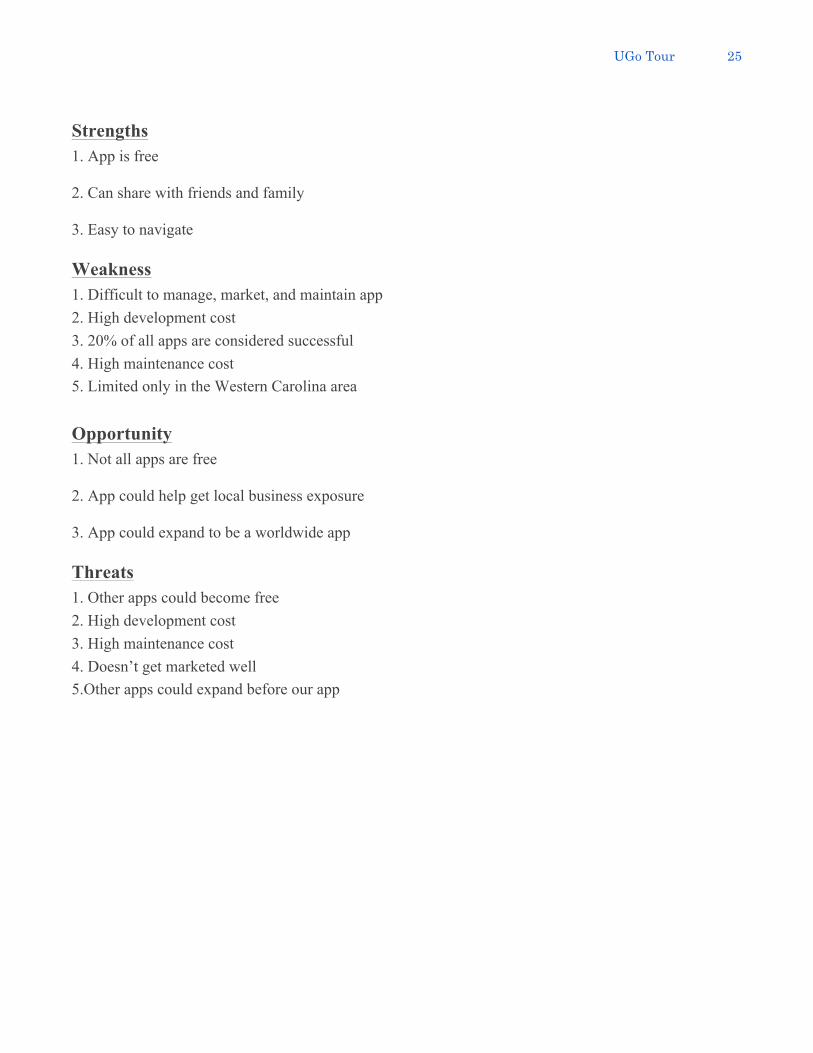
Strengths 1. App is free
2. Can share with friends and family 3. Easy to navigate
Weakness 1. Difficult to manage, market, and maintain app 2. High development cost 3. 20% of all apps are considered successful 4. High maintenance cost 5. Limited only in the Western Carolina area Opportunity 1. Not all apps are free 2. App could help get local business exposure 3. App could expand to be a worldwide app
Threats 1. Other apps could become free 2. High development cost 3. High maintenance cost 4. Doesn’t get marketed well 5.Other apps could expand before our app

UGo Tour 26
COMPETITIVE BENCHMARKING Critical Success9
1. COMPANY NAME:
2. COMPANY NAME:
3. COMPANY NAME:
4. COMPANY NAME:
Factors (1-5) UGo Tour
Chimani Great Smokey Mountains
National Park
Official Great Smokey National
Park
Visit Gatlinburg Tennessee
Profit 1 3 5 3 Labor 4 4 5 4
Purchases 3 1 5 4 Rent and Utilities
2 2 4 5
Depreciation 1 2 3 3 AVG 2.2 2.4 4.4 3.8
STRENGTH - Free app - Free app,
already available
- Doesn’t require a cellular signal to work
- Works on all Apple devices
WEAKNESS - Still in
development stages
- Requires internet connection (Wi-Fi or Cellular)
- Too expansive, hard to navigate
- Limited to only Gatlinburg Tennessee
- - - - *Based on IBIS World or other databases; or, a survey of the client’s customers; or, from the client
Competitive benching is another tool that evaluates the factors, strengths, and weaknesses of a company.
They take the five most important factors that are the most common in the industry and are given a score
between one through five, then averaged out. This is according to IBIS World, which include profit,
labor, purchases, rent and utilities, and depreciation. The table above displays these factors, strengths,
and weaknesses of each and how they compare to the competition.

UGo Tour 27
Chimani Great Smokey Mountains National Parks This was among the weakest out of all the competitors. Their main focus is just the Great Smokey
Mountains. While the app is self sufficient, its lacks any sort of content of local attractions or tourism
spots that UGo Tour wants to utilize in their tourism experience. It is very straightforward with little
room for a customized experience for the user.
Official Great Smokey National Park Similar to the Chimani Great Smokey National Pars app, they only focus on the Smokey Mountains as
well. They are more diversified in the sense that you can actually donate, volunteer, or partner with the
park. However their application is very dependent on having an internet connection to work, which if
often impossible to have in the wilderness.
Visit Gatlinburg Tennessee
This competitor is the most similar to the UGo Tour app. However, it is limited to Gatlinburg,
Tennessee instead of the entire Western North Carolina Region. It does not focus on tours necessarily,
but rather the actual town itself instead of outdoor parks, trails etc. The app is difficult to navigate due to
the expansive content and lack of variety that it could be potentially used for. That is the target market
the UGo Tour app is trying to solve.
UGo Tour 28
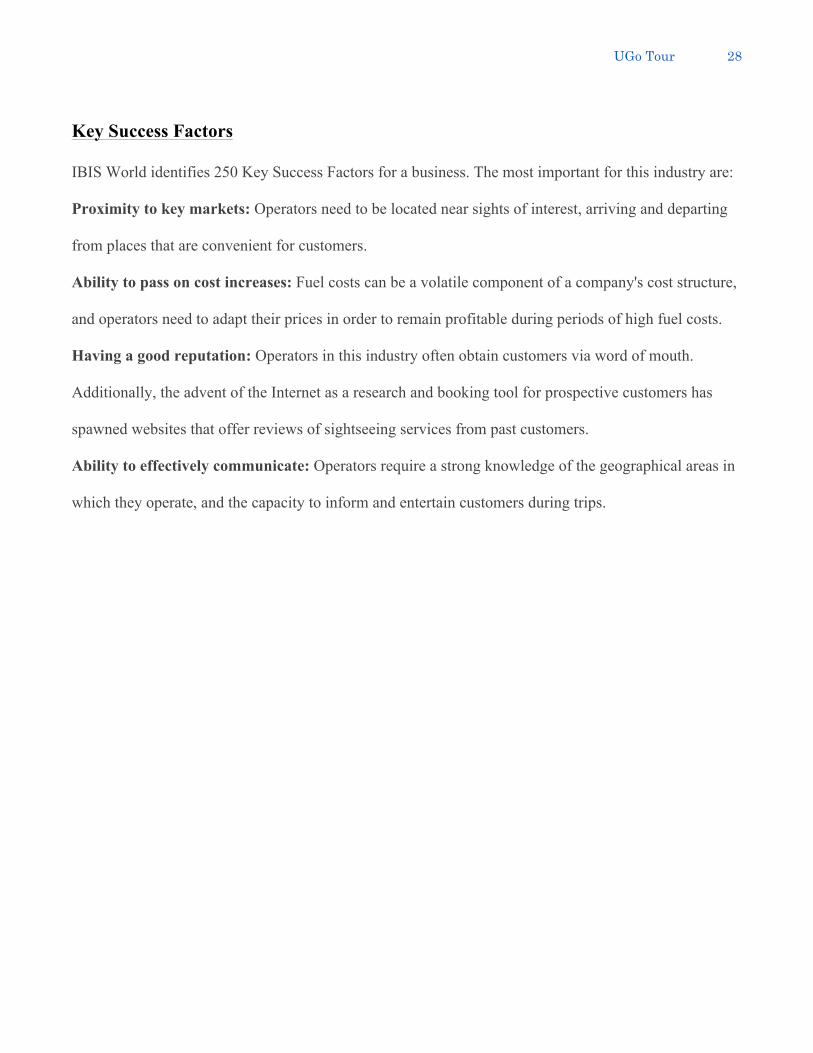
Key Success Factors IBIS World identifies 250 Key Success Factors for a business. The most important for this industry are:
Proximity to key markets: Operators need to be located near sights of interest, arriving and departing
from places that are convenient for customers.
Ability to pass on cost increases: Fuel costs can be a volatile component of a company's cost structure,
and operators need to adapt their prices in order to remain profitable during periods of high fuel costs.
Having a good reputation: Operators in this industry often obtain customers via word of mouth.
Additionally, the advent of the Internet as a research and booking tool for prospective customers has
spawned websites that offer reviews of sightseeing services from past customers.
Ability to effectively communicate: Operators require a strong knowledge of the geographical areas in
which they operate, and the capacity to inform and entertain customers during trips.

UGo Tour 29
Value Chain Analysis
A value chain analysis is used to determine what a company does that makes their product or service
valuable in the eyes of their customers. The expertise and determination of the developers behind the
UGo Tour app are what will make this app valuable to customers of the app.
A valuable source for the UGo Tour app is the two men behind the app. Paul Hedgecock is the President
and founder of E-Commerce Business Solutions, the company behind the UGo Tour app. Mr.
Hedgecock has put in many hours fixing and fine tuning the intricacies in the app to assure that it will be
a success with its users. The Chief Executive Officer of E-Commerce Business Solutions, Andrew
Cerillo has the experience to in management consulting to help this project move along. Mr. Cerillo has
previously worked with big names such as Goldman Sachs and Diamond Management & Technology.
The biggest advantage that UGo Tour app has to help them be successful is the amount of research and
development that has been put into the 2.0 version. Mr. Hedgecock has looked into the many different
services and venues that will be able to make the app desirable. By partnering with the Department of
Transportation the company has tapped into an unending amount of information and resources on the
many possible routes and tour stops along the Great Smoky Mountains. With demographics on the
success rate of apps among Apple and Android users as well as developments into new versions, the
men behind UGo Tour are more prepared than ever.
Finally, a great source of value for the UGo Tour app is the ability for users to share their adventures
and outings on social media. The use of social media today is one of the most important parts of peoples
lives. Whether its Facebook, Twitter, Instagram or all three, people want to share what they’re doing and
UGo Tour 30
where they’re going. By UGo Tour having this capability, users will be more likely to pick the app over
other similar apps.
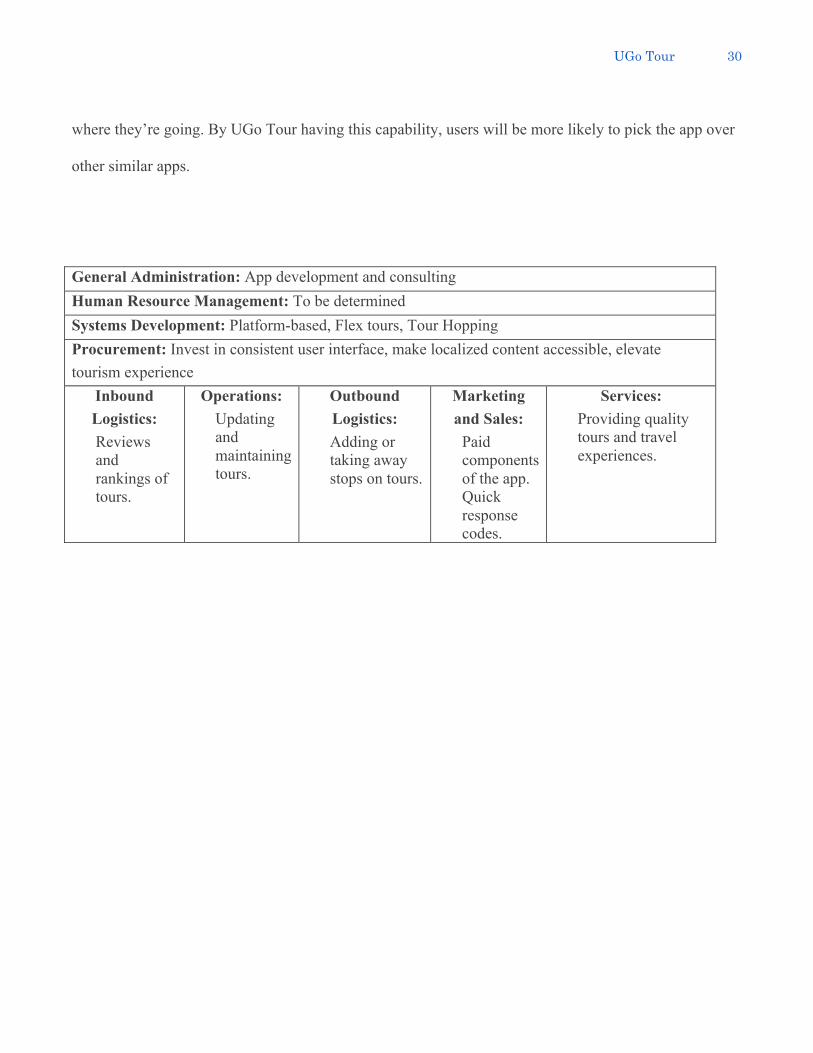
General Administration: App development and consulting Human Resource Management: To be determined Systems Development: Platform-based, Flex tours, Tour Hopping Procurement: Invest in consistent user interface, make localized content accessible, elevate tourism experience
Inbound Logistics: Reviews and rankings of tours.
Operations: Updating and maintaining tours.
Outbound Logistics: Adding or taking away stops on tours.
Marketing and Sales:
Paid components of the app. Quick response codes.
Services: Providing quality tours and travel experiences.

UGo Tour 31
Recommendations
Social Media
There is no one specific form of social media that can be defined as the “best” platform for promoting
the UGo Tour app because, the “best” platform depends on the demographic. The younger generations
will be more inclined to post on Twitter and Instagram and though they will likely use Facebook it is the
older generations that would use Facebook as a first and only form of social media. Also, no two social
media sites are the same, therefore they can all be utilized differently in becoming effective marketing
tools. According to Simply Measured, which is a social analytical site that projects and evaluates all of a
company’s social activities. Some of the features included are audience insight, content and campaign
performance, as well as brand and hashtag monitoring. Simply Measured also includes free guides, a
demo, and a free trail to get this information. The chart below describes the top eight social media
platforms and where they are each the most advantageous.

UGo Tour 32
Form of Social Media
Who Uses It What to Share Post Frequency Useful Tools
Twitter Everyone Start, join and lead conversations. Interact directly with brands and customers.
Multiple times per day.
Buffer.
Instagram Lifestyle, food, fashion, personalities and luxury brands.
Share visual content, including short videos (less than 15 seconds).
One a day. Hashtag, Facebook, Tumblr, Twitter.
LinkedIn Businesses; recruiters and job seekers.
Job-postings, company descriptions, employer/employee research.
Two to four times a week.
Google search.
Facebook Everyone. All types of online content, events, ads.
Once or twice a day. Bitly.
Google+ Brands already on the other major social networks;B2B network bloggers.
More formal and professional than Facebook; Hashtags have major search value.
Once or twice a day. Google Authorship.
YouTube Brands with video content and ads, anyone giving explanations or sharing expertise.
Short (less than 1.5 minutes) video content.
Once or twice a week. Subscription Widget/Link.
Pinterest Fashion, food, design, travel and anything DIY; audience skews female by 4:1.
Creative, visual content.
Multiple times per
day.
Attribute pins.
Yelp/Foursquare B2C companies, brick-and-mortar outlets (especially stores, restaurants, and travel/tourism related), reviewers and bloggers.
Location-based business search and review.
Weekly. Blog or personal website.

UGo Tour 33
In terms of reaching out to the greatest number of customers at once, Facebook and Twitter are
the two strongest platforms to utilize at this point. Facebook has an estimated 1.2 billion users (more
than any other social media website). Facebook is the best for sharing content such as events, ads, and
promotional material. Also, when a user likes a Facebook page, others are more likely to see it while
scrolling through news feeds. Using Facebook will allow UGo Tour to track where their heaviest traffic
is coming from (age range, region, time of day etc.) 10
Twitter is the second best form of social media, next to Facebook. It estimates at 310 million
active users. Anybody can use Twitter, and it has the best personal interaction with customers. With
Twitter, UGo Tour can personally send private messages to users or reply to them in a public tweet if
they desire. The single greatest advantage that Twitter has above over all social media is that, due to the
high amount of traffic, it’s easiest to tweet multiple times a day and often times users will tweet several
times within a 24 hour period.11
Instagram is becoming one of the most widely used social media platforms in the last couple of
years. They fall right behind Twitter at 300 million active users. When somebody posts a picture or a
video to Instagram, it can be shared on other social media platforms as well. Instagram is a great tool for
users to upload their tour experience with a picture or video that lasts up to 15 seconds. In addition with
the hashtag feature, similar to Twitter, Instagram users can also search for others who are using the UGo
Tour app. A user can also link their social media accounts including Facebook, Twitter, and Tumblr. By
posting a single picture or video, the post will be sent to all these forms of social media.12
10 “Top 15 Most Popular Social Networking Sites” March 2015. EBiz. Web. 20 Apr. 2015. 11 “Top 15 Most Popular Social Networking Sites” March 2015. EBiz. Web. 20 Apr. 2015. 12 "130+ Amazing Instagram Statistics (April 2015)." DMR. N.p., 06 Mar. 2014. Web. 20 Apr. 2015.

UGo Tour 34
Social Adoption
People get on social media at different times of day. This is something that could be very beneficial to
the UGo Tour app. You want to be able to promote the business when people are on social media the
most. Studies have shown that people share the most on Facebook around 9AM-11AM and 12PM,
Twitter was 10 AM-12PM, LinkedIn was 10AM and 2PM, and Pinterest was 3PM and 8PM. This shows
that people usually share and post status/tweets in the morning when they are on their way to work or
just getting up in the morning. People are more likely to get on Pinterest at night after work to share and
post.
Facebook Twitter LinkedIn Pinterest
Shares 9AM-11AM, 12PM 10AM-12PM 10AM, 2PM 3PM, 8PM
Clicks 3PM-5PM 3PM-5PM 1PM-2PM 8PM-10PM 13 Studies have also found that there are days of the week that people are more likely to share and post than
others. Facebook users posted and shared more on Thursdays at 9AM-12PM than any other day. Twitter
users posted and shared more on Fridays at 2PM-3PM than any other day. LinkedIn users posted and
shared more on Tuesdays at 10AM-11AM than any other day. Pinterest users posted and shared more on
Wednesdays at 1PM-2PM than any other day. This helps UGo Tour understand what days are best to
share information about the app and what days people will be frequently using social media to share new
ideas.
13 www.addthis.com

UGo Tour 35

UGo Tour 36
App Adoption
The following chart shows how people come about an app and how that influences consumers to
purchase or download the app for free.
14
14 European Technographics Consumer Technology Online Survey, Q4 2012.

UGo Tour 37
Though the data is from a survey given in 2012 the information is still relevant in that today people are
still influenced by the same things. With the information from the data, it is likely that people are
downloading these apps before they will ever use them. They see that someone whose opinion they
value likes the app and the customer then downloads the app with the idea that one day it will be helpful
to the customer. In the article this chart derived from, the author notes that advertisements and the media
only influence less than 7% of those who download apps in what they download.15 They best an app can
do is to have a positive and prominent presence on the App Store. The article listed the top four
influencers of app downloads to be browsing, recommendations from friends, social networks and
online browsing. This makes it ever more important for UGo Tour to be seen on Facebook, Twitter,
Instagram and to be endorsed by other customers.
Survey Results
In a survey distributed to individuals between the ages of 21 and mid to early fifties, the findings were
the following: When asked how often they travel to the Western North Carolina or Great Smokey
Mountain area, half of the respondents said they visited the area two to three times a year or more. Fifty-
seven of the sixty-three people surveyed said that they would use an app like the UGo Tour app. People
surveyed however, were overwhelmingly unlikely to purchase items such as a QR scanner but they
would use them if the option to use the add-on were free. Those surveyed would want to know more
about a particular site if it were to have a historical significance, but again they wouldn’t want to pay for
the extra information. If UGo Tour was to have additional features for purchase, surveyors valued them
at no more than 99 cents. Most of the survey participants visit Asheville, Boone, or Cherokee and they
spend their time doing some sort of outdoor activity and not in shops or restaurants. Finally, the majority 15 Froment, Etienne. "Why Do People Download Your App?" Apptweak. AppTweak, 24 May 2013. Web. 21 Apr. 2015. <https://www.apptweak.com/learn/why-do-people-download-your-app/>.

UGo Tour 38
of those surveyed visit the Great Smokey Mountain area in the Spring/Summer months or in the Fall.
Marketing to winter activities and places where there are little to know outdoor attractions would not be
cost effective. Though people visit shops and restaurants while in the area, they are there for the hiking,
biking, rafting, and scenic attractions. The majority of the survey participants were 30+ years old and so
it is important to note that the data is skewed toward women and men out of school and in the work
force. Many of whom have spouses and children. Overall our team recommends that this data be used
not to eliminate aspects but to emphasize more promotion towards those that were the most popular.

UGo Tour 39
Appendix A: Sources
European Technographics Consumer Technology Online Survey, Q4 2012.
Froment, Etienne. "Why Do People Download Your App?" Apptweak. AppTweak, 24 May 2013. Web.
21 Apr. 2015. <https://www.apptweak.com/learn/why-do-people-download-your-app/>.
"Industry Reports." Market Research Reports. IBIS World, n.d. Web. 09 Apr. 2015.
“Marketing Your Mobile App: Get It Right from the Start.” Marketing Your Mobile App: Get it Right
from the Start. Federal Trade Commission, Apr. 2013. Web. 16 Mar. 2015.
“Monthly Departures to International Destinations.” Monthly Departures to International Destinations.
U.S. Department of Commerce, 20 Feb. 2015. Web. 16 Mar. 2015.
“P. Hedgecock, Personal Communication, February 3, 2015.”
“The Economic Impact of Travel on North Carolina Counties, 2012.” This study was prepared for the
North Carolina Division of Tourism, Film, and Sports Development by the U.S. Travel
Assosication.
“Top 15 Most Popular Social Networking Sites” March 2015. EBiz. Web. 20 Apr. 2015
“Travel Tracker.” Travel Tracker. North Carolina Department of Commerce. 2015. Web. 16 Mar. 2015.
"130+ Amazing Instagram Statistics (April 2015)." DMR. N.p., 06 Mar. 2014. Web. 20 Apr. 2015.

UGo Tour 40
Appendix B: Survey and Results
1. How often do you travel to areas in and around the Great Smokey Mountains? # Answer
Response % 1 Never
7 11%
2 Less than Once
a Month
10 16%
3 Once a Month
8 13%
4 More than 2-3
Times a Year
17 27%
5 Once a Year
8 13%
6 2-3 Times a
Year
13 21%
Total 63 100%
2. Would you use an app designed to give you tours of different places in the area?
# Answer
Response % 1 Yes
57 90%
2 No
6 10%
Total 63 100%
3. Would you pay for extra features in the app that provided more information about sites with
historical significance? # Answer
Response % 1 Yes
19 30%
2 No
44 70%
Total 63 100%
4. What do you think the value of the feature would be?
# Answer
Response % 1 .99
41 68%
2 1.99
17 28%
3 2.99
2 3%
Total 60 100%

UGo Tour 41
5. Would you want to be able to share your travels on the app with social media? # Answer
Response % 1 Yes
48 76%
2 No
15 24%
Total 63 100%
6. Would you use a Quick Response Scan found at locations to learn more about where you are?
# Answer
Response % 1 Maybe
24 38%
2 Yes
33 52%
3 No
6 10%
Total 63 100%
7. Would you like the option of creating your own tour of a certain spot?
# Answer
Response % 1 Depends
18 29%
2 Yes
31 49%
3 No
14 22%
Total 63 100%
8. Where are your favorite places to visit in the Smokey Mountain/Western North Carolina area?
# Answer
Response % 1 Cashiers/Highlands
15 24%
2 Brevard
6 10%
3 Cherokee
31 49%
4 Pisgah National
Forest
13 21%
5 Nantahala
River/Area
16 25%
6 Gatlinburg
28 44%
7 Blue Ridge
Parkway
38 60%
8 Asheville
38 60%
9 Boone
27 43%
9. What time of year do you visit the area?
# Answer
Response % 1 Spring/Summer
34 54%
2 Winter
1 2%
3 Fall
28 44%
Total 63 100%
UGo Tour 42
10. What places do you visit the most in the area? # Answer
Response %
1
Outdoors
(waterfalls,
rafting, hiking,
skiing, etc)
40 63%
2 Shops
31 49%
3 Restaurants
22 35%

UGo Tour 43
Appendix C: IBIS World Reports