uk downstream oil infrastructure - uk p i a
TRANSCRIPT

www.woodmac.com
Delivering commercial insight to the global energy industry
UK Downstream Oil Infrastructure
Final Report

Delivering commercial insight to the global energy industry
www.woodmac.com
Final Report 8th June
Executive Summary – Key Conclusions (1)
Since the 1970s low returns and weak demand growth has led to a lack of discretionary investment in UK downstream infrastructure and industry consolidation
• Most investment has been to comply with regulatory requirements (e.g. HSE, fuel quality standards, petrol vapour recovery), with a number of terminals closing due to the amount of investment required to achieve compliance
Limited investment has been made by independent storage companies and traders but these have been largely confined to coastal import terminals rather than inland logisticsIncreasing regulatory constraints (including those relating to planning consents, RTFO costs, and ‘Containment Policy’) are forming a barrier to investment in new infrastructure
• Capital budgets are constrained and expenditure required for ‘stand still’ investment limits the potential for discretionary spend
The main incentive to invest is potential financial return. However, the lack of market growth and the competitive nature of the market constrain these returns in the UK. Thus, other incentives may be required to ensure future supply resilience (which we define as the ability of the supply infrastructure to deal with unexpected disruption at one or more locations)Aside from a small number of regional pinch points as identified in this report, we assess that current product storage & logistical capacity is adequate to meet current and future demand for ground fuels, although levels of supply resilience are now lower than pre-Buncefield disasterThe key issue is how to sustain the current logistical capacity given the lack of investment over a long period of time. While the Containment Policy mandates investment in terminals, changes in land use/planning policy threaten the continued operation of some existing facilities. The threat is that these policies will lead to the closure of a significant number of facilities (e.g. terminals less than 50,000m3). This could affect those regions most dependent upon supply from small depots, e.g. Highland & Islands, by extending delivery distances and reducing the number of alternative supply points
2

Delivering commercial insight to the global energy industry
www.woodmac.com
Final Report 8th June
Our assessment of infrastructure needs concludes that for:Coastal infrastructure:
• While we do not expect that a material increase in import/export storage capacity will be required to handle the increased future product flows, there could be constraints at different locations primarily related to jetty capacity, road/rail loading facilities or pipeline capacity
• In our view, therefore, while some infrastructure investment will be required this is likely to be incremental at existing sites e.g. construction of new tanks to provide more operational flexibility – we believe that this will be built
Inland infrastructure:• Jet fuel imports to supply the London airports appears to be the most significant potential ‘pinch point’ which could require
• Investment in new import infrastructure along the Thames or at Bristol (we have no information regarding the current utilisation of these facilities). • Investment in new pipeline capacity to both Heathrow and Stansted and regional airports to transfer fuel inland from import points• Investment in new inland storage capacity to provide operational flexibility between product supply and demand offtake
In the oil product demand scenarios we assess that the additional infrastructure needed is:In the Base Case:
• Infrastructure to supply aviation jet fuel to Heathrow and Stansted airports to meet future demand growth – we believe this will be built. For example, the British Pipelines Agency (BPA) have recently submitted a planning application for additional jet fuel storage at Buncefield which would re-establish jet fuel supply through the West London Pipeline to 95% of its pre-Buncefield disaster level
• Some additional capacity to improve supply resilience in South West – Greenergy is already investing in Plymouth but other investment is less certain
• Investment in import facilities needed at Grangemouth. We believe this currently seems unlikely, given current refinery ownership and lack of space at NuStar
In the Low Case:• Some additional import capacity will be needed to replace potential refinery closures but as all refineries bar Stanlow are on the coast we
would assume that any refineries that are closed are turned into import terminals
In the High Case:• Additional import capacity will be required in London/South East, East of England, South West, and Scotland – this will only be built once
investors are confident that the demand expectations are realistic - which will probably be too late!
Executive Summary – Key Conclusions (2)
!3

Delivering commercial insight to the global energy industry
www.woodmac.com
Final Report 8th June
Executive Summary – Key Conclusions (3)
Actions that we believe could be taken to improve the market framework and benefit investment are:
• Proportionate implementation of the ‘Containment Policy’ requirements for smaller oil terminals• Would reduce the ‘stand still’ investment burden at these facilities and the likelihood of their closure. Therefore could have a
significant impact at no cost to government• Freight Facilities Grant (FFG) Scheme
• Extend the scope of this grant, designed to provide financial assistance to invest in schemes that would take freight off the roads to either rail or water borne transport, to include pipelines
• RTFO – maintain the duty incentive on bio-fuels to mitigate the investment requirements as well as the additional costs arising from high and volatile bio-fuel feedstock prices
• Would be a financial cost to government, but would create a clearer incentive and support investment by suppliers• Move the excise duty point down the supply chain to the oil terminal
• A ‘one off’ cost to government, unlikely to have a short term impact due to the tightness of existing storage capacity, but would encourage future investment in additional storage capacity outside of the refineries.
Actions that we believe could be taken to improve supply resilience are:• Change the remit of the Government Pipeline & Storage System (GPSS) to include ‘national resilience’
• No cost to government, but would provide the framework within which use of the system could be optimised. There is significant potential for the underutilised storage capacity and associated logistics to provide brown field investment opportunities
• Create a CSO agency to hold compulsory stocks at strategic locations• No cost to government – should be self funding through an additional tax levy – but would provide the possibility for holding
more stocks near key demand centres. This envisages the CSO agency having a supply resilience remit rather than purely cost optimisation
4

Delivering commercial insight to the global energy industry
www.woodmac.com
Final Report 8th June
Executive Summary – Responses To Key Questions
Market framework• What are the main economic factors that underpin downstream investment decisions and what are key drivers of
downstream infrastructure investment in the UK?• The main economic factors and key drivers are: expectations for supply/ demand, downstream margins, and regulation. Lack
of demand growth, generally poor margins and more attractive overseas opportunities have resulted in little UK discretionary investment, so the recent key investment driver has been compliance with regulatory requirements
• What incentives does the UK regulatory framework place on infrastructure (such as pipelines and terminals) owners and operators to ensure that they provide adequate and timely investment?
• The ‘Freight Facilities Grant’ scheme provides some incentive to invest in means of transport other than road (i.e. rail and water borne transport), although at present it does not extend to pipelines. Aside from this there are no other financial incentives to invest
• What are the penalties different market players throughout the supply chain face should they fail to provide adequate capacity?
• There is no social obligation on any player to supply so the penalties are all of a commercial nature, e.g. loss of market share, damage to brand reputation, higher supply costs (hiring third party facilities etc.)
• Are there particular sections of the supply chain that do not face adequate incentives/penalties?• In overall terms, investment has largely been driven by ‘stay in business’ considerations or ‘stand still’ regulatory requirements• Over recent years we do not see any particular part of the supply chain being more disadvantaged but the new ‘Containment
Policy’ does represent a further barrier to investment in product storage capacity and this could prevent adequate capacity being put in place in future
5

Delivering commercial insight to the global energy industry
www.woodmac.com
Final Report 8th June
Executive Summary – Responses To Key Questions
Market framework (contd.)• Does the regulatory framework ensure that new entrants can have access to capacity and/or invest in new
capacity?• In terms of access, no it doesn’t – because although in theory new entrants have freedom of access to infrastructure, in
practice this is dependent upon the agreement of the existing owners/ operators of that infrastructure• On investment in new capacity, yes it does – subject to the normal planning process in which new entrants would not be dealt
with any differently to incumbent players
• Are there are any actions that could be taken to improve the current framework and what are their associated costs and benefits?
• Proportionate implementation of the ‘Containment Policy’ requirements for smaller oil terminals• Would reduce the ‘stand still’ investment burden at these facilities and the likelihood of their closure. Therefore could
have a significant impact at no cost to government• Freight Facilities Grant (FFG) Scheme
• Extend the scope of this grant, designed to provide financial assistance to invest in schemes that would take freight off the roads to either rail or water borne transport, to include pipelines. Would be a financial cost to government
• RTFO – maintain the duty incentive on biofuels to mitigate the investment requirements and additional costs arising from high and volatile bio-fuel feedstock prices
• Would be a financial cost to government, but would create a clearer incentive and support investment by suppliers• Move the excise duty point down the supply chain to the oil terminal
• A ‘one off’ cost to govt, unlikely to have a short term impact due to the tightness of existing storage capacity, but would encourage future investment in additional storage capacity outside of the refineries
6

Delivering commercial insight to the global energy industry
www.woodmac.com
Final Report 8th June
Executive Summary – Responses To Key Questions
Market framework (Contd.)• Will the UK market and regulatory framework produce any necessary downstream oil infrastructure requirements
or will the risks to future security of supply increase?• Should current market and investment trends continue a growing lack of resilience in the UK downstream oil supply chain will
become increasingly evident, so the risks will increase. Small depots and terminals which do not meet new COMAH requirements may not attract the required investment and will close. This will put more pressure on the key, hub locations and implies longer delivery distances and an extended supply chain, that may be more vulnerable to disruption. More remote parts of the UK (e.g. in Scotland) may be particularly affected. The eventual introduction of biofuel grades B10/E10 may require investment in provision for a fourth fuel grade on retail service station forecourts to preserve availability of E5 gasoline availability for those older vehicles unable to use E10
• Are there any pending regulations UK or EU which could impact on the level and type of UK investment?• Regulatory requirements have been and will continue to be a major driver of investment in the downstream oil industry. In the
near term in the UK, two key policy drivers will be:• RTFO - will force incremental investment in biofuel blending• Containment Policy - will have a major bearing on future investment in UK storage• Changes in UK compulsory stocking obligations - revision of EU Directive 2006/67/EC
• Are there any structural changes that are likely to occur in the UK downstream oil market?• We believe that further consolidation is inevitable and it is possible that one or more major players in the UK downstream
could consider an exit (particularly those with more attractive opportunities elsewhere in their global portfolios). This will result in a more concentrated market structure and the possibility that certain regions will become dominated by a diminishing number of fuel suppliers
• The weak outlook for the global refining market may also challenge the continued existence of refineries lacking competitive advantage. In the longer term the IMO (MARPOL VI) proposals concerning marine bunker fuels pose a very serious challenge to refinery owners, if implemented as currently proposed
7

Delivering commercial insight to the global energy industry
www.woodmac.com
Final Report 8th June
Executive Summary – Responses To Key Questions
Barriers to Investment • Are there any constraints/barriers to investment in the UK downstream oil supply chain? What are these barriers
to investment and how will these barriers evolve over time?• Key constraints can be grouped into
• Market constraints – low margins and returns from UK investment both historically and in the future• Regulatory barriers – planning constraints, ‘Containment Policy’, RTFO costs
• Is the current market framework robust to deal with future challenges (demand changes)?• No, because current policies could lead to capacity closures while there is also a lack of incentive to invest in new facilities –
meaning the current market framework is becoming increasingly fragile in terms of its capacity to deal with sudden changes or supply disruptions. Longer delivery distances, fewer suppliers, a smaller number of key terminals and/or alternative supply points increases the risks of potential supply disruption
• What possible actions might be taken to mitigate those barriers and what would be the associated costs and benefits?
• The same actions as mentioned above to improve the current market framework• Change the remit of the Government Pipeline & Storage System (GPSS) to include ‘national resilience’
• No cost to government, but would provide the framework within which use of the system could be optimised. There is significant potential for the underutilised storage capacity and associated logistics to provide brown field investment opportunities
• Create a CSO agency to hold compulsory stocks at strategic locations• No cost to government – should be self funding through an additional tax levy – but would provide the possibility for
holding more stocks near key demand centres. This envisages the CSO agency having a supply resilience remit rather than purely cost optimisation
8

Delivering commercial insight to the global energy industry
www.woodmac.com
Final Report 8th June
Executive Summary – Responses To Key Questions
Financial Crisis• What are the future implications of the current financial crises on investment in the UK downstream fuel supply
chain, both in the short and longer-term?• We expect this to have only a limited impact on the UK downstream oil sector
• In the shorter term will further discourage investment
• In the longer term could lead to an acceleration of the consolidation process
9

Delivering commercial insight to the global energy industry
www.woodmac.com
Final Report 8th June
Executive Summary – Responses To Key Questions
Supply Infrastructure• Will current and projected supply infrastructure in the UK be able to meet demand under the developed
scenarios?• In overall terms in the Base Case, growth in road diesel demand is balanced by declining gasoline and heating oil
consumption. Therefore, we believe that in terms of the capacity of the current inland logistical infrastructure and product grade mix, the supply and distribution of ground fuels does not represent a future stress point
• However, in future the UK will experience a growing surplus of gasoline and a growing deficit of diesel. This will lead to increased import/export product flows and utilisation of logistics infrastructure along the coast
• While we do not expect that a material increase in import/export storage capacity will be required to handle the increased future product flows, there could be constraints at different locations primarily related to jetty capacity, road/rail loading facilities or pipeline capacity
• So in our view while some infrastructure investment will be required, this is likely to be incremental at existing sites e.g. construction of new tanks at existing sites to provide more operational flexibility and supply resilience
• Jet fuel imports to supply the London airports appears to be the most significant potential ‘pinch point’ which could require• Investment in new import infrastructure along the Thames or at Bristol (we have no information regarding the
current utilisation of these facilities)• Investment in new pipeline capacity to both Heathrow and Stansted airports• Investment in new inland storage capacity to provide operational flexibility between product supply and
demand offtake (such as the BPA application to increase jet fuel storage at Buncefield)• In addition we believe that the two regions where additional investment may be warranted to guarantee future import flows are
Scotland (jetty capacity at Ross Storage and/or Grangemouth) and the South West (e.g. expansion of storage capacity in Bristol)
• Investment in new pipeline capacity to supply Birmingham and East Midlands airports will also be required
10

Delivering commercial insight to the global energy industry
www.woodmac.com
Final Report 8th June
Executive Summary – Responses To Key Questions
Supply Infrastructure (Contd.)• Will current and projected supply infrastructure in the UK be able to meet demand under the developed
scenarios? (contd.)• In the High Case, the national import requirement for gas/diesel oil and jet/kero grows faster and throughout the period to
2030• All regional markets become increasingly deficit • This will put pressure on the current supply patterns from UK refineries to their inland hinterland markets and
reduce the availability of product for regions outside of their core supply envelopes• The regions where the additional imports are most likely to be required and potential pinch points could
emerge are: London & South East, East of England, South West and Scotland• The jet/kero import requirement into London & the South East rises to an estimated 8.3 Mt in 2020, circa 1 Mt (i.e.12%) higher
than in the Base Case
• In the Low Case, it is more likely that there will be a reduction in UK refinery capacity. The impact on the UK regional markets will be determined by which refineries are closed. The strategically vital refinery supply locations are Stanlow, Coryton, Fawley and Grangemouth and should any of these refineries be closed it would cause a significant structural disruption to supply. However, a closure of one of the East Coast refineries would have lesser impacts for the inland markets in England, especially if converted into an import terminal
• While a closure of one of the Welsh refineries might also have relatively limited structural impact in Scotland and northern/central England, it would likely lead to a further tightening of product availability in the South West, particularly for a seasonal product such as heating kerosene. Investment in new regional import and/or storage infrastructure could be required as a result. Also Northern Ireland would be affected as it would have to source imports from further afield – and would be competing with the Republic of Ireland in doing so (the Republic is a major importer of product from the UK)
11
Delivering commercial insight to the global energy industry
www.woodmac.com
Final Report 8th June
Executive Summary – Responses To Key Questions
Supply Infrastructure (Contd.)• Where and what additional supply infrastructure would be necessary to cope with the demand scenarios and is
this infrastructure likely to be built?• In the Base Case additional infrastructure will be needed to supply aviation jet fuel to Heathrow and Stansted airports – we
believe this will be built. Replacement capacity is needed in South West – Greenergy already investing in Plymouth but this investment is overall less certain. Investment in import facilities is needed at Grangemouth – we believe this currently seems unlikely, given refinery ownership and lack of space at NuStar
• In the Low Case, some additional import capacity will be needed to replace potential refinery closures but as all refineries barStanlow are on the coast we would assume that any refineries that are closed are turned into import terminals
• In the High Case additional import capacity will be required in London/South East, East of England, South West, and Scotland – this will only be built once investors are confident that the demand expectations are realistic - which will probably be too late!!
• What are the main factors preventing this investment?• Lack of expected economic return
• What are risks for the UK related to the quantity of imports identified in the analysis?• Risks are mainly in relation to the timeliness of required investment in additional capacity and debottlenecking to meet
increased import/export trade – increasing the risk of supply interruptions. The required infrastructure investment is likely to be incremental at existing sites. There is ample terminal capacity on the east coast and although there are a smaller number of locations on the west coast, these are not currently highly utilised and could play a more active role in supplying the inland market
• In the event of refinery closures, security of supply could be put at risk with increasing dependence on the availability of imports meeting UK quality requirements, especially vapour pressure requirements for gasoline, if and when these are required (e.g. during refinery shutdowns)
12

Delivering commercial insight to the global energy industry
www.woodmac.com
Final Report 8th June
Part 1 Study
2 Economics of the UK Downstream Oil Market
Infrastructure Developments in Recent Years3
Introduction & Background1
Utilisation of Existing Infrastructure4
Key Drivers of Investment Decisions and Future Investment5
6 Barriers to Investment and Robustness of Market Framework
Possible Mitigation of Barriers 7
Impact of Financial Crisis8
Summary Conclusions - Part 19
13

Delivering commercial insight to the global energy industry
www.woodmac.com
Final Report 8th June
Part 2 Study
11 Capability to Meet Future Oil Product Demand
Future Import Requirements and Associated Risks12
Three Oil Product Demand Scenarios10
Summary Conclusions – Part 2 13
14 Appendices
14

Delivering commercial insight to the global energy industry
www.woodmac.com
Final Report 8th June
1 Introduction & Background
15

Delivering commercial insight to the global energy industry
www.woodmac.com
Final Report 8th June
Introduction & Background (1)
There has been a gradual contraction in oil supply and distribution infrastructure and its capacity within the UK over the last 20 years. At the same time, the UK’s net trade position has continued to evolve, with growing imbalances in gasoline and middle distillates being a key feature of recent trends. The increased call on import/ export facilities and their resulting higher level of utilisation at key coastal locations has increased the risk of short term disruption to supplies into the inland market of deficit products There is a concern that market trends may require additional logistical infrastructure capacity such as import facilities, refining capacity, fuel distribution pipelines, terminals and storage in the UK. Although, in the past, the market has ensured that the necessary investment has been made to meet changing UK demand for oil products, given the scale of the changes in demand and supply foreseen, DECC is interested in determining whether the current market conditions and regulatory framework will provide the necessary incentives for adequate and timely investments in the fuel supply chain that will allow the UK to meet the future supply and demand balance.As a result, the Downstream Oil Industry Forum (DOIF) together with DECC want to review the existing infrastructure in the UK downstream oil sector and identify potential barriers to improving the resilience of supply under a range of demand scenarios.
16

Delivering commercial insight to the global energy industry
www.woodmac.com
Final Report 8th June
Introduction & Background (2)
The study is split into two parts Part 1: An economic analysis of the downstream oil market outlining how the UK market and its regulatory framework incentivise investment in the oil products fuel supply chain. The key elements that are included within Part 1 of the study are:
• Outline the economics of the downstream oil market in the UK• Review infrastructure developments seen over the recent years• Identify and analyse the economic factors that underpin investment decisions and the key drivers that influence
future investment• An analysis of existing barriers to investment in new infrastructure, how those barriers will evolve over time and
whether the current market framework is robust to deal with future challenges• Identify possible actions that might be taken to mitigate barriers to investment and analyse their costs and
benefits • A view on the extent to which the financial crises has impacted on investment in the UK’s downstream fuel
supply chainPart 2: Modelling of three UK oil product demand scenarios that can stress-test supply and inform the DECC work on supply disruptions.
• Modelling three scenarios that cover a broad set of possible assumptions on future UK oil product demand in the period to 2030. The demand scenarios are presented at a regional level and a product by product basis
• An analysis on whether current and projected supply infrastructure in the UK would be able to meet demand under the developed scenarios
• A view on the likeliness of the UK of attracting enough imports of oil products and risks associated with those imports
17

Delivering commercial insight to the global energy industry
www.woodmac.com
Final Report 8th June
2 Economics of the UK Downstream Oil Market
18

Delivering commercial insight to the global energy industry
www.woodmac.com
Final Report 8th June
The Downstream Value Chain
Conventionally segmented into ‘Refining’ and ‘Marketing’• Key input cost into Refining is the cost of crude oil – the value of the output is represented by the realised bulk
wholesale prices obtained for the refined products manufactured, the difference between the two being the gross refining margin
• Key input cost into Marketing is the cost of the refined products at point of purchase – in an integrated oil company this is normally the ex-refinery product price or ‘transfer price’ from the refining to the marketing business. The difference between this and the sales proceeds (net of any taxes) obtained for the products marketed is the gross marketing margin (reflects the value added through the marketing process)
• The marketing margin is often sub-divided into ‘wholesale’ and ‘retail’ or ‘distributor’ margin elements – where the wholesale element covers the value uplift obtained in terms of realised prices between the refinery and oil storage/ delivery terminal and, in many cases, onward delivery to either the retail forecourt or into commercial customer own storage. The ‘retail’ element of the margin covers the difference between the pre-tax forecourt pump price to the motorist and the delivered price onto the forecourt or, in the case of heating oil distribution, the difference between the delivered price and the wholesale ex-rack price (the ‘distributor’ margin)
• Our analysis of the downstream value chain covers the main ‘white oil’ refined products of gasoline, gas/diesel oil, and kerosene, i.e. those products that are delivered to market via a shared logistics infrastructure and supply chain – the specialist products of LPG, lubricants, and bitumen are characterised by their own product specific supply chains and logistical infrastructure and are excluded here
Gross Margins and Net Cash Margins• Each part of the value chain is characterised by certain direct costs, plus other non-direct or shared costs that
are attributed to it. These costs are deducted from the relevant gross margins to arrive at a net cash margin, i.e. before any further deduction for asset depreciation, interest charges/ provisions or other non-cash costs
19

Delivering commercial insight to the global energy industry
www.woodmac.com
Final Report 8th June
The Downstream Supply Chain
Crude Oil Input
Refinery Feedstocks
Refining/Manufacture
LPG
Naphtha
Gasoline
Diesel
Gas Oil
Fuel Oil
Lubricants
Other Products
Transfers to National
Marketing Affiliate
Speciality Products Markets: LPG; Lubricants; Bitumen
Retail Market
Commercial Fuels Market
Aviation Market
Marine Bunkers
Ex-Refinery Sales and Exports
Product imports
Sales to Independent Wholesalers and Traders**primarily sell into the retail, commercial fuels, and marine
bunkering sectors.
20

Delivering commercial insight to the global energy industry
www.woodmac.com
Final Report 8th June
Downstream Supply Chain – Gross Margin SchematicReflects the integrated margin through the whole downstream value chain. Market players whose activities are focused in particular parts of the chain only generate the margin applicable to that part, e.g. hypermarket retail groups with fuels retailing activities but no refining operations will purchase product on an ex-refinery or terminal ex-rack basis and thus generate a marketing margin only. Our analysis is based upon ‘indicator’crude costs, ex-refinery transfer prices, ex-rack prices and retail pump prices, all of which will differ between players within the market. Our analysis is therefore indicative of the market average rather than a specific player. Furthermore, gross margins are before cash and non-cash costs and do not equate directly to profit.
Crude Cost
Ex- Refinery or Transfer Price
Terminal Ex-rack price
Delivered Price or Retail Pump Price
Refiner Wholesaler Distributor/ Retailer
Refining Gross Margin Wholesale Gross Margin Distributor/Retailer Gross Margin
Total Marketing Gross Margin
21

Delivering commercial insight to the global energy industry
www.woodmac.com
Final Report 8th June
Wood Mackenzie’s Refining Net Cash Margin (NCM) Methodology
In analysing the competitiveness and profitability of an individual refinery, Wood Mackenzie focuses on its relative net cash margin (NCM)NCM captures most of the critical elements of a refinery’s performance that define its competitive position and is defined as:
NCM ($/bbl) = Product Worth ($/bbl) - Cost of Crude ($/bbl) - Cash Operating Expenses ($/bbl) NCM multiplied by annual crude throughput is effectively equivalent to EBITDA (earnings before interest, tax, depreciation and amortisation) ie the cash or gross operating surplus required to remunerate investment and capital employedThe constituent parts of the net cash margin, which represent the different activities having the greatest impact on the margin, are examined to identify sources of sustainable competitive advantage:
• Cost of Crude Oil• Crude Oil Delivery Costs• Configuration/Value Added• Efficiency• Product Despatch Facilities• Location/Environment
$/barrel+
- Crude transport
Crude Cost fob
NET CASH MARGIN (maximised when product worth is high and costs low)
Efficiency Losses
Value added by processing less cash operating expenses
Product dispatch benefit
Locational effects
Evaluations are based upon Wood Mackenzie’s own research, databases, market assessment and proprietary analysis
Source: Wood Mackenzie
22

Delivering commercial insight to the global energy industry
www.woodmac.com
Final Report 8th June
Wood Mackenzie’s Retail NCM Methodology
23
Other Variable costs+
-
Fuel Margin Fixed costs
Non-fuel Margin
Net Cash Margin for CO networksRefinery
Gate Price
Logistics/ Distribution Costs
Full margin/ cost build up. Supplying oil companies will only access all this for company owned and operated outlets
In the case of dealer outlets supplying oil companies will only access a wholesale margin offset by commensurate supply costs (no access to non-fuel margin). The remaining margin/ cost elements will be covered by the dealer.

Delivering commercial insight to the global energy industry
www.woodmac.com
Final Report 8th June
19971997
Esso
BP
Shell
Tesco
Save
ElfGulf
Texaco
Jet
TotalFina
Q8
Others
SainsburySafeway
Asda
OtherHypers
Murco
UK Retail Fuels Market Structure…Major Consolidation of Oil Company Players as Share Taken By Hypermarket Retail Groups Has Increased from 21.5% to 39% In Ten Years
Market has consolidated but remains more competitive than in many other European countriesNumber of oil company players reduced due to mergers/ acquisitions and substantial growth of hypermarket sectorHypermarket retail groups now supply 39% of UK retail fuel volumes
• Tesco is now number 2 in the retail fuels market behind BP with a 15.9% volume market share
• Morrisons have acquired Safeway while Sainsbury and Asda have both grown their market share
There have been no significant new entrants into the UK fuels retailing market in the period but also no major exits
20072007
BP
Shell
Esso
TotalTexaco
JetMurco
Tesco
Morrisons
Sainsbury
Asda Others
Other Hypers
Source: Wood Mackenzie Estimates
24

Delivering commercial insight to the global energy industry
www.woodmac.com
Final Report 8th June
Key UK Market Structure IssuesThe inland logistical infrastructure remains dominated by the six major oil companies active in the UK market - BP, Chevron, ConocoPhillips, ExxonMobil, Shell, and Total
• Although many of these companies have increasingly withdrawn from the direct ownership of retail fuels networks and of commercial fuel distributors, with Ireland’s DCC Energy becoming a major player in the commercial fuel distribution segment in the UK
A significant proportion of UK product is delivered under exchange contracts between UK refiners so enabling them to save on logistical supply costs on product delivered in areas remote from their own manufacturing facilities
• We estimate this could account for around 35-40% of the UK market• Contracts are normally bi-lateral in nature and based on annual agreed quantities of each grade of fuel to be lifted by each party from the
other’s refinery or storage terminal – may include a commercial payment from one party to the other to equalise joint logistical savings gained from the arrangement
However, the country is well endowed with a number of independently owned and operated sea fed coastal oil storage terminals
• This facilitates the import of refined product by independent suppliers, providing them with an alternative means of procuring product other than from the UK refineries – affords the added benefit of doing this under ‘bond’ and thus delaying the payment of excise duty until the product is released to market
• Has meant that the grocery hypermarket retailers have been less reliant on the UK refiners than would otherwise have been the case in developing their gasoline and diesel procurement strategies
• Has encouraged the growth of independent wholesalers and product traders such as Greenergy and Harvest Energy, alongside established players such as Mabanaft, especially within the supply envelopes served by these terminals
• Greenergy has adopted a particularly aggressive growth strategy and now supplies some 12% of the UK wholesale market for road transport fuels through its supplies of gasoline and diesel to hypermarket retail groups and large commercial road transport companies – has now begun to invest in storage terminal facilities in its own right, e.g. its 2008 acquisition of the Mayflower Terminal, Plymouth, from ConocoPhillips and its 2009 announcement of a major development and expansion at the Vopak Seal Sands Terminal on Teesside
• Mabanaft acquired former independent distributor BWOC in 1998 and in 2008/2009 has additionally acquired both Advance Fuels and Thomas Silvey
The closure of Buncefield and the ‘Fina Line’ ex-LOR for ground fuels has increased demand on the independent terminals in the Thames
• Vopak and Greenergy have taken advantage of this by investing in increased capacity at West Thurrock
25

Delivering commercial insight to the global energy industry
www.woodmac.com
Final Report 8th June
UK Gross Margin Summary
UK Gross Margins - £/t UK Gross Margins - £/t UK Gross Margins - % UK Gross Margins - %
Refining 2008 data is preliminary; Marketing margins are based on a weighted average of retail gasoline, retail diesel, commercial diesel/ gas oil, and domestic kerosene margins
The sustained downward trend in the crude oil price boosted marketing margins in 2H 2008.NW Europe refining margins have fallen back from the peak levels seen in 2005.
0
20
40
60
80
100
120
2005 2006 2007 2008 Average
Mar
gin,
£/t
Refining Marketing
0%
%
%
%
%
%
%
%
%
%
%
2005 2006 2007 2008 Average
10
20
30
40
50
60
70
80
90
100
Refining Marketing
Source: Wood Mackenzie
26

Delivering commercial insight to the global energy industry
www.woodmac.com
Final Report 8th June
UK Net Cash Margin Summary
UK Net Cash Margins - % UK Net Cash Margins - % UK Net Cash Margins - £/t UK Net Cash Margins - £/t
Refining 2008 data is preliminary; Marketing margins are based on a weighted average of retail gasoline, retail diesel, commercial diesel/ gas oil, and domestic kerosene margins Source: Wood Mackenzie
The sustained downward trend in the crude oil price boosted marketing margins in 2H 2008.NW Europe refining margins have fallen back from the peak levels seen in 2005.
0%
20%
40%
60%
80%
100%
2005 2006 2007 2008 Average
Refining Marketing
0
10
20
30
40
50
60
2005 2006 2007 2008 Average
Mar
gin,
£/t
Refining Marketing
27

Delivering commercial insight to the global energy industry
www.woodmac.com
Final Report 8th June
Gross Marketing Margins 2005 - 2008
The chart shows the unit gross marketing margins generated on an annual average basis in the period 2005 – 2008 for;
• Retail gasoline and diesel• Commercial gas oil and heating kerosene, based on deliveries of
2,000 – 5,000 litres for gas oil and of up to 1,000 litres for kerosene
These margins have been derived by subtracting the monthly national average retail prices as assessed by Wood Mackenzie (net of taxes) for premium unleaded gasoline, derv, gas oil, andstandard grade burning oil from the NW Europe cargoes CIF price for the relevant grades
• Incorporating for 2008 an assumed level of bio-ethanol (0.9%) in gasoline and 3.7% bio-diesel in diesel
• In the retail gasoline and diesel sector, the margins shown hererepresent an average covering sales through both oil company branded forecourts and supermarkets – the latter can be up to £25/tonne lower than the former due to their lower unit costs (fewer outlets, higher throughputs)
Marketing margins are subject to short term fluctuations arisingfrom the lead/ lag effects associated with the time it takes forchanges in the cost of oil to work their way through to end userprices
• The impact of the sharply falling cost of oil in the latter part of 2008 is reflected in the higher than average marketing margins seen that year – especially for retail gasoline – more than offsetting the squeeze on margins from rising oil prices earlier in the year
Margins in the first part of 2009 have settled back to more typical average levelsWe have therefore included the four year average over the 2005 –2008 period in this analysis
*Expressed in money of the day
Unit Gross Marketing Margins*Unit Gross Marketing Margins*
0
20
40
60
80
100
120
Retail ULG95
Retail Diesel CommercialGas Oil
HeatingKerosene
£/to
nne
2005 2006 2007 2008 4 Year Average
Source: Wood Mackenzie
28
Delivering commercial insight to the global energy industry
www.woodmac.com
Final Report 8th June
Fuels Wholesale Gross Margins
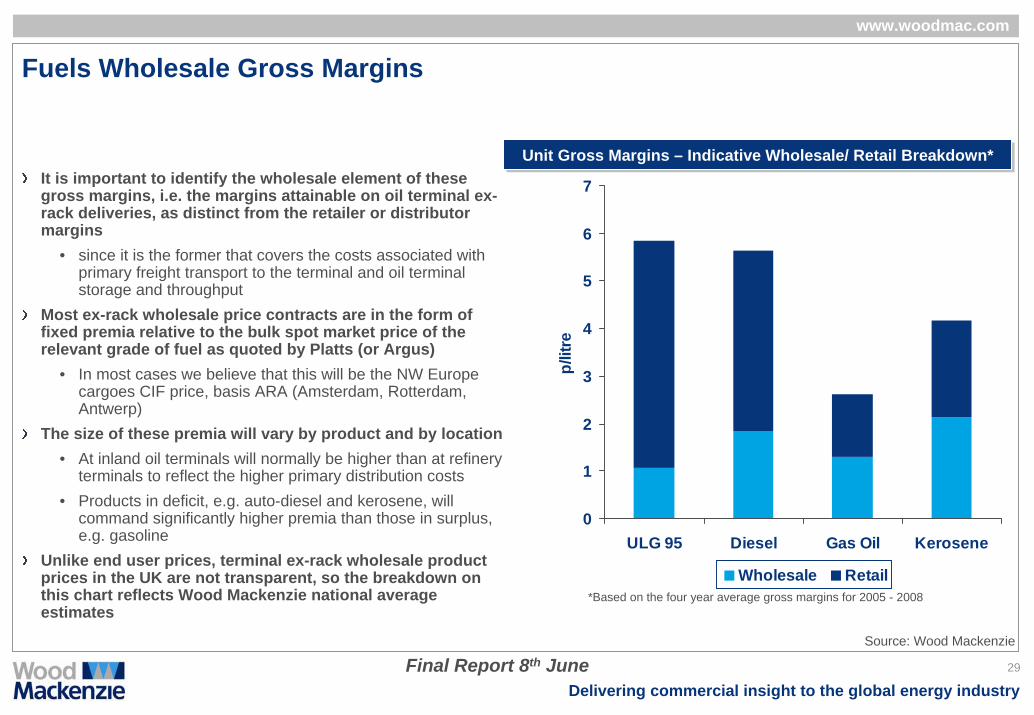
It is important to identify the wholesale element of these gross margins, i.e. the margins attainable on oil terminal ex-rack deliveries, as distinct from the retailer or distributor margins
• since it is the former that covers the costs associated with primary freight transport to the terminal and oil terminal storage and throughput
Most ex-rack wholesale price contracts are in the form of fixed premia relative to the bulk spot market price of the relevant grade of fuel as quoted by Platts (or Argus)
• In most cases we believe that this will be the NW Europe cargoes CIF price, basis ARA (Amsterdam, Rotterdam, Antwerp)
The size of these premia will vary by product and by location• At inland oil terminals will normally be higher than at refinery
terminals to reflect the higher primary distribution costs• Products in deficit, e.g. auto-diesel and kerosene, will
command significantly higher premia than those in surplus, e.g. gasoline
Unlike end user prices, terminal ex-rack wholesale product prices in the UK are not transparent, so the breakdown on this chart reflects Wood Mackenzie national average estimates
*Based on the four year average gross margins for 2005 - 2008
Unit Gross Margins – Indicative Wholesale/ Retail Breakdown*Unit Gross Margins – Indicative Wholesale/ Retail Breakdown*
0
1
2
3
4
5
6
7
ULG 95 Diesel Gas Oil Kerosenep/
litre
Wholesale Retail
Source: Wood Mackenzie
29

Delivering commercial insight to the global energy industry
www.woodmac.com
Final Report 8th June
Marketing Net Cash Margins 2005 - 2008
0
20
40
60
80
100
120
Retail ULG95
Retail Diesel Gas Oil HeatingKerosene
£/to
nne
2005 2006 2007 2008 4 Year Average
The chart shows our assessment of industry average marketing net cash margins generated on an annual average basis in the period 2005 – 2008 for:
• Retail gasoline and diesel – the weighted average of the two is the important figure for the retail fuels sector
• Commercial gas oil and heating kerosene, based on deliveries of 2,000 – 5,000 litres for gas oil and of up to 1,000 litres for kerosene
These margins have been derived by subtracting Wood Mackenzie’s estimates of unit operating costs for the four main oil products evaluated
In the case of retail gasoline and diesel the net cash margins shown are net of non-fuel incomeOnce again, because of the variability in gross margins year by year we also show here the four year average over the 2005 – 2008 periodThese net cash margins are before any allowance for asset depreciation or other non-cash costs, and represent the total cash generation potential in the market. In reality this is shared between different participants in the supply chain, primarily depending upon the degree of oil company ownership
*Expressed in money of the day
Marketing Net Cash Margins*Marketing Net Cash Margins*
Source: Wood Mackenzie
30

Delivering commercial insight to the global energy industry
www.woodmac.com
Final Report 8th June
Retail Fuels Net Cash Margin 2005 - 2008
We show here an assessment of the industry average net cash margin generated in the UK fuels retailing sector
• Defined as gross fuel margin plus non-fuel margin less unit operating costs, expressed in pence/litre of fuel sold
This assessment is for the sector as a whole and includes the retailer remuneration, comprising
• An element of the fuel margin plus the majority of the non-fuel margin
• Offset by that proportion of costs attributable to the retail siteFrom an oil company perspective this analysis of margins and costs reflects the potential cash generation from fuels retailing. The retail site operating model adopted by each brand determines the degree to which the margin is shared by an oil company with its retail partners
• The average level of net cash margin of 3p/ litre (£38/ tonne) would need to cover asset depreciation and other non-cash costs as well as provide an acceptable return on investment
Non-fuel income is an important element of the net cash margin from fuels retailing
• But this is a non-core activity for major oil companies and most have found it difficult to produce a business model in this areathat generates sufficient levels of return to justify large scale investment
• Many oil companies have thus sought to pass responsibility for this aspect of the business onto independent retailers or enter into joint ventures with specialist retail groups
• Has led to many UK oil companies withdrawing back into fuels wholesaling rather than investing in their own retail networks
0
1
2
3
4
5
6
7
8
2005 2006 2007 2008 Average05 - 08
p/lit
reFuel Margin* Unit CostsNon-Fuel Margin Net Cash Margin
*Wtd average of gasoline and diesel gross margin
Marketing Net Cash Margins*Marketing Net Cash Margins*
Source: Wood Mackenzie
31

Delivering commercial insight to the global energy industry
www.woodmac.com
Final Report 8th June
UK Retail Fuel Margins* v. 2008 European Retail Fuel Margins
UK Retail fuel margins are amongst the lowest in Europe but consolidation of the number of retail fuel outlets has led to average site throughputs (a key determinant of unit costs) being the highest in the region, and this, together with growth in non-fuel revenues has mitigated the impact on net cash margin and profitability
UK
Weighted Average throughput
Weighted Average Gross Margin
*Represents the weighted average of unleaded 95 gasoline and auto-diesel – excludes ‘premium’ fuels Source: Wood Mackenzie
0
2
4
6
8
10
12
14
16
18
0.0 0.5 1.0 1.5 2.0 2.5 3.0 3.5 4.0 4.5 5.0Average fuel throughput/ station (ml/ year)
Ret
ail F
uel G
ross
Mar
gin
(€ce
nt/l)
32

Delivering commercial insight to the global energy industry
www.woodmac.com
Final Report 8th June
Marketing Margins Show Short Term Volatility But Long Term Stability*
Short term lead/ lag effects but long term margins prove resilient to oil price volatility
0
2
4
6
8
10
12
14
16
Jan-97 Jan-98 Jan-99 Jan-00 Jan-01 Jan-02 Jan-03 Jan-04 Jan-05 Jan-06 Jan-07 Jan-08
€cen
t/litr
e
Monthly Averages (nominal) Annual Average
Source: Wood Mackenzie*Average retail gasoline gross margin across Western Europe
33

Delivering commercial insight to the global energy industry
www.woodmac.com
Final Report 8th June
Competitive Position of UK Refineries on Net Cash Margin (NCM) – 2005-2007
2005 Competitive Position of UK Refineries - £/bbl2005 Competitive Position of UK Refineries - £/bbl
The NCM ranking system ranks 103 European refineries (106 in 2005). NCM captures those elements that have the greatest impact upon a refinery’s competitive position and profitability potentialRefineries that rank highly on the NCM curve typically have sustainable structural advantages that enable them to operate profitably even in the most challenging market environment. Conversely, refineries that are ranked low down the curve are more likely to be distressed in weak market conditionsGenerally the UK refineries (highlighted in blue) are consideredas mid to low performers.
-1
0
1
2
3
4
5
6
7
2007 Competitive Position of UK Refineries - £/bbl2007 Competitive Position of UK Refineries - £/bbl
15
43 4968
52 5676 78
105
2006 Competitive Position of UK Refineries - £/bbl 2006 Competitive Position of UK Refineries - £/bbl
34
22
4755
7162 68 7293
103
-1
0
1
2
3
4
5
6
7
19
4052 53 62 67 69
85
103
Source: Wood Mackenzie – Global Refinery View-1
0
1
2
3
4
5
6
7

Delivering commercial insight to the global energy industry
www.woodmac.com
Final Report 8th June
The UK’s Competitive Refinery Net Cash Margin Position Is Mid-Tier
0
1
2
3
4
5
6
7
£pe
r bar
rel
0
1
2
3
4
5
6
7
£pe
r bar
rel
By taking the NCM per barrel capacity of the Crude Distillation Unit and taking an average for each country provides evidence for theearlier statement that UK refiners are generally low to mid performersThe underlying ranking of the UK’s refinery infrastructure within Europe is not due to government policy differences but results from structural factors e.g. central European markets are landlocked and hence less open to imports & competition. In addition UK refineries process higher quality (and hence higher cost) crude feedstock than is the case in much of Europe - light, low sulphur North Sea crude oil. There are also significant oil product exports from the UK, particularly for gasoline.
2005 European NCMs By Country - £/bbl 2005 European NCMs By Country - £/bbl
2006 European NCMs By Country - £/bbl 2006 European NCMs By Country - £/bbl 2007 European NCMs By Country - £/bbl 2007 European NCMs By Country - £/bbl
17th
17th17th
UKUK
UK
Source: Wood Mackenzie – Global Refinery View
Red bars indicate the following selected countries in western Europe: Belgium, France, Germany, Italy and Netherlands
0
1
2
3
4
5
6
7
£pe
r bar
rel
35

Delivering commercial insight to the global energy industry
www.woodmac.com
Final Report 8th June
UK Value Chain Summary
The UK is a mature and highly competitive market in which marketing margins are strongly influenced by the pricing behaviour of the lowest cost operators
• In retail these are the supermarket companies who benefit from a core network of high volume fuel stations attached to their stores with consequently lower unit costs than the road-side oil company branded networks and can thereby drive down their own forecourt pump prices without compromising their net cash margin position to the same extent – the roadside networks have had to compete and their profitability has become increasingly dependent upon the contribution for their non-fuel products and services
• In the commercial/ wholesale sector the demands of a price sensitive market have also placed pressure on prices and margins and hence forced players to become as cost competitive as possible
The UK refining industry ranks only 17th out of 26 countries in Europe on Wood Mackenzie’s measure of competitive position (net cash margin) . This relatively low ranking arises due to structural factors rather than national policy differences. Our conclusion is that financial returns from UK refining are likely to be lower than in many other countries.In the four year period 2005 – 2008 average net cash margins in the UK downstream have averaged:
• £16/tonne in refining• £28/tonne in marketing and distribution, of which the wholesale element attributable to the inland refining companies will be no
more than £5-10/tonne and the retail/ distributor margin element £18-23/tonne• It is important to recognise that while the owner of a refinery can access the full refining net cash margin, in fuels marketing and
distribution the margin must usually be shared between the oil company and its local distributor. The ownership that an oil company retains in each channel of trade will determine its ability to access the full margin (e.g. COCO v. DODO service stations)
Commercial fuels marketing in the UK has for long been a volume/ margin business – driving through sufficient volume to maximise the use of the supply infrastructure at your disposal and thus exploit scale economies in unit costs
• Has meant that pricing has often been on a marginal cost basis As a consequence there has been little discretionary investment by the international oil majors in UK downstream infrastructure – refineries, logistics, and retail service stations
• Most investment that has been undertaken has been to comply with regulatory requirements• Uncertainty over future regulation has also created a climate that has not been conducive to investment, e.g. on biofuels policy
36

Delivering commercial insight to the global energy industry
www.woodmac.com
Final Report 8th June
3 Infrastructure Developments in Recent Years
37

Delivering commercial insight to the global energy industry
www.woodmac.com
Final Report 8th June
UK Refinery & Logistical Infrastructure- including product pipelines
There are now 8 main fuels refineries operated by 8 refiners…• Grangemouth, Scotland (INEOS)• Coryton (Petroplus)*• Humber Refinery, Immingham (ConocoPhillips)• Lindsey Oil Refinery, Killingholme (Total)• Fawley (ExxonMobil)• Pembroke (Chevron)• Milford Haven (Murco)• Stanlow (Shell)
…Supported by a dense network of product pipelines in the southern half of the UK
• The UKOP system, linking Coryton in the south east via the majordemand centres in Birmingham and the midlands to Stanlow in the north west
• ExxonMobil’s ‘Mainline’ and ‘Midline’ systems, linking Fawley and Milford Haven/Pembroke with Avonmouth, the Midlands, and Manchester
• The Government Pipeline and Storage System (GPSS) – mainly used for jet fuel supply
A network of inland and coastal oil storage terminals –supplied by pipeline, rail, and sea – lie at the heart of the
*Petroplus North Tees refinery is currently in economic shutdown and may not re-open
product supply chainSource: DECC
38

Delivering commercial insight to the global energy industry
www.woodmac.com
Final Report 8th June
Key Features of Inland Oil Product Logistics (1)The integrated oil companies still dominate the inland primary supply and oil terminal infrastructure through ownership of oil terminal and product pipeline assets
• ExxonMobil have two pipelines running from Fawley refinery to its West London oil terminal, one multi-product and a second dedicated to jet fuel for onward supply to Heathrow airport. The multi-product pipeline branches at Alton with an easterly branch to its wholly owned Purfleet oil terminal on the Thames via Gatwick airport. A separate dedicated line runs from Fawley to its Avonmouth oil terminal, near Bristol. An additional line, the Midline pipeline, runs north from Fawley to Seisdon and Birmingham.
• The ‘Mainline’ oil pipeline (ownership interest: ExxonMobil 65%, Chevron 20%, Total 10%, and Shell 5%) which runs from the Milford Haven/ Pembroke refineries to the Midlands (where it joins another ExxonMobil line from Fawley at Seisdon) with one branch heading north to Trafford Park, Manchester, and the other going eastwards to oil terminals at Birmingham and Kingsbury. Asection from Kingsbury to Nottingham is currently mothballed.
• United Kingdom Oil Pipelines (UKOP) – a consortium comprising Shell (47.8%), BP (33.24%), Chevron (15.16%), and Total (3.8%) – which consists of two separate product pipelines that link Coryton refinery in the Thames with Stanlow refinery in the north west via oil terminals at Buncefield, Northampton and Kingsbury. The West London Pipeline System runs from Buncefield to Heathrow airport, with a further link to the Walton terminal. From Walton, product can be supplied to Gatwick via the Walton-Gatwick section of the GPSS. The UKOP lines are operated by the British Pipeline Agency (BPA), a joint venture between BP and Shell in which each have a 50% ownership stake.
• Total own and operate the ‘Finaline’, built to transfer white oils from Lindsey Oil Refinery to Buncefield for supply into the south east market, although since being reinstated in 2007 following the Buncefield terminal fire in 2005, this line has been restricted to jet fuel. Total also operates a short jet fuel line from its rail supplied jet fuel storage site at Colnbrook into Heathrow airport.
• Many inland oil storage terminals have been moved into joint ventures between two or more companies – e.g. Warwickshire Oil Storage at Kingsbury (Total/ ConocoPhillips), Sunderland Oil Storage (BP/Chevron) and Manchester Fuel Terminal (ExxonMobil/ Total/Chevron). Other terminals are still wholly owned by the oil companies although third parties are given access under exchange or product throughput arrangements.
There are nevertheless a number of important independently owned and operated coastal oil storage terminal facilities that are sea fed and facilitate product imports
• Especially in the Thames area and along the east coast (e.g. Seal Sands, Immingham)• These are key locations that have played an important role in providing a product source other than the UK refiners to facilitate the
growth of hypermarket fuels retailing in the UK, encouraging the emergence of specialist wholesale and trading groups like Greenergy, Harvest Energy, and Mabanaft
39
Delivering commercial insight to the global energy industry
www.woodmac.com
Final Report 8th June
Key Features Of Inland Oil Product Logistics (2)
Geographically, there are a number of key oil product supply sources/ locations that can be considered strategic in nature, the removal or closure of which could cause significant disruption to supplyIn the South-East/ Thames area – Coryton oil refinery and its associated road loading terminal together with its access to the UKOP and GPSS pipeline systems
• If Coryton refinery closed, the facility would need to remain open as an import terminal to facilitate more product imports into the Thames area, probably utilising the existing refinery jetties and oil storage
In the South – Fawley oil refinery and associated access to product pipeline systems to London/Thames, Avonmouth, Birmingham, and Manchester
• If Fawley closed, the site would need to be turned into a product import terminal to facilitate distribution of petroleum products into the local area and access to the pipeline infrastructure – would mean a major expansion of product import facilities in Southampton Water/ Hamble oil terminal since the capacity of the Fawley jetties are believed to be constrained while Hamble is constrained on storage capacity
In the North West – Stanlow oil refinery and its associated road loading terminal and access into the UKOP pipeline• Because of the difficulties of sea going access into the Mersey area, major investment would be required in product import facilities
within the QE2 Dock/ Tranmere/ Eastham area if refined products in sufficient quantities were to be imported into the region to supply the north west even if pipeline supplies to Manchester Fuel Terminal were maximised
In Eastern England – probably one or other of the Humber/ Lindsey oil refineries and associated road loading facilities• Although it is believed that there is capacity within the Humber/ Immingham area at the refinery locations and at Simon Storage to
substantially increase refined product importsIn the Midlands – the Kingsbury and Birmingham group of inland oil terminals are key, especially post BuncefieldIn Scotland – Grangemouth refinery and its associated road loading terminal
• Closure would mean heavy investment in expanding refined product import facilities into the Grangemouth/ Forth area to supply Central Scotland
40

Delivering commercial insight to the global energy industry
www.woodmac.com
Final Report 8th June
Main Independent Oil Terminals - All Sea Fed
Vopak• West Thurrock, Thames – 395,000m3 (oil products, chemicals, gas)• Ipswich, East Anglia – 65,000m3 (oil products, veg oils)• Teesside – 246,000m3 (oil products, chemicals, veg oils, gas)
NuStar• Grays, Essex – 310,000m3• Eastham, Wirral – 346,000m3• Ross Storage, Grangemouth, Scotland – 86,000m3• Clydebank, Scotland – 55,000m3• Belfast, N.Ireland – 65,000m3
Simon Storage• Immingham East & West – 249,000m3 & 325,000m3 • Seal Sands, Teesside – 220,000m3
Oikos Storage• Canvey Island Oil terminal – 300,000m3• Connection to both UKOP and GPSS pipeline systems
SEM Logistics• Milford Haven – largest independent storage facility in UK
(1,430,000m3) Falmouth Oil Services
• Marine fuel bulk storage & wholesale distribution terminal – 70,000m3Asco Fuel & Lubricants
• Middle distillate storage at Aberdeen (27,000m3), Peterhead (35,000m3), and Yarmouth (10,000m3)
Vopak NuStar Simon Storage
Grangemouth
Immingham West & East
Grays
West Thurrock
Eastham
Belfast
Clydebank
Oikos Storage SEM Logistics Falmouth Oil Services
Falmouth
Asco Fuel and Lubricants
Canvey Island
IpswichMilford Haven
Seal Sands
Aberdeen
Source: Wood Mackenzie
41
Delivering commercial insight to the global energy industry
www.woodmac.com
Final Report 8th June
Infrastructure Developments – South East
RefiningInvestments in recent years have been focused on production of 10ppm sulphur spec road fuels
• At Coryton, investment was made by BP in both light FCC gasoline and diesel hydrotreating in 2003 to allow production of motor fuels to 10ppm sulphur specifications. Propylene splitter debottlenecked in 2004. The lubes unit at the site was closed in 2006. Refinery sold by BP to Petroplus in 2007
• At Fawley, a SCANfining unit was brought on stream in 2005 as part of a clean fuels project to allow production of 10ppm sulphurgasoline
Logistics (pipelines & storage)The Buncefield explosion and the resulting closure of the facility in December 2005 removed a key pipeline and storage hub for SE England
• Was thought to handle c.40% of the aviation jet fuel supplied to Heathrow & Gatwick and 20% of the road fuels into the SE• Triggered a huge shift of volume onto other oil terminals in the region and forced the cessation of ‘Fina Line’ operations ex-Lindsey
Oil Refinery (which only goes to Buncefield) – establishing alternative supply routes for aviation jet fuel to Heathrow/ Gatwick proved to be the most problematical issue. This was achieved through maximising supplies via the Esso pipeline system ex-Fawley, increasing usage of the GPSS system to Walton, and maximising on rail supplies to Colnbrook (thence by pipeline to Heathrow)
• Jet fuel supply to Heathrow was further facilitated by increasing the capacity of the London Airport Pipeline to Heathrow ex-Walton, and by conversion of a former fuel oil pipeline to jet fuel use
Partly as a result of the fall-out from Buncefield, Greenergy/ Vopak announced in 2006 that they were investing in an additional 45,000m3 of storage at W. Thurrock sea fed terminal on the Thames plus biofuel blending facilities – completed in 2007
• Increased total storage capacity at the terminal to 393,000m3
• Dedicated, client specific tankage introduced at the site following the product contamination incident in 2007• Key oil terminal for the supermarket players, especially so since Buncefield closure
OIKOS oil terminal on the Thames was acquired by Challenger in February 2007 – the only independent, third party owned oil terminal on the Thames with access into both UKOP and GPSS pipeline systems
• UKOP access disused for many years but was reopened for jet fuel following Buncefield
42
Delivering commercial insight to the global energy industry
www.woodmac.com
Final Report 8th June
Infrastructure Developments – South East (contd.)
Shell has maintained a dedicated jet fuel import and storage facility at Shell Haven together with its own ingress into the UKOP south pipeline since the closure of its former oil refinery at the site in the late 1990’s, but in 2008 it opened a new road loading capability at the site to enable it to truck jet fuel to Gatwick, Stansted and Luton airports
Ethanol blending facilities installed by ExxonMobil at Hythe terminal, Fawley – BP planning similar investment at neighbouring Hamble terminal
• Blending facilities also in place at the Vopak terminal, West Thurrock, in the Thames
There has been limited redevelopment of the Buncefield terminal complex following the explosion and fire in December 2005• BP re-opened Buncefield terminal for jet fuel supply in 2008 and in March 2009 recommenced ground fuel storage and distribution
at the site (now renamed Hemel Hempstead terminal). BP has invested £10m in complying with 55 recommendations to improve safety from the HSE and local planning authorities.
• The HOSL West part of the Buncefield complex has been demolished. Storage tanks at the former HOSL East site have been refurbished by Total and are about to be commissioned for jet fuel storage.
• ‘Fina Line’ has been reconnected to the BPA/WLPS site and dedicated to jet fuel only for delivery via WLPS to Heathrow airport.• On behalf of WLPS, BPA submitted planning applications in May 2009, seeking to redevelop the BPA/WLPS site with 65 kt of new
jet fuel storage capacity
The Vopak Ipswich terminal is currently on the market
The Kings Lynn and Wymondham terminals are currently operated by fuel distributors
43

Delivering commercial insight to the global energy industry
www.woodmac.com
Final Report 8th June
Infrastructure Developments – South WestRefining
Murco Milford Haven – while still under joint Murco & Total ownership a contract was concluded with Foster Wheeler Energy in late 2004 to undertake projects that included debottlenecking work on the CDU and FCC to increase processing capacity, and improvements to the energy efficiency of the HDS. The two partners were also thought to have invested in a new FCC gasoline splitter at the site prior to the sale by Total of its shareholding in the refinery to partner Murco in 2007
Chevron Pembroke – a polishing reactor was installed on the FCC naphtha hydrotreater in 2003 to enable production of 10ppm sulphur gasoline while the diesel hydrotreaters were upgraded in 2003 to meet 10ppm sulphur specifications. In 2004 $12.8 million was invested at the site to enable it to process higher TAN/ higher calcium crudes while in 2006 the refinery invested in additional heat removal on the crude tower to allow processing of lighter crudes, such as Caspian. In 2007 a revamp of the FCC was announced aimed at improving reliability of the main fractionator
LogisticsInvestment by Kuwait Petroleum in Bristol Aviation Fuel Terminal in 2003
• The first dedicated petro-chemical berth in Bristol’s Royal Portbury Dock (berth 7) was opened – specifically designed for the import of aviation fuel into the UK by Kuwait Petroleum in vessels of up to 120,000 dwt.
• Kerosene is directly discharged from the berth into the pipeline and storage network managed by the Oil and Pipelines Agency (the Government Pipeline and Storage System) for delivery to Heathrow and Gatwick airports – annual volumes believed to be >1.2Mt
• Opening of berth 7 provides an opportunity to construct another berth for liquid fuels within the same dock
HSE issues at BOSL (previously Chevron/ Total) terminal, Avonmouth – effectively closing the terminal to gasoline storage in 2007
• Restricted to handling middle distillates only • Resulted in increased demand on neighbouring ExxonMobil terminal at Avonmouth• Key import location for oil trader Mabanaft – its wholly owned fuels distributor BWOC is based there• Chevron purchased Total shareholding in BOSL (69%) in May 2009
44

Delivering commercial insight to the global energy industry
www.woodmac.com
Final Report 8th June
Infrastructure Developments – South West (contd.)
Operational problems at Plymouth, the other key oil terminal supplying the south west• Two adjacent terminals owned and operated by Chevron and ConocoPhillips, although the latter’s ‘Mayflower’ Terminal was
acquired by Greenergy in 2008
• Investment by Greenergy in this oil terminal will potentially provide some relief to the logistical oil supply constraints within the SW region with its almost exclusive reliance on the oil terminals at Plymouth and Avonmouth
• Discussions entered into with Chevron to share its adjoining terminal at Plymouth while Mayflower is rebuilt & modernised
Oil storage terminals on the south coast at Poole and Portland in Dorset have closed within the last 2-3 years• The Chevron Poole terminal closed in September 2006 following a leak and subsequently the lease expired in September 2007.
The level of investment required to bring the site back into operation was not considered viable and the terminal has now been demolished. Following remediation, the site is to be returned to Poole Harbour Commissioners for alternative use.
• The Portland terminal has been demolished to allow construction of sailing facilities for the 2012 Olympics. A new marine fuel bunkering facility has been constructed and is now operated by Portland Bunkers International Ltd.
45
Delivering commercial insight to the global energy industry
www.woodmac.com
Final Report 8th June
Infrastructure Developments – North WestRefining
Shell Stanlow – in 2003 a $120m investment in low sulphur fuels was announced. Included new gasoline desulphurisation facilities, an upgrading of existing diesel manufacturing facilities to produce 10ppm sulphur diesel, and a power plant extension. A new $50m control room was opened in 2006.
LogisticsThere have been no major infrastructure developments in the north west region over the last five yearsThe region is heavily reliant on Stanlow refinery’s road delivery terminal for the supply of oil products, although there are a number of alternative supply points, the most important being:
• Manchester Fuel Terminal – pipeline supplied ex-Fawley/ Milford Haven (via the Esso pipeline system)
• Bramhall oil storage terminal – supplied by the GPSS pipeline system ex-ConocoPhillips Humber refinery
• NuStar’s Eastham Oil Storage terminal – supplied by coaster
• BP Dalston terminal – supplied by rail from INEOS Grangemouth refinery
Total’s sale of its former interest in Milford Haven oil refinery to Murco led to it reconfiguring its UK supply/ logistics, one consequence of which was its withdrawal from Manchester Fuel Terminal and obtaining supplies instead to road ex-Shell Stanlow
• Chevron had also transferred a high proportion of its former volume at MFT to Shell Stanlow some years earlier
As a refinery supplied terminal, Shell’s Stanlow facility provides suppliers with a potential supply cost advantage compared to other oil storage terminals in the NW region which will incur significant primary supply costs
• The cost of moving product out of Stanlow refinery by ship via the Manchester Ship Canal is high so Shell will look to maximise refinery output distribution to either road or pipeline – into UKOP North or in the case of jet fuel the Manchester airport jet line
• Chevron have ceased fuel distribution from the Simon Storage terminal at Workington
46

Delivering commercial insight to the global energy industry
www.woodmac.com
Final Report 8th June
Infrastructure Developments – North East
RefiningConocoPhillips Humber Refinery – investment in construction of a 730MW CHP plant to supply power to the refinery and into National Grid. Completed in 2004, it also supplies power to the neighbouring Lindsey Oil Refinery. A catalytic reformer, to replace an existing unit, was commissioned in 2004 but no further investment was envisaged to produce 10ppm sulphur fuelsTotal Lindsey Oil Refinery – in 2007 construction commenced of a new hydrodesulphurisation unit and a hydrogen production unit. A $300m investment project due for completion in 2009 and will allow the refinery to process more high sulphur crude and increase production of sulphur free diesel/ gas oilPetroplus Teesside – announcement by Petroplus in 2009 that it intends to sell the refinery or, in the event of failing to find a buyer, convert the site into a product import terminal
LogisticsThere have been no major infrastructure developments in the north east region over the last five years
• But in April 2009 Greenergy have announced a major multi-million pound investment in a new, state of the art, 80,000m3 facility for gasoline and diesel storage and blending at the Vopak terminal at Seal Sands, Teesside, including the construction of five new high speed road loading racks – is the first phase in a more extended planned investment programme in Teesside which is being proposed as the hub for a new inland rail distribution system being proposed by Greenergy with fuel moved to new grass roots terminals and existing terminals by rail
The region relies on the main refinery road loading oil terminals at the Humber and LOR for a high proportion of its oil productneeds
• The Simon Storage Immingham West and East oil terminals provide important back-upThe other key oil product terminals in the region are:
• The Petroplus Teesside refinery road loading terminal• Sunderland Oil Storage terminal• Shell’s Jarrow terminal• Simon’s Seal Sands terminal
47
Delivering commercial insight to the global energy industry
www.woodmac.com
Final Report 8th June
Infrastructure Developments – Scotland & N. Ireland
RefiningINEOS Grangemouth Refinery – in 2003 former owner BP announced the reinstatement of the FCC unit at a cost of $41m. This was commissioned in 2004 processing a mix of VGO and atmospheric residue. In December 2005 the sale by BP of pet-chem subsidiary Innovene, operator of the refinery, to INEOS was formerly confirmed. A second sulphur plant was brought online in 2006 and in the same year a major tank farm remediation programme was commenced
LogisticsThere have been no major infrastructure developments in Scotland over the last five yearsThe region of Central Scotland relies on the main refinery road loading oil terminal at Grangemouth for a high proportion of itsoil product needs
• The Grangemouth refinery terminal supplies around 90% of demand in Central Scotland with over 400 road tanker deliveries/day The only other oil product terminals in the central Scottish region are:
• The sea fed NuStar storage terminal (formerly Ross Storage) at Grangemouth adjacent to the refinery – can also be supplied by pipeline from the INEOS Grangemouth refinery
• The sea fed NuStar owned Clydebank oil terminal at Rothesay Docks, Glasgow – in 2009 it was announced that Greenergy had taken an exclusive leasehold on this facility
In N. Ireland, a new 86,000m3capacity sea fed oil terminal was opened at Derry by independent operator LSS Ltd• First brand new oil terminal in Ireland for decades• Capable of handling vessels of up to 24,000 dwt from a private jetty• Stores gasoline, gas/ diesel oil, and kerosene
48

Delivering commercial insight to the global energy industry
www.woodmac.com
Final Report 8th June
Key Logistical Issues
While the independent, specialist oil storage groups have invested in their coastal facilities to both expand capacity and introduce additional services such as biofuel blending, much of the inland oil company terminal network is aged, has suffered from under-investment
• Has led to operational and reliability problems – the fire that destroyed much of Buncefield in 2005 was the most extreme example but there have been other more recent events to cause concern (e.g. a leakage at Chevron’s Cardiff terminal in 2008, also serious leaks at the Mayflower terminal, Plymouth and at Chevron’s Poole facility, which ultimately led to its closure) and the suspension of operations for gasoline at the Bristol Oil Storage site at Avonmouth (Chevron/Total)
The closure of Buncefield caused a major dislocation of supplies in the south east, especially of aviation fuel to Heathrow/ Gatwick and has had several consequences on supply patterns in the region
• More product is being road trucked southwards from Kingsbury and Northampton terminals• Increased demand on oil terminals in the Thames – the Coryton refinery road terminal and Esso Purfleet facility were thought to be
operating at near capacity anyway, so much of the incremental volume was focused on the Vopak and NuStar facilities at West Thurrock and Grays
• Oil distributors seeking product availability at oil terminals in the west of London, especially ExxonMobil’s pipeline fed West London terminal and Murco’s rail supplied terminal at Theale, near Reading
Aside from the south east, the other key regional ‘pinch-points’ in terms of logistics are the south west and central Scotland• In the south west the key oil terminal locations are Avonmouth and Plymouth and both suffer from capacity constraints – the sea fed
BOSL terminal at Avonmouth (Chevron/ Total) is understood to have major safety issues that has resulted in the cessation of its use for gasoline supplies while there have also been serious issues with the ‘Mayflower’ terminal at Plymouth, until recently owned and operated by ConocoPhillips, although the recent acquisition of the plant by Greenergy may be a step towards resolving this –refurbishment of the terminal is now well under way along with the construction of a new road loading facility at the adjacent Cattedown Wharf site
• Grangemouth is the only refinery in Scotland and accordingly supplies the majority of the country’s petroleum needs – while Aberdeen and other coaster fed oil terminals could be supplied from other refineries, the lack of large scale product import facilities in the Forth/ Clyde aside from Grangemouth means that central Scotland is almost wholly reliant on the refinery.
49
Delivering commercial insight to the global energy industry
www.woodmac.com
Final Report 8th June
Key Logistical Issues (contd.)Supply of heating kerosene has become constrained in certain regions of the country, especially in southern England, following ExxonMobil’s withdrawal from supplying this grade in 2008
• this followed the change of European heating oil specification at the start of 2008, reducing the maximum sulphur level from 0.2% to 0.1%, meaning that from this date heating kerosene had to be produced at a lower sulphur level than aviation kerosene. This meant the end of the former ‘dual purpose’ kerosene grade produced in the UK for both purposes and meant that suppliers had to manufacture a lower sulphur kerosene specifically for the UK’s domestic heating oil market – a move ExxonMobil elected not to make.
• Has led to a lengthening supply chain and increased supply and distribution costs for this product• Supply shortages for heating oil can also be related to seasonal demand, peak orders following or in advance of forecast cold
weather and constraints on resupply The high investment costs associated with complying with the RTFO – e.g. installing ethanol import facilities at coastal locations and blending facilities at inland terminals – and implementing the revised COMAH product containment measuresintroduced post-Buncefield
• The low fuel margin environment in the UK means that it may be difficult to justify the investment on economic grounds, particularly at smaller terminals with lower throughputs. These ‘stay in business’ investment requirements may further reduce the capital available for discretionary investment in UK infrastructure.
• Is likely to lead to closures of those storage terminals that are either under-utilised or lack the scale to be able to achieve a satisfactory return on the investment that will need to be made in them
With refined products becoming liable for excise duty on leaving the refinery gate, oil distributors have an incentive to minimise the amount of product held in storage terminals and depots outside the refineries
• The only exception is refined product imports to the UK which can be held in storage ‘under bond’ until released to market – only then do they become liable for excise duty
There is limited opportunity to increase product storage outside refineries as the tank contents are cycled to create sufficientullage for discharge from coastal tankers or pipeline transfers to inland terminals. Following the change in duty point the inland terminal network was optimised with several closures, removing significant storage capacity and resilience
50

Delivering commercial insight to the global energy industry
www.woodmac.com
Final Report 8th June
4 Utilisation of Existing Infrastructure
51

Delivering commercial insight to the global energy industry
www.woodmac.com
Final Report 8th June
UK Refinery Crude Runs and Capacity Utilisation
UK Refinery Crude RunsUK Refinery Crude RunsIn 2008, the UK had nine main fuel refineries plus three bitumen plants, with total combined CDU capacity in 2008 of c. 93 Mt per calendar year (Wood Mackenzie estimate). Aside from the impact of refinery turnarounds, UK refinery crude runs and utilisation rates respond to market economics, increasing when there are high refining margins to be made
• In 2004 and 2005 UK refineries maximised their refining margins by increasing their refinery utilisations and exporting gasoline to a tight US market (e.g. following Hurricane Katrina)
• During periods of low margins, such as in 2001 and 2002, UK refineries responded by reducing their crude runs
While the utilisation rate of UK refineries was over 90% in 2004and 2005, it dropped to 81% in 2008 as the market environment weakened, particularly for gasoline exports to the US market While total UK refinery capacity is more than sufficient to cover the country’s total oil demand, utilisation rates of UK refineries are strongly influenced by the global & regional market as well as individual UK supply/demand product balancesGiven the strong gasoline orientation of many UK refineries and the UK’s surplus of this product, the export market for gasoline is an important driver of crude runs and utilisation inUK refineries
0
10
20
30
40
50
60
70
80
90
2000
2001
2002
2003
2004
2005
2006
2007
2008
Mt
0
1
2
3
4
5
6
$ / b
l
Crude Run NWE Refining Margins (RHS) UK oil demand
Source: Wood Mackenzie
52

Delivering commercial insight to the global energy industry
www.woodmac.com
Final Report 8th June
Utilisation of UK Product Pipelines (1)
The UK has an extensive set of product pipelines that facilitate the import and distribution of oil products to inland terminals and airports
• Most of the product pipeline system is nevertheless somewhat aged – ‘Finaline’ was the last complete product pipeline to be built in 1993
No data has been made available to Wood Mackenzie with regard to the effective capacity and volume throughputs of the various pipelines and therefore it is not possible for us to quantify the historic or current utilisation of the pipeline systems Our evaluation of this aspect of the UK downstream logistics is therefore largely qualitative and based upon the input we have received from industry stakeholders, including pipeline operators, as well as our own knowledge and understandingOverview comments
• The UK pipeline infrastructure has been extended and developed over many years, rather than as an integrated, coherent system. While this may confer some benefits in terms of flexibility in the system, it also means that there are potential operational constraints on the system that may reduce the effective capacity. For example, flow rates between different points on the system may vary quite significantly and therefore having storage capacity in certain locations to act as ‘a bulge in the pipeline’ may be important in determining the volume of product that can be transported from one location to another
• Effective capacity is impacted by the number of companies using a line and also the number of products being moved• Tariffs for use of pipelines by third parties are not regulated and are set at commercial rates by owners – these tariffs are not
published and are agreed on a bilateral, commercially confidential, basis • Biofuels in diesel has become a major issue, with higher costs being incurred to ensure quality of jet fuel (although we understand
effective pipeline capacity has not been reduced) – this is due to the potential contamination of aviation jet fuel by bio-components used in blended diesel and the need for adequate ‘buffers’ between product parcels delivered through multi-product pipelines to prevent this
53

Delivering commercial insight to the global energy industry
www.woodmac.com
Final Report 8th June
Utilisation of UK Product Pipelines (2)
Based upon the information available to us, we understand that the UKOP system is effectively operating at full capacity
• The key issue for this system is the situation at Buncefield with regard to the supply of aviation jet fuel to Heathrow and Gatwick airports
• Because of the multi-product nature of the pipelines coming into Buncefield, the different flow rates of ingress/egress and the rate of offtake at the airports, lack of storage at Buncefield for aviation fuel is a significant “pinch point” for the system
Based upon the information available to us, we understand that the GPSS systems is highly utilised.• The vast majority of product moved through the GPSS is aviation jet fuel (c.90%), with the remaining c.10%
being ground fuels
Our belief is that ExxonMobil’s ‘Midline’ system from its Fawley refinery is highly utilised although the‘Mainline’ system from the Welsh refineries is not – this is the only one of the UK commercially operated main product pipelines that would appear to have any significant spare capacity
54

Delivering commercial insight to the global energy industry
www.woodmac.com
Final Report 8th June
Third Party Access To Privately-Owned Pipelines
The 1962 Pipeline Act is the main legislative instrument regulating commercial pipelines in the UKThis Act was primarily designed to prevent a proliferation of pipelines, as opposed to stipulating the manner in which they can be operated or accessedHowever, commercial pipelines including the Mainline, UKOP, the Esso and Fina pipelines require statutory consent and it is a condition of that consent that
• anyone constructing a pipeline must be required to offer equity participation to other persons as may be interested• once the pipeline is built any spare capacity must be made available to anyone who wishes it
Theoretically therefore it is possible for a 3rd party to ship product through these pipelines, should there be spare capacity In reality, however, we believe that there are a number of other factors that make it problematic for any 3rd
party to actually meet the conditions required by the pipeline shipper before pipeline capacity is committed. These include:
• Ingress: how will the 3rd party move product into the pipeline? There are only limited ingress points remote of UK refineries• Egress: where will the product exit the pipeline and be stored? Inland storage terminals are typically owned by the refining
companies and are already highly utilised, without spare capacity • Establishing whether there is spare capacity: only the pipeline operator can determine this, as there is no data transparency on
effective capacity vs throughput. And it is also possible that pipeline owners can shift between transport modes in the event of any pipeline spare capacity becoming available (eg from rail to pipeline) – thereby ensuring that the pipeline remains fully utilised
• Pipeline tariffs: pipeline owners can set any 3rd party shipping tariffs market based rates, as determined by their own financial targets and, we assume, reflecting what the market will bear taking into account the costs of alternative supply options
• An increased number of companies using a pipeline implies smaller average parcel sizes – this can reduce effective pipeline capacity and therefore create a barrier to entry for new players in a highly utilised system
• Action to prevent jet fuel contamination due to bio-fuels has created additional costs and operational challenges for UKOP and Midline
55

Delivering commercial insight to the global energy industry
www.woodmac.com
Final Report 8th June
Utilisation Of Product Storage Terminals
One way of quantitatively measuring the utilisation of storage terminals is to relate the throughput of the facility to the size of the tank storage capacity
• This effectively gives the number of ‘tank turns’ achieved – the greater the number of tank turns, the higher the utilisation rate• This is a key performance benchmark used by specialist tank storage companies who typically will rent out their storage at a rate
expressed per cubic metre of storage space per monthFor inland terminals dedicated to supplying the inland market, this ratio can be expected to be high since product in tank will be turned over on a continuous basis as deliveries to the market are made and the tanks replenished - terminal operators will want to limit product stocks to the minimum required from an operational perspective
• To minimise working capital tied up in stocks• Because the product is duty paid – the point at which excise duty becomes payable in the UK is the refinery gate
For coastal oil terminals, especially those operated by independent storage companies licensed to import petroleum products and store them ‘under bond’, i.e. before duty, these ratios can be expected to be much lower because
• Stock replenishment will be more ‘lumpy’ – dependent on the arrival of ship loads• Proportionally more product is likely to be held in these terminals on a longer term basis by groups seeking to take advantage of
‘contango’ opportunities (i.e. where expected future product prices are higher than prevailing prices)Rather than storage capacity, the key limiting factors in constraining the utilisation level of most oil product terminals are the product reception and despatch facilities, e.g. jetties, pipeline capacity, rail wagons/paths/loading & reception facilities, road rack capacity – none of which we have the means to quantify in this reportWe have undertaken only qualitative analysis of storage terminal utilisation in the UK
• There are no product throughput figures in the public domain for refineries or oil terminals• The analysis thus relies heavily on Wood Mackenzie’s own estimates in the absence of actual data and must therefore be treated
with caution
56
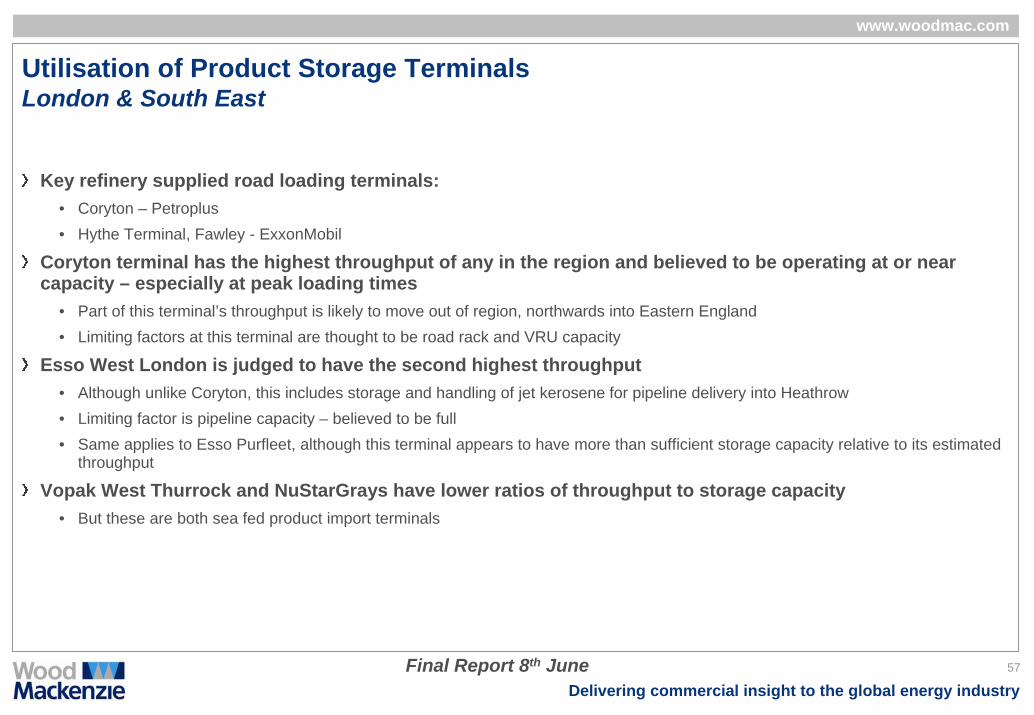
Delivering commercial insight to the global energy industry
www.woodmac.com
Final Report 8th June
Utilisation of Product Storage TerminalsLondon & South East
Key refinery supplied road loading terminals:• Coryton – Petroplus• Hythe Terminal, Fawley - ExxonMobil
Coryton terminal has the highest throughput of any in the region and believed to be operating at or near capacity – especially at peak loading times
• Part of this terminal’s throughput is likely to move out of region, northwards into Eastern England• Limiting factors at this terminal are thought to be road rack and VRU capacity
Esso West London is judged to have the second highest throughput• Although unlike Coryton, this includes storage and handling of jet kerosene for pipeline delivery into Heathrow• Limiting factor is pipeline capacity – believed to be full• Same applies to Esso Purfleet, although this terminal appears to have more than sufficient storage capacity relative to its estimated
throughput
Vopak West Thurrock and NuStarGrays have lower ratios of throughput to storage capacity• But these are both sea fed product import terminals
57
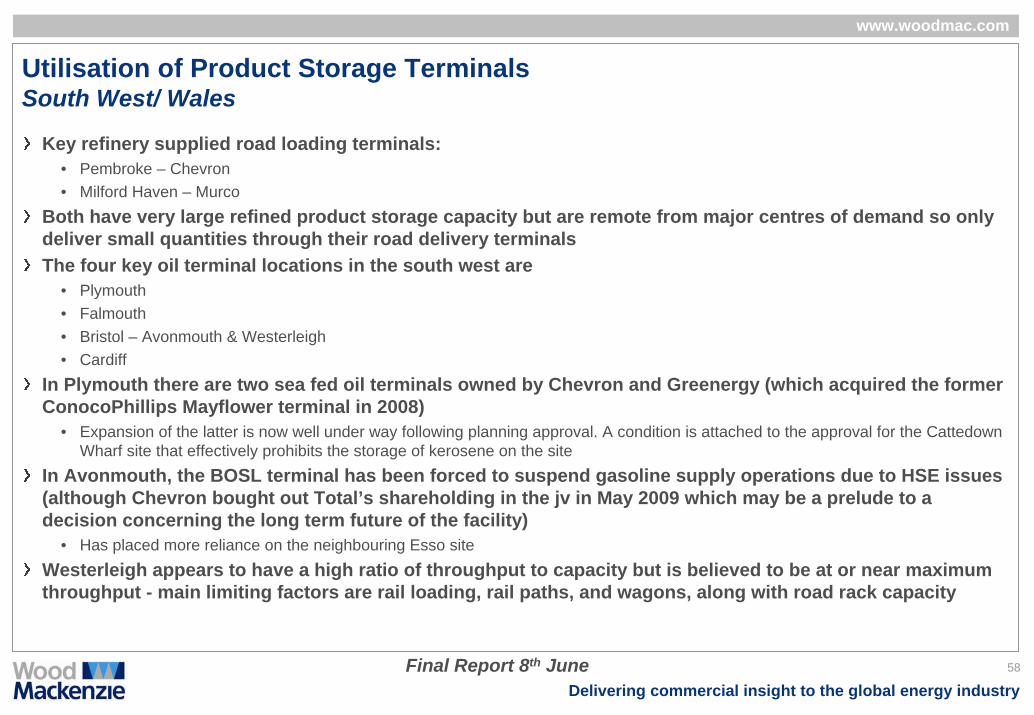
Delivering commercial insight to the global energy industry
www.woodmac.com
Final Report 8th June
Utilisation of Product Storage TerminalsSouth West/ Wales
Key refinery supplied road loading terminals:• Pembroke – Chevron• Milford Haven – Murco
Both have very large refined product storage capacity but are remote from major centres of demand so only deliver small quantities through their road delivery terminalsThe four key oil terminal locations in the south west are
• Plymouth• Falmouth• Bristol – Avonmouth & Westerleigh• Cardiff
In Plymouth there are two sea fed oil terminals owned by Chevron and Greenergy (which acquired the former ConocoPhillips Mayflower terminal in 2008)
• Expansion of the latter is now well under way following planning approval. A condition is attached to the approval for the Cattedown Wharf site that effectively prohibits the storage of kerosene on the site
In Avonmouth, the BOSL terminal has been forced to suspend gasoline supply operations due to HSE issues (although Chevron bought out Total’s shareholding in the jv in May 2009 which may be a prelude to adecision concerning the long term future of the facility)
• Has placed more reliance on the neighbouring Esso siteWesterleigh appears to have a high ratio of throughput to capacity but is believed to be at or near maximum throughput - main limiting factors are rail loading, rail paths, and wagons, along with road rack capacity
58

Delivering commercial insight to the global energy industry
www.woodmac.com
Final Report 8th June
Utilisation of Product Storage TerminalsEast/ West Midlands
No refineries in region but the key product storage terminals are centred on the Birmingham conurbation• Kingsbury – three pipeline supplied facilities (BP/Shell, Chevron, and WOSL (Total/ConocoPhillips))
• Bromford – Esso pipeline supplied terminal
• Bedworth, near Coventry – Murco rail supplied terminal
The two other key oil terminals in the region are• BP’s pipeline supplied terminal at Northampton
• Total’s rail supplied terminal at Colwick, Nottingham
The Kingsbury terminals have the most storage capacity and could potentially achieve higher throughputs• The key constraint is believed to be UKOP pipeline capacity
• The WOSL terminal can also receive product by rail from the Total Lindsey and ConocoPhillips Humber refineries at Immingham
• The Chevron oil terminal can supply product received by pipeline via the Mainline system ex-Pembroke into UKOP to Buncefield (jet kero)
59

Delivering commercial insight to the global energy industry
www.woodmac.com
Final Report 8th June
Utilisation of Product Storage TerminalsNorth West
Shell’s Stanlow refinery road loading terminal is the key supply point in this region• As the lowest cost supply point, achieves by far the highest volumes• Large refinery based product storage• Main limiting factor likely to be road rack loading capacity• Also supplies jet fuel directly through the Jet Line to Manchester airport
Manchester Fuel Terminal is the second most important lifting point in the region• But both Chevron and Total are known to have shifted away from this facility to Stanlow – in the case of Chevron due to a product
exchange arrangement concluded with Shell that gave it product at Stanlow and in the case of Total following its sale of its product supply source to Manchester at Milford Haven refinery
• We thus believe that some spare capacity now exists at Manchester
The small, rail fed BP terminal at Dalston in Cumbria is a key supply point for Carlisle and the Lake DistrictBramhall’s main limiting factor is road rack capacity and line capacity within the GPSS for pipeline supply ex-ConocoPhillips Humber refinery
• NuStar Eastham terminal appears under-utilised, probably due to higher product supply costs compared to other locations in region
60

Delivering commercial insight to the global energy industry
www.woodmac.com
Final Report 8th June
Utilisation of Product Storage TerminalsNorth East/ Yorkshire & Humber
Total’s Lindsey Oil Refinery at Killingholme and the ConocoPhillips Humber refinery are the key primary supply points for Yorkshire & Humberside
• The Simon Storage terminals at Immingham East and West provide back-up storage, blending, and product import facilitiesIn the north east region, the Petroplus Teesside refinery has been a primary supply point for gas/ diesel oil
• The key oil product terminals in this region are the Shell Jarrow and BP/ Chevron Sunderland facilities• Simon Storage and Vopak both have oil terminals at Seal Sands, in the Tyne region – Greenergy have in 2009 announced a major
investment programme at the latter• Although Petroplus Teesside refinery has ceased manufacturing operations, pending a decision on its future, it is understood
product is being imported through the facilityThe two refineries at S. Killingholme/ Immingham have large product storage capacity relative to the throughput of their road loading terminals
• Key limiting factor is rack capacityThe independent Simon Storage facilities appear to have spare capacity while Vopak’s Seal Sands facility at Teesside is to receive considerable investment in expansion from Greenergy
61

Delivering commercial insight to the global energy industry
www.woodmac.com
Final Report 8th June
Utilisation of Product Storage TerminalsScotland
The INEOS Grangemouth oil refinery is the key supply point for Scotland• There is no alternative import facility capable of servicing demand in the Scottish central belt
• Key constraining variable is road rack capacity
The other main oil terminals in Scotland are believed to achieve relatively low throughput levels in relation to capacity
• BP Aberdeen
• BP Inverness
• A key constraint is the rate at which the terminals can be re-stocked by coastal tanker
The two NuStar oil storage terminals at Grangemouth (formerly Ross Storage) and Clydebank achieve high ratios of fuel throughput to storage capacity
• Limiting factor is road rack capacity
62

Delivering commercial insight to the global energy industry
www.woodmac.com
Final Report 8th June
Utilisation Of Existing Infrastructure - SummaryCrude oil throughputs at UK refineries has dropped back from over 90% in the 2004-2005 period to c.81% in 2008 as the market environment has weakened
• Given the strong gasoline orientation of many UK refineries and the UK’s surplus of this product, the export market for gasoline is an important driver of crude runs and utilisation in UK refineries
• In the short term, throughput rates are also dependent upon planned and unplanned refinery shutdowns – during 2008 there were unplanned shut downs with significant production impact at Grangemouth (industrial action and fire in a compressor), Coryton (two power outages and FCC shutdown), Lindsey (reduced throughput due to control system instability and other factors) and Pembroke (interruption of steam supply)
Wood Mackenzie understands that the UKOP pipeline system is effectively operating at full capacity and the GPSS system is highly utilised, with limited additional capacity.
• The key issue for UKOP is managing the supply of jet fuel to Heathrow and Gatwick airports given the storage ‘pinch point’ at Buncefield• The GPSS system is used mainly for supply of jet aviation fuel – is highly utilised over certain key sections but there is significant underutilised
storage capacityThe one pipeline system which we believe does have spare capacity is the ‘Mainline’ system from the Pembroke and Milford Haven refineriesA number of factors limit the interest and ability of 3rd parties to access privately-owned pipelines, including ingress/egress points, establishing the availability of spare capacity and the negotiation of sufficiently attractive tariffsOur analysis indicates that there are a significant number of storage terminals in the UK operating at high utilisation levels, and there are few that appear under-utilised. It should be recognised that a key determinant of ‘tank turns’ is the supply mode i.e. whether a terminal is supplied directly by a refinery, or via pipeline, rail or water, i.e. there must be sufficient tank ullage to accommodate cost-effective resupplyHowever, we believe that product storage terminals are most likely to be constrained by product reception and despatch facilities rather than storage capacity eg jetties, pipeline capacity, rail wagons/paths/loading & reception facilities, road rack capacity. Wood Mackenzie has no available information to quantify these potential constraints on a terminal-by-terminal basis
63
Delivering commercial insight to the global energy industry
www.woodmac.com
Final Report 8th June
5 Key Drivers Of Investment Decisions and Future Investment
64
Delivering commercial insight to the global energy industry
www.woodmac.com
Final Report 8th June
Description of Generic Approach to Investment Decisions
Financial performance is the primary driver for commercial organisations, and this is especially the case in the UK’s competitive downstream oil industryWhen evaluating an investment opportunity, companies typically undertake a discounted case flow (DCF) analysis. This usually focuses upon modelling the “current case” (ie business as normal) and “planned case” (ie business following investment) so as to derive the incremental economics of the investment In the oil industry, investment horizons are typically quite long, with DCF models projecting cash flows out
10-20 years. However, the desired payback horizon is usually much shorter, say in the range 3-5 yearsNet present value (NPV), internal rate of return (IRR) and payback period are key measures used to evaluate the attractiveness of an investment, and also to compare competing investment opportunities – especially when capital is constrained. The discount rate used in the DCF analysis is a key factor and the rate can vary between different companies depending upon factors such as perception of risk, availability of capital, costs of capital, corporate strategy and portfolioInternational oil companies typically have minimum IRR ‘hurdle rates’ that are required for any investment to receive sanction, although these may vary by business channel and strategy. The level of risk in each case needs to be assessed and where risk is identified in underlying assumptions and forecasts then the hurdle rate will increase accordingly. Most companies will have competing projects across Europe and wider afield and due to overall budget constraints this means that even attractive investment projects may not go ahead. In a mature market such as the UK, investment decisions could often be driven by “stay in business”considerations (e.g. to meet tighter HSE standards). In this context the “current case” could be closure, whereas the “plan case” is effectively equivalent to a continuation of current operations. While such an investment could still look attractive on a standalone basis, from a corporate perspective the capital allocation may appear more questionable – especially when there are other genuine “growth” investment opportunities elsewhere in the company’s portfolio e.g. in immature, developing markets
65

Delivering commercial insight to the global energy industry
www.woodmac.com
Final Report 8th June
Stringent EU product specifications have been a key driver of refining investment
In recent years the European Union has focussed product specification legislation on gasoline and diesel quality, under the Auto Oil program, such as reductions in benzene, aromatics and sulphur, phase out of lead and introduction of bio-fuels. This has made European specifications the most stringent globally and forced UK refineries to invest.
Refinery Recent Legislation Incentivized Investments By UK Refineries
Coryton • In 2003, investment in both light FCC gasoline and diesel hydrotreating permits the production of motor fuels to 10 ppm sulphur specifications
Fawley • A SCANfining unit was brought on stream during 2005 as part of a clean fuels gasoline project to allow production of 10 ppm sulphur gasoline
Grangemouth • A second sulphur plant was brought online in March 2006
Lindsey• In 2002 Lindsey announced a revamp of the HDS and Unifiner units to meet the latest clean fuels specifications
• In 2007 Total started the construction of a new hydrodesulphurization unit and a hydrogen production unit to allow the refinery to process more high sulphur crude and increase the production of ultra low sulphur diesel
Pembroke• A 48 kb/cd FCC naphtha hydrotreater came on stream in Jan 2002 enabling the production of 50 ppm sulphur gasoline
• To enable production of 10 ppm sulphur gasoline a polishing reactor was installed on the FCC naphtha hydrotreater and the diesel hydrotreaters were upgraded in 2003
Stanlow • In 2003, a US$120M low-sulphur fuel investment was announced. Investment included new gasoline desulphurisation facilities, an upgrading of existing diesel facilities (to produce 10 ppm sulphur diesel). A new $50m control room was opened in 2006.
Product Legislation
Diesel • The EC has legislated alignment of diesel sulphur content requirements for non-road applications with the on-road sector by 31st December 2009
Bunker Fuels
• The remaining focus is on bunker fuel oil sulphur levels and the International Maritime Organization (IMO) has proposed and approved bunker fuel sulphur reductions globally, from current 4.5 wt% sulphur to 3.5 wt% sulphur by 2012 and 0.5 wt% by 2020
• Specification changes within the Sulphur Emission Control Areas (SECAs), are also included, dropping from 1.5 wt% today to 1.0 wt% by 2010 and 0.1 wt% by 2015
Jet • Sulphur levels are likely to come under increasing scrutiny but would require agreement at an international level, which could be challenging to achieve
Future legislative changes will continue to drive refinery investment - or disinvestment/closure. Enactment of the proposed Industrial Emissions Directive will inevitably impose reductions on NOx and SOx emissions from refineries, while ETS Phase III may lead to additional “stand still” investment or buy out costs for EU refiners with regard to carbon emissions
66

Delivering commercial insight to the global energy industry
www.woodmac.com
Final Report 8th June
Progression of marine fuel regulations is set to have an increasing impact on the refining industry
There is a trend towards increasingly tight sulphur regulations for Fuel Oil consumers
• The EU recently introduced a 0.1% sulphur limit for inland waterway vessels and ships
The Baltic and North Seas (including the English Channel) are already classed as SECAs, mandating 1.5% maximum sulphur fuel oilAdditional SECAs are likely in the future, although there have been no firm announcementsIn 2008, the Marine Environment Protection Committee (MEPC) of the International Maritime Organisation (IMO) agreed on amendments to tighten the limits of sulphur in fuel for ships
• SECAs to 1.0 % by April 2010 (currently 1.5%), reducing to 0.1 % from January 2015
• Elsewhere, a global cap of 3.5 wt from the start of 2012 (from the current 4.5%) reducing to 0.5% from 2020, subject to a feasibility review to be completed no later than 2018
These sulphur reductions can also be effected by on-board flue-gas scrubbing as an alternative to burning low sulphur fuels
Current and Possible Future SECAsCurrent and Possible Future SECAs
North Sea SECA2007
North American SECAsFuture?
Baltic SECA2006
Med SECAFuture?
Source: Wood Mackenzie
67

Delivering commercial insight to the global energy industry
www.woodmac.com
Final Report 8th June
Whilst Wood Mackenzie does not expect the IMO's proposals to be adopted in full, some increase in global demand for low-sulphur fuel oils is anticipated
Global Fuel Oil SpecificationsMARPOL Annnex VI mandates a progressive reduction in sulphur oxide emissions, with stepped reductions in permitted sulphur levels for marine fuel oil to 3.50% (from the current 4.50%), effective from 01 January 2012; with a further reduction to 0.50%, effective from 01 January 2020, subject to a feasibility review to be completed no later than 2018. The scope of the review is limited and will consider delay in implementation of the 0.50% limit from 2020 to 2025.Wood Mackenzie believe lowering the world sulphur cap from 4.5 wt% to 3.5 wt% by 2012 is achievable given the current 2.66 wt% sulphur average of bunker fuels, although it may be harder for refiners in the Middle East to achieve.Existing refining technologies cannot produce 0.5 wt% sulphur fuel oil from the majority of crude oils and so this would effectively mean a global swing to distillate – although member states of the MEPC have agreed on the proposal, we expect the refining industry will react to this proposed amendment in the future eg by quantifying the implications of full implementation in terms of the refinery investment required, the potential for it to be a driver of refinery closures and the associated impacts upon product supply for other fuels such as gasoline, gas/diesel oil and jet kerosene.Global bunker demand in 2020 corresponds to about 200 Mt – to upgrade this fully to distillate would require an estimated 80 major refining projects – which is not a realistic prospect in this timescale.Although the scope of the 2018 feasibility review is limited, we expect the provision to delay implementation of the 0.50% limit from 2020 to 2025 will be activated and a modification of the proposals carried out.
68
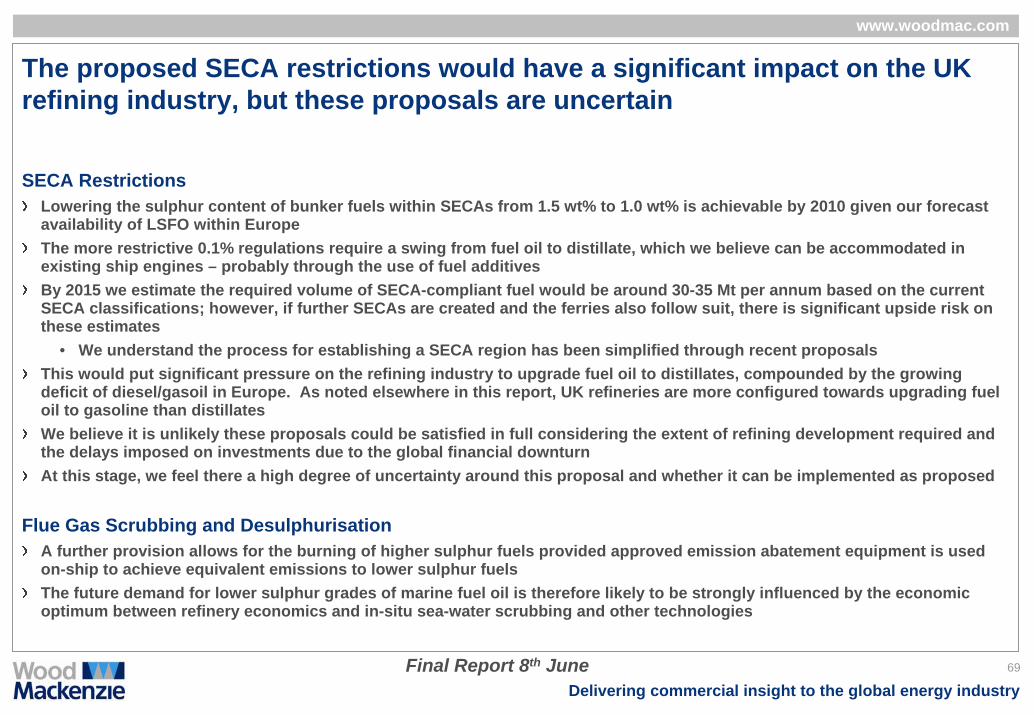
Delivering commercial insight to the global energy industry
www.woodmac.com
Final Report 8th June
The proposed SECA restrictions would have a significant impact on the UK refining industry, but these proposals are uncertain
SECA RestrictionsLowering the sulphur content of bunker fuels within SECAs from 1.5 wt% to 1.0 wt% is achievable by 2010 given our forecast availability of LSFO within EuropeThe more restrictive 0.1% regulations require a swing from fuel oil to distillate, which we believe can be accommodated in existing ship engines – probably through the use of fuel additivesBy 2015 we estimate the required volume of SECA-compliant fuel would be around 30-35 Mt per annum based on the current SECA classifications; however, if further SECAs are created and the ferries also follow suit, there is significant upside risk on these estimates
• We understand the process for establishing a SECA region has been simplified through recent proposalsThis would put significant pressure on the refining industry to upgrade fuel oil to distillates, compounded by the growing deficit of diesel/gasoil in Europe. As noted elsewhere in this report, UK refineries are more configured towards upgrading fueloil to gasoline than distillatesWe believe it is unlikely these proposals could be satisfied in full considering the extent of refining development required andthe delays imposed on investments due to the global financial downturnAt this stage, we feel there a high degree of uncertainty around this proposal and whether it can be implemented as proposed
Flue Gas Scrubbing and DesulphurisationA further provision allows for the burning of higher sulphur fuels provided approved emission abatement equipment is used on-ship to achieve equivalent emissions to lower sulphur fuelsThe future demand for lower sulphur grades of marine fuel oil is therefore likely to be strongly influenced by the economic optimum between refinery economics and in-situ sea-water scrubbing and other technologies
69

Delivering commercial insight to the global energy industry
www.woodmac.com
Final Report 8th June
The attractiveness of refining investment opportunities depends upon a number of factors but expectations of future crude differentials and crack spreads are key drivers
Key Driver Considerations For Future Investment Decisions
Light / Heavy Crude Differential
• Large differentials between light and heavy crude prices provide an incentive for refiners to upgrade their refineries to process heavy crude
– UK refineries generally process light sweet crude
– In 2004 Pembroke refinery invested US$12.8M to enable processing of higher TAN / high calcium crudes (such as Doba crude from Chad).
Crude Freight Costs
• A local crude supply minimises freight costs– East coast UK refineries have low freight costs with most of their crude feedstock coming from the North Sea
– Grangemouth is particularly advantaged receiving North Sea crude production from the Forties pipeline or VLCC imports via the Finnart terminal
– Falling North Sea oil production will require UK refineries to source alternative feedstock and increase delivery costs
• A deep port terminal allows larger vessels to deliver crude and reduces freight costs– The Fawley, Humber, Milford Haven and Pembroke refineries can receive crude from fully laden VLCC vessels
Refinery Configuration
• A refinery configured to produce a yield aligned to local product demand improves refinery margins by minimising exports of surplus production
– Whilst UK demand is concentrated on middle distillates UK refineries have a high gasoline yield
– Investment in hydrocracking/coking could improve the alignment between UK refinery yields and demand
Crack Spreads• The differential between the price of crude and that of oil products is a fundamental driver of refining economics
– Future expectations of supply/demand are a key factor in determining the attractiveness of any refinery investment
Location• Refineries located in protected inland markets are able to secure higher refinery gate oil product prices improving
their refining margins– The UK market is open to imports, effectively capping refinery gate price premia
70

Delivering commercial insight to the global energy industry
www.woodmac.com
Final Report 8th June
UK Refiners Have Many Refinery Investment Opportunities Outside The UK
UK Refiners Global Refining Capacity (Mt)UK Refiners Global Refining Capacity (Mt)
All eight companies involved in refining in the UK have interests in assets outside the UK
• Petroplus and INEOS have roughly 50% of their refining capacity outside the UK
• 89% - 94% of the refining portfolio of the majors (Chevron, ConocoPhilips, ExxonMobil, Shell and Total) is outside of the UK
In addition, BP, which has sold its two UK refineries, retains a global portfolio with a total annual capacity of 171 MtOther areas of the world, particularly Asia, have relatively immature oil markets where demand is rising – in contrast to the mature UK market
• The economics of investing in UK refineries may appear relatively unattractive in comparison to opportunities to meet demand in growing markets elsewhere
0
50
100
150
200
250
300
350
400
UK OtherEurope
AsiaPacific
Americas
Mt
TotalShellPetroplusMurcoINEOSExxonMobilConocoPhillipsChevron
Source: Wood Mackenzie
71

Delivering commercial insight to the global energy industry
www.woodmac.com
Final Report 8th June
Oil Product Demand Growth Is Strongest In Asia
Oil Product Demand Growth Is Strongest In Asia (mt)Oil Product Demand Growth Is Strongest In Asia (mt)
N. AmericaN. America EuropeEurope AsiaAsia
Fue l Oi l D i e se l / Ga soi l J e t / Ke r o Ga sol i ne Na pht ha LP G
Source: Wood Mackenzie
0
200
400
600
800
1000
1200
2000
2010
2020
0
200
400
600
800
1000
2000
2010
2020
0
200
400
600
800
1000
1200
1400
1600
1800
2000
2010
2020
72

Delivering commercial insight to the global energy industry
www.woodmac.com
Final Report 8th June
Product Pipeline Investment DriversOil pipelines are high capex, inflexible assets that typically require a high degree of long term confidence in future flows or tariffs to weigh against the long payback times usually involved. Confidence that demand will be sustainable in the long term, with no cost competitive supply alternatives, are likely to be the key drivers determining investment.
Key Driver UK Investment Consideration
Growth in local market demand
Growing demand for aviation kerosene for delivery to the key UK airports; increased auto diesel demand, though may be offset by declining petrol demand – operation of multi-product pipelines becomes more difficult with increasing FAME content in diesel
Biofuels Increased ethanol use, especially if underpinned long term in legislation, could lead to consideration of segregated pipeline capacity to transport ethanol to inland depots.
Refinery closure
Conversion to use as terminal, or complete closure, could conceivably drive adaptations to existing, or even new pipeline capacity
Changes in ownership
Changed ownership of refineries, pipelines and/or retail market interests could drive incremental pipeline links, additional depot capacity for new actors at pipeline outlets or other infrastructure adaptations to facilitate changed use
Government or regulatory incentives
UK government environment policies support the reduction in freight road-km driven through subsides for expansion of rail capacity (Freight Facility Grants). At present, these subsidies do not appear to be available to promoters of new pipeline capacity or storage infrastructure. A change in approach could stimulate interest in infrastructure investment.
73

Delivering commercial insight to the global energy industry
www.woodmac.com
Final Report 8th June
Drivers Of Investment In Product Storage Capacity Regarding supply into the inland market, regulatory requirements are a key driver of investment. In terms of discretionary investment, the key drivers are commercial, determined by future expectations of future import/export trade, oil product demand and niche market opportunities (either regionally or product specific)
Key Driver UK Investment Considerations Storage TypeGrowth in local market demand
• Growing demand for aviation kerosene for delivery to the key UK airports;increased auto diesel demand for direct delivery to commercial consumers and to retail forecourts
Inland & Coastal
International product flows
• Growing supply/demand imbalance in the UK with an increasing gasoline surplusand middle distillate deficit
Coastal – import/ export
‘Contango’ oil market price environment
• Provision of capacity in the UK to satisfy demand from traders wishing to speculate in physical stocks – storing product for resale at a higher future price
Coastal – import/ export
Increased diversity of product grades
• RTFO (biofuel) requirements eg E5/B7 moving to E10/B10 and introduction of E85/B30
• Premium fuels – apart from Shell’s ‘V-Power’ these are mostly blended at the rack
Inland & Coastal –more but smaller tanks
Optimisation of supply chain economics
• Lowering of inventory (working capital) levels at each storage location –investing in automatic stock monitoring and other equipment to improve efficiency;
• Consolidation in the number of storage terminals – investing in fewer but larger ‘hub’ facilities at key ‘hub’ locations
Inland
Regulatory requirements
• Tighter HSE requirements – especially introduction of enhanced product containment measures (bunding etc.) post Buncefield
• Compulsory stocks – as UK oil production declines, so the UK’s derogation will be phased out and the minimum stock holding obligation increased to 90 days
Inland & Coastal
74

Delivering commercial insight to the global energy industry
www.woodmac.com
Final Report 8th June
Drivers of Investment - Summary
There are an absence of financial incentives for investment provided by the regulatory frameworkExpectations regarding future oil product demand are a key investment driver across all parts of the downstream oil supply chain
• There is a high degree of uncertainty regarding future demand, not only due to the economic downturn but also due to energy policy initiatives aiming to stimulate energy efficiency, the uptake of renewable fuels and reduction in carbon emissions
When combined with the relatively low margins available in the UK, this suggests to Wood Mackenzie that, in overall terms, commercial justification for investment in UK downstream infrastructure is certainly challenging – especially for players who may have other clear growth opportunities in their overseas portfolioRegulatory requirements are an important driver of investment but may also be a catalyst for asset rationalisation, especially given the UK market context as previously outlined in this report. Wood Mackenzie concludes that any future discretionary investment in supply infrastructure is likely to be focused either within specific regional markets where the alternative cost of supply becomes an effective barrier to entry into the regional market, or where there is a high degree of confidence with regard to future growth in demand or trade. The South West is an example of the former, while investment in pipeline and storage capacity to serve the London airports is an example of the latter However, while we are confident that the investments to secure jet aviation fuel supply will be made by the major oil company suppliers, we believe it is less certain that regional market opportunities will attract investment – there appear to be only a small number of companies interested in such opportunities, their financial capability may be constrained and market risks may be considered too high
75

Delivering commercial insight to the global energy industry
www.woodmac.com
Final Report 8th June
6 Barriers To Investment and Robustness of Market Framework
76

Delivering commercial insight to the global energy industry
www.woodmac.com
Final Report 8th June
Barriers To Investment In Downstream Infrastructure
Barrier Type Specific BarriersEconomic, Market Environment, Market Uncertainty
• Low downstream margins
• Mature market – lack of demand growth
• Lack of capital availability
• Competition from other opportunities outside UK
Environmental/ Planning Regulation
• RTFO
• COMAH – ‘Containment Policy’
Customs & Excise Regime • Moving refined product excise duty liability point up the supply chain to the refinery gate
Restricted Third Party Access To Product Pipeline Infrastructure
• Lack of spare capacity and transparency regarding any capacity availability
• Pipeline tariffs – can be set at levels that discourage use
• Access to storage capacity at the ingress and egress points, along with road loading rack access at the egress point
GPSS legal remit • Legal constraint on ability to invest in non-military/civil defence projects
77

Delivering commercial insight to the global energy industry
www.woodmac.com
Final Report 8th June
Economic/ Market FeaturesLow Margin & Lack Of Demand Growth
The underlying barrier to investing in downstream infrastructure within the UK is the low margin environment that characterises the market
• In general, gives insufficient returns to make an economic case
• The only exception has been where a regional product deficit position coupled with a lack of infrastructure/ capacity has resulted in higher product price premia in the region – so increasing the local margin obtainable by suppliers (e.g. the south west)
This low margin environment is aggravated by declining, or at best flat, oil demand• Again, constrains the economic case for investment – given that volume throughput relative to capacity is an
important performance indicator for oil product logistical assets
• This will be aggravated by any extended downturn in oil demand arising from the financial crisis
We do not foresee any significant change to this low volume/ low margin environment in the UK even in the event of further consolidation in market structure
• There will continue to be competitive pressures that will push prices down towards levels that only cover the marginal costs of supply, thus continuing to constrain margins. The presence of independent storage terminals to facilitate product imports and the very strong presence of hypermarkets in fuels retailing are key factors preventing a structural rise in UK margins.
Lack of access to investment funds is also a potential investment barrier for independent operators, especially within the current adverse economic environment
78

Delivering commercial insight to the global energy industry
www.woodmac.com
Final Report 8th June
Environmental/ Planning RegulationRTFO and Post Buncefield ‘Containment Policy’
Renewable Transport Fuels Obligation (RTFO) – requires downstream players in the UK to incorporate a progressively increasing proportion of renewable fuels between now and 2020
• The removal of excise duty incentives coupled with currently high bio-component feedstock supply costs has rendered this potentially very costly – has further reduced the margin expectations on blended products
• Although bio-diesel can be blended at the source refineries and moved through the primary supply infrastructure, because of its water separation properties ethanol can only be blended at the road delivery terminals – which means suppliers and product storage operators are having to install ethanol blending facilities at their terminals
• Anecdotal evidence suggests that some suppliers have had difficulties in obtaining local planning approval for the installation of such facilities at some terminals and local planning sensitivities involving oil storage terminals have been significantly heightened since Buncefield
• Moreover, biofuels fall under the EU’s REACH regulation (Registration, Evaluation, Authorisation and restriction of Chemicals) which came into force on 1st June 2007, adding to the administrative load for operators
The new post Buncefield ‘Containment Policy’ to be applied to all petroleum storage sites falling under the COMAH (Control Of Major Accident Hazard) Regulations 1999 – issued in February 2008 and to be applied immediately at all new sites and introduced progressively at all existing sites
• Comprised measures relating to the design and construction of storage tanks, instrumentation and other equipment plus requirements relating to bund walls and other containment measures in the event of leaks
• Operators of existing sites were required to review their compliance with the measures and prepare a plan for implementing improvements, including completion dates for each stage
• Has represented an important additional investment cost to operators of existing sites just to retain their existing capacity and a higher capital cost than before for new sites – the COMAH Competent Authority (HSE and Environmental Agencies in England& Wales and Scotland) estimated that the total costs of implementation across the 95 COMAH regulated sites in England/Wales/Scotland would be £676 - £956 million on an NPV basis over a projected 20 year period
79
Delivering commercial insight to the global energy industry
www.woodmac.com
Final Report 8th June
Customs & Excise RegimeDuty Change Point
Excise duty point at the refinery gate• Acts as a disincentive to store petroleum products at inland oil terminals and thus the volume expectations for
potential new investments – the current rules provide an incentive for oil companies to store as much product as possible within their refineries ‘under bond’
• Has been a further factor extending the road delivery envelopes around the oil terminals adjacent to the refineries in the UK, encouraging the closure of inland terminals over the last ten years, and thereby removing excess capacity and reducing supply resilience
80

Delivering commercial insight to the global energy industry
www.woodmac.com
Final Report 8th June
Third Party Access To Primary Supply InfrastructureAccess To Product Pipelines
The control exercised over the main oil product pipelines in the UK by the participants of the various consortia that owns them provides a barrier to third parties entering the inland market supply chain
• Although in theory access is not restricted to third parties, this can in practice currently only be made available if there is spare capacity – and even if such capacity exists, the tariffs could be set at such a rate as to actively discourage use
• This particularly affects third parties wishing to supply product into the UK via independently owned storage facilities in the Thames and at Milford Haven in SW Wales, both of which have access to pipelines that would provide the capability to move product into the Midlands/ North West (the UKOP and ‘Mainline’ pipelines respectively)
• It should be noted that third party access to product pipelines also requires access by those third parties to commensurate storage capacity at the ingress and egress points along with road loading rack access at the egress point
This effectively represents a barrier to entry into the UK market for potential new entrants who might otherwise consider investing in other infrastructure around those pipelines
81

Delivering commercial insight to the global energy industry
www.woodmac.com
Final Report 8th June
GPSS Legal Remit Constrains ability to invest in non-military/civil defence projects
The GPSS was originally constructed for civil and military defence purposes (starting with regulation 50 of the 1939 Act but with many later developments)The GPSS is not regulated under the 1962 Pipeline Act but is "consented" under the Land Powers (Defence) Act 1958 (as amended)It is constrained by its legal remit which requires it to be used primarily for defence purposes and does not allow the Oil & Pipeline Agency (OPA) to act as a promoter of commercial projectsHowever the concept of “ civil defence “ was significantly amended under the Civil Contingencies Act 2004As a result the GPSS now needs to have its civil remit clarified and re-confirmedThe Treasury’s OEP report published on 22 April 2009 declared that the government will be reviewing and amending legislation accordingly to clarify the legal remit of the GPSS
• This could open the way for the development of ‘brown field’ investment projects based around the GPSS system, with the OPA working in partnership with third parties
82

Delivering commercial insight to the global energy industry
www.woodmac.com
Final Report 8th June
Robustness Of Market Framework (1)
83
Geographically, there are a number of key oil product supply sources/ locations that can be considered strategic in nature to ensure continuity of supply into the UK market The removal or closure of any of these sites would significantly threaten the robustness of the marketIn the South-East/ Thames area
• Coryton oil refinery and its associated road loading terminal together with its access to the UKOP and GPSS pipeline systems. Buncefield is important for supply of jet into Heathrow, particularly with regard to meeting demand growth
In the South/ South West• Fawley oil refinery and associated access to product pipeline systems to
London/Thames, Avonmouth, Birmingham, and Manchester• Plymouth oil terminal has become strategically essential for supplies into the South
WestIn the North West
• Stanlow oil refinery and its associated road loading terminal and access into the UKOP pipeline
In Eastern England• probably one or other of the Humber/ Lindsey oil refineries and associated road loading
facilitiesIn the Midlands
• the Kingsbury and Birmingham group of inland oil terminals are keyIn Scotland
• Grangemouth refinery and its associated road loading terminalIn Northern Ireland
• Belfast is the key import location
Refinery location
Storage terminal location
Grangemouth
Humber
Coryton
Fawley
Stanlow
Birmingham/ Kingsbury
Belfast
Plymouth
Cardiff/ Avonmouth
Buncefield (jet)
Source: Wood Mackenzie

Delivering commercial insight to the global energy industry
www.woodmac.com
Final Report 8th June
Robustness Of Market Framework (2)
Our analysis of the market framework – particularly the regulatory environment and lack of economic incentives – indicates that there is likely to be further consolidation in the UK downstream industryThis consolidation will materialise through both infrastructure and market structure changesIn terms of infrastructure
• Small depots and terminals which do not meet new COMAH requirements may not attract the required investment and will close
• This will put more pressure on the key, hub locations and implies longer delivery distances and an extended supply chain, that may be more vulnerable to disruption
• More remote parts of the UK (e.g. in Scotland) may be particularly affected
• The eventual introduction of biofuel grades B10/E10 may require investment in provision for a fourth fuel grade on retail service station forecourts to preserve availability of E5 gasoline availability for those older vehicles unable to use E10
In terms of competitive market structure• We believe it is possible that one or more major players in the UK downstream could consider an exit (particularly those with more
attractive opportunities elsewhere in their global portfolios)
• This will result in a more concentrated market structure and the possibility that certain regions will become dominated by a diminishing number of fuel suppliers
In our view, the current market framework is not robust to provide a sufficiently high degree of resilience for future supply offuels to the UK market, with supply disruption risks increasing as a result of longer delivery distances, fewer suppliers, a smaller number of key terminals and alternative supply points
84
Delivering commercial insight to the global energy industry
www.woodmac.com
Final Report 8th June
7 Possible Mitigation of Barriers
85
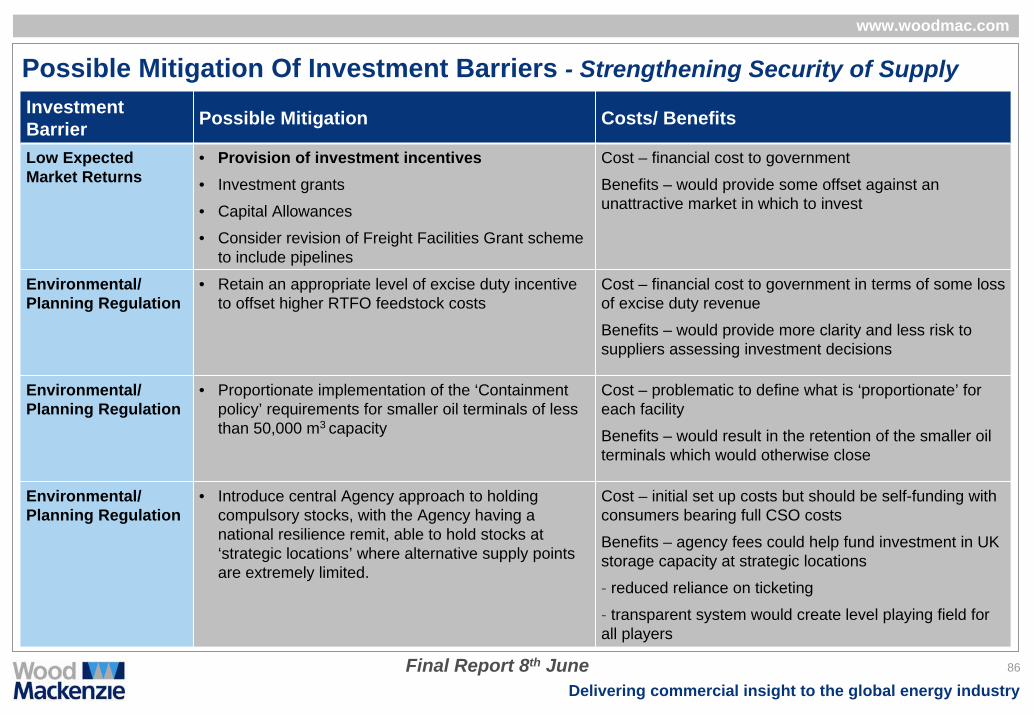
Delivering commercial insight to the global energy industry
www.woodmac.com
Final Report 8th June
Possible Mitigation Of Investment Barriers - Strengthening Security of SupplyInvestment Barrier Possible Mitigation Costs/ Benefits
Low Expected Market Returns
• Provision of investment incentives• Investment grants
• Capital Allowances
• Consider revision of Freight Facilities Grant scheme to include pipelines
Cost – financial cost to government
Benefits – would provide some offset against an unattractive market in which to invest
Environmental/ Planning Regulation
• Retain an appropriate level of excise duty incentive to offset higher RTFO feedstock costs
Cost – financial cost to government in terms of some loss of excise duty revenue
Benefits – would provide more clarity and less risk to suppliers assessing investment decisions
Environmental/ Planning Regulation
• Proportionate implementation of the ‘Containment policy’ requirements for smaller oil terminals of less than 50,000 m3 capacity
Cost – problematic to define what is ‘proportionate’ for each facility
Benefits – would result in the retention of the smaller oil terminals which would otherwise close
Environmental/ Planning Regulation
• Introduce central Agency approach to holding compulsory stocks, with the Agency having a national resilience remit, able to hold stocks at ‘strategic locations’ where alternative supply points are extremely limited.
Cost – initial set up costs but should be self-funding with consumers bearing full CSO costs
Benefits – agency fees could help fund investment in UK storage capacity at strategic locations
- reduced reliance on ticketing
- transparent system would create level playing field for all players
86
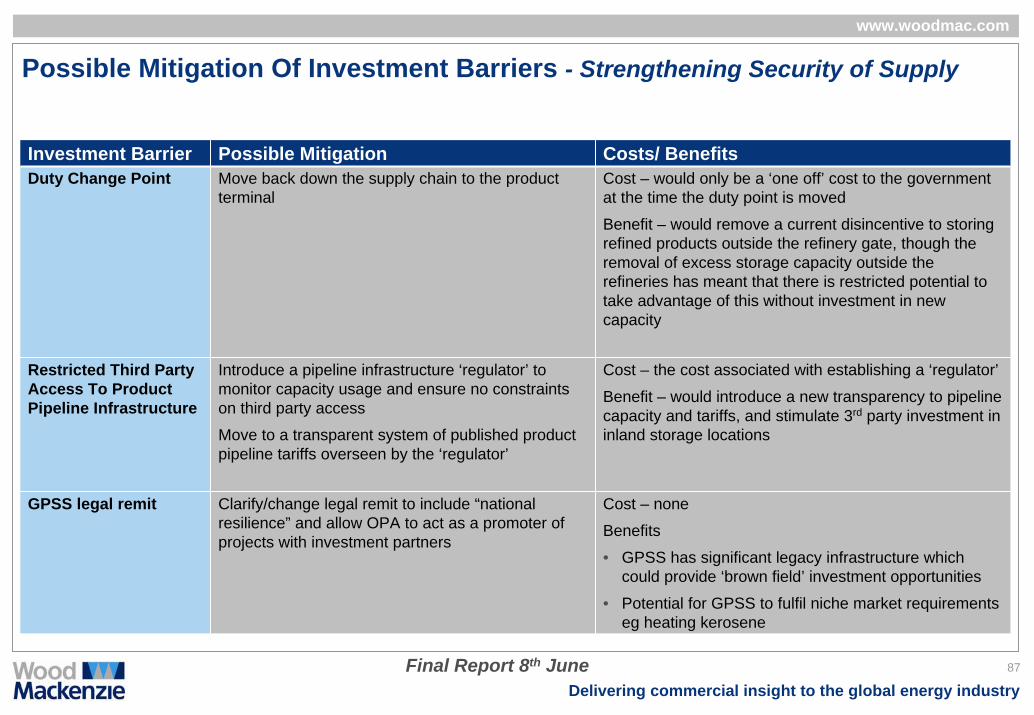
Delivering commercial insight to the global energy industry
www.woodmac.com
Final Report 8th June
Possible Mitigation Of Investment Barriers - Strengthening Security of Supply
Investment Barrier Possible Mitigation Costs/ BenefitsDuty Change Point Move back down the supply chain to the product
terminalCost – would only be a ‘one off’ cost to the government at the time the duty point is moved
Benefit – would remove a current disincentive to storing refined products outside the refinery gate, though the removal of excess storage capacity outside the refineries has meant that there is restricted potential to take advantage of this without investment in new capacity
Restricted Third Party Access To Product Pipeline Infrastructure
Introduce a pipeline infrastructure ‘regulator’ to monitor capacity usage and ensure no constraints on third party access
Move to a transparent system of published product pipeline tariffs overseen by the ‘regulator’
Cost – the cost associated with establishing a ‘regulator’
Benefit – would introduce a new transparency to pipeline capacity and tariffs, and stimulate 3rd party investment in inland storage locations
GPSS legal remit Clarify/change legal remit to include “national resilience” and allow OPA to act as a promoter of projects with investment partners
Cost – none
Benefits
• GPSS has significant legacy infrastructure which could provide ‘brown field’ investment opportunities
• Potential for GPSS to fulfil niche market requirements eg heating kerosene
87

Delivering commercial insight to the global energy industry
www.woodmac.com
Final Report 8th June
Possible Mitigation Of Investment Barriers - Summary
Wood Mackenzie considers the following as the priority mitigation actions which should be considered• Proportionate implementation of the ‘Containment Policy’ requirements for smaller oil terminals
• Would reduce the ‘stand still’ investment burden at these facilities and the likelihood of their closure. Therefore could have a significant impact at no cost to government
• Extend the ‘Freight Facilities Grant’ beyond just rail and water borne transport projects to include investment in pipeline projects
• Financial cost to govt, but would create a potential incentive to invest in new inland oil product pipeline infrastructure • RTFO – maintain the duty incentive on bio-fuels to mitigate the investment requirements as well as the additional
costs arising from high and volatile bio-fuel feedstock prices • Would be a financial cost to government, but would create a clearer incentive and support investment by suppliers
• Move the excise duty point down the supply chain to the oil terminal• A ‘one off’ cost to government, unlikely to have a short term impact due to the tightness of existing storage capacity, but would
encourage future investment in additional storage capacity outside of the refineries.• Change the remit of the Government Pipeline & Storage System (GPSS) to include ‘national resilience’
• No cost to government, but would provide the framework within which use of the system could be optimised. There is significant potential for the underutilised storage capacity and associated logistics to provide brown field investment opportunities
• Create a CSO agency to hold compulsory stocks at strategic locations• No cost to government – should be self funding through an additional tax levy – but would provide the possibility for holding
more stocks near key demand centres. This envisages the CSO agency having a supply resilience remit rather than purely cost optimisation
88

Delivering commercial insight to the global energy industry
www.woodmac.com
Final Report 8th June
8 Impact Of Financial Crisis
89

Delivering commercial insight to the global energy industry
www.woodmac.com
Final Report 8th June
Impact of the Financial Crisis - Limited Structural Implications For UK Downstream
Player Short term impacts Medium-long term impactsIntegrated refiner-marketers
Drop in global oil demand weakens refining margins although UK marketing margins remain unaffected
Concentration of operations into selected key locations or regions to offset drop in profitability
The economic slump has accelerated the emergence of a gasoline surplus in the Atlantic Basin
Increases the pressure for refinery closures or divestments in this region, with a preference for growth opportunities in the East
Independent refiners
Exposed to slump in refining margins without any support from integrated marketing operations
Potential to run out of cash
Can respond quickly to market signals and cut refining runs when breakeven is reached
Sustainable structural advantages of their assets become key to long term survival
Financial capability to undertake significant capital investments may be weakened
Independent importers/ storage companies
Tighter credit terms and higher insurance costs hard to pass on to customer
Volatile markets create uncertainty but also opportunity for first movers and those able to benefit from contango market conditions
Risk profile for pure infrastructure companies may be relatively low and therefore they remain more likely to access new capital
Potential for banks to maintain their higher profit margins, so that when base rates rise, financial costs become punitive
Independent distributors
Tighter credit terms and higher insurance costs hard to pass on to customer
Difficulty in financing capital investment
Consolidation of smaller distributors
A more concentrated market, less customer choice
Potential for banks to maintain their higher profit margins, so that when base rates rise, financial costs become punitive
90

Delivering commercial insight to the global energy industry
www.woodmac.com
Final Report 8th June
9 Summary Conclusions – Part 1
91
Delivering commercial insight to the global energy industry
www.woodmac.com
Final Report 8th June
1. Market Framework Constraints On Investment
The main economic factors underpinning discretionary downstream investment decisions are:• Availability of capital• Expected returns – whether these are sufficient to meet hurdle rates and how attractive relative to competing
investment opportunities• For multi-national companies, the relative attractiveness of the UK market is a key factor in terms of
downstream margins/ profitability and market growth prospects – this is influenced both by the competitive market structure and the regulatory environment within which companies have to operate
As a competitive, mature market characterised by low margins and returns and a lack of overall oil demand growth, the UK is viewed as relatively unattractive – especially for many of the international oil majors who are focusing their global downstream investments on developing markets overseas with strong future growth potential
• For the international oil majors investment in the UK has thus largely been confined to a ‘stay in business’ only basis – investing where necessary to comply with regulatory requirements, especially in relation to ever more stringent health, safety and environmental issues
• The UK regulatory environment provides no specific incentives to encourage investment in downstream infrastructure
• As much of the current infrastructure is old, the need to replace life expired equipment is likely to lead to further closures of facilities which will heighten the potential risks of future supply disruption
There are no real penalties for the failure to provide adequate capacity other than market related consequences
92

Delivering commercial insight to the global energy industry
www.woodmac.com
Final Report 8th June
1. Market Framework Constraints On Investment (continued)
As a result, many national players have increasingly focused their infrastructure within regions of the country that they can supply economically from their refineries and have withdrawn from areas remote from their main supply sources
• Means product supply into some of the more remote areas of the UK, e.g. the Scottish Highlands and Islands, has become increasingly concentrated with fewer alternative supply points
• It could be argued that there are insufficient market incentives in place to guarantee the retention of investment in the necessary infrastructure in such regions to ensure long term supply (e.g. the issue of what consumer price premia within these areas to support investment is ‘acceptable’ as opposed to relying upon product being trucked in from ever more remote locations)
• The economic downturn and weak refining margin outlook could result in further refinery closures in the UK
In overall terms, we consider that the UK downstream market has worked very effectively over recent decades from a consumer perspective. However, as a result of this long period of low margins, minimum investment and ongoing consolidation, the supply chain has become increasingly tight If there is a continuation of current market and investment trends, the best interests of the consumer may not, in fact, be served - due to the growing lack of resilience in the UK downstream oil supply chain that will become increasingly evident
93

Delivering commercial insight to the global energy industry
www.woodmac.com
Final Report 8th June
2. Regulatory Barriers To Investment
The main regulatory barriers to investment in new capacity in the UK by both existing players and potential new entrants relate to:
• Planning constraints – especially local authority land use planning in relation to establishing ‘green field’ sites for new facilities and classifying them under the ‘COMAH’ regulations
• The more stringent construction standards now required post Buncefield for new oil product storage facilities under the COMAH ‘Containment Policy’ regulations
• The excise duty change point being set at the refinery gate – provides an incentive to limit the quantity of products held on a duty paid basis outside the refineries (except at product import locations which are licensed to hold product ‘under bond’)
• The costs associated with complying with the RTFO and lack of clear duty incentive• Uncertainty concerning the future direction of regulation
While in theory access to common carrier product pipelines in the UK is open to all, there is a lack of transparency regarding pipeline utilisation. We believe many of these pipelines, (e.g. the UKOP system) are to all intents and purposes ‘full’
• This means that incumbent carriers have an incentive to try and maintain their volumes through the system and sell on a wholesale basis to third parties ex-rack at the receiving product terminal rather than at the refinery or point of ingress, and potential new entrants have no incentive to consider investing in storage infrastructure around these pipelines
Actions that could be taken to mitigate these investment barriers include:• Provision of investment grants/ incentives to compensate for the poor expected economic returns• Retain an element of excise duty incentive to compensate with the costs associated with the RTFO• Relax the requirements of the ‘Containment Policy’ on oil storage facilities of less than 50,000m3
• Move the excise duty change point from the refinery gate back down the supply chain to the oil storage terminal• Introduce an infrastructure ‘regulator’ to oversee third party access to product pipelines and introduce transparency to pipeline
tariffs• Introduce an agency to administer CSO stocks and control where they are held• Relax/clarify the current legal remit for the GPSS pipeline system and introduce a ‘national resilience’ aspect• Extend the Freight Facilities Grant to include pipeline infrastructure projects• Introduction of a greater degree of certainty over future regulation
94

Delivering commercial insight to the global energy industry
www.woodmac.com
Final Report 8th June
3. Financial Crisis
The current financial crisis and resulting economic downturn in itself is expected to have only a limited impact on the UK downstream oil sector – this precise effect will vary depending on the type of playerFor the integrated refiner/ marketers, lower oil demand is having an adverse impact on refining margins and refinery utilisation globally while the structural gasoline surplus across Europe is worsening
• this could force decisions to close uneconomic plants and focus marketing more regionally
Independent refiners (e.g. INEOS, Petroplus) will potentially be more exposed to the refining downturn since they lack the integrated marketing operations of the international majors and could struggle for cash in the short term
• Longer term they could find their capability to invest is weakened
• They will increasingly rely on any structural advantage conferred on them by their manufacturing assets
For independent product importers and storage groups the impact will be limited to tighter credit terms and higher insurance costs which will be difficult to pass on to the customer
• However, current market contango (an expectation of higher future oil prices compared to prevailing prices) means that demand on product storage to exploit trading opportunities is currently high
Independent product distributors will also be hit by tighter credit terms and higher insurance costs while they will also be potentially constrained by lack of access to capital
• Is likely to result in further rationalisation of the distributor sector in the UK resulting in a reduction of competition and consumer choice
95

Delivering commercial insight to the global energy industry
www.woodmac.com
Final Report 8th June
10 Three Oil Product Demand Scenarios
96

Delivering commercial insight to the global energy industry
www.woodmac.com
Final Report 8th June
Oil Demand Scenarios - IntroductionWood Mackenzie has developed a Base Case, High Case and Low Case to forecast oil product demand to 2030. The Base Case scenario is built on Wood Mackenzie’s detailed understanding of the UK energy market. Historical relationships between national GDP/capita and energy use serve as the basis for a total energy demand forecast and lead to a view on oil’s position in the future total energy mix. In turn, trends in demand for individual oil products will be based on examination of historical changes and an appreciation of developments in the key sectors of use, for example transportation, power generation etc.
An overview of our demand forecasting model is illustratedAll three scenarios are based upon Wood Mackenzie’s own assumptions with regard to GDP, population and other energy sector input variables. They are intended to show product demand on a regional level to 2030 and to be the basis to ‘stress test’ the UK downstream oil infrastructure. For example, the High Case assumes high demand growth and low oil prices, while the Low Case assume low demand growth and high oil prices.
97
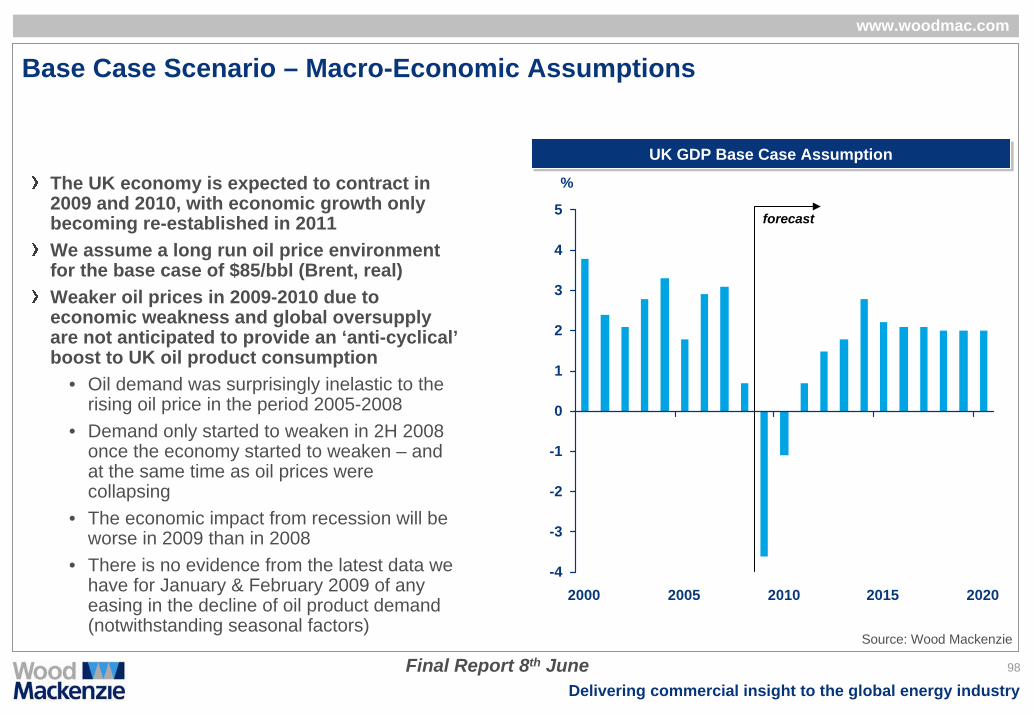
Delivering commercial insight to the global energy industry
www.woodmac.com
Final Report 8th June
Base Case Scenario – Macro-Economic Assumptions
UK GDP Base Case AssumptionUK GDP Base Case Assumption
forecast
The UK economy is expected to contract in 2009 and 2010, with economic growth only becoming re-established in 2011We assume a long run oil price environment for the base case of $85/bbl (Brent, real) Weaker oil prices in 2009-2010 due to economic weakness and global oversupply are not anticipated to provide an ‘anti-cyclical’boost to UK oil product consumption
• Oil demand was surprisingly inelastic to the rising oil price in the period 2005-2008
• Demand only started to weaken in 2H 2008 once the economy started to weaken – and at the same time as oil prices were collapsing
• The economic impact from recession will be worse in 2009 than in 2008
• There is no evidence from the latest data we have for January & February 2009 of any easing in the decline of oil product demand
-4
-3
-2
-1
0
1
2
3
4
5
2000 2005 2010 2015 2020
%
(notwithstanding seasonal factors)Source: Wood Mackenzie
98

Delivering commercial insight to the global energy industry
www.woodmac.com
Final Report 8th June
Base Case Scenario – Background to GDP Outlook
With significant direct exposure to the financial sector, the United Kingdom is one of the worst affected western European economies.
• The direct loss in output from the financial services industry is marked and the impact of this combined with lost tax revenue from corporates and households (via falling consumption) is creating a serious problem for the Government purse.
• In order to meet fiscal stimuli commitments, the Government must now borrow at unprecedented levels. • For non-financial corporates, the outlook is bleak as closures accelerate because banks are unable to
provide credit lines.
The banking system will remain paralysed until the extent of banking sector write downs are disclosed. With debt at record levels, households are also in a vulnerable position. Low interest rates are supporting high debt levels but with unemployment and house repossessions rising, households are rapidly deleveraging (saving where possible). This is only acting to exacerbate the fall in consumer spending. Wood Mackenzie expect the UK economy to contract significantly in 2009 and 2010. Looking to the long-term, we expect the UK to fall back to an average growth rate of just 1.9 percent as the working population falls and productivity gains ease
99

Delivering commercial insight to the global energy industry
www.woodmac.com
Final Report 8th June
Base Case Scenario – Summary of Other Key Drivers
Long term oil price assumption of $85/bbl (flat real)• Demand growth is balance by timely non-OPEC investment, with OPEC remaining relatively disciplined
Transport fuel demand forecasts are developed using Wood Mackenzie’s proprietary model that takes into account factors including
• GDP growth rates• Evolution of the car parc – the number of cars and the proportion of diesels• Fuel efficiency trends and average fuel consumed per car• Relationship of commercial diesel demand to GDP
In the Base Case the dieselisation trend in the car fleet is expected to ease as the economic and technological advantages of diesel cars are partially erodedIn the Base Case the expansion of Stansted airport (2nd runway) becomes operational in 2017 and that the third runway at Heathrow becomes operational in 2020. In the very long term demand growth of jet fuel will be limited by improving fuel efficiency and a weakening of the air travel demand (most likely driven by environmental & cost drivers)The UK government’s Heat and Energy Saving Strategy consultation sets out the Governments long-term vision for dramatically improving the energy efficiency of UK homes and businesses and expanding the provision of low carbon heat. In the Base Case these measures result in a projected reduction of approximately 8% of non-transport oil demand by 2020 The MARPOL VI proposals for marine fuels would lead to a significant increase in marine gas oil demand. As discussed elsewhere in this report, Wood Mackenzie has assumed the proposals will not be implemented as proposed and therefore MARPOL VI is not reflected in the Base Case.
100

Delivering commercial insight to the global energy industry
www.woodmac.com
Final Report 8th June
Base Case Scenario – Summary Product Forecasts
101
0
5
10
15
20
25
30
1978 1983 1988 1993 1998 2003 2008 2013 2018 2023 2028
Gasoline Jet FuelHeating kerosene Gas oilRoad diesel
UK Base Case Oil Product Demand ForecastUK Base Case Oil Product Demand Forecast
forecast
Source: Wood Mackenzie, IEA
Mt
In common with many other European countries, there are a number of well-established demand trends in the UK
• Gasoline demand has consistently declined• Road diesel demand has risen strongly• Jet fuel demand has risen strongly, although
the upward trend has been interrupted several times (e.g. by 9/11, the Buncefield disaster in 06, the current recession)
• Gas oil demand has been on a gradual downward trend as manufacturing intensity in the UK has declined
• Heating kerosene consumption has remained robust and, in contrast to much of Europe, this is a large market in the UK
We discuss the individual product forecasts on the following slides

Delivering commercial insight to the global energy industry
www.woodmac.com
Final Report 8th June
Base Case Scenario – Gasoline Demand Forecast
The numbers of cars in the UK has increased from 23.0 to 31.5 million between 1990, when gasoline demand peaked, and 2008However the proportion of diesel cars has risen as this vehicle type has taken a growing share of new car registrations
• The diesel share of new car registrations has risen from 6% in 1990 to 44% in 2008
Moreover, the fuel consumed per gasoline car has fallen as the car fleet has become increasingly fuel efficientThese trends have combined to create a structural downward trend in gasoline demand since the 1990sThe economic weakness in 2009-2010 will continue the downward trend in the short term In the long term (2015 and beyond) we expect some move back towards gasoline cars as the result of highly efficient gasoline direct injection engines entering the market. This will the slow the rate of decline, although the downward trend will continue as efficiency improvements continue
0
5
10
15
20
25
30
1978 1983 1988 1993 1998 2003 2008 2013 2018 2023 2028-8%
-6%
-4%
-2%
0%
2%
4%
6%
Demand (LHS) % change p.a. (RHS)
UK Base Case Gasoline Demand ForecastUK Base Case Gasoline Demand Forecast
Mt
forecast
Source: Wood Mackenzie, IEA
102
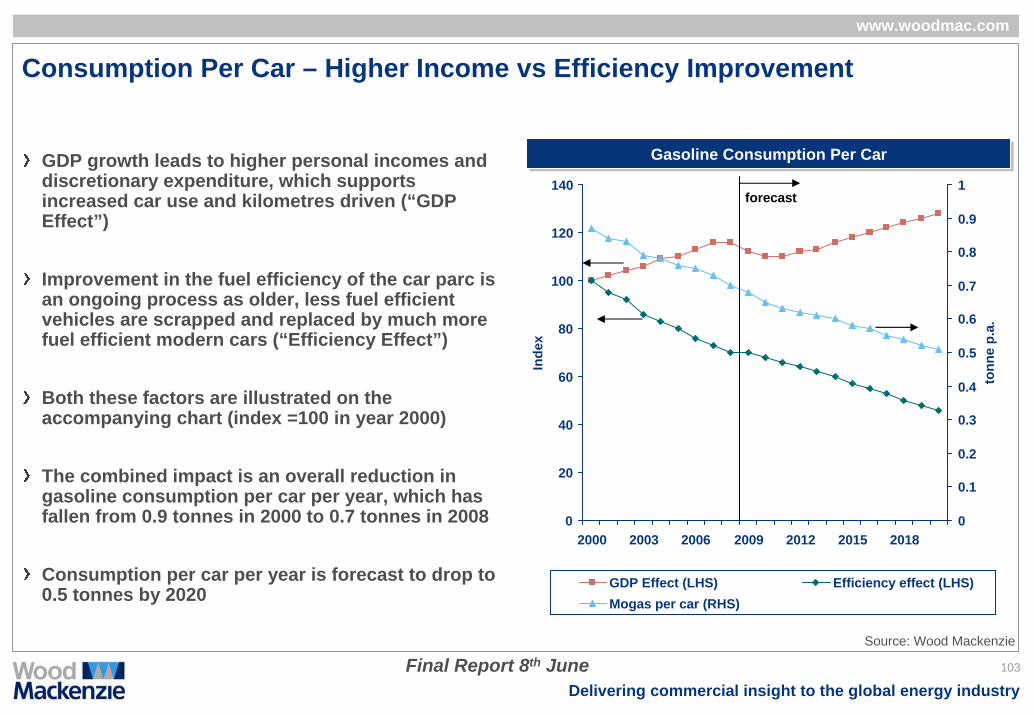
Delivering commercial insight to the global energy industry
www.woodmac.com
Final Report 8th June
Consumption Per Car – Higher Income vs Efficiency Improvement
103
0
20
40
60
80
100
120
140
2000 2003 2006 2009 2012 2015 2018In
dex
0
0.1
0.2
0.3
0.4
0.5
0.6
0.7
0.8
0.9
1
tonn
e p.
a.
GDP Effect (LHS) Efficiency effect (LHS)Mogas per car (RHS)
Gasoline Consumption Per CarGasoline Consumption Per Car
Source: Wood Mackenzie
forecast
GDP growth leads to higher personal incomes and discretionary expenditure, which supports increased car use and kilometres driven (“GDP Effect”)
Improvement in the fuel efficiency of the car parc is an ongoing process as older, less fuel efficient vehicles are scrapped and replaced by much more fuel efficient modern cars (“Efficiency Effect”)
Both these factors are illustrated on the accompanying chart (index =100 in year 2000)
The combined impact is an overall reduction in gasoline consumption per car per year, which has fallen from 0.9 tonnes in 2000 to 0.7 tonnes in 2008
Consumption per car per year is forecast to drop to 0.5 tonnes by 2020
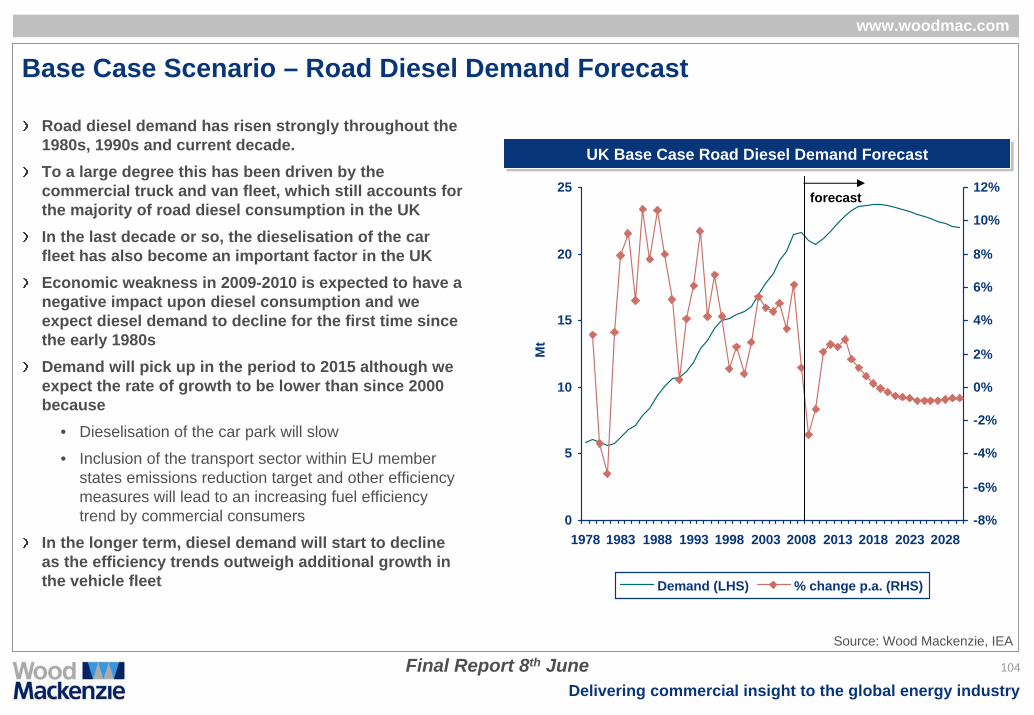
Delivering commercial insight to the global energy industry
www.woodmac.com
Final Report 8th June
Base Case Scenario – Road Diesel Demand Forecast
Road diesel demand has risen strongly throughout the 1980s, 1990s and current decade.To a large degree this has been driven by the commercial truck and van fleet, which still accounts for the majority of road diesel consumption in the UKIn the last decade or so, the dieselisation of the car fleet has also become an important factor in the UKEconomic weakness in 2009-2010 is expected to have a negative impact upon diesel consumption and we expect diesel demand to decline for the first time since the early 1980sDemand will pick up in the period to 2015 although we expect the rate of growth to be lower than since 2000 because
• Dieselisation of the car park will slow
• Inclusion of the transport sector within EU member states emissions reduction target and other efficiency measures will lead to an increasing fuel efficiency trend by commercial consumers
In the longer term, diesel demand will start to decline as the efficiency trends outweigh additional growth in the vehicle fleet
0
5
10
15
20
25
1978 1983 1988 1993 1998 2003 2008 2013 2018 2023 2028-8%
-6%
-4%
-2%
0%
2%
4%
6%
8%
10%
12%
Demand (LHS) % change p.a. (RHS)
UK Base Case Road Diesel Demand ForecastUK Base Case Road Diesel Demand Forecast
Source: Wood Mackenzie, IEA
Mt
forecast
104

Delivering commercial insight to the global energy industry
www.woodmac.com
Final Report 8th June
Strong Dieselisation of the Car Parc
105
0
5000
10000
15000
20000
25000
30000
35000
40000
2000 2005 2010 2015 2020 2025 2030m
illio
n0
5
10
15
20
25
30
35
40
45
50
%
Total car parc (LHS)% diesel new registrations (RHS)% diesels in car parc (RHS)
Our transport fuel demand forecasts are developed using Wood Mackenzie’s proprietary model that takes into account factors including
• GDP growth rates• Evolution of the car parc – the number of cars and the
proportion of diesels• Fuel efficiency trends and average fuel consumed per car• Relationship of commercial diesel demand to GDP
As in many European countries, the popularity of diesel cars has grown significantly in the UK over recent years
• 44% of new cars were diesels in 2008While we expect some further moderate growth of the car parc and that the dieselisation trend of the car parc will continue, we believe that the share of diesel cars in new registrations is close to peaking due to
• The introduction of more efficient gasoline engine technology by the major motor manufacturers (eg gasoline direct injection)
• Higher pump prices for diesel relative to gasoline in future (due to the growing European deficit)
Car Parc - UKCar Parc - UK
Source: Wood Mackenzie
forecast

Delivering commercial insight to the global energy industry
www.woodmac.com
Final Report 8th June
Base Case Scenario – Jet Kerosene Demand Forecast
UK jet kerosene demand fell in the recessions in the early 1980s and 1990s - we expect another decline in 2009-2010 from the current recession
• Jet fuel demand also fell following 9/11 and the Buncefield disaster
Once economic recovery becomes established from 2011 we expect that demand will once again begin its upward trendHowever, demand will have effectively been “destroyed” by the recession and the growth trend will become re-established at the lower base point in 2012Capacity constraints in the UK airport infrastructure have been evident in recent years, particularly for the London airports of Heathrow and GatwickIn our base case we assume that the expansion of Stansted airport (2nd runway) becomes operational in 2017 and that the third runway at Heathrow becomes operational in 2020This capacity expansion supports further growth in UK air travel and jet kero demand from 2017In the very long term we assume that demand growth will be limited by fuel efficiency and a weakening of the air travel demand (most likely driven by environmental & cost drivers)
0
2
4
6
8
10
12
14
16
18
20
1978 1983 1988 1993 1998 2003 2008 2013 2018 2023 2028-8%
-6%
-4%
-2%
0%
2%
4%
6%
8%
10%
12%
Demand (LHS) % change p.a. (RHS)
UK Base Case Jet Kerosene Demand ForecastUK Base Case Jet Kerosene Demand Forecast
Source: Wood Mackenzie, IEA
Mt
forecast
106

Delivering commercial insight to the global energy industry
www.woodmac.com
Final Report 8th June
Base Case Scenario – Heating Kerosene Demand Forecast
The UK has a large heating kerosene market which grew through the 1980s and 1990s although more recently has shown signs of maturityAs for other oil products, the economic weakness in 2009-2010 is expected to depress consumption
• About 40% of heating kerosene demand is in the industrial, commercial and agricultural sectors
The UK government’s Heat and Energy Saving Strategy consultation sets out the Governments long-term vision for dramatically improving the energy efficiency of UK homes and businesses and expanding the provision of low carbon heat. The measures result in a projected reduction of approximately 8% of non-transport oil demand by 2020Wood Mackenzie has factored this initiative into our forecasts by assuming the displacement of circa 350kt of heating kerosene demand by 2020Beyond 2020, the downward trend continues as a result of further displacement by low carbon heat and efficiency improvements
0
0.5
1
1.5
2
2.5
3
3.5
4
4.5
1978 1983 1988 1993 1998 2003 2008 2013 2018 2023 2028-25%
-20%
-15%
-10%
-5%
0%
5%
10%
15%
20%
25%
Demand (LHS) % change p.a. (RHS)
UK Base Case Heating Kerosene Demand ForecastUK Base Case Heating Kerosene Demand ForecastUK Base Case Jet Kerosene Demand ForecastUK Base Case Jet Kerosene Demand Forecast
Mt
forecast
Source: Wood Mackenzie, IEA
107

Delivering commercial insight to the global energy industry
www.woodmac.com
Final Report 8th June
Base Case Scenario – Gas Oil Demand Forecast
0
2
4
6
8
10
12
14
16
1978 1983 1988 1993 1998 2003 2008 2013 2018 2023 2028-20%
-15%
-10%
-5%
0%
5%
10%
Demand (LHS) % change p.a. (RHS)
UK Base Case Heating Kerosene Demand ForecastUK Base Case Heating Kerosene Demand Forecast
Gas oil has a wide range of uses, ranging from space/water heating through to use for motive power in industrial sectors such as construction and mining/quarrying, and also as a marine bunker fuel in shipping. Year-on-year demand is volatile but the long term trend has been downward, mainly due to displacement by natural gas and lower demand in industry. Once the economy recovers from recession, the rate of demand decline is expected to be slower in future From the beginning of 2010, gas oil used for motive purposes (“off-road diesel”) is required to meet the 10ppm quality of road diesel, and UK refiners plan to mark diesel to supply off-road consumers so as to differentiate it for excise tax purposes fromroad diesel. Off-road diesel is included within this chartA high proportion of the UK’s imports and exports are shipped into and out of the country and a good proportion of this trade is conducted with Europe by smaller vessels which are more likely to use gas/diesel oil than heavy fuel oil. Demand has been around 1.0 Mt in recent years, although with significant variations from year to year. We expect demand to recover from a low-point in 2007 and to remain robust through to 2020. The MARPOL VI proposals for marine fuels would lead to a significant increase in marine gas oil demand. As discussed elsewhere in this report, Wood Mackenzie has assumed the proposals will not be implemented as proposed. Gas oil use in households is currently low in the UK, although afuture excise duty reduction on its use as a heating fuel could boost demand at the expense of heating kerosene
UK Base Case Gas Oil Demand ForecastUK Base Case Gas Oil Demand Forecast
Source: Wood Mackenzie, IEA
Mt
forecast
108

Delivering commercial insight to the global energy industry
www.woodmac.com
Final Report 8th June
Gasoline Demand By Region2007 Demand (kt)2007 Demand (kt) 2007-2020 Average Growth Rates2007-2020 Average Growth Rates
Source: Wood Mackenzie
The South East region is estimated to account for 16% of total UK gasoline demand, whereas the North East and Northern Ireland account for only 4% each. Demand is forecast to decline in all regions, with varying rates of population growth explaining differences in future regional demand.
0
500
1000
1500
2000
2500
3000
WALESSCOTLAND
NORTH EAST
NORTH WEST
YORKSHIRE A
ND THE HUMBER
EAST MID
LANDS
WEST MID
LANDS
EAST OF ENGLAND
GREATER LONDONSOUTH EAST
SOUTH WEST
NORTHERN IRELAND
-6.00%
-5.00%
-4.00%
-3.00%
-2.00%
-1.00%
0.00%
WALES
SCOTLAND
NORTH EAST
NORTH W
EST
YORKSHIRE A
ND THE HUMBER
EAST MID
LANDS
WEST M
IDLA
NDS
EAST OF ENGLA
ND
GREATER LONDON
SOUTH EAST
SOUTH WEST
NORTHERN IR
ELAND
TOTAL
109

Delivering commercial insight to the global energy industry
www.woodmac.com
Final Report 8th June
Road Diesel Oil Demand By Region2007 Demand (kt)2007 Demand (kt) 2007-2020 Average Growth Rates2007-2020 Average Growth Rates
Source: Wood Mackenzie
The South East region is estimated to account for 14% of total UK road diesel demand, whereas Northern Ireland accounts for only 3%. Demand is forecast to rise in all regions, with varying rates of population growth explaining differences in future regional demand.
0
500
1000
1500
2000
2500
3000
3500
WALES
SCOTLAND N
ORTH EAST
NORTH
WEST
YORKSHIRE A
ND THE HUMBER
EAST MID
LANDS
WEST M
IDLANDS
EAST OF ENGLAND
GREATER LONDON
SOUTH EAST
SOUTH WEST
NORTH
ERN IRELAND
0.00%
0.10%
0.20%
0.30%
0.40%
0.50%
0.60%
0.70%
0.80%
0.90%
1.00%
WALES
SCOTLAND
NORTH
EAST
NORTH
WEST
YORKSHIRE A
ND THE HUMBER
EAST MID
LANDS
WEST M
IDLANDS
EAST OF ENGLAND
GREATER LONDON
SOUTH EAST
SOUTH WEST
NORTH
ERN IRELANDTOTAL
110

Delivering commercial insight to the global energy industry
www.woodmac.com
Final Report 8th June 111
0.00%
0.50%
1.00%
1.50%
2.00%
2.50%
3.00%
3.50%
4.00%
4.50%
5.00%
WALESSCOTLAND
NORTH EAST
NORTH WEST
YORK AND THE H
UMBER
EAST MID
LANDS
WEST MID
LANDS
EAST OF ENGLAND
GREATER LONDON
SOUTH EAST
SOUTH WEST
NORTHERN IRELANDTOTAL
0
1000
2000
3000
4000
5000
6000
7000
WALESSCOTLAND
NORTH EAST
NORTH WEST
YORK AND THE H
UMBER
EAST MID
LANDS
WEST MID
LANDS
EAST OF ENGLAND
GREATER LONDONSOUTH EASTSOUTH W
EST
NORTHERN IRELAND
Jet Kero Demand By Region2007 Demand (kt)2007 Demand (kt) 2007-2020 Average Growth Rates2007-2020 Average Growth Rates
Source: Wood Mackenzie
Greater London is estimated to account for circa 50% of total UK jet kero demand, as a result of the high consumption at Heathrow airport. Remaining demand is concentrated at a relatively small number of major airports. The high growth rate in East of England reflects development of the second runway at Stansted airport, whereas both Heathrow (Greater London) and Gatwick (South East) are already operating at close to current capacity

Delivering commercial insight to the global energy industry
www.woodmac.com
Final Report 8th June
Heating Kerosene Demand By Region
-4.00%
-3.50%
-3.00%
-2.50%
-2.00%
-1.50%
-1.00%
-0.50%
0.00%
WALESSCOTLANDNORTH EAST
NORTH WEST
YORKSHIRE A
ND THE HUMBER
EAST MID
LANDS
WEST MID
LANDS
EAST OF ENGLAND
GREATER LONDON
SOUTH EAST
SOUTH WEST
NORTHERN IRELAND
TOTAL
0
100
200
300
400
500
600
700
800
900
WALESSCOTLAND
NORTH EAST
NORTH WEST
YORKSHIRE A
ND THE HUMBER
EAST MID
LANDS
WEST MID
LANDS
EAST OF ENGLAND
GREATER LONDON
SOUTH EAST
SOUTH WEST
NORTHERN IRELAND
2007 Demand (kt)2007 Demand (kt) 2007-2020 Average Growth Rates2007-2020 Average Growth Rates
Source: Wood Mackenzie
In Great Britain, heating kerosene is primarily used in rural areas where natural gas is unavailable. However, Northern Ireland is the largest UK regional market, accounting for circa 22% UK demand. There is heating kerosene significant consumption in the South East, Scotland and South West.
112

Delivering commercial insight to the global energy industry
www.woodmac.com
Final Report 8th June
UK Demand Scenarios – Key Drivers
HIGH CASE• Low oil price ($40/bbl flat real long term)
• OPEC undisciplined• Non-OPEC production surprises
• High economic growth• Faster recovery from crisis
• High population growth• Limited action to reduce emissions
• EU ETS III allocation of permits• No change in consumer behaviour
• Bio-fuels leave the mainstream• Food vs fuel, no technology breakthrough
• Vehicle technology• Efficiency gains slow• Electric vehicles remain uneconomic• Hydrogen remains a pipe dream
LOW CASE• High oil price ($130/bbl flat real long term)
• OPEC constraint• High costs of non-OPEC production
• Low economic growth• Prolonged downturn
• Low population growth• Dramatic action to reduction emissions
• EU ETS III auctioning of permits• Change in consumer behaviour
• Aggressive uptake of bio-fuels• Breakthrough on 2nd generation technology
• Vehicle technology• Rapid improvement in efficiency• Introduction of electric/hybrid vehicles• Hydrogen breakthrough?
113

Delivering commercial insight to the global energy industry
www.woodmac.com
Final Report 8th June
Demand Scenarios Key Drivers (1)
114
0
0.1
0.2
0.3
0.4
0.5
0.6
0.7
2000 2005 2010 2015 2020 2025 2030
Base High Low
-5
-4
-3
-2
-1
0
1
2
3
4
5
2000 2005 2010 2015 2020 2025 2030
Base High Low
forecast
GDPGDP
forecast
Population GrowthPopulation Growth
Source: Wood Mackenzie
%Mt
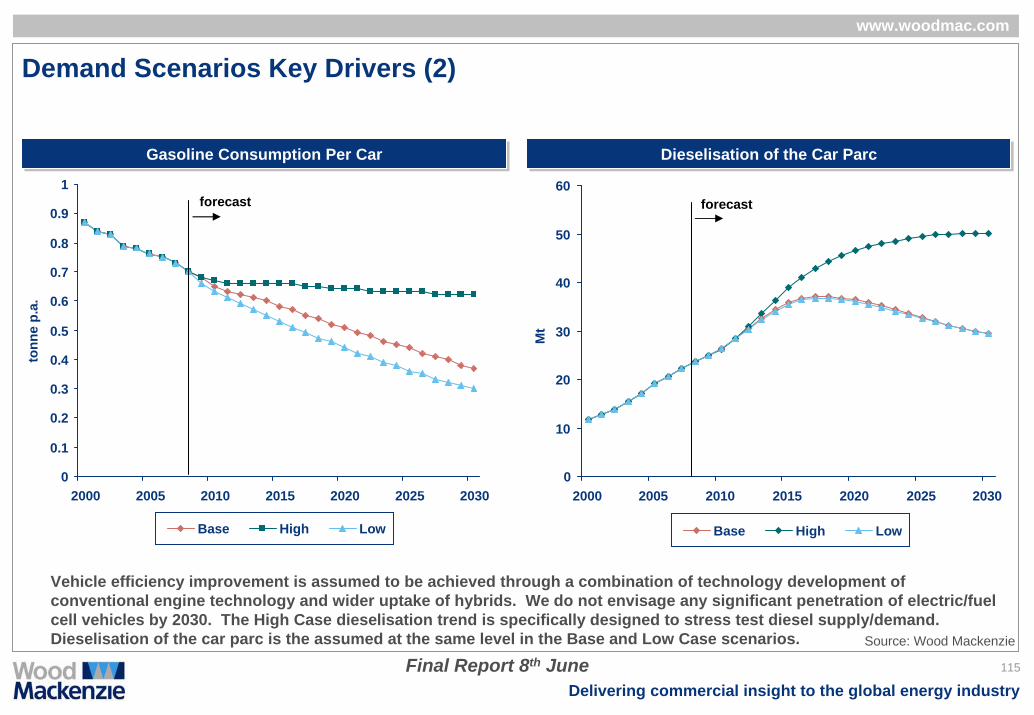
Delivering commercial insight to the global energy industry
www.woodmac.com
Final Report 8th June
Demand Scenarios Key Drivers (2)
0
10
20
30
40
50
60
2000 2005 2010 2015 2020 2025 2030
Base High Low
0
0.1
0.2
0.3
0.4
0.5
0.6
0.7
0.8
0.9
1
2000 2005 2010 2015 2020 2025 2030
Base High Low
forecast
Gasoline Consumption Per CarGasoline Consumption Per Car
forecast
Dieselisation of the Car ParcDieselisation of the Car Parc
Vehicle efficiency improvement is assumed to be achieved through a combination of technology development of conventional engine technology and wider uptake of hybrids. We do not envisage any significant penetration of electric/fuel cell vehicles by 2030. The High Case dieselisation trend is specifically designed to stress test diesel supply/demand. Dieselisation of the car parc is the assumed at the same level in the Base and Low Case scenarios. Source: Wood Mackenzie
tonn
e p.
a.
Mt
115
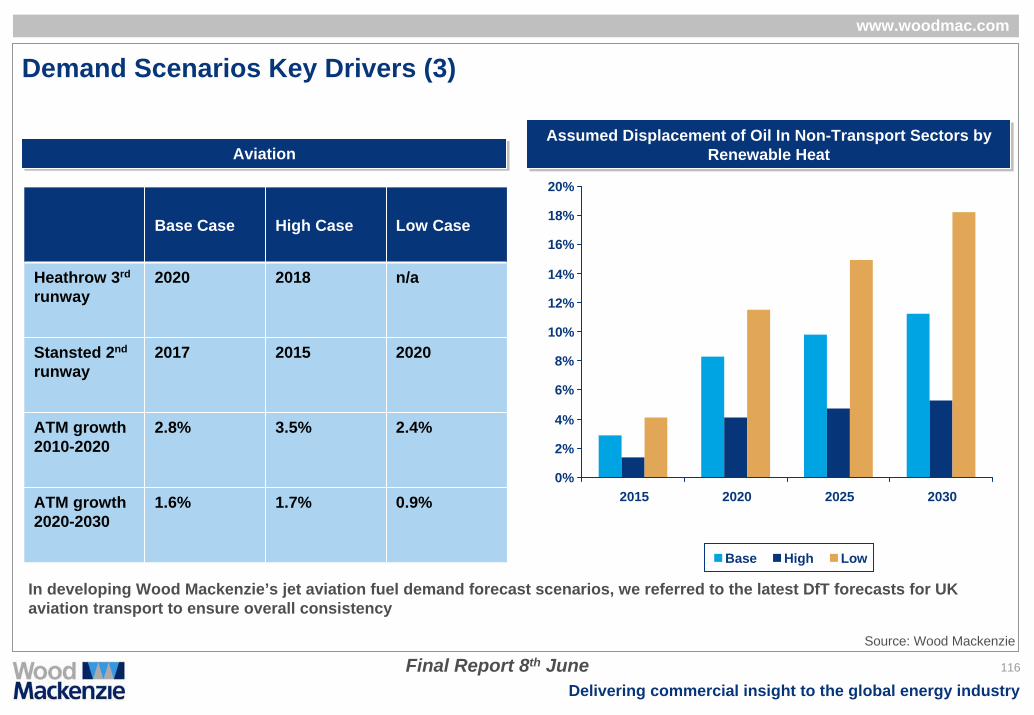
Delivering commercial insight to the global energy industry
www.woodmac.com
Final Report 8th June
Demand Scenarios Key Drivers (3)
Base Case High Case Low Case
Heathrow 3rd
runway2020 2018 n/a
Stansted 2nd
runway2017 2015 2020
ATM growth 2010-2020
2.8% 3.5% 2.4%
ATM growth 2020-2030
1.6% 1.7% 0.9%
AviationAviationAssumed Displacement of Oil In Non-Transport Sectors by
Renewable HeatAssumed Displacement of Oil In Non-Transport Sectors by
Renewable Heat
In developing Wood Mackenzie’s jet aviation fuel demand forecast scenarios, we referred to the latest DfT forecasts for UK aviation transport to ensure overall consistency
0%
2%
4%
6%
8%
10%
12%
14%
16%
18%
20%
2015 2020 2025 2030
Base High Low
Source: Wood Mackenzie
116
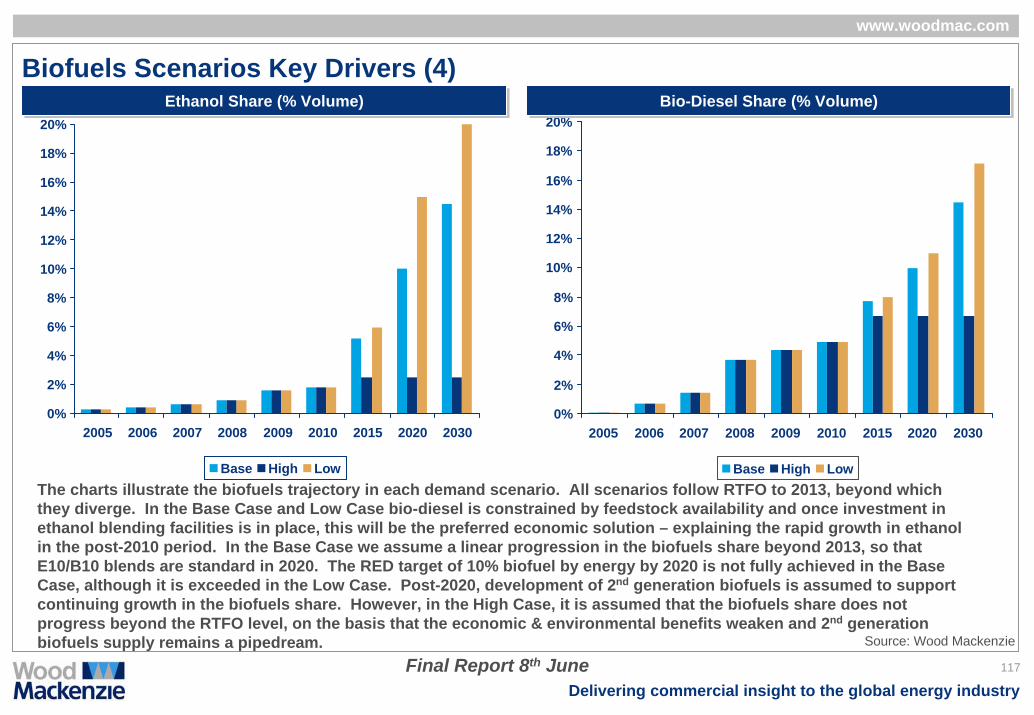
Delivering commercial insight to the global energy industry
www.woodmac.com
Final Report 8th June 117
0%
2%
4%
6%
8%
10%
12%
14%
16%
18%
20%
2005 2006 2007 2008 2009 2010 2015 2020 2030
Base High Low
0%
2%
4%
6%
8%
10%
12%
14%
16%
18%
20%
2005 2006 2007 2008 2009 2010 2015 2020 2030
Base High Low
Biofuels Scenarios Key Drivers (4)Bio-Diesel Share (% Volume)Bio-Diesel Share (% Volume)
The charts illustrate the biofuels trajectory in each demand scenario. All scenarios follow RTFO to 2013, beyond which they diverge. In the Base Case and Low Case bio-diesel is constrained by feedstock availability and once investment in ethanol blending facilities is in place, this will be the preferred economic solution – explaining the rapid growth in ethanol in the post-2010 period. In the Base Case we assume a linear progression in the biofuels share beyond 2013, so that E10/B10 blends are standard in 2020. The RED target of 10% biofuel by energy by 2020 is not fully achieved in the Base Case, although it is exceeded in the Low Case. Post-2020, development of 2nd generation biofuels is assumed to support continuing growth in the biofuels share. However, in the High Case, it is assumed that the biofuels share does not progress beyond the RTFO level, on the basis that the economic & environmental benefits weaken and 2nd generation biofuels supply remains a pipedream.
Ethanol Share (% Volume)Ethanol Share (% Volume)
Source: Wood Mackenzie

Delivering commercial insight to the global energy industry
www.woodmac.com
Final Report 8th June
Demand Scenarios – Oil Product Forecasts Compared
118
0
5
10
15
20
25
30
35
2000 2005 2010 2015 2020 2025 2030
Base High Low
0
5
10
15
20
25
2000 2005 2010 2015 2020 2025 2030
Base High Low
forecast
GasolineGasoline
forecast
Road Diesel*Road Diesel*
MtMt
* Not including “off-road diesel” from 2010Source: Wood Mackenzie

Delivering commercial insight to the global energy industry
www.woodmac.com
Final Report 8th June
Demand Scenarios – Oil Product Forecasts Compared
119
0
0.5
1
1.5
2
2.5
3
3.5
4
4.5
2000 2005 2010 2015 2020 2025 2030
Base High Low
0
5
10
15
20
25
2000 2005 2010 2015 2020 2025 2030
Base High Low
forecast
Jet KeroseneJet Kerosene
forecast
Heating KeroseneHeating Kerosene
Mt
Mt
Source: Wood Mackenzie

Delivering commercial insight to the global energy industry
www.woodmac.com
Final Report 8th June
Demand Scenarios – Oil Product Forecasts Compared
120
0
10
20
30
40
50
60
70
80
2000 2005 2010 2015 2020 2025 2030
Base High Low
0
1
2
3
4
5
6
7
8
9
10
2000 2005 2010 2015 2020 2025 2030
Base High Low
forecast
Gas Oil*Gas Oil* Total Oil ProductsTotal Oil Products
forecast
Mt
Mt
* Includes “off road diesel” from 2010
Source: Wood Mackenzie
Delivering commercial insight to the global energy industry
www.woodmac.com
Final Report 8th June
11 Capability to Meet Future Oil Product Demand
121

Delivering commercial insight to the global energy industry
www.woodmac.com
Final Report 8th June
UK refineries can process a total of 1.7 million barrels of crude per day, from 8 main fuels assets
Key UK Refining Assets*Key UK Refining Assets*The UK is one of the major European refining markets with a crude capacity of 1,722 kbdThere are now eight main fuels refineries in the UK and two speciality refineries (our Base Case assumption is that Petroplus’ Teesside refinery will remain closed)The proportion of refining capacity held by the supermajors has declined following recent refinery transactions
• BP exited UK refining when it sold Coryton to Petroplus in 2007
• Total reduced its exposure to UK refining when it sold its 70% share in the Milford Haven refinery to previous joint-venture partner Murco, effective end-2007
The table opposite gives an overview of the UK refining infrastructure in terms of overall nameplate crude capacity, and the capacities of the key upgrading unitsThe prevalence of Cat Cracking capacity compared with hydrocracking capacity results in a general trend towards production of gasoline rather than diesel and gasoil
Refinery Crude Unit
(kbd)
Cat Cracking
(kbd)
Hydro Cracking
(kbd)
Coking (kbd)
Coryton 163 60 - -
Milford Haven 103 34 - -
Fawley 326 75 - -
Grangemouth 200 18 38 -
Lindsey Oil Refinery
218 49 - -
Pembroke 209 86 - -
Stanlow 282 72 - -
Humber Refinery 221 50 - 65
Total 1,722 444 38 65
* Excluding Teesside refinery, CDU 111 kbd
Source: Wood Mackenzie Refinery Evaluation Model
122

Delivering commercial insight to the global energy industry
www.woodmac.com
Final Report 8th June
UK refining is oriented more towards gasoline than gas/diesel oil
2000-2008 Average Product Yields2000-2008 Average Product YieldsThe chart shows the average product yield on total refinery feedstocks processed for the UK and OECD Europe (excluding the UK)This shows the UK refining industry has a structurally lower than average yield of diesel/gasoil productsConversely, the UK has a higher than average yield of naphtha/gasoline
0%
5%
10%
15%
20%
25%
30%
35%
40%
Nap
htha
/Gas
olin
e
Jet/K
ero
Die
sel/G
asoi
l
Fuel
Oil
Yiel
d, %
OECD Europe UKSource: IEA
123

Delivering commercial insight to the global energy industry
www.woodmac.com
Final Report 8th June
Negative outlook for European refinery utilisation, including UK
Refinery Utilisation – History and ForecastRefinery Utilisation – History and ForecastUtilisation rates are expected to come under pressure as the existing supply infrastructure adjusts to reduced demand for oil products, and competition from newly constructed export refineries in the Middle East and India that will push product into Europe
• Our analysis reflects the impact of reduced demand and bio-fuels substitution across the Atlantic Basin, most notably the emergence of a gasoline surplus in the Atlantic Basin, which significantly impacts refinery throughputs in Europe
Since 2006, utilisation of UK refining capacity has been lower than the European average – utilisation history and forecast is shown in the chart oppositeThe utilisation forecast is based on nameplate capacity of the current refining infrastructure – ie assuming no further closures. Should any closures occur, the actual utilisation of the remaining assets is likely to increase
• But based upon current capacity our analysis suggests utilisation rates in Europe and the UK will have to drop to the 70-75% range if regional product imbalances are to be sustainable
We believe there will be a structural price premium on diesel due to European deficits, which will support crude throughputs in diesel-focussed assets. In contrast gasoline prices in Europe will be relatively weak due to a structural regional surplus, impacting on refiners more suited to gasoline production who will either be forced to dispose of gasoline in long-haul markets or cut crude throughputsHydrocracking and coking refineries will be protected to some extent by their ability to produce diesel, and to process heavy crude respectivelyUK refinery utilisations are expected to remain below our overall forecast for the European industry, reflecting the relatively high gasoline yield of UK refining
0%
10%
20%
30%
40%
50%
60%
70%
80%
90%
2000 2005 2006 2007 2010 2015 2020
Greater Europe UK
Source: Wood Mackenzie
124
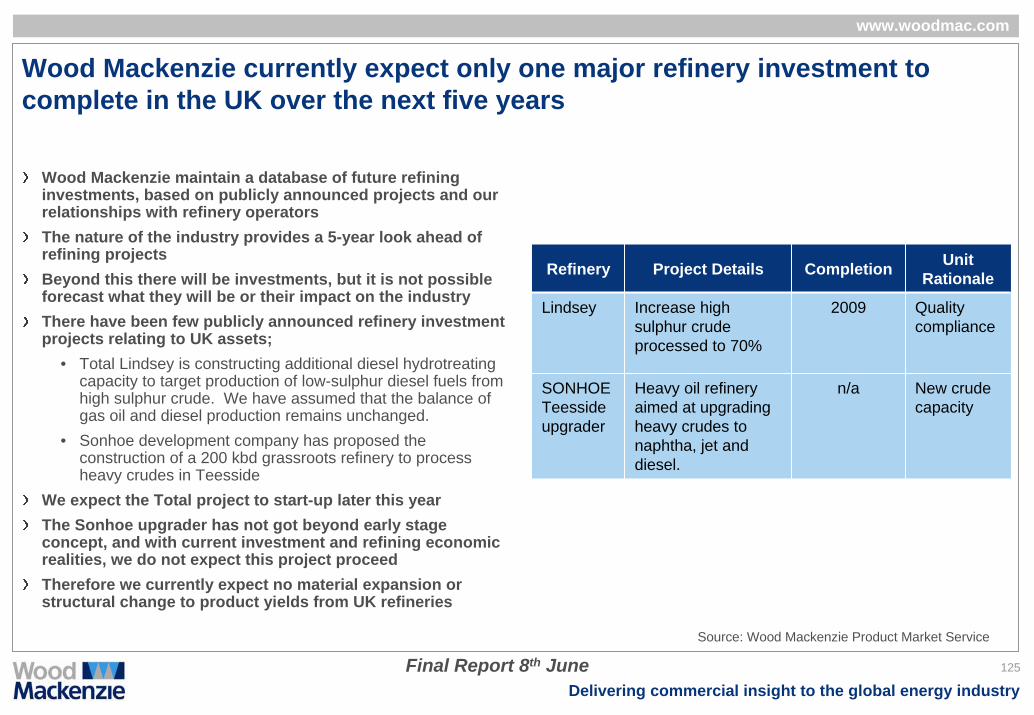
Delivering commercial insight to the global energy industry
www.woodmac.com
Final Report 8th June
Wood Mackenzie currently expect only one major refinery investment to complete in the UK over the next five years
Wood Mackenzie maintain a database of future refining investments, based on publicly announced projects and our relationships with refinery operatorsThe nature of the industry provides a 5-year look ahead of refining projectsBeyond this there will be investments, but it is not possible forecast what they will be or their impact on the industry There have been few publicly announced refinery investment projects relating to UK assets;
• Total Lindsey is constructing additional diesel hydrotreating capacity to target production of low-sulphur diesel fuels from high sulphur crude. We have assumed that the balance of gas oil and diesel production remains unchanged.
• Sonhoe development company has proposed the construction of a 200 kbd grassroots refinery to process heavy crudes in Teesside
We expect the Total project to start-up later this yearThe Sonhoe upgrader has not got beyond early stage concept, and with current investment and refining economic realities, we do not expect this project proceedTherefore we currently expect no material expansion or structural change to product yields from UK refineries
Refinery Project Details Completion Unit Rationale
Lindsey Increase high sulphur crude processed to 70%
2009 Quality compliance
SONHOE Teesside upgrader
Heavy oil refinery aimed at upgrading heavy crudes to naphtha, jet and diesel.
n/a New crude capacity
Source: Wood Mackenzie Product Market Service
125

Delivering commercial insight to the global energy industry
www.woodmac.com
Final Report 8th June
UK refinery production is expected to weaken to 2015
8
10
12
14
16
18
20
22
24
Gasoline Jet/Kero Diesel GasoilRe
finer
y su
pply
, Mt
2007 2008 2010 2015 2020 2030
Base Case UK Refinery SupplyBase Case UK Refinery SupplyThe chart opposite gives our base-case view on UK refinery supply of finished productsThis forecast does not include any non-refinery supply, for example, biodiesel or bioethanol. No refinery closures are assumed and we have assumed there is no impact from IMO proposals, which we expect to be heavily revisedThere is no impact due to capacity creep for UK refineries, since these are mature assets which have already realised their maximum potential without further significant investmentWe are forecasting steep reductions in supply of all products in-line with sustained weak refining margins out to 2015Refinery production recovers by 2020 as spare global refining capacity is erodedOut to 2030, the forecast assumes a return to historical levels of utilisation
Source: Wood Mackenzie
126

Delivering commercial insight to the global energy industry
www.woodmac.com
Final Report 8th June
Base Case Biofuels Outlook
0.0
0.5
1.0
1.5
2.0
2.5
3.0
3.5
4.0
4.5
Ethanol Biodiesel
Biof
uels
dem
and,
Mt
2007 2008 2010 2015 2020 2030
Base Case Biofuels DemandBase Case Biofuels DemandNon-refinery supply of energy products is expected to increase significantly over the period to 2030We have factored in the impact of renewable heat upon stationary oil consumption In terms of transport fuels, we assume a level of biofuels consistent with the RTFO programme until 2013Beyond 2013, we assume that E10 and B10 blends become standard within the UK by 2020In the Base Case, we assume a further increase in biofuels uptake to 14.5% (by volume) in the period to 2030 ie reflecting increasing supply from 2nd
generation biofuels
Source: Wood Mackenzie
127

Delivering commercial insight to the global energy industry
www.woodmac.com
Final Report 8th June
Base Case UK Supply/Demand Forecast
-20
-15
-10
-5
0
5
10
15
Gasoline Jet/Kero Diesel Gasoil
Supp
ly/d
eman
d, M
t
2007 2008 2010 2015 2020 2030
Base Case Supply / Demand Balances*Base Case Supply / Demand Balances*The UK outlook is for continued and growing exports of gasoline, set against a large deficit of middle distillate productsThe UK has become a net importer of diesel since the end of the last decadeWe expect the UK to remain a net exporter of gasoline, with the surplus growing as a result of falling demand and addition of imported bio-ethanol to the gasoline poolIt is likely the UK will remain deficit in jet/kero and diesel, and these deficits will grow to around 10Mt for each product during the 2015-2020 period
• The import requirement for jet/kero is equivalent to circa 54% of consumption, increasing slightly to 55% in 2030
• The import requirement for diesel is equivalent to circa 34% of consumption in 2020, falling to 22% in 2030
The growing gas oil surplus indicates that additional hydro-treating investments may be warranted in UK refineriesHowever, it appears most likely that an increasing proportion of UK jet/kero and diesel supply will have to be imported from outside of NW Europe – the FSU, USA, Middle East, India and Latin America all being possible suppliers
* Diesel includes both road and off-road diesel from 2010 (off-road switches to 10ppm quality from 1/1/2010) Source: Wood Mackenzie
128
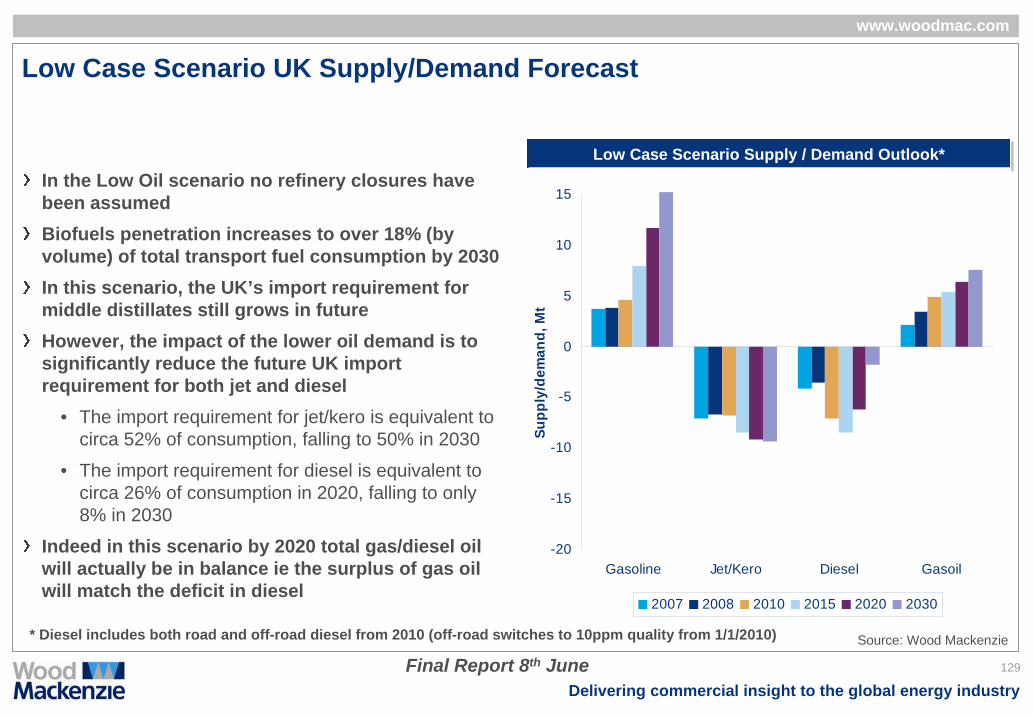
Delivering commercial insight to the global energy industry
www.woodmac.com
Final Report 8th June
Low Case Scenario UK Supply/Demand Forecast
In the Low Oil scenario no refinery closures have been assumedBiofuels penetration increases to over 18% (by volume) of total transport fuel consumption by 2030In this scenario, the UK’s import requirement for middle distillates still grows in futureHowever, the impact of the lower oil demand is to significantly reduce the future UK import requirement for both jet and diesel
• The import requirement for jet/kero is equivalent to circa 52% of consumption, falling to 50% in 2030
• The import requirement for diesel is equivalent to circa 26% of consumption in 2020, falling to only 8% in 2030
Indeed in this scenario by 2020 total gas/diesel oil will actually be in balance ie the surplus of gas oil will match the deficit in diesel
Low Case Scenario Supply / Demand Outlook*Low Case Scenario Supply / Demand Outlook*
-20
-15
-10
-5
0
5
10
15
Gasoline Jet/Kero Diesel Gasoil
Supp
ly/d
eman
d, M
t
2007 2008 2010 2015 2020 2030
* Diesel includes both road and off-road diesel from 2010 (off-road switches to 10ppm quality from 1/1/2010) Source: Wood Mackenzie
129
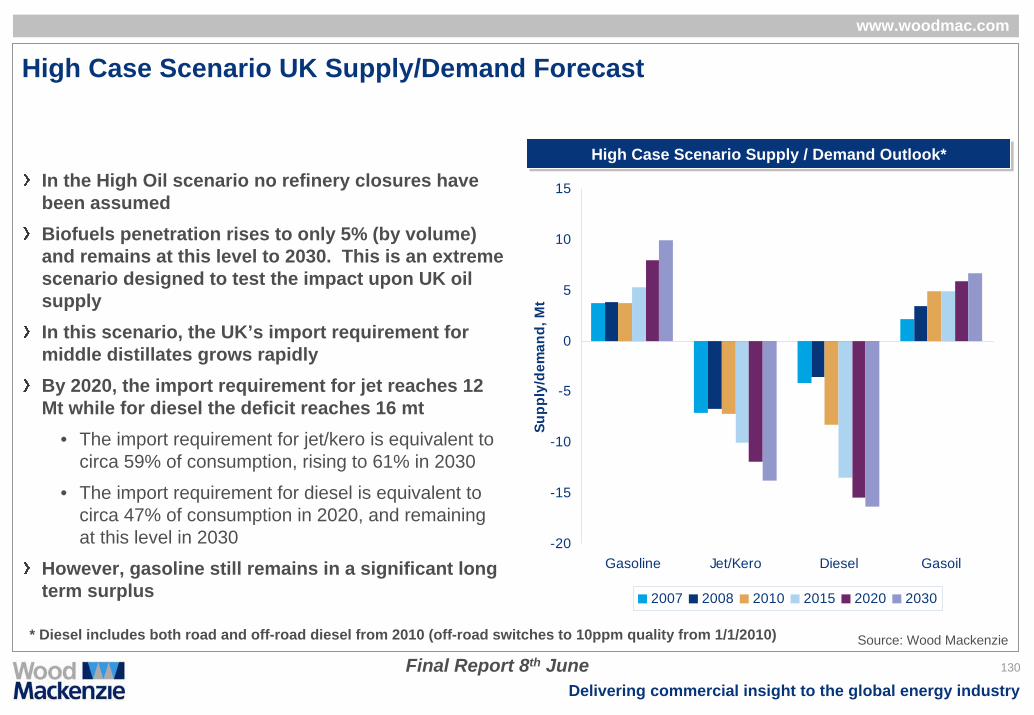
Delivering commercial insight to the global energy industry
www.woodmac.com
Final Report 8th June
High Case Scenario UK Supply/Demand Forecast
-20
-15
-10
-5
0
5
10
15
Gasoline Jet/Kero Diesel Gasoil
Supp
ly/d
eman
d, M
t
2007 2008 2010 2015 2020 2030
High Case Scenario Supply / Demand Outlook*High Case Scenario Supply / Demand Outlook*In the High Oil scenario no refinery closures have been assumedBiofuels penetration rises to only 5% (by volume) and remains at this level to 2030. This is an extreme scenario designed to test the impact upon UK oil supplyIn this scenario, the UK’s import requirement for middle distillates grows rapidly By 2020, the import requirement for jet reaches 12 Mt while for diesel the deficit reaches 16 mt
• The import requirement for jet/kero is equivalent to circa 59% of consumption, rising to 61% in 2030
• The import requirement for diesel is equivalent to circa 47% of consumption in 2020, and remaining at this level in 2030
However, gasoline still remains in a significant long term surplus
* Diesel includes both road and off-road diesel from 2010 (off-road switches to 10ppm quality from 1/1/2010) Source: Wood Mackenzie
130

Delivering commercial insight to the global energy industry
www.woodmac.com
Final Report 8th June
Supply / Demand Balances – Scenario Comparison By Product
131
-20
-18
-16
-14
-12
-10
-8
-6
-4
-2
0
2007 2008 2010 2015 2020 2030
Sup
ply/
dem
and,
Mt
Base High Low
deficit0
2
4
6
8
10
12
14
16
18
2007 2008 2010 2015 2020 2030
Sup
ply/
dem
and,
Mt
Base High Low
surplus
GasolineGasoline DieselDiesel
Source: Wood Mackenzie

Delivering commercial insight to the global energy industry
www.woodmac.com
Final Report 8th June
Supply / Demand Balances – Scenario Comparison By Product
132
-20
-15
-10
-5
0
5
10
2007 2008 2010 2015 2020 2030
Supp
ly/d
eman
d, M
t
Base High Low
-20
-18
-16
-14
-12
-10
-8
-6
-4
-2
0
2007 2008 2010 2015 2020 2030
Sup
ply/
dem
and,
Mt
Base High Low
deficit
Jet/keroJet/kero Gas oilGas oil
surplus
Source: Wood Mackenzie
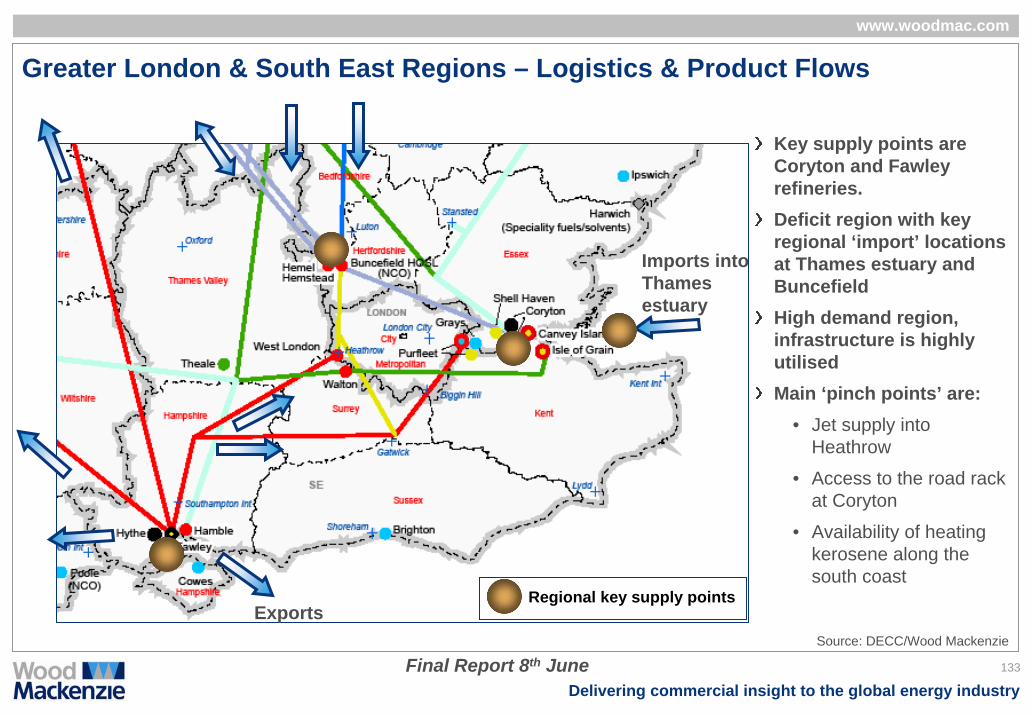
Delivering commercial insight to the global energy industry
www.woodmac.com
Final Report 8th June
Greater London & South East Regions – Logistics & Product Flows
Imports into Thames estuary
Regional key supply points
Key supply points are Coryton and Fawley refineries. Deficit region with key regional ‘import’ locations at Thames estuary and BuncefieldHigh demand region, infrastructure is highly utilisedMain ‘pinch points’ are:
• Jet supply into Heathrow
• Access to the road rack at Coryton
• Availability of heating kerosene along the south coast
ExportsSource: DECC/Wood Mackenzie
133

Delivering commercial insight to the global energy industry
www.woodmac.com
Final Report 8th June
Greater London & South East Regions – Supply/Demand Base Case
2008 Regional Supply* / Demand2008 Regional Supply* / Demand Forecast Regional Supply / DemandForecast Regional Supply / Demand
deficit deficit
* Supply from UK refineries, not necessarily in the same region; 2008 balances represent current regional import or export requirements; future changes in product balances indicate evolving pressures upon regional supply eg growing surpluses show how much product will not be required in the region in future, while growing deficits show how much more product will be required Source: Wood Mackenzie
-8000
-6000
-4000
-2000
0
2000
4000
6000
8000
10000
Gasoline Gas/Diesel oil Jet/Kero
kt
Demand UK Supply Imports
-10000
-8000
-6000
-4000
-2000
0
2000
2008 2010 2015 2020 2030
Gasoline Gas/Diesel oil Jet/Kerokt
134
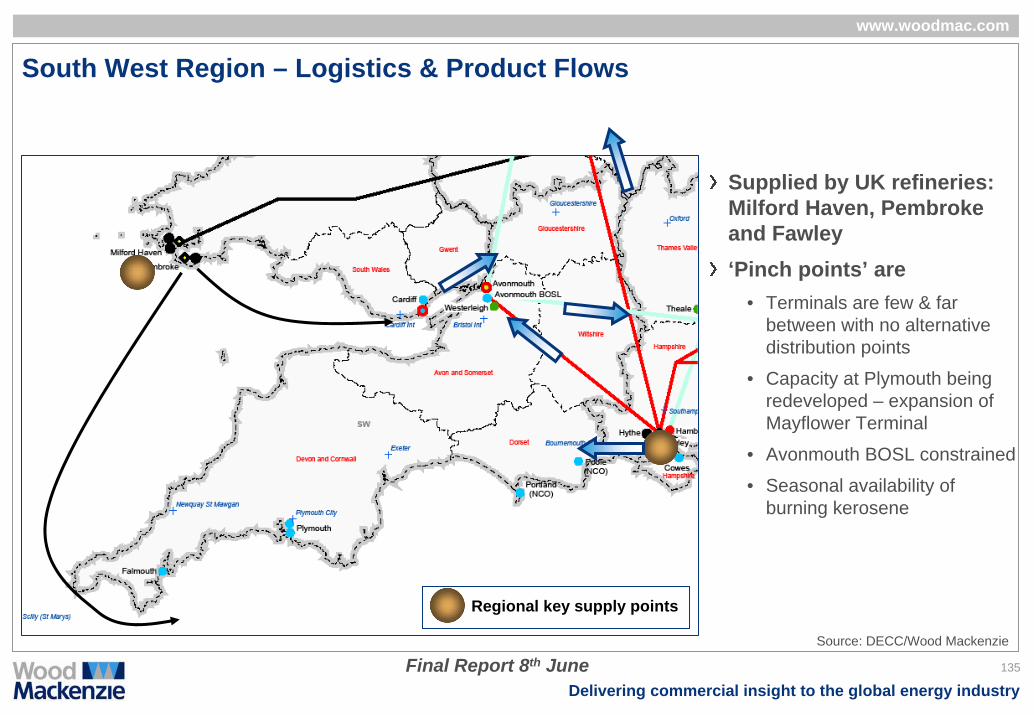
Delivering commercial insight to the global energy industry
www.woodmac.com
Final Report 8th June
South West Region – Logistics & Product Flows
Supplied by UK refineries: Milford Haven, Pembroke and Fawley ‘Pinch points’ are
• Terminals are few & far between with no alternative distribution points
• Capacity at Plymouth being redeveloped – expansion of Mayflower Terminal
• Avonmouth BOSL constrained
• Seasonal availability of burning kerosene
Regional key supply points
Source: DECC/Wood Mackenzie
135

Delivering commercial insight to the global energy industry
www.woodmac.com
Final Report 8th June
South West Region – Supply/Demand Base Case
Forecast Regional Supply / DemandForecast Regional Supply / Demand2008 Regional Supply* / Demand2008 Regional Supply* / Demand
deficit
Source: Wood Mackenzie
-1000
-500
0
500
1000
1500
2000
2500
3000
Gasoline Gas/Diesel oil Jet/Kero
kt
Demand Supply Balance
-800
-600
-400
-200
0
200
400
600
800
2008 2010 2015 2020 2030
Gasoline Gas/Diesel oil Jet/Kero
kt
* Supply from UK refineries, not necessarily in the same region; 2008 balances represent current regional import or export requirements; future changes in product balances indicate evolving pressures upon regional supply eg growing surpluses show how much product will not be required in the region in future, while growing deficits show how much more product will be required
deficit
Gasoline surpluses indicate volumes that will no longer be required in the South West
136

Delivering commercial insight to the global energy industry
www.woodmac.com
Final Report 8th June
East of England Region – Logistics & Product Flows
The East of England is supplied from Coryton, supplemented by smaller volumes from Lindsey and Humber refineries as well as imports sourced from Ipswich or the Thames estuaryCoryton is key location to supply the region although Thames estuary terminals provide alternative supply options‘Pinch points’:
• Buncefield closure put a lot pressure on the rack at Coryton. Re-establishing ground fuels at BP Hemel Hempstead will strengthen supply into the region.
• Thames estuary infrastructure already highly utilised and higher throughputs could be only be achieved at higher cost (eg increased demurrage costs)
• Closure of Vopak Ipswich terminal a possibility
Regional key supply points
Source: DECC/Wood Mackenzie
137
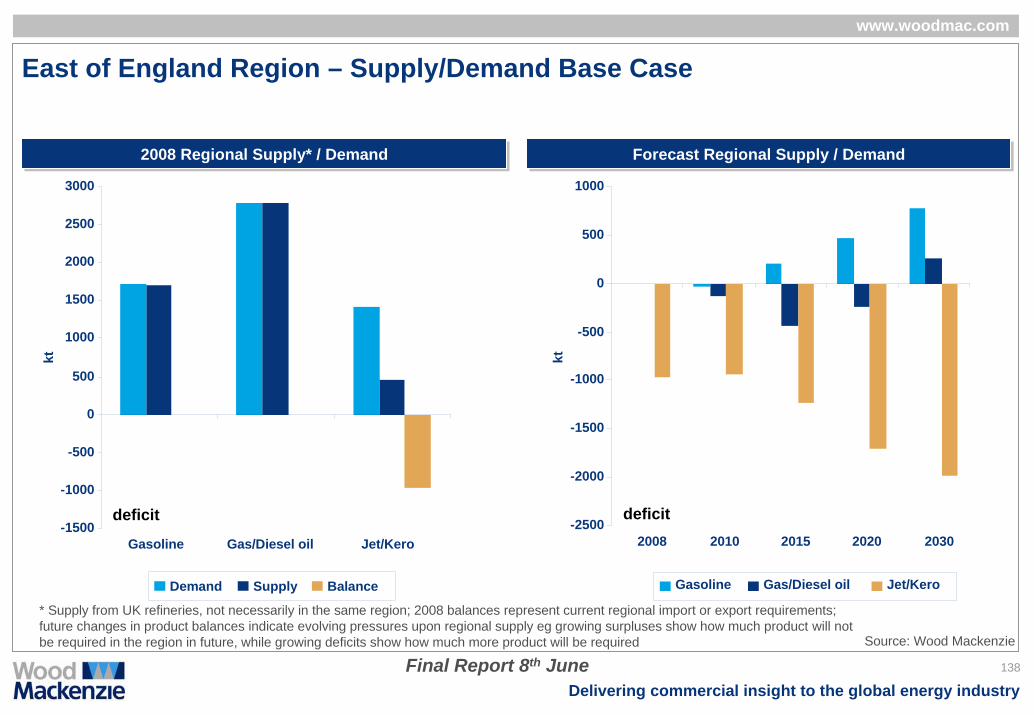
Delivering commercial insight to the global energy industry
www.woodmac.com
Final Report 8th June
East of England Region – Supply/Demand Base Case
2008 Regional Supply* / Demand2008 Regional Supply* / Demand Forecast Regional Supply / DemandForecast Regional Supply / Demand
deficit deficit
Source: Wood Mackenzie
-1500
-1000
-500
0
500
1000
1500
2000
2500
3000
Gasoline Gas/Diesel oil Jet/Kero
kt
Demand Supply Balance
-2500
-2000
-1500
-1000
-500
0
500
1000
2008 2010 2015 2020 2030
Gasoline Gas/Diesel oil Jet/Kero
kt
* Supply from UK refineries, not necessarily in the same region; 2008 balances represent current regional import or export requirements; future changes in product balances indicate evolving pressures upon regional supply eg growing surpluses show how much product will not be required in the region in future, while growing deficits show how much more product will be required
138

Delivering commercial insight to the global energy industry
www.woodmac.com
Final Report 8th June
East Midlands Region – Logistics & Product Flows
The East Midlands is supplied by product from UK refineries - mainly Lindsey and Humber – supplemented by some imports sourced from independent storage on the East Coast. The Mainline pipeline to Nottingham is no longer in use (Chevron closed its terminal there) while Total’s Nottingham terminal is rail fed‘Pinch points’:
• None – region well positioned in terms of supply and possible alternatives
• Possible exception is jet fuel supply to East Midlands Airport
Regional key supply pointsSource: DECC/Wood Mackenzie
139

Delivering commercial insight to the global energy industry
www.woodmac.com
Final Report 8th June
East Midland Region – Supply/Demand Base Case
Forecast Regional Supply / DemandForecast Regional Supply / Demand2008 Regional Supply* / Demand2008 Regional Supply* / Demand
deficit
Source: Wood Mackenzie
-500
0
500
1000
1500
2000
2500
Gasoline Gas/Diesel oil Jet/Kero
kt
Demand Supply Balance
-600
-400
-200
0
200
400
600
800
2008 2010 2015 2020 2030
Gasoline Gas/Diesel oil Jet/Kero
kt
* Supply from UK refineries, not necessarily in the same region; 2008 balances represent current regional import or export requirements; future changes in product balances indicate evolving pressures upon regional supply eg growing surpluses show how much product will not be required in the region in future, while growing deficits show how much more product will be required
Gasoline surpluses indicate volumes that will no longer be required in the East Midlands
140

Delivering commercial insight to the global energy industry
www.woodmac.com
Final Report 8th June
West Midlands Region – Logistics & Product Flows
The West Midlands is supplied by product from UK refineries - mainly Stanlow, Pembroke and Fawley by pipeline and Milford Haven by railThe three pipeline-fed terminals at Kingsbury are the key supply point for the regionMainline is believed to be underutilised and has spare capacityMain ‘pinch points’:
• High degree of dependence upon lifting from Kingsbury terminals
• Jet fuel supply to Birmingham Airport
Regional key supply pointsSource: DECC/Wood Mackenzie
141

Delivering commercial insight to the global energy industry
www.woodmac.com
Final Report 8th June
West Midlands Region – Supply/Demand Base Case
Forecast Regional Supply / DemandForecast Regional Supply / Demand2008 Regional Supply* / Demand2008 Regional Supply* / Demand
deficit
kt
Source: Wood Mackenzie
-500
0
500
1000
1500
2000
2500
Gasoline Gas/Diesel oil Jet/Kero
kt
Demand Supply Balance
-400
-200
0
200
400
600
800
1000
2008 2010 2015 2020 2030
Gasoline Gas/Diesel oil Jet/Kero* Supply from UK refineries, not necessarily in the same region; 2008 balances represent current regional import or export requirements; future changes in product balances indicate evolving pressures upon regional supply eg growing surpluses show how much product will not be required in the region in future, while growing deficits show how much more product will be required
Gasoline surpluses indicate volumes that will no longer be required in the West Midlands
142

Delivering commercial insight to the global energy industry
www.woodmac.com
Final Report 8th June
Wales – Logistics & Product Flows
Supplied by UK refineries: Milford Haven and Pembroke in south Wales as well as Stanlow in the northSEM Logistics is a large independent terminal at Milford Haven but is believed not to supply the inland market Both Welsh refineries supply into the Irish market, with Pembroke refinery in particular believed to export a significant proportion of its gasoline productionMain ‘pinch points’:
• Limited alternatives to Cardiff – the key supply point for the high demand area in the south
• Delivery distances into mid & north Wales are relatively high but not a major logistical issue
Exports
Regional key supply points
Source: DECC/Wood Mackenzie
143

Delivering commercial insight to the global energy industry
www.woodmac.com
Final Report 8th June
Wales – Supply/Demand Base Case
Forecast Regional Supply / DemandForecast Regional Supply / Demand2008 Regional Supply* / Demand2008 Regional Supply* / Demand
deficit
kt
Source: Wood Mackenzie
-200
0
200
400
600
800
1000
1200
1400
1600
Gasoline Gas/Diesel oil Jet/Kero
kt
Demand UK Supply Imports
-300
-200
-100
0
100
200
300
400
500
2008 2010 2015 2020 2030
Gasoline Gas/Diesel oil Jet/Kero
* Supply from UK refineries, not necessarily in the same region; 2008 balances represent current regional import or export requirements; future changes in product balances indicate evolving pressures upon regional supply eg growing surpluses show how much product will not be required in the region in future, while growing deficits show how much more product will be required
Surpluses indicate product that will no longer be required in Wales (and will have to moved elsewhere or exported)
144

Delivering commercial insight to the global energy industry
www.woodmac.com
Final Report 8th June
Yorkshire & Humber Region – Logistics & Product Flows
The Yorkshire & Humber region is supplied mainly by product from Lindsey and Humber refineries –supplemented by some imports sourced from independent storage on the East Coast. There are no major inland oil terminals in the region, with some product being lifted from Manchester and Bramhall‘Pinch points’:
• None – the region is highly dependent upon the two refineries
Exports
Imports
Regional key supply pointsSource: DECC/Wood Mackenzie
145

Delivering commercial insight to the global energy industry
www.woodmac.com
Final Report 8th June
Yorkshire & Humber Region – Supply/Demand Base Case
Forecast Regional Supply / DemandForecast Regional Supply / Demand2008 Regional Supply* / Demand2008 Regional Supply* / Demand
deficit
kt
Source: Wood Mackenzie
-500
0
500
1000
1500
2000
2500
3000
Gasoline Gas/Diesel oil Jet/Kero
kt
Demand Supply Balance
-600
-400
-200
0
200
400
600
800
2008 2010 2015 2020 2030
Gasoline Gas/Diesel oil Jet/Kero
* Supply from UK refineries, not necessarily in the same region; 2008 balances represent current regional import or export requirements; future changes in product balances indicate evolving pressures upon regional supply eg growing surpluses show how much product will not be required in the region in future, while growing deficits show how much more product will be required
Surpluses indicate product that will no longer be required in York/Humber (and will have to moved elsewhere or exported)
146
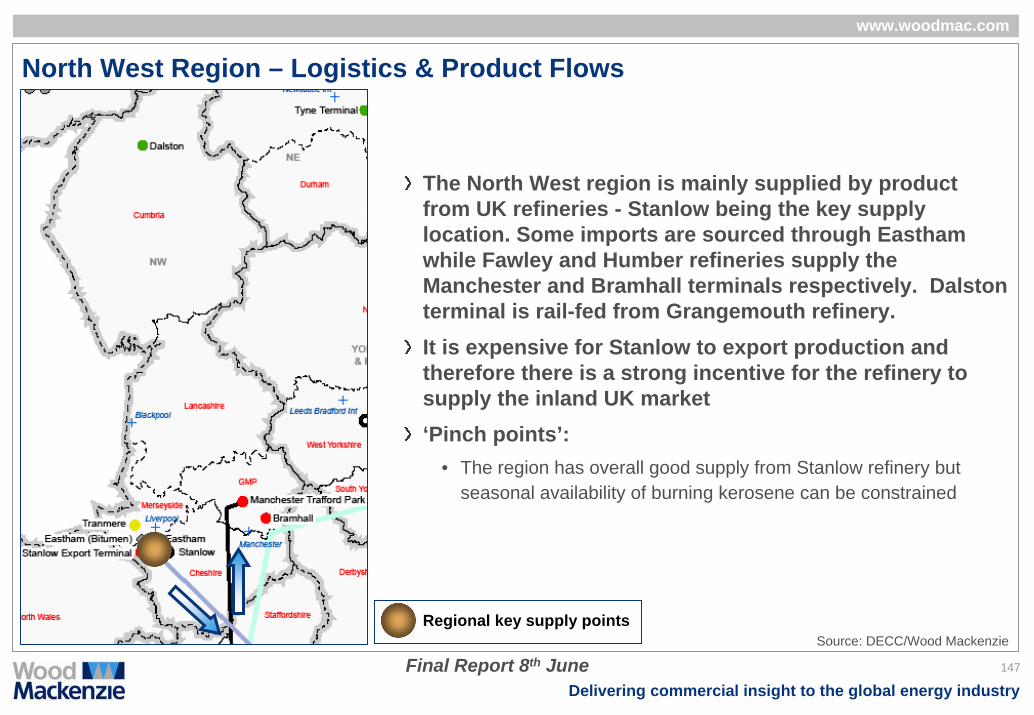
Delivering commercial insight to the global energy industry
www.woodmac.com
Final Report 8th June
North West Region – Logistics & Product Flows
The North West region is mainly supplied by product from UK refineries - Stanlow being the key supply location. Some imports are sourced through Eastham while Fawley and Humber refineries supply the Manchester and Bramhall terminals respectively. Dalston terminal is rail-fed from Grangemouth refinery.It is expensive for Stanlow to export production and therefore there is a strong incentive for the refinery to supply the inland UK market‘Pinch points’:
• The region has overall good supply from Stanlow refinery but seasonal availability of burning kerosene can be constrained
Regional key supply pointsSource: DECC/Wood Mackenzie
147

Delivering commercial insight to the global energy industry
www.woodmac.com
Final Report 8th June
North West Region – Supply/Demand Base Case
Forecast Regional Supply / DemandForecast Regional Supply / Demand2008 Regional Supply* / Demand2008 Regional Supply* / Demand
deficit
kt
Source: Wood Mackenzie
-500
0
500
1000
1500
2000
2500
3000
3500
Gasoline Gas/Diesel oil Jet/Kero
kt
Demand Supply Balance
-600
-400
-200
0
200
400
600
800
1000
1200
2008 2010 2015 2020 2030
Gasoline Gas/Diesel oil Jet/Kero
* Supply from UK refineries, not necessarily in the same region; 2008 balances represent current regional import or export requirements; future changes in product balances indicate evolving pressures upon regional supply eg growing surpluses show how much product will not be required in the region in future, while growing deficits show how much more product will be required
Gasoline surpluses indicate volumes that will no longer be required in the North West (and will have to moved elsewhere or exported)
148

Delivering commercial insight to the global energy industry
www.woodmac.com
Final Report 8th June
North East Region – Logistics & Product Flows
With the closure of Teesside refinery (assumed to be permanent in our Base Case) the region has become wholly dependent upon supplies from other UK refineries plus imports The refinery did not product gasoline so supply of this product is unaffected.We believe some volumes will move into the region from Humber and Lindsey refineries, as well as from Grangemouth refinery in Scotland.‘Pinch points’:
• Following the anticipated closure of Tees refinery, expansion of import capacity in the region, possibly through conversion of the refinery into a products terminal, although Greenergy has already announced a major investment at the Vopak Seal Sands terminal
Regional key supply points
Source: DECC/Wood Mackenzie
149
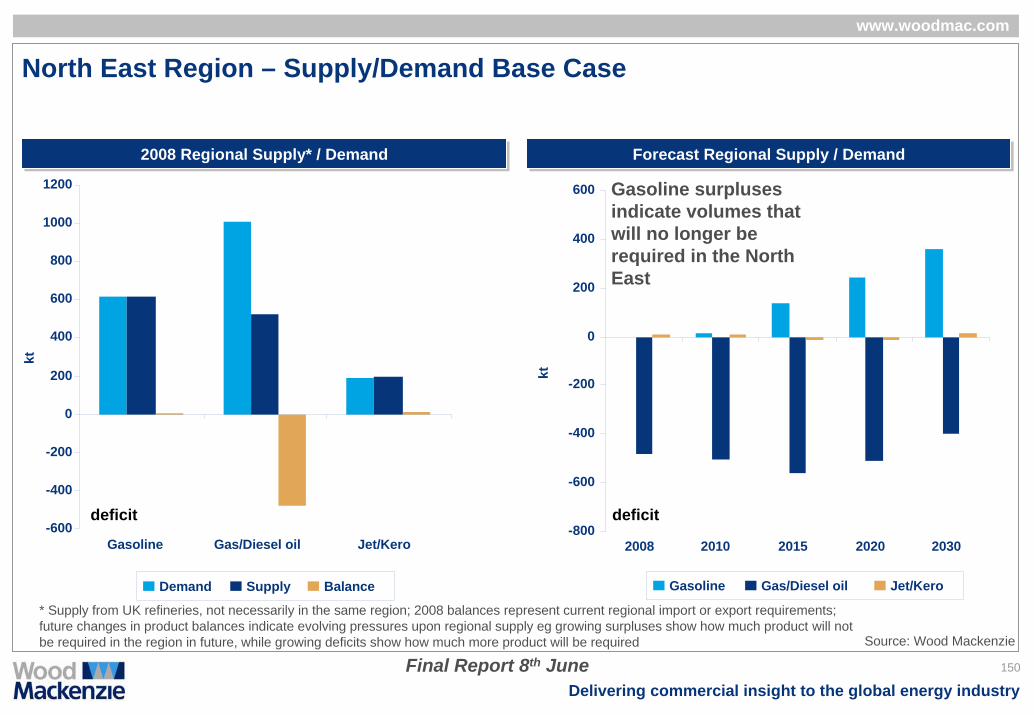
Delivering commercial insight to the global energy industry
www.woodmac.com
Final Report 8th June
North East Region – Supply/Demand Base Case
Forecast Regional Supply / DemandForecast Regional Supply / Demand2008 Regional Supply* / Demand2008 Regional Supply* / Demand
deficitdeficitkt
Source: Wood Mackenzie
-600
-400
-200
0
200
400
600
800
1000
1200
Gasoline Gas/Diesel oil Jet/Kero
kt
Demand Supply Balance
-800
-600
-400
-200
0
200
400
600
2008 2010 2015 2020 2030
Gasoline Gas/Diesel oil Jet/Kero
* Supply from UK refineries, not necessarily in the same region; 2008 balances represent current regional import or export requirements; future changes in product balances indicate evolving pressures upon regional supply eg growing surpluses show how much product will not be required in the region in future, while growing deficits show how much more product will be required
Gasoline surpluses indicate volumes that will no longer be required in the North East
150

Delivering commercial insight to the global energy industry
www.woodmac.com
Final Report 8th June
Scotland – Logistics & Product Flows
Grangemouth refinery is the only refinery in Scotland and the key source of supply, although some product will move up from the east coast refineries and also from Stanlow in the west up to Isla and ArranThe only product pipeline is to Finnart on the west coast, from which product is exported by ship. Distribution from Grangemouth is by road tanker or via coaster to regional terminals. Inverness terminal is the key supply point for northern Scotland‘Pinch points’
• Dependence upon Grangemouth – currently limited import capacity for products
• Away from the central belt, terminals are few and far between
• Terminal facilities generally lack scale – increasing costs and lowering attractiveness of capital investment
• Introduction of ethanol in gasoline a particular issue in the highlands & islands (ie requirement for local gasoline blending facilities)
Regional key supply pointsSource: DECC/Wood Mackenzie
151

Delivering commercial insight to the global energy industry
www.woodmac.com
Final Report 8th June
Scotland – Supply/Demand Base Case
Forecast Regional Supply / DemandForecast Regional Supply / Demand2008 Regional Supply* / Demand2008 Regional Supply* / Demand
deficit deficit
kt
Source: Wood Mackenzie
-1000
-500
0
500
1000
1500
2000
2500
3000
3500
Gasoline Gas/Diesel oil Jet/Kero
kt
Demand Supply Balance
-800
-600
-400
-200
0
200
400
600
800
1000
2008 2010 2015 2020 2030
Gasoline Gas/Diesel oil Jet/Kero
* Supply from UK refineries, not necessarily in the same region; 2008 balances represent current regional import or export requirements; future changes in product balances indicate evolving pressures upon regional supply eg growing surpluses show how much product will not be required in the region in future, while growing deficits show how much more product will be required
Gasoline surpluses indicate volumes that will no longer be required in Scotland (and will have to be exported)
152

Delivering commercial insight to the global energy industry
www.woodmac.com
Final Report 8th June
Northern Ireland – Logistics & Product Flows
Northern Ireland has no local refinery capacity and relies upon supplies source from Grangemouth refinery (via Finnart terminal) and from refineries to the south. Import locations are near the main centres of demand in Belfast and Londonderry‘Pinch points’:
• Dependent upon imports although import capacity appears adequate
• There is a large burning kerosene market in Northern Ireland (natural gas is now available but has only been available since the 1990s), mainly sourced from UK refineries – seasonal availability could be an issue?
From Whitegate (Ireland), Milford Haven, Pembroke
Regional key supply pointsSource: DECC/Wood Mackenzie
153

Delivering commercial insight to the global energy industry
www.woodmac.com
Final Report 8th June
Northern Ireland – Supply/Demand Base Case
Forecast Regional Supply / DemandForecast Regional Supply / Demand2008 Regional Supply* / Demand2008 Regional Supply* / Demand
deficit
kt
Source: Wood Mackenzie
-200
0
200
400
600
800
1000
1200
1400
Gasoline Gas/Diesel oil Jet/Kero
kt
Demand Supply Balance
-200
-100
0
100
200
300
400
2008 2010 2015 2020 2030
Gasoline Gas/Diesel oil Jet/Kero
* Supply from UK refineries, not necessarily in the same region; 2008 balances represent current regional import or export requirements; future changes in product balances indicate evolving pressures upon regional supply eg growing surpluses show how much product will not be required in the region in future, while growing deficits show how much more product will be required
Surpluses indicate product that will no longer be required in Northern Ireland
154

Delivering commercial insight to the global energy industry
www.woodmac.com
Final Report 8th June
Regional Analysis Base Case Summary
Key regional supply/demand deficits are• Jet fuel supply to the London airports• Greater London, the South East, the North East and Scotland are the regions currently with significant deficits of
gas/diesel oil• Seasonal availability of heating kerosene is a particular issue in the South West, along the south coast, North
West and N IrelandJet fuel imports to supply the London airports appears to be the most significant potential ‘pinch point’ which could require
• Investment in new import infrastructure along the Thames or at Bristol (we have no information regarding the current utilisation of these facilities)
• Investment in new pipeline capacity to both Heathrow and Stansted airports• Investment in new inland storage capacity to provide operational flexibility between product supply and demand
offtake (such as the recent BPA planning application to increase jet fuel storage at Buncefield, which would re-establish jet fuel supply through the West London pipeline to 95% of the pre-Buncefield disaster level)
In addition we believe that the two regions where additional investment may be warranted to guarantee future import flows are Scotland (jetty capacity at Ross Storage and/or Grangemouth) and the South West (e.g. expansion of storage capacity in Bristol). Additional pipeline capacity will also be required for supplying jet fuel to Birmingham and East Midlands airportsThe strategically vital refinery supply locations are Stanlow, Coryton, Fawley and Grangemouth
155

Delivering commercial insight to the global energy industry
www.woodmac.com
Final Report 8th June
Regional Analysis High Case Summary
On a national basis, the UK remains surplus for gasoline in the High Case • there are no material differences to the Base Case in terms of gasoline availability to the inland regional markets
In the High Case, the national import requirement for gas/diesel oil and jet/kero grows faster and throughout the period to 2030
• All regional markets become increasingly deficit
• This will put pressure on the current supply patterns from UK refineries to their inland hinterland markets and reduce the availability of product for regions outside of their core supply envelopes
• The regions where the additional imports are most likely to be required and potential pinch points could emerge are: London & South East, East of England, South West, Scotland
• The jet/kero import requirement into London & the South East rises to an estimated 8.3 Mt in 2020, circa 1 Mt higher (ie 12%) than in the Base Case
156

Delivering commercial insight to the global energy industry
www.woodmac.com
Final Report 8th June
Regional Analysis Low Case Summary
In the Low Case, the UK’s surplus of gasoline grows faster than the Base Case • There are no material differences to the Base Case in terms of gasoline availability to the inland regional
markets. This would likely be the case even if one were to assume the reduction of refinery capacity in the UK. Assuming no reduction in UK refinery capacity, the UK’s deficits of gas/diesel oil and jet/kero grow much slower than in the Base Case, significantly reducing the need for further imports
• Product availability in most regions therefore does not change materially from the Base Case with the exception of East of England (where the jet/kero import requirement will still increase significantly).
• Although not materially different to the Base Case, the South West also remains stressed in terms of the supply of jet/kerosene
In the Low Case, it is more likely that there will be a reduction in the UK refinery capacity. The impact on the UK regional markets will be determined by which refineries are closed. The strategically vital refinery supply locations are Stanlow, Coryton, Fawley and Grangemouth and should any of these refineries be closed it would cause a significant structural disruption to supply. However, a closure of one of the East Coast refineries would have lesser impacts for the inland markets in England, especially if converted into an import terminal. While a closure of one of the Welsh refineries might also have relatively limited structural impact in Scotland and northern/central England, it would likely lead to a further tightening of product availability in the South West, particularly for a seasonal product such as heating kerosene. Investment in new regional import and/or storage infrastructure could be required as a result. Also Northern Ireland would be affected as it would have to source imports from further afield – and would be competing with the Republic of Ireland in doing so (the Republic is a major importer of product from the UK)
157

Delivering commercial insight to the global energy industry
www.woodmac.com
Final Report 8th June
12 Future Import Requirements and Associated Risks
158
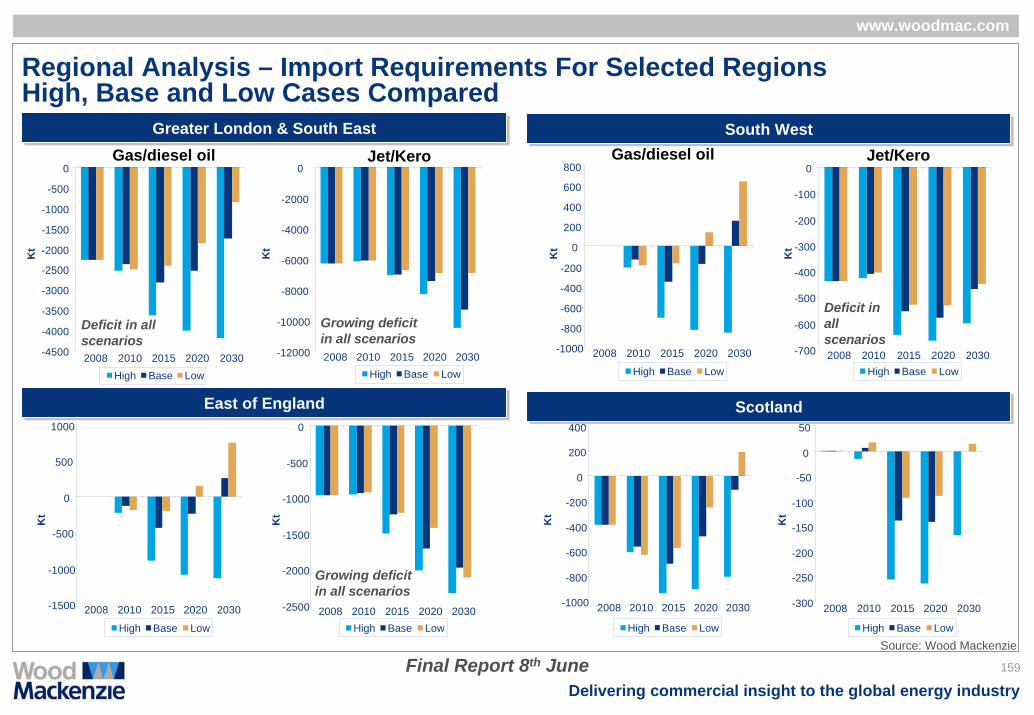
Delivering commercial insight to the global energy industry
www.woodmac.com
Final Report 8th June
Regional Analysis – Import Requirements For Selected RegionsHigh, Base and Low Cases Compared
Greater London & South EastGreater London & South EastGas/diesel oil Jet/Kero
East of EnglandEast of England
South WestSouth WestGas/diesel oil Jet/Kero
ScotlandScotland
Source: Wood Mackenzie
-4500
-4000
-3500
-3000
-2500
-2000
-1500
-1000
-500
0
2008 2010 2015 2020 2030High Base Low
-12000
-10000
-8000
-6000
-4000
-2000
0
2008 2010 2015 2020 2030High Base Low
-1000
-800
-600
-400
-200
0
200
400
600
800
2008 2010 2015 2020 2030 -700
-600
-500
-400
-300
-200
-100
0
2008 2010 2015 2020 2030High Base Low High Base Low
-1500
-1000
-500
0
500
1000
2008 2010 2015 2020 2030 -2500
-2000
-1500
-1000
-500
0
2008 2010 2015 2020 2030High Base Low High Base Low
-1000
-800
-600
-400
-200
0
200
400
2008 2010 2015 2020 2030 -300
-250
-200
-150
-100
-50
0
50
2008 2010 2015 2020 2030
High Base Low High Base Low
Kt
Kt
Kt
Kt
Kt
Kt
Kt
Kt
Growing deficit in all scenarios
Growing deficit in all scenarios
Deficit in all scenarios
Deficit in all scenarios
159
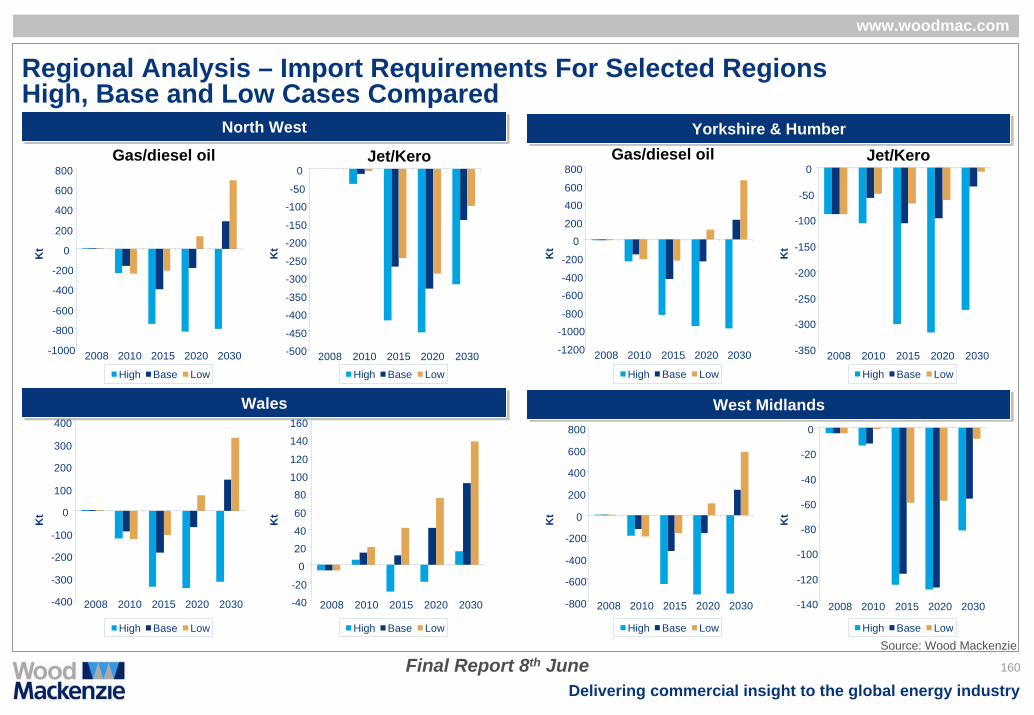
Delivering commercial insight to the global energy industry
www.woodmac.com
Final Report 8th June
Regional Analysis – Import Requirements For Selected RegionsHigh, Base and Low Cases Compared
North WestNorth West
WalesWales
Yorkshire & HumberYorkshire & Humber
West MidlandsWest Midlands
Source: Wood Mackenzie
Gas/diesel oil Jet/Kero Gas/diesel oil Jet/Kero
-1000
-800
-600
-400
-200
0
200
400
600
800
2008 2010 2015 2020 2030 -500
-450
-400
-350
-300
-250
-200
-150
-100
-50
0
2008 2010 2015 2020 2030 -1200
-1000-800
-600-400
-200
0200
400600
800
2008 2010 2015 2020 2030 -350
-300
-250
-200
-150
-100
-50
0
2008 2010 2015 2020 2030
-400
-300
-200
-100
0
100
200
300
400
2008 2010 2015 2020 2030 -40-20
0
2040
60
80100
120
140160
2008 2010 2015 2020 2030 -800
-600
-400
-200
0
200
400
600
800
2008 2010 2015 2020 2030 -140
-120
-100
-80
-60
-40
-20
0
2008 2010 2015 2020 2030
High Base Low High Base Low High Base Low High Base Low
High Base Low High Base Low High Base Low High Base Low
Kt
Kt
Kt
Kt
Kt
Kt
Kt
Kt
160
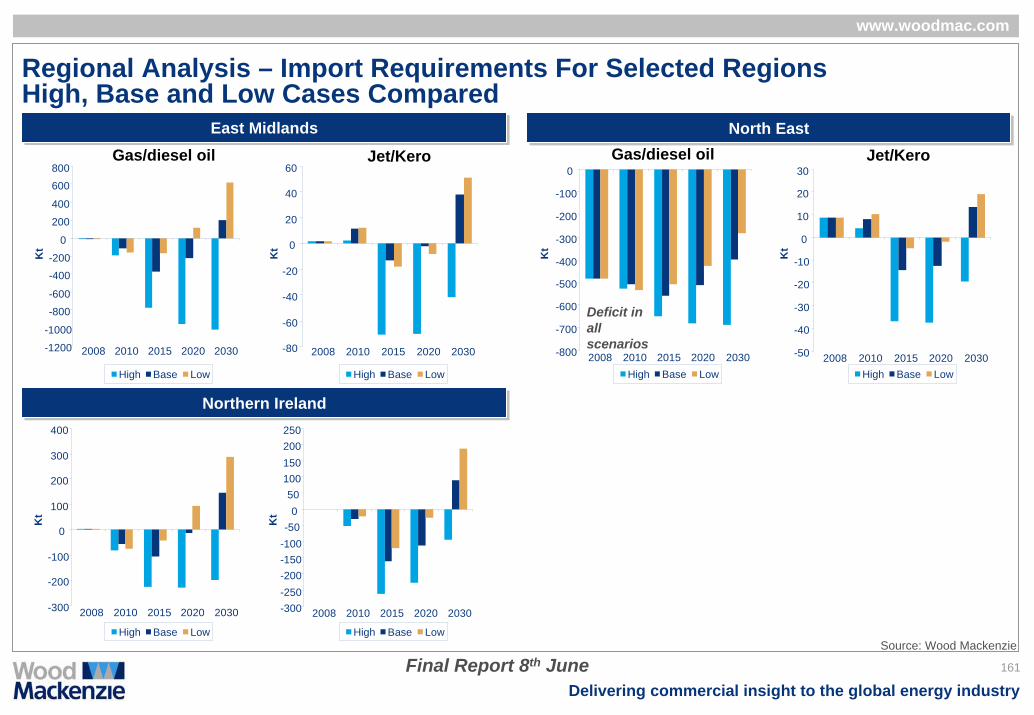
Delivering commercial insight to the global energy industry
www.woodmac.com
Final Report 8th June
Regional Analysis – Import Requirements For Selected RegionsHigh, Base and Low Cases Compared
East MidlandsEast Midlands
Northern IrelandNorthern Ireland
North EastNorth EastGas/diesel oil Jet/Kero Gas/diesel oil Jet/Kero
Source: Wood Mackenzie
-1200
-1000
-800-600
-400-200
0
200
400
600800
2008 2010 2015 2020 2030 -80
-60
-40
-20
0
20
40
60
2008 2010 2015 2020 2030 -800
-700
-600
-500
-400
-300
-200
-100
0
2008 2010 2015 2020 2030 -50
-40
-30
-20
-10
0
10
20
30
2008 2010 2015 2020 2030
-300
-200
-100
0
100
200
300
400
2008 2010 2015 2020 2030 -300-250-200-150-100-50
050
100150200250
2008 2010 2015 2020 2030
High Base Low High Base Low High Base Low High Base Low
High Base Low High Base Low
Kt
Kt
Kt
Kt
Kt
Kt
Deficit in all scenarios
161
Delivering commercial insight to the global energy industry
www.woodmac.com
Final Report 8th June
Risks Associated with Future Import Requirements
In overall terms in the Base Case, growth in road diesel demand is balanced by declining gasoline and heating oil consumption. Therefore, we believe that in terms of inland infrastructure, the supply and distribution of ground fuels does not represent a future stress point given the current logistics infrastructureHowever, in future the UK will experience a growing surplus of gasoline and a growing deficit of diesel. This will lead to increased import/export product flows and utilisation of logistics infrastructure along the coast. The UK has ample coastal terminal capacity along the east coast, although on the west coast there are a smaller number of locations. Facilities are on the west coast are, however, not currently highly utilised and could play a more active role in supplying the UK market While we do not expect that a material increase in import/export storage capacity will be required to handle the increased future product flows, there could be constraints at different locations primarily related to jetty capacity at some refineries (due to increased gasoline exports coupled with increased middle distillate imports), road/rail loading facilities or pipeline capacityIn our view therefore while some infrastructure investment will be required, this is likely to be incremental at existing sites eg construction of new tanks at existing sites to provide more operational flexibility
162

Delivering commercial insight to the global energy industry
www.woodmac.com
Final Report 8th June
13 Summary Conclusions – Part 2
163

Delivering commercial insight to the global energy industry
www.woodmac.com
Final Report 8th June
1. Oil Product Demand Outlook
The economic downturn will lead to weaker oil demand• The decline in gasoline demand will accelerate
• The upward trends in diesel and jet fuel demand will be interrupted
Once the economy returns to growth, the previous trends will tend to reassert themselves although there are a number of specific factors that create significant uncertainty with regard to forecasting future oil consumption in the UK which include
• Future dieselisation of the car fleet
• Uptake of bio-fuels beyond the existing RTFO commitments
• Impact of government policies to encourage uptake of renewable heat and energy efficiency
In our Base Case, we expect that jet/kero will be the UK’s main growth product over the period to 2030, with demand growth for gas/diesel oil gradually moderating as a result of vehicle efficiency improvements and a slackening of the dieselisation trend in the car fleet
164

Delivering commercial insight to the global energy industry
www.woodmac.com
Final Report 8th June
2. Supply / Demand Balances
Following the cessation of processing at the Teesside refinery, pending a decision regarding its future, the UK has 8 operating refineries with a total crude capacity of 1.7 mbd
• UK refining is more oriented towards gasoline than dieselRefining utlisations are expected to weaken in the period to 2015 as a result of structural product imbalances, weak demand growth and growing refinery supply
• No major investments are currently planned in UK refineriesThe UK’s gasoline surplus grows in all scenariosIn the Base Case and High Case scenarios, the UK’s deficits for gas/diesel oil and jet/kero increase significantly in the period to 2020The UK’s key regional product deficits and import requirements are focused around
• London/South East has large deficits for all products • Jet fuel demand at the London airports is set to grow significantly and lead to increased import requirements &
infrastructure development eg in pipeline capacity to Stansted airport• The North East and Scotland are the two regions currently with significant deficits of gas/diesel oil• Lack of terminal infrastructure and alternative supply points is evident in the South West and Scotland• Seasonal availability of heating kerosene is a particular issue in the South West, along the south coast, North
West and N Ireland• The strategically vital refinery supply locations are Stanlow, Coryton, Fawley and Grangemouth
165

Delivering commercial insight to the global energy industry
www.woodmac.com
Final Report 8th June
3. Import Requirements & Associated Risks
In overall terms in the Base Case, growth in road diesel demand is balanced by declining gasoline and heating oil consumption. Therefore, we believe that in terms of inland infrastructure, the supply and distribution of ground fuels does not represent a future stress point given the current logistics infrastructureHowever, in future the UK will experience a growing surplus of gasoline and a growing deficit of diesel. This will lead to increased import/export product flows and utilisation of logistics infrastructure along the coast. The UK has ample coastal terminal capacity along the east coast, although on the west coast there are a smaller number of locations. Facilities are on the west coast are, however, not currently highly utilised and could play a more active role in supplying the UK market While we do not expect that a material increase in import/export storage capacity will be required to handle the increased future product flows, there could be constraints at different locations primarily related to jetty capacity, road/rail loading facilities or pipeline capacityIn our view therefore while some infrastructure investment will be required, this is likely to be incremental at existing sites eg construction of new tanks at existing sites to provide more operational flexibilityJet fuel imports to supply the London airports appears to be the most significant potential ‘pinch point’ which could require
• Investment in new import infrastructure along the Thames or at Bristol (we have no information regarding the utilisation of current facilities)
• Investment in new pipeline capacity to both Heathrow and Stansted airports• Investment in new inland storage capacity to provide operational flexibility between product supply and demand offtake
In addition we believe that the two regions where additional investment may be warranted to guarantee future import flows are Scotland (jetty capacity at Ross Storage and/or Grangemouth) and the South West (eg expansion of storage capacity in Bristol)Additional pipeline capacity will also be required for supplying jet fuel to Birmingham and East Midlands airports
166

Delivering commercial insight to the global energy industry
www.woodmac.com
Final Report 8th June
14 Appendices
167

Delivering commercial insight to the global energy industry
www.woodmac.com
Final Report 8th June
Appendix 1 - Glossary of TermsATM Air Traffic MovementBOSL Bristol Oil Storage LtdBPA British Pipeline AgencyCOCO Company Owned Company OperatedCDU Crude Distillation UnitCIF Carriage Insurance FreightCOMAH Control Of Major Accident HazardCOCO Company Owned Company OperatedCSO Compulsory Stockholding ObligationDECC Department for Energy & Climate ChangeDODO Dealer Owned Dealer OperatedETS Emissions Trading SchemeFCC Fluidised Catalytic CrackerFOB Free On BoardGPSS Government Pipeline & Storage SystemHSE Health & Safety ExecutiveHOSL Hertfordshire Oil Storage LtdIMO International Maritime OrganisationLOR Lindsey Oil RefineryNCM Net Cash MarginOPA Oil & Pipelines AgencyRTFO Renewable Transport Fuel ObligationSECA Special Environment Conservation AreasSOSL Sunderland Oil Storage LtdUKOP United Kingdom Oil PipelinesVGO Vacuum Gas OilWOSL Warwickshire Oil Storage Ltd
168

Delivering commercial insight to the global energy industry
www.woodmac.com
Final Report 8th June
Wood Mackenzie Disclaimer
Strictly Private & Confidential
This report has been prepared for DECC by Wood Mackenzie Limited. The report is intended solely for the benefit of DECC and its contents and conclusions are confidential and may not be disclosed to any other persons or companies without Wood Mackenzie’s prior written permission.
The information upon which this report is based has either been supplied to us by DECC or comes from our own experience, knowledge and databases. The opinions expressed in this report are those of Wood Mackenzie. They have been arrived at following careful consideration and enquiry but we do not guarantee their fairness, completeness or accuracy. The opinions, as of this date, are subject to change. We do not accept any liability for your reliance upon them.
169

Delivering commercial insight to the global energy industry
www.woodmac.com
Final Report 8th June
Wood Mackenzie
Kintore House74-77 Queen StreetEdinburgh EH2 4NS
Global Contact Details
Europe +44 (0)131 243 4400Americas +1 713 470 1600Asia Pacific +65 6518 0800Email [email protected]
Global Offices
Australia - Canada - China - Japan - Malaysia - Russia - Singapore - South Africa - United Arab Emirates - United Kingdom - United States
Wood Mackenzie has been providing its unique range of research products and consulting services to the Energy industry for over 30 years. Wood Mackenzie provides forward-looking commercial insight that enables clients to make better business decisions. For more information visit: www.woodmac.com
170