uk hotels forecast 2018 report - pwc uk · pdf fileuk hotels forecast 2018. foreword ... 1...
TRANSCRIPT

September 2017: Hotels’ good fortune continues but as uncertainty weighs in, is this as good as it gets?
As good as it gets?UK hotels forecast 2018

ForewordUncertainty weighs in

We don’t expect the growth in 2018 to match 2017, even though the outlook is broadly positive for the UK hotels sector
1 Annual cybersecurity report, Department for Digital, Culture, Media and Sport; PwC, Deloitte, KPMG, and EY 2017
So far this year, the hotels business in the UK has been boosted by two main factors. First, the global economy is growing well – and there has been a marked recovery in continental Europe in recent years. That is helping to encourage overseas visitors to travel more generally, with the UK – and London in particular – always a popular destination for tourists. Second, the fall in the value of the pound since the Brexit vote last year has attracted leisure tourists from overseas and provided an added incentive for visitors to come to the UK.
Looking ahead we should continue to see these positive factors supporting growth in 2018, but to a lesser extent. In addition, Brexit uncertainty is a possible dampener on business travel to the UK, and there are some signs that this is already having an impact. The slowdown in the UK economy may also subdue domestic spending on hotels. We cannot therefore expect the growth in 2018 to match 2017, even though the outlook is broadly positive for the UK hotels sector. A spike in new hotel supply, especially in London, will also act as a drag.
For London, the stronger than anticipated tourism boom in H1 2017 means we have edged up our latest forecast for 2017
and now expect around 6% RevPAR growth for the year as a whole; but we don’t expect this strong growth to be sustained as uncertainty weighs on the economy and the effect of the weak pound slows. For 2018, we are anticipating around 2.4% RevPAR growth, a strong outcome against tough comps and an expected 7,000 new hotel rooms.
In contrast, for 2017 as a whole we have edged our Provinces forecast down a little, but we still forecast further RevPAR growth of 2.5%. Our 2018 forecast is marginally stronger than expected in March, and we now anticipate a further 2.3% RevPAR growth. The terrorist attacks in London and Manchester appear to have had a limited impact on visitation levels.
Cyber-attacks also have the ability to disrupt hotel trading. A recent research report showed that two out of three bosses at Britain’s biggest companies have not been trained in how to deal with a cyber-attack, despite cyberattacks being considered one of the biggest risks these organizations faced.1 While concerns have heightened following the large scale Petya and WannaCry attacks and serious breaches at the National Health Service, hotels are also being targeted by criminals and in this edition we
analyse the key threats to hotels and guests and what needs to be done to fight back.
While hotels are enjoying strong top line growth driven by the weak pound’s boost to travel, they have also to contend with a less positive effect of the depreciated pound as weaker margins reflect the higher cost of imported goods. Hotels also report that the cost of labour has been pushed up as it becomes harder to fill vacant positions. The Brexit vote has prompted some workers from other EU countries to leave already or consider going, partly because of uncertainty around the UK’s economic outlook and because any money those workers earn in pounds is now worth less in euros for them to send home.
David TrunkfieldUK Hospitality & Leisure Leader
Dr Andrew Sentance Senior Economic Adviser, PwC
UK
Hot
els f
orec
ast 2
017/
2018
1

In this issue
2
UK
Hot
els f
orec
ast 2
017/
2018
At a glance .................................................................................................4
Summary ....................................................................................................6
London forecast ................................................................................. 10
Provinces forecast ............................................................................ 14
Key drivers: Economic outlook .......................................................................20Travel outlook ...............................................................................24 Supply outlook .............................................................................28
Feature: Beating cyber crime .....................................................32
Deal talk ...................................................................................................34
Appendices .............................................................................................40
Contacts and further information .....................................44

3
UK
Hot
els f
orec
ast 2
017/
2018

At a glance Hotels’ good fortune continues but as uncertainty weighs in, is this as good as it gets?
4
UK
Hot
els f
orec
ast 2
017/
2018
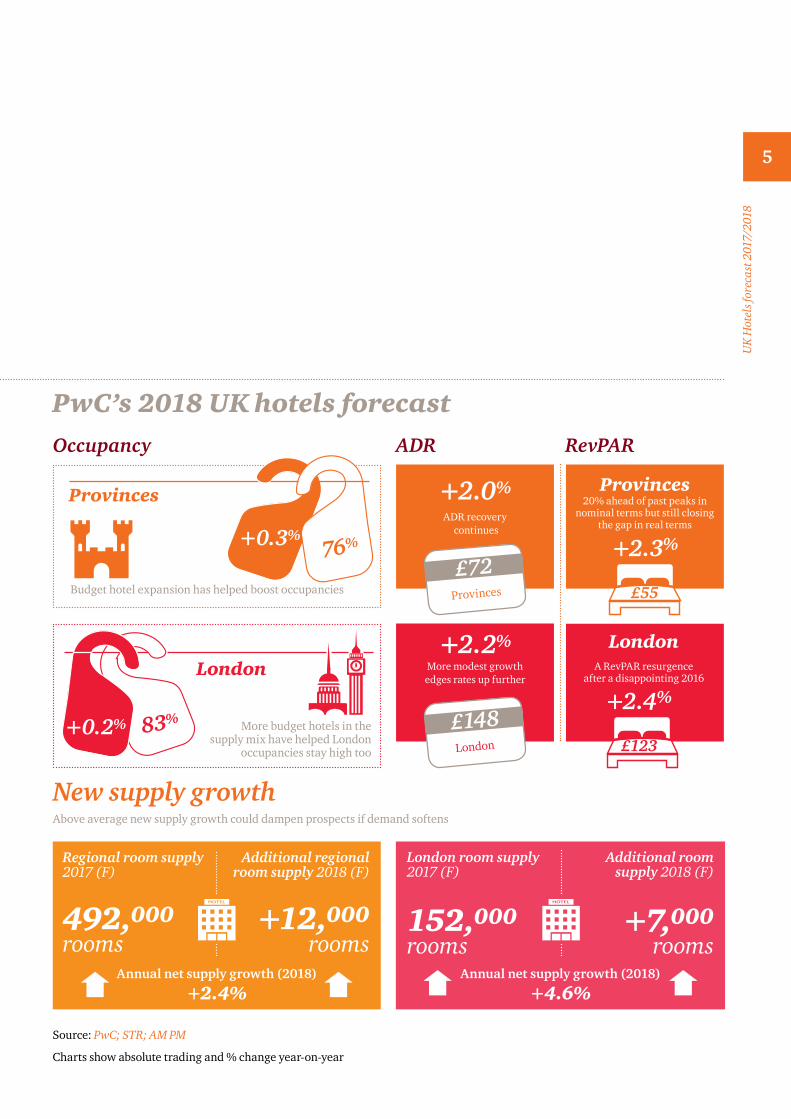
PwC’s 2018 UK hotels forecast
New supply growthAbove average new supply growth could dampen prospects if demand softens
+0.3%76%
Budget hotel expansion has helped boost occupancies
83%
Occupancy
Provinces
London
More budget hotels in the supply mix have helped London
occupancies stay high too
+0.2%
152,000 rooms
+7,000 rooms
London room supply 2017 (F)
Additional room supply 2018 (F)
Annual net supply growth (2018)
+4.6%
492,000 rooms
+12,000 rooms
Regional room supply 2017 (F)
Additional regional room supply 2018 (F)
Annual net supply growth (2018)
+2.4%
RevPAR
A RevPAR resurgence after a disappointing 2016
+2.4%
£123
London
20% ahead of past peaks in nominal terms but still closing
the gap in real terms
£55
Provinces
+2.3%
Source: PwC; STR; AM PM
Charts show absolute trading and % change year-on-year
ADR
£72Provinces
+2.0%
ADR recovery continues
£148London
+2.2%More modest growth edges rates up further
5
UK
Hot
els f
orec
ast 2
017/
2018

Summary
UK
Hot
els f
orec
ast 2
017/
2018
6

[Sub title goes here]7
London: a slower pace of growth forecast for 2018
In London, the strength of the global and Eurozone economies as well as the value of Sterling are traditionally key drivers of hotel performance. 2017 has been exceptional, as a weak pound has driven inbound leisure travel.
After a largely lacklustre 2016, London hotels have enjoyed an energetic pace of growth so far in 2017, with H1 2017 seeing almost double digit RevPAR growth compared to the same period in 2016.2 The tailwind provided by the weak pound since the Brexit Referendum has made the capital better value for money and has attracted record numbers of international leisure tourists, particularly from North America. So far, holiday inbound passengers continue to grow strongly (despite a May dip) showing around 20% growth in the first half of 2017, compared to the same period in 2016. The trend is despite the shadow of recent terrorist attacks in the capital. It should be noted that results have been boosted by easy comps in 2016.
But, inbound corporate travel has recorded a 2.8% decline in the first half of 2017, compared to the same period in 2016 (which was quite a strong year for business travel). It appears that headwinds from policy uncertainty, including Brexit and a general election, have impacted this sector. Interestingly, hotel RevPAR appears not to have been impacted and hoteliers we speak to have not voiced concerns about corporate business levels.
New hotel room openings are running very high, and pipeline data suggests a new spike in openings in 2017 as around 8,500 new rooms open their doors across London and a further 7,000 new rooms could open in 2018. That’s a lot of new rooms to fill. The continued increase in new branded budget supply has been a factor in the midscale/economy market underperformance in H1 2017. Competition from alternative accommodation choices such as the sharing economy and serviced apartments are also likely to eat into hotel market share.
Overall, we think the current pace of hotel performance growth is not sustainable through the second half of the year and into 2018. Yes, the boost from the weak pound is likely to continue but we expect growth will be weaker. So far trading has been very good but, after four months of double digit or close to double digit RevPAR growth, June and July have seen marginal occupancy declines and more moderate RevPAR growth. Some London hotels recently reported weaker weekend domestic demand and some luxury operators stated having seen a softening in demand from Middle Eastern markets. Looking to 2018, the biennial Farnborough International Air Show returns, it’s one of the largest events in the aerospace calendar and will help provide an uplift for hotels in London and the south east. A more unquantifiable catalyst will be how some districts, attractions and hotels capitalise on the arrival of Crossrail during 2018 and beyond.
2 RevPAR= rooms revenue per available room and is a key performance metric for the sector; Benchmarking data sources: STR
Holiday visits
20%
increase in the first half of 2017
7
UK
Hot
els f
orec
ast 2
017/
2018

PwC forecast is edged down for 2018 but is still reasonably strong
The surge in overseas tourism means our revised forecast for 2017 as a whole is now stronger than we anticipated in March this year, but we have edged down our outlook for 2018 although it remains reasonably strong. We now forecast year-on-year London occupancy growth of 2.3% in 2017 as a whole with only a further marginal increase
of 0.2% in 2018, taking occupancy up two percentage points to 83%. ADR growth remains resilient and is forecast to increase by 3.6% in 2017 and to see additional growth of 2.2% in 2018. This takes ADR to £145 and £148 respectively. This drives a robust RevPAR gain of almost 6% this year and a further 2.4% in 2018, taking RevPAR to £120 this year and £123 in 2018. See Table 1 and Figure 3.
Table 1: PwC 2017 and 2018 UK hotels forecastOnward and upward at a slower pace in 2018
London Provinces
A: Actual F: Forecast 2016A 2017F 2018F 2016A 2017F 2018F
Occupancy % 81% 83% 83% 76% 76% 76%
ADR (£) 139 145 148 69 71 72
RevPAR (£) 114 120 123 52 54 55
% growth on previous year
Occupancy -0.9% 2.3% 0.2% -0.3% 0.2% 0.3%
ADR -2.1% 3.6% 2.2% 3.3% 2.4% 2.0%
RevPAR -3.0% 6.0% 2.4% 3.0% 2.5% 2.3%
Source: Econometric forecasts: PwC August 2017 Benchmarking data: STR July 2017
We now forecast year-on-year London RevPAR growth of
2.4%in 2018
8
UK
Hot
els f
orec
ast 2
017/
2018

Provinces: further steady growth forecast
Provincial hotel performance is closely linked to the strength of the UK and local economies. The weak pound has also boosted key tourism destination cities in 2017
Many cities across the country have enjoyed further healthy H1 2017 trading and overall the first half saw 4.4% RevPAR growth. This trend has continued into July where the Provinces saw overall good RevPAR growth of 4.2%.
Hotels outside London tend to rely more on domestic than international demand, with conference, meetings and corporate demand a key driver, but this year the weaker pound has helped lift double digit RevPAR growth in some key visitor destinations. This included Belfast (interest from Game of Thrones fans is reported a factor), Cardiff (helped by the Champions League in June) and Edinburgh. Amongst others, Plymouth, Sheffield, Glasgow, York and Liverpool also saw energetic growth. Hull has enjoyed City of Culture status in 2017 and hotels are reported to have seen a 13% occupancy lift in Q1 2017.
Both occupancy and rates have been driving growth in many cities. Unlike London, the Provinces did not see a dip in performance in 2016 and ADR results to July recorded 52 months of consecutive growth, according to STR. Occupancy remains high but growth has been weaker. Recent press reports and trading results suggest that following uncertainty after the Manchester Arena bombing on 22 May, visitors are returning to the city.
2018 outlook
It remains to be seen whether staycations can also boost Provincial performance this year and in 2018 and overseas holidays remain popular. In terms of events, Glasgow will hope to attract the crowds again in 2018, as it did during the Commonwealth Games in 2014, when it hosts the inaugural multi-sport concept European Sports Championships from 2nd – 12th August.
New hotel openings continue across the country at an above average level and certain cities could see some imbalances if demand weaken. Edinburgh expects to see around 1,000 new rooms in the remainder of this year and next, and Edinburgh planners will rule on proposals by Urbanist Hotels, to balance conservation and development and convert the city’s former Greek revival building, Royal High School, into a 127 room luxury hotel.
Meanwhile branded budget hotels continue to increase their share of new room openings and this has been a contributory factor in the underperformance of the midscale and economy sector outside London in the first half of the year.
More modest growth expected to lift metrics to record highs
For 2017 as a whole, based on performance to date and likely outlook, we have trimmed our forecast down a little, though we still forecast further growth; in contrast (and against a slightly weaker 2017) our 2018 forecast is marginally stronger. We now forecast year-on-year provincial occupancy growth of 0.2% in 2017 as a whole with a further marginal increase of 0.3% in 2018, maintaining a high occupancy level at 76%. This is five percentage points higher than experienced 10 years ago. ADR growth is forecast to increase by 2.4% in 2017 and again by 2% in 2018. This takes ADR to £71 and £72 respectively. This drives a healthy RevPAR gain of almost 2.5% this year and a further 2.3% in 2018, taking RevPAR to £54 this year and £55 in 2018. See Table 1 and Figure 3.
We now forecast year-on-year Provincial RevPAR growth of 2.3%
in 2018
H1
4.4%
UK
Hot
els f
orec
ast 2
017/
2018
9
RevPAR growthin 2017

London forecastPwC forecast reasonably strong growth for London in 2018 but at a slower pace than in 2017
UK
Hot
els f
orec
ast 2
017/
2018
10

3 Tom Jenkins, CE of the European Tourism Association, in a Skift report, “UK Business Travel is in a post-Brexit slump”, 22 August 2017
11
UK
Hot
els f
orec
ast 2
017/
2018
Is the market hotting up or cooling down?
The 21st June saw London record its hottest June day since 1976, with a temperature of 34.4C (94F) recorded at Heathrow Airport, but there are now signs that the capital’s buoyant hotel market may be cooling off slightly.
To date to July 2017, London enjoyed occupancy growth of 2.6% and ADR gains of 6.3% driving RevPAR growth of 9%, compared to the same period last year. The surge in overseas tourism has been boosted by North American visitors, and with sterling at the lowest it’s been against the dollar for 30 years, it’s no wonder.3 The results are still remarkable against the backdrop of an uncertain corporate and consumer outlook, three recent terrorist attacks, and high levels of new supply openings.
So why do we think the pace of growth is unstainable? We still forecast growth in 2018, but expect the inbound holiday boost from the weak pound to slow down. Inbound business travel trends are reported down by 2.8% for the six months to June; decelerating UK economic growth could impact domestic business travel and meetings. Occupancy growth had been trending downwards since March, strengthened in May, but saw marginal declines in
June and July. While the comps for the first half of the prior year have been fairly easy, they now become tougher in the second half of 2017. We also anticipate that a supply hike will make it harder to fill rooms. While 2017 autumn forward bookings are marginally behind, hoteliers in the leisure market remain optimistic for 2018 none the less.
Above average supply growth could dampen trading growth
Against the backdrop of strong trading, unsurprisingly there continues to be plenty of interest in developing new hotels in the capital. New hotel room openings are running very high, and PwC expect a new spike in openings in 2017 as around 8,500 new rooms open their doors across London and another 7,000 new rooms could open in 2018. If these all open it represents a 5.6% growth in 2017 and 4.6% in 2018. That’s a lot of new rooms to fill. Competition from alternative accommodation choices such as Airbnb and serviced apartments are also likely to eat into growth. New developments include IHG’s recently agreed deal for a new Hotel Indigo in Leicester Square, which will feature a rooftop bar, and plans to bring its US Kimpton brand to London for the first time.

Not all growth is equal
We are now seeing a recent market outperformance by midscale and economy hotel segments (MS&E) following a relative underperformance in H1 2017. This is partly attributable to the large supply increases recently, as well as the recent inbound tourism profile (principally US and Asia) and also the return of European tour groups, as the MS&E segment doesn’t tend to see the same benefit from these segments as the luxury and upscale segments. Anecdotal evidence suggests that the slowdown in Middle East visitors to
luxury hotels during July and August may be attributed to Qatar’s political problems discouraging visitation. It is unclear when this will be resolved and whether 2018 will also be impacted.
Looking ahead
What will help support demand in 2018? Farnborough International Air Show, one of the largest events in the aerospace calendar, returns to the UK from 16th to 22nd July 2018. With 71% of the exhibitors from outside the UK and the public airshow at the weekend expected to attract 80,000 visitors, the event will help uplift hotel performance.
Events likely to have less of an impact but nevertheless generate interest in London, include British Athletics and USA Track and Field’s, ‘The Meet’, a brand new one day athletics event billed as an iconic head to head competition to be held on Saturday 21 July at the London Stadium; the Women’s Hockey World Cup and NBA Regular Season Basketball returns to The O2 arena on Thursday 12th January with the Denver Nuggets and Indiana Pacers. A more unquantifiable catalyst will be how some districts, attractions and hotels capitalise on the arrival of Crossrail during 2018 and beyond.
PwC forecast for 2017 and 2018
The tourism boom means that for 2017 as a whole, our revised forecast is now much stronger than we anticipated in March this year, although edged down for 2018, but still reasonably strong.
We now forecast year-on-year London occupancy growth of 2.3% in 2017 as a whole with a further marginal increase of
0.2% in 2018, taking occupancy up two percentage points to 83%. ADR growth is forecast to increase by 3.6% in 2017 and to see additional growth of 2.2% in 2018. This takes ADR to £145 and £148 respectively. This drives a robust RevPAR gain of almost 6% this year and a further 2.4% in 2018, taking RevPAR to £120 this year and £123 in 2018. See Table 1.
Occupancy stays high as budget hotels increase their share
London enjoys some of the consistently highest global occupancy levels averaging 80% or above since 2006 and our forecast is for occupancy to reach just over 83% this year and in 2018. As the budget sector has increased its market share in London, we have seen segment
12
UK
Hot
els f
orec
ast 2
017/
2018

mix shift and the higher occupancy budget hotels have helped drive overall market performance.
This will be a significant feat given the new supply additions in recent years and represents a two percentage point improvement over a disappointing 2016. We’re forecasting only marginal growth 0.2% growth in 2018, after a forecast gain of 2.3% gain this year.
2017 ADR could be £30 higher in nominal terms than 10 years ago
London ADR is forecast to grow by around 3.6% this year and by an additional 2.2% in 2018. This would mean that London ADR could end 2017 almost £30 higher (in nominal terms) at £145 than it was 10 years ago in 2007 (£115). ADR could reach almost £148 by 2018.
A RevPAR resurgence
In real terms, London RevPAR will be almost 3% above 2007’s rate by the end of 2017, after peaking at 3.5% above that rate in 2015. See Figure 1. We forecast RevPAR growth of 6% this year and additional growth of 2.4% in 2018, taking RevPAR to £120 this year and £123 in 2017, in nominal terms.
Source: PwC
Figure 1: London is forecast to rebound from a poor 2016 in real terms London RevPAR real and nominal index
20092008 2010 20122011 2015 2016 2017F 2018F20142013200780.0
90.0
100.0
110.0
120.0
130.0
140.0
Nominal RevPAR index Base Real RevPAR index
Forecast
13
UK
Hot
els f
orec
ast 2
017/
2018
ADR expected to drive RevPAR in 2018

Provinces forecast
The Dark Hedges, County Antrim, Northern Ireland
Game of Thrones fans are boosting tourism visitation to Northern Ireland as they visit film locations used in the fantasy drama television series
1.2% occupancy growth in the six months to June 2017
14
UK
Hot
els f
orec
ast 2
017/
2018

The Provinces comprise a large and diverse geographic area; performance varies by region and each location has its individual demand drivers. Aggregated results clearly smooth over these differences. In the main, city hotel performance is closely correlated to GDP growth and we see UK regional performance is more dependent on UK and local growth than destinations that attract a high proportion of international visitation, where there is more correlation to global and Eurozone economies and less to sterling’s strength or weakness.
That said, H1 2017 saw hoteliers in Edinburgh, Cardiff and Belfast, like London, see a boost from the exchange rate attracting international holiday travellers and this has pushed their RevPAR performance into double digit growth. Edinburgh and Belfast have seen ADR gains alone of 15% and 13% whereas Cardiff’s additional hosting of the Champions League Final in June, helped lift occupancy and rates and pushed RevPAR to almost 11% growth in the first half of the year. Plymouth, Sheffield, Glasgow, York and Liverpool have also seen robust growth. Hull has enjoyed City of Culture status in 2017 and hotels are reported to have seen a 13% occupancy lift in Q1 2017.
In contrast, Aberdeen saw a tenth consecutive quarter of falling RevPAR with a 11% decline in Q2 2017, with over 800 new rooms still to open between now and 2019.
In the first few weeks following the Manchester Arena bombing attack on 22 May, hotel general managers in the city’s hotel association reported a softening demand for hotel rooms.4 Recent press coverage suggests that while there was a lot of uncertainty, that feeling is starting to change now, with tourists, visitors and families returning to stay in the city’s hotels. A recent report from AM:PM suggests the weak pound may have mitigated the effect as the surge in overseas visitors, including tour groups, cushioned the impact.5 Manchester saw almost 1.2% RevPAR growth in the 7 months to July 2017.
Overall, H1 2017 in the Provinces saw occupancy growth of 1.2% to 73.6% in the six months to June 2017 compared to the same six months in 2016. High occupancies helped hoteliers raise ADR in H1 which showed a 3.2 % gain, taking rates to £69.50 and driving RevPAR up by 4.4 % to almost £49. Good growth followed in July.
4 Manchester Evening News 3 July 20175 Hotel Bulletin Q2 2017 Alix Partners, HVS and AM:PM
15
UK
Hot
els f
orec
ast 2
017/
2018
H1 2017 saw some great results around the country; as Manchester recovers from the terrorist bombing in May

16
UK
Hot
els f
orec
ast 2
017/
2018
Events in 2018
Glasgow will hope to attract the crowds again, as it did during the Commonwealth Games in 2014, when it hosts the inaugural multi-sport concept European Sports Championships from 2nd – 12th August. The city and other Scottish venues will host the aquatics, cycling, gymnastics, rowing, triathalon and a new golf team championships; while Berlin as co-host will feature the athletics.
Around the country conference centres continue to attract important congresses and 2018 is no exception when events include the annual congress of the Royal College of Ophthalmologists in Liverpool’s ACC and the World Haemophilia Conference in Glasgow’s SEC in May.
Most regions will see some economic growth
Looking ahead, PwC expect most regions outside London to expand economically at a rate at or below the UK average of 1.5% in 2017 as a whole, while Northern Ireland is predicted to lag behind somewhat with growth of around 1%. Growth is expected to decelerate slightly further in most regions during 2018, as the UK continues to feel the effects of Brexit-related uncertainty. But we do not project negative growth in any region in our main economic scenario.
Accelerating new room supply growth
New supply is likely to continue to accelerate in selected cities outside London as developers take advantage of the buoyant market. In 2017 Provincial new supply is forecast to increase by 2.1% as another 10,400 rooms are potentially added and in 2018 by a further 2.4% when almost 12,000 rooms could be added. The branded budget chains are still a key driver accounting for over 40% of the UK active pipeline. Cities with large pipelines for 2018 include Manchester, Belfast, and Glasgow with over 1,000 rooms in each city’s pipeline. Edinburgh is scheduled to see another 600 rooms open in the remainder of this year with the same number again in 2018. Liverpool welcomes 700 more new rooms in 2018 and Bath will see 450 rooms open in 2017 and 2018.
PwC forecast for 2017 and 2018
Against the weaker economic UK economic outlook, stronger supply growth, as well as some strong comps over the summer and towards the end of the year, our latest forecast expects expect around 2.5% RevPAR growth overall in 2017 as a whole. These forecasts for the Provinces for 2017 are slightly lower but broadly in line with those from February 2017. The year-on-year forecast for occupancy is predicted to remain flat at around 0.2% in 2017 and 0.3% in 2018. This takes occupancy to 76% this year and keeps it there in 2018. ADR continues to recover and is anticipated to see growth of 2.4% in 2017 taking it to a record £71, in nominal terms. In 2018 additional ADR growth of 2% is forecast. This means RevPAR growth will be 2.5% this year and a further 2.3% in 2018, nudging RevPAR from £52 in 2015 to £54 in 2017 and £55 by 2018.
Occupancies continue to edge up (just)
Occupancy rates remain a crucial benchmark for profitability for the hotel sector. Regional occupancies have climbed back into the 70’s since 2011 and have been creeping up since then, hitting 76% since 2015. Our forecast for 76% this year and in 2018 would still be an achievement given an additional 7,500 rooms added in H1 2017, according to AM:PM. Indeed, the trend is driven partly by a continuing structural supply shift towards a greater proportion of budget rooms which traditionally operate at high occupancy levels.

17
UK
Hot
els f
orec
ast 2
017/
2018
Figure 2: Provinces are almost back to 2007 in real termsRegions RevPar Index (2007 levels = 100)
Source: PwC
Forecast
20092008 2010 20122011 2015 2016 2017F 2018F20142013200775.0
80.0
85.0
90.0
95.0
100.0
105.0
110.0
115.0
120.0
125.0
Nominal RevPAR index Base Real RevPAR index
ADR growth forecast
With average occupancy at 76% last year, we can see why Provincial hotels continue to be able to continue drive price. There still remains scope for further recovery in ADR in real terms as real ADR still lags pre-recession peaks, however we forecast slower growth.
By 2018, RevPAR could be 20% ahead of past peaks in nominal terms but still lag by 6.6% in real terms
Provincial RevPAR is forecast to end 2017 20% ahead of pre-recession peaks in nominal terms but lag by 6.6% in real terms, a gap that has continued to close since the last recession.

18
UK
Hot
els f
orec
ast 2
017/
2018
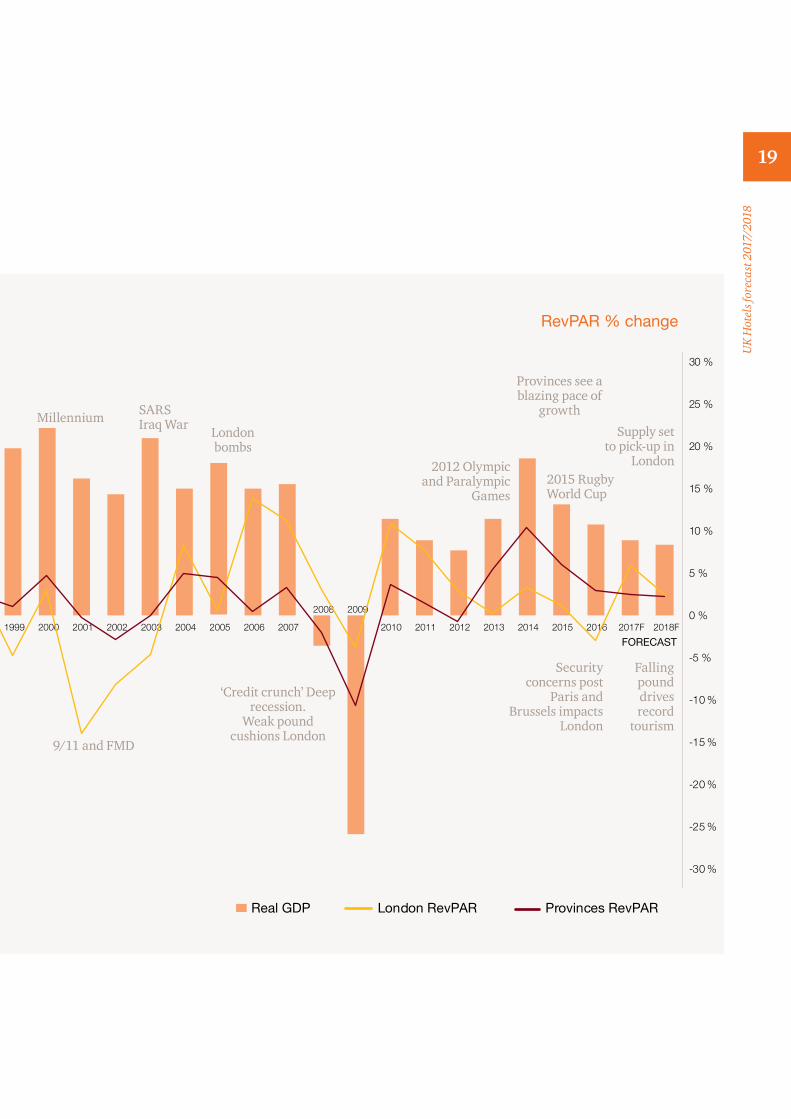
Figure 3: As good as it gets?Real GDP growth, revenue per available room (RevPAR) 1979-2018F
Source: Econometric forecasts: PwC June 2017 Macroeconomic data: National Statistics Benchmarking data: HotStats, STR; Supply data: AM PM
2008 2009
2010
-30 %
-25 %
-20 %
-15 %
-10 %
-5 %
0 %
5 %
10 %
15 %
20 %
25 %
30 %
-5 %
-4 %
-3 %
-2 %
-1 %
0 %
1 %
2 %
3 %
4 %
5 %
1979
1980 1981
1982 1983 1984 1985 1986 1987 1988 1989 1990
1991
1992 1993 1994 1995 1996 1997 1998 1999 2000 2001 2002 2003 2004 2005 2006 2007 2011 2012 2013 2014 2015 2016 2017F 2018F
Real GDP Provinces RevPARLondon RevPAR
Real GDP % change RevPAR % change
FORECAST
Recession Unemployment hits almost 2m
London supply shortfalls Record US visitors
US visitors down
Strong $
Record domestic tourism
‘Black Monday’
‘Black Wednesday 16 Sept. 1992 Britain
leaves ERMRecession Gulf War
Recession fears
19
UK
Hot
els f
orec
ast 2
017/
2018
2008 2009
2010
-30 %
-25 %
-20 %
-15 %
-10 %
-5 %
0 %
5 %
10 %
15 %
20 %
25 %
30 %
-5 %
-4 %
-3 %
-2 %
-1 %
0 %
1 %
2 %
3 %
4 %
5 %
1979
1980 1981
1982 1983 1984 1985 1986 1987 1988 1989 1990
1991
1992 1993 1994 1995 1996 1997 1998 1999 2000 2001 2002 2003 2004 2005 2006 2007 2011 2012 2013 2014 2015 2016 2017F 2018F
Real GDP Provinces RevPARLondon RevPAR
Real GDP % change RevPAR % change
FORECAST
9/11 and FMD
‘Credit crunch’ Deep recession.
Weak pound cushions London
Millennium SARS Iraq War
London bombs
2012 Olympic and Paralympic
Games
Provinces see a blazing pace of
growth
2015 Rugby World Cup
Supply set to pick-up in
London
Falling pound drives record
tourism
Security concerns post
Paris and Brussels impacts
London

UK
Hot
els f
orec
ast 2
017/
2018
Economic outlook
UK
Hot
els f
orec
ast 2
017/
2018
20
21
UK
Hot
els f
orec
ast 2
017/
2018
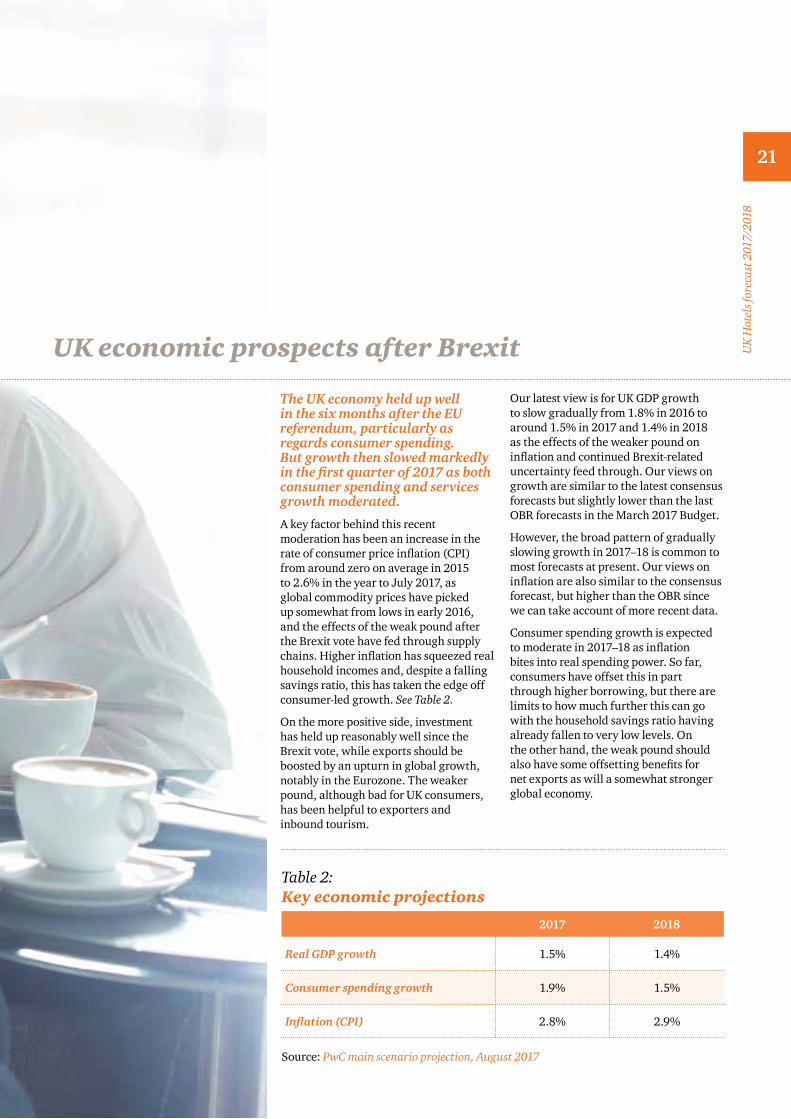
Table 2: Key economic projections
2017 2018
Real GDP growth 1.5% 1.4%
Consumer spending growth 1.9% 1.5%
Inflation (CPI) 2.8% 2.9%
Source: PwC main scenario projection, August 2017
The UK economy held up well in the six months after the EU referendum, particularly as regards consumer spending. But growth then slowed markedly in the first quarter of 2017 as both consumer spending and services growth moderated.
A key factor behind this recent moderation has been an increase in the rate of consumer price inflation (CPI) from around zero on average in 2015 to 2.6% in the year to July 2017, as global commodity prices have picked up somewhat from lows in early 2016, and the effects of the weak pound after the Brexit vote have fed through supply chains. Higher inflation has squeezed real household incomes and, despite a falling savings ratio, this has taken the edge off consumer-led growth. See Table 2.
On the more positive side, investment has held up reasonably well since the Brexit vote, while exports should be boosted by an upturn in global growth, notably in the Eurozone. The weaker pound, although bad for UK consumers, has been helpful to exporters and inbound tourism.
Our latest view is for UK GDP growth to slow gradually from 1.8% in 2016 to around 1.5% in 2017 and 1.4% in 2018 as the effects of the weaker pound on inflation and continued Brexit-related uncertainty feed through. Our views on growth are similar to the latest consensus forecasts but slightly lower than the last OBR forecasts in the March 2017 Budget.
However, the broad pattern of gradually slowing growth in 2017–18 is common to most forecasts at present. Our views on inflation are also similar to the consensus forecast, but higher than the OBR since we can take account of more recent data.
Consumer spending growth is expected to moderate in 2017–18 as inflation bites into real spending power. So far, consumers have offset this in part through higher borrowing, but there are limits to how much further this can go with the household savings ratio having already fallen to very low levels. On the other hand, the weak pound should also have some offsetting benefits for net exports as will a somewhat stronger global economy.
UK economic prospects after Brexit

22
UK
Hot
els f
orec
ast 2
017/
2018
Brexit-related uncertainty may hold back business investment, but this should be partly offset by planned rises in public investment (as announced in the Autumn Statement last November).
Fiscal policy could also be further relaxed in the 2017 Autumn Budget, although we have not factored this into our main scenario projection at this stage.
Regional prospects
London is expected to continue to lead the regional growth rankings in 2017, expanding by around 1.8%, although this is down from around 2.4% in 2016. Most other regions are projected to expand at a rate at or below the UK average of 1.5% in 2017, while Northern Ireland is predicted to lag behind somewhat with growth of around 1%. See Figure 4.
Growth is expected to decelerate slightly further in most regions during 2018, as the UK continues to feel the effects of Brexit-related uncertainty. But we do not project negative growth in any region in our main scenario.
It is important to note that regional output data are published on a much less timely basis than national data. As a result, the margins of error around these regional output projections are even larger than for the national growth projections, so they can only be taken as illustrative of broad directional trends.
Figure 4. Key economic projections PwC main scenario for output growth by region in 2017 and 2018
Europe and other markets
There has been increasing optimism about the G7 in recent months, with stock markets at record highs and growth prospects in the Eurozone improving. Overall, the data indicate a slight acceleration in G7 economic growth to 1.7% year-on-year in the last quarter of 2016 and 1.8% in the first quarter of 2017. France in particular has seen a notable improvement in growth.
There are several tailwinds likely to support these key global economies over coming months and years. First is the continued highly accommodative monetary stance across the G7 and, in particular, in the Eurozone, despite the gradual rise in US rates from historic lows recently. Second, governments are starting to spend more, with some putting infrastructure plans in place.
Third, there has been an uptick in demand from the large (E7) emerging markets, partly driven by a fiscal stimulus in China, as well as a turnaround in economic activity in Brazil. This is corroborated by recent trade data, which show that emerging markets’ import growth continued to grow compared to a year earlier.
0.0
0.5
1.5
1.0
2
London England SouthEast
SouthWest
UK East Midlands
EastAnglia
NorthWest
NorthEast
Wales Yorkshire& Humberside
Scotland WestMidlands
N Ireland
2017 2018Source: PwC projections, August 2017

UK
Hot
els f
orec
ast 2
017/
2018
23

Travel outlook remains generally favourable for hotelsUK hotel demand drivers remain largely positive across the UK as the weak pound boosts record inbound holiday travel volumes. Recent terrorist events have had a shocking but limited impact on visitation levels. However, decelerating UK economic growth and uncertainty around Brexit policy issues look to have dampened corporate travel demand. The outlook for global leisure travel remains positive.
UK
Hot
els f
orec
ast 2
017/
2018
24

at weakest level against the
yearsfor
$£30
25
UK
Hot
els f
orec
ast 2
017/
2018
How long can the tourist windfall last?
Recently, UK inbound holiday tourism has experienced a boost from a weak pound which has made the UK a more affordable destination for many markets. In particular, sterling was down around 17% against the Euro and 13% against the US dollar since the Referendum vote on 23rd June and 31st August 2017. Visits from high volume EU markets were 4% up over H1 2016, with a record 12.8 million visits in H1 2017. Sterling has not been at such a level against the dollar for over 30 years and North American visitor levels have increased particularly strongly, with visits up 34% in June alone. In contrast, flight booking data suggests arrivals from the Middle East are slower than for many other long haul markets at the moment.
According to Visit Britain there were six million holiday visits in the first five months of 2017, the first time such a high volume have arrived in the UK before June. While BHA analysis showed a material slowdown in inbound holiday passenger growth in May there was then a significant rebound in growth in June. However, this was against easy comps, when inbound holiday passengers were down – 7% year-on-year in June 2016; holiday inbound passengers are therefore up +12% in June 2017 vs June 2015. See Table 3. PwC’s view is that while the impact of the weak pound will remain a strong driver of demand in the rest of 2017 and 2018, achieving further growth on top of the strong incoming performance in 2017 will be an issue.
Table 3: Inbound tourism June 2017
Inbound
All visits Holiday BusinessVisiting
friends or relatives
Misc.
June y/y growth 7.4% 20.9% -6.5% 1.8% 6.0%
June 2-yr growth 8.0% 12.2% -6.0% 11.9% 21.1%
Year to date 8.7% 20.4% -2.8% 4.0% 13.1%
Rolling 3 months 7.8% 20% -3.6% 1.5% 5.8%
Rolling 12 months 6.6% 11.6% -0.3% 7.5% 1.8%
Source: International Passenger Survey, ONS data, British Hospitality Association Analysis

26
UK
Hot
els f
orec
ast 2
017/
2018
Less buoyant inbound business travel trends
So far, the inbound business travel market has been less positive. According to ONS data there has been a decline in inbound business travel with passenger numbers falling by 7% in June. YTD to June business inbound passenger number growth remains 2.8% below 2016 levels. See Table 3. VisitBritain have pointed out that 2016 was a strong year for business travel and that the first half of 2017 is actually up 2% on the same period in 2015. Given the robust growth in hotel RevPAR recently the scale of the corporate travel decline is surprising but perhaps hotels have been cushioned by the strength of inbound holiday visitors. We have heard that four star hotels have taken more groups and FIT’s, especially from the US market.
Domestic business travel holds up but fails to flourish
Has Brexit uncertainty impacted domestic business travel? Research from BDRC Continental reveals that overall, domestic business demand (British business travellers staying in UK hotels) has seen no significant growth since the start of the decade and remains somewhat lower than it was at the start of the 2008 financial crisis. For the 12 months up to the end of Q2 2017, the number of British people staying in hotels for business show slight declines year-on-year, from an estimated 5.1 million to 4.9 million.
Better news is that although fewer business people actually stayed in hotels those that did stayed longer and the number of nights in hotels increased modestly by approximately one million nights year-on-year.
Meetings and conferences show some positive signs
A recent report analysing meetings and conference sector performance in 2016 showed that the overall number of conferences and meetings held in the UK in 2016 (an estimated 1.45 million) rose 8% compared with the prior year. There was a slight decrease in the average size of events, combined with, importantly for hotels, a small reduction in the proportion of residential events, which meant that the overall value of the sector remained more or less constant. 2017’s results will not be published until 2018. But, more recently, research from the HBAA and The Meetings Benchmark, showed that spending on meetings and delegate numbers grew strongly in H1 2017, compared to the same period in 2016. While this is encouraging news which will help support demand, further economic and Brexit related uncertainty might mean tighter policies and cost controls remain in place.
Events supporting demand in 2018
What else might support travel volumes in 2018? In addition to regular festivals, shopping opportunities, amazing experiences and world class events, 2018 sees the Inaugural European Championships in Glasgow (+ other venues in Scotland) and the city will be hoping this attracts large numbers as did the Commonwealth Games in 2014; HBO’s Game of Thrones attracts visitors to Northern Ireland where some of the series is filmed. Further afield, summer 2018 sees Russia host the 2018 FIFA World Cup although this will probably have a neutral impact for UK hotels unless the event attracts travellers that might have come to the UK.
Are we all going on a Staycation?
Despite speculation about a staycation boom this year, we still seem to be wedded to our overseas holidays. Indeed, outbound holiday passenger numbers returned to growth in June (+7%) after a decline in May.
A recent ONS report revealed that UK residents went on more than 45 million foreign holidays in 2016 – up from 27 million in 1996 – a 68% rise in overseas holidays over the last 20 years. In addition, domestic holiday taking volumes have fallen for the past four years and 2016 saw the number of domestic trips 3% lower than in 2015.
However, 2017 may yet reverse this trend, and we already saw strong growth recorded in domestic bednights in April 2017.

6 UK Conference and Meeting Survey June 2017’ (UKCAMS)
27
UK
Hot
els f
orec
ast 2
017/
2018
More inbound tourism growth is forecast by VisitBritain in 2018 although the outlook for corporate travel remains uncertain
The backdrop for international travel is positive and according to the UN World Tourism Organisation (UNWTO), international tourist arrivals worldwide grew by 6% in January – April of 2017 compared to the same period last year, with business confidence reaching its highest levels in a decade. Sustained growth in most major destinations and a steady rebound in others drove results. Prospects for May – August 2017 are forecast to remain high. UNWTO forecast further growth in 2018.
What does this mean for the UK? Visit Britain’s overall forecast for 2017 is for 38.1 million visits, an increase of 4.0% on 2016; and £24.1 billion in visitor spending, an increase in visits of 8.1% on 2016.
This is slower growth than the 5% growth seen in each of 2013 – 15 so is close to the medium term rate of growth in visitor numbers. A record 2017 suggests flatter growth forecasts for 2018.
For corporate travel, the Global Business Travel Association (GBTA) reports that it expects global business travel spending to accelerate significantly in 2018 although they concede that uncertainty is unusually high and while some sources of uncertainty could ultimately have a positive impact on business travel, other factors may have more negative impacts on business travel including trade policy renegotiation, terrorism, travel and immigration bans, sanctions, electronics bans and geopolitical tensions. For the UK, uncertainty around Brexit and its impact on economic growth and business travel spend clouds the outlook.

Supply OutlookStrong trading fundamentals and consumer demand for modern and refurbished branded products in new and existing locations is driving new development. Demand is polarised between three and four star brands and branded budgets. In London luxury hotel development is also active. A range of alternative accommodation providers such as serviced apartments, hostels, aparthotels and shared economy products are increasingly competing with hotels for the same guests.
UK
Hot
els f
orec
ast 2
017/
2018
28

29
UK
Hot
els f
orec
ast 2
017/
2018
New supply spikes in London in 2017 and 2018 could impact performance if demand softens
The growth rate for new openings is already running very high in London, with a 5.6% growth spike expected in 2017, compared to 2016 and a further 4.6% in 2018. See Figure 5 which shows this is above trend. Around 3,600 new rooms are still to open in 2017 and around 62% (2,240 rooms) of these will be branded budgets, with the continued increase in new branded budget supply being cited as a factor in the midscale/economy market underperformance in H1 2017.
A further 20% of the new openings (708 rooms) in 2017 will be apartments including 268 rooms at Grange Tower Apartments, but StowAway from Bridgestreet, Wilde by StayCity and Go Native will also open. As shared economy operators eye up the corporate market, Airbnb are reported to be introducing Airbnb Lux, an elite high tier home rental, as well as Airbnb Select which aims to provide consistent standards for premium travellers and the corporate market.
In 2018, a further 7,000 new rooms could open with just under half of these rooms being developed in the budget segment. There are 13 new 4 star properties with almost 2,000 rooms to open including the 190 room now London in Old Street; the 125 room Park Regis Shoreditch and a new 192 room Hoxton Southwark. In the 5 star segment new openings should include Steigenberger’s 233 room Great Scotland Yard due to open at the end of March and the Westin London Queensbridge at Monument.
Bonanza for London Heathrow in 2018 as around 2,700 rooms are set to open
Looking at specific hot spots, in 2018 Heathrow Airport could see approaching 3,000 rooms open, including, a 437 room Moxy; a 450 room Holiday Inn Express T4; a 640 room Heathrow T2; a 190 room Staybridge Suites; a 433 room Holiday Inn Heathrow; a 244 Courtyard by Marriott and an independent 298 room three star hotel at T2.
New supply is likely to continue to accelerate in selected cities outside London as developers take advantage of the buoyant market
The pipeline in regional room openings are also forecast to be above average with 2.1% growth expected in 2017 and 2.4% in 2018 compared to an average between 2011 and 2016 of 1.1%. New supply is likely to continue to accelerate in selected cities outside London as developers take advantage of the buoyant market. In 2017 Provincial new supply is forecast to increase by another 10,400 rooms are potentially added and in 2018 by a further 12,000 rooms could be added. The branded budget chains remain dynamic catalysts of this growth accounting for over 40% of the UK active pipeline.

30
UK
Hot
els f
orec
ast 2
017/
2018
Cities with high pipelines for 2018 include Manchester, Belfast, and Glasgow with over 1,000 rooms in each city’s pipeline. Edinburgh is scheduled to see another 600 rooms open in the remainder of this year with the same number again in 2018. Liverpool welcomes 700 more new rooms in 2018 and Bath will get 450 new rooms in 2017 and 2018. Focusing on a few cities:
Manchester’s new supply includes a 212 room Crowne Plaza and 116 room Staybridge Suites on the Oxford Road and a four star 150 room Hilton Garden Inn at Old Trafford and a 137 room Dakota Deluxe Manchester.
Liverpool will see a new 5 star hotel in 2018, the Principal Liverpool (227 rooms).
In Edinburgh notable openings in 2017 include a 228 room Hampton by Hilton; a 157 room hub by Premier Inn at Rose Street and a 160 room Courtyard by Marriott; in 2018 a second hub opens at Haymarket (150 rooms) and a second Hampton by Hilton, this time at Edinburgh Airport (175 rooms).
Birmingham sees two independent four star, 170 room hotels open: the National Education & Conference Centre and the Hampton Grange Hotel & Conference Centre.
In Glasgow 2018 sees new additions in the budget segment comprise the 374 Motel One; the 180 room Moxy Glasgow and an 129 room Ibis Styles. Four star additions include a 4 star Radisson Red and a 175 room INNSIDE by Melia.
In Belfast the Titanic Hotel Belfast opens this year and in 2018 among others, includes Hastings Hotels opening the 304 room Grand Central Belfast as well as a 4 star 237 room Maldron Hotel Belfast City and a Hampton by Hilton Belfast.
A budget Z Hotels opens in Bath next year and in Bristol.
Figure 5: New above trend supply growth is forecastLondon spike expected in 2017 and 2018
Source: PwC; AMPM August 2017
% y
ear
on y
ear
net g
row
th
0.0%
1.0%
2.0%
3.0%
4.0%
5.0%
7.0%
6.0%
2011 2012 2013 2014 2015 2016 2017F 2018F
London
Average supply growth 2011 - 2016
Provinces
London
Regions

UK
Hot
els f
orec
ast 2
017/
2018
31
The National Football Museum, Manchester

32
UK
Hot
els f
orec
ast 2
017/
2018
PMSProperty
Management SystemAn internet-based system to facilitate the management
of a hotel.
GDSGlobal Distribution
SystemA network that passes
inventory and rates to OTAs.
WebsiteHotel Website
An internet-based reservation system managed
by the hotel.
Beating cyber crimeWhy Cyber Security is a necessity – not an amenity – for the hotel industryHotels and travel have become an increasing area of interest for hackers, nation states and political hacktivists. But how are they planning to attack and where should a hotel focus its security efforts in order to effectively protect its customers and its own information?
OTAsOnline Travel Agents
Internet-based reservation systems managed by
third parties.
Where is vulnerable?

33
UK
Hot
els f
orec
ast 2
017/
2018
People and processes Perhaps the perfect way to allow a hacker to gain system access is to rely on imperfect people and insecure processes. For example, front of house personnel may temporarily leave their terminal in an effort to meet a customer request. If the terminal was left unlocked, a clever attacker could use those few seconds to quickly extract sensitive information or install malware that continually feeds them information through manipulation of people and insecure processes.
Cyber criminals also often use malicious USB sticks to get into a PMS. Convincing a member of hotel staff to, say, print off a boarding pass is all
that it takes. Once the file is opened, it prompts the user to "enable macros". The document is then able to run malware on the computer. Depending on its sophistication, the malware can allow the attacker access to a wealth of sensitive information from across the entire PMS. A harmless process that looks like it is putting the customer first could actually be affecting the security of sensitive and personal customer data.
Lastly, hotel guests are not usually making security a primary purpose of their hotel stay. Guests carry in a wide range of technologies such as laptops, iPads and wearables each with different security
levels that can pose a serious risk to hotels. Business travellers often work on important and confidential information within a hotel next to a family that could care less about performing virus scans or updates on their children’s smart devices. Sharing a public network that does not have appropriate segregation with a wide range of users often makes it easy to identify a vulnerability, plan an attack and permeate a network. Attackers have also been known to leave items such as USB sticks containing malware laying around in public areas with the hope that someone will connect it to their computer and thus the hotel network. Unaware people are often the easiest targets.
Vulnerable through association – reliance on third partiesHotels often use a Global Distribution System (GDS) to pass information and rates to an online travel agent (OTA) in order to reach a wider market. Even at this early stage of marketing and reserving, hotels and their customers need to be aware of the cyber risks associated with passing their information on to be managed by third parties. Without appropriate segregation and security controls, an attacker could move laterally from the third party network to a hotel’s own systems and then perform further attacks. This type of cyber espionage campaign was
recently run by APT10 (a China – based threat actor) which targeted third party and managed service providers in an effort to gain access to their customer’s systems.
A hotel’s own website may be managed by a third party as well, and it is important that secure coding principles are used. Unmanaged vulnerabilities with a website could allow for an attacker to steal customer information and sell it on the dark web causing reputational damage and not to mention angry customers.
Lastly, not all hotel guests stay the night. Plenty of hotels offer other services through third parties such as great restaurants, bars, gyms and spas to bring in additional revenue, increase the spend from an overnight stay and create a certain ambience for the hotel. It is important to note that Property Management Systems (PMS) terminals do not only sit at the front desk, and this can increase the risk of a cyber-attack by having more accessible terminals if they are not managed and secured.
Other attack vectorsAnother possible path into the PMS is phishing attacks. Consider a member of the hotel finance team receiving a phishing email containing a malicious document. The document is an "invoice" that, when opened, installs ransomware onto the computer. If the hotel uses a flat network, i.e. one that is not properly segregated, this could spread to the hotel’s other systems.
Malicious hackers may also make false, or spoof, Wi-Fi networks to attack hotel guests. Most captive portals require guests to accept various Terms and Conditions. Attackers use this to trick their target into agreeing to trust a certificate that decrypts the internet traffic going through the spoof Wi-Fi network.
These are called Man-in-the-Middle attacks and allow the perpetrator to intercept all of the information being accessed or broadcasted by their target’s device. This includes emails, phone apps, communications coming to and from those apps, and other messages.
Who is targeting hotels?DarkHotel is a group of malicious hackers who use spear-phishing, infection and malware delivery techniques to attack business executives staying in hotels through the hotels’ in-house Wi-Fi networks. These criminals first infect the hotel’s network with spyware and wait for a high level target to check into a hotel. Using forged digital certificates, generated by factoring the underlying weak public keys of real certificates, they convince the target that prompted software downloads are valid. This installs malware onto the target’s computer
and enables the criminals to collect sensitive information, such as passwords and intellectual property. Finally, they erase the spyware from the hotel network to avoid getting caught.
Other organised crime groups such as Carbanak have shifted from attacking organisations with PCI data such as banks to less security sophisticated organisations such as the hotel industry. They run creative phishing campaigns acting as customers threatening a lawsuit or
looking to ask a question about a fake reservation. A file is sent over containing viruses or malicious code and the caller confirms that the file has been opened whilst on the phone.
Researchers recently have come to believe that a Russian military intelligence group known as “Fancy Bear” or APT28 sent spear phishing emails which installed malware on victims' systems when they clicked on a link or opened the attachment.
What is the cyber threat?
How can hotels respond to be more secure? Getting the basics right, increasing the priority of cyber security at the board level and improving your ‘human firewall’ will give hotels the upper hand in order to prevent, detect and respond appropriately to cyber-attacks. Some specific recommendations include:
As general awareness levels around cyber security and data privacy issues continue to rise, do not be surprised if this is something guests start to feed back to you as a priority. Hotel businesses that treat information security as a necessity and not an amenity will be the ones that maintain their reputation and success.
Invest in creating awareness of the latest threats and known vulnerabilities this industry faces is the best start to a proper defence.
Educate staff on these latest threats and strategies, and spend time training them on basic security good practices.
Build business processes that consider security controls in their design.
Invest in design a technical security architecture that limits the exposure of your business in the event of an attack.
Consider the use of common technologies that protect your most critical information.
Assessing if your third parties apply controls at a level commensurate to your organisation’s risk appetite is of vital importance.
Educate your guests on how they can protect themselves and their information online and in public areas.
1 2 3 4
5 6 7

Deal talk
UK
Hot
els f
orec
ast 2
017/
2018
34

35
UK
Hot
els f
orec
ast 2
017/
2018
2017 UK hotel deal activity is forecast to recover from the slowdown experienced in 2016 due to Brexit uncertainty.
The level of UK hotel deals stood at c. £2.3bn for the seven month period to end July 2017, up only 10% from previous year; but is estimated to reach c. £5.3bn by year end, primarily driven by the forecast completion of some current larger portfolio transactions. This would represent a 43% increase in volume compared to 2016 but would still be significantly lower compared to the record level of investment into UK hotels experienced in 2015.
There has been a strong correlation between deal activity and market performance growth over the past eight years, with deal volume only exceeding RevPAR growth in 2015, which had returned to normalised levels. We forecast this tracking of deal activity to RevPAR growth to continue into 2017 and 2018 with forecast volumes of £5.3bn and £4.8bn, representing year on year volume growth of +43% and -10%, respectively.
2016 Brexit uncertainty
Total UK hotel deal volume reached £3.7bn in 2016, over 60% down from the record £9.3bn in 2015. This decline was experienced across most UK real estate sub-sectors and was primarily driven by the uncertainty regarding the EU referendum and subsequent Brexit vote.
While some major deals had concluded in H1 2016 prior to the EU referendum, there was an immediate impact on deal activity following the vote, with H2 2016 deal volumes down 40% on H1 2016.
0
2
4
6
8
10
-12
-8
-4
0
4
8
12
201120102009200820072006 2012 2013 2014 2015 2016 2017 2018
Loan Portfolio Single Forecast RevPAR Growth (%)
Source: RCA, Dealgoic, AM:PM, PwC Analysis
Figure 6: UK Hotel Deal Volume
Deal Volume (£ billions) RevPAR Growth p. a. (%)

36
UK
Hot
els f
orec
ast 2
017/
2018
The highest value deals that concluded in H1 2016 prior to the EU referendum vote were portfolios Atlas Hotels (c. £530m) and Club Quarters, London (c. £180m); and single asset deals, all in London, the War Office hotel development (c. £350m), Hilton Wembley (c. £100m) and a 50% stake in the InterContinental O2 (c. £100m).
After the Brexit vote, the only large portfolio deal in H2 2016 was the 55 Travelodge freeholds (c. £196m); and single asset deals activity was focused in London, including the DoubleTree by Hilton, Tower of London (c. £300m) and a 50% stake in the Peninsula Hotel development (c. £108m).
Single asset deals have led 2017
Total deal volume in the seven month period ending July 2017 (at c. £2.3bn) was only 10% up on the equivalent seven month period last year, despite 2016 investment activity being impacted by the EU referendum. This was primarily due to a deficit of any significant portfolio deals concluding during this period, with total portfolio deal levels at only c. £0.2bn, the largest being three Mercure hotels (c. £87m), a sub-portfolio of the Hotel Collection group. Continuing uncertainty regarding the potential impact from the ongoing Brexit process has therefore had a negative impact on the UK hotel portfolio investment market, with vendors having to consider breaking up portfolios into single assets or smaller sub-portfolios, in order to attract sufficient interest at attractive prices.
Meanwhile, single asset deals remained more attractive to investors, making up over 91% of the total deal activity in the first seven months of 2017 (at c. £2.1bn). The larger single hotel deals were all London assets including the Grosvenor
House Hotel (c. £600m), Doubletree by Hilton Westminster (c. £190m) and Park Plaza Waterloo (c. £160m). Outside of London the larger single deals were in Manchester, including the Holiday Inn City Centre (c. £54m) and Lowry Hotel (c. £53m).
Total forecast for 2017 stronger than 2016
This time last year, 2017 was forecast to be a softer year in terms of deal volume and RevPAR growth compared to 2016. However, as a combination of both the stronger RevPAR growth actually experienced during this year, plus many of the larger deals that had been anticipated to close by the end of 2016 being delayed into this year, total 2017 deal volumes is now forecast to be around 43% higher than 2016.
Some of these larger deals delayed from the end of last year include the Grosvenor House Hotel (reported above), the recently completed London and Birmingham Hilton Metropole hotels deal (c. £500m) and the ongoing QHotels group deal (c. £520m).
Average transaction value per key has risen over the past 12 months, a trend which can also been seen amongst the listed hotel companies with UK exposure. There is, however, evidence emerging of a widening bid-ask spread, with potential investors on a number of recent transactions in the market indicating caution over valuation.
There are further portfolio transactions currently rumoured in the market including Jurys Inn, Saco Apartments and a portfolio of 10 Hilton hotels among others. Assuming completion of some of these portfolio deals, and continuing the current level of activity in single hotel
deals, we forecast a further c. £3.0bn of deals to complete in the last five months of the year, resulting in a forecast total deal volume of c. £5.3bn for 2017.
What to Expect for 2018?
We forecast both overseas inbound and domestic investment into the hotel sector to continue into 2018, with ongoing growth in hotel sector appetite from the more institutional and mainstream real estate investors.
It will be interesting to see the outcome of the current portfolio deals and whether vendor price expectations are achieved, and the impact this may have on the strategy for any future portfolio deals running into 2018. The longer term effect of the drive by China to limit foreign investment also remains to be seen, once any of the larger portfolio deals do return to market.
Considering these factors, combined with forecast slower RevPAR growth across the UK, we expect overall 2018 deal volumes to reach levels c.10% lower than the current year, at around £4.8bn.

37
UK
Hot
els f
orec
ast 2
017/
2018
Comparing current UK hotel investor appetite in this post-Brexit vote environment (for the seven months ending July 2017) to investment in a more normalised pre-Brexit vote year (the equivalent period in 2014), we can see that domestic investment has now increased to over 40% of the total UK deal value; symptomatic of the heightened level of single asset and smaller portfolio hotel deals.
However, despite the ongoing political and economic uncertainty surrounding the UK, overseas investors with potentially longer term investment horizons continued to be the most active, possibly taking advantage of the better value hotel prices driven by the weak sterling.
Apart from the significant Grosvenor House deal, investment from the US into the UK was very weak in 2017, signalling the switch in focus from the large pool of US private equity and hedge fund investors in 2014, to other European countries – especially the high-growth Southern Mediterranean and the safe haven German hotel investment markets.
There is also ongoing increased appetite from Asian investors that has now taken over from the Middle East investors who were active in 2014. With the restrictions imposed by the Chinese government aimed to curb the levels of foreign acquisitions, appetite is more limited from China compared to previous years, now being replaced with an influx of Singapore investors into the market.
What is noticeable is the heightened activity from property companies and real estate funds, now replacing the previous investment appetite by US based private equity and hedge funds into the UK hotel sector. From the insight published in PwC’s Emerging Trends in Real Estate Report (ETRE) Europe 2017, as summarised below, this is only to be expected given increased appetite for both hotels and serviced apartments by more mainstream real estate investors.
Hotel owner/operators are also taking advantage of the higher deal flow in smaller hotel assets, which can provide good bolt on opportunities to their growing estate.
0
10
20
30
40
50
70
90
100
80
Origin of investor (% share of value, by region)
60
Rest of the world
Europe
North America
Middle East
Asia
UK
2017 YTD2014
0
10
20
30
40
50
70
90
100
80
Type of investor (% share of value, by type)
60
Property company/Real Estate Fund
Sovereign Wealth
Private Equity/Hedge
Insurance and Pension Funds/Insitutional Asset Managers
Individual Investors/Private Wealth (inc. Family Offices)
Hotel operatorsand investors
2017 YTD2014
Source: RCA, Dealgoic, AM:PM, PwC Analysis
Figure 7: Where is investor appetite coming from?

38
UK
Hot
els f
orec
ast 2
017/
2018
Emerging Trends in Real Estate 2016-2017PwC’s Emerging Trends in Real Estate Report (ETRE) Europe 2017 (produced jointly with ULI) found that alternatives continued to dominate the list of sectors deemed to have the best prospects in 2017. Industry leaders do not simply want to watch from the side lines as alternatives thrive – with 44% now saying they would like to invest, an increase of 16 percentage points over the previous two years.
Importantly, this appears to be a secular rather than cyclical trend. During the last cycle, investors went into alternatives due to the yield premium over offices,
retail and logistics. Despite a number of players, particularly private equity firms, moving into alternatives because they were priced out of mainstream sectors, the search for higher yields in this low interest environment is now only the fourth most common rationale cited by interviewees, behind stable income returns, diversification and demographic drivers.
The growth in appetite for alternatives has been exacerbated further by concerns around rising inflation later in the cycle, which operating companies such as hotels typically track closer to than main stream real assets which typically have longer lease terms and less frequent rent reviews.
For those already active in alternatives, hotels lead the way, with interviewees expressing a preference for leased assets rather than those with a management contract, which tend to carry more operational risk. Of the respondents considering investing, developing or lending to alternatives in 2017, 51% favour hotels, second only to student housing.
Initial findings from the ETRE 2018 report (to be launched in Amsterdam on 1 November 2017) suggest appetite for hotels and serviced apartments has increased even further across the real estate sector since the 2017 report findings.
70 %
66 %of interviewees considered the investment prospects for hotels to be very good or good in 2017 up from
in 2016, with a similar trend being seen in serviced
apartments.
Hotels 2016
Hotels 2017
ServicedApartments 2017
ServicedApartments 2016
0%
5119
23
29
15
21
43
39 22
5 4
28 7
10
50 25 10
20% 40% 60% 80% 100%
Very PoorVery Good Good Fair Poor
Source: Emerging Trends in Real Estate: Europe 2016 and 2017, PwC and the Urban Land Institute
Figure 8: Sector investment prospects into hotels and serviced apartments

UK
Hot
els f
orec
ast 2
017/
2018
39

Appendices
Appendix 1 Annual hotel statistics for London and Provinces2015 – 2018 (F)
UK
Hot
els f
orec
ast 2
017/
2018
40
Actuals Forecast
London2015 2016 2017 2018
Occupancy 82% 81% 83% 83%
ADR (£) 143 139 145 148
RevPAR (£) 117 114 120 123
% change on previous year
Occupancy -1.0% -0.9% 2.3% 0.2%
ADR 2.2% -2.1% 3.6% 2.2%
RevPAR 1.2% -3.0% 6.0% 2.4%
Provinces2015 2016 2017 2018
Occupancy 76% 76% 76% 76%
ADR (£) 67 69 71 72
RevPAR (£) 51 52 54 55
% change on previous year
Occupancy 1.0% -0.3% 0.2% 0.3%
ADR 5.0% 3.3% 2.4% 2.0%
RevPAR 6.1% 3.0% 2.5% 2.3%
Econometric Forecasts: PwC August 2017 Benchmarking data: STR July 2017 Annual figures are based on unweighted quarterly averages

Appendix 2 Methodology for the forecasts
This section outlines in detail the PwC model used to forecast hotel occupancy, Average Daily Rate (ADR) and Revenue Per Available Room (RevPAR).
Data
Our hotels dataset provided by STR contained ADR, hotel room supply, demand and occupancy on a monthly basis. Macroeconomic variables such as GDP growth, unemployment and
CPI were obtained from the Office of National Statistics (ONS) and GDP data for key tourist markets were obtained from the OECD; and these were available on a quarterly basis.
Econometric model
We developed a two-stage least squares (2SLS) instrumental variables approach that projects hotel demand and price (ADR) using a two-stage process with the specifications set out in Table 1.
UK
Hot
els f
orec
ast 2
017/
2018
41
Table 1: Final specifications of the London and Provinces models
London Provinces
1st stage
Dependent variableGrowth in London hotel demand
Explanatory variables• Country-weighted GDP growth in the
previous year
• Growth in London ADR in the previous year
• London hotel demand in the previous quarter
• USD exchange rate in the previous quarter
• Quarterly dummies
Dependent variableGrowth in Provinces hotel demand
Explanatory variables• UK GDP growth
• Growth in Provinces ADR in the previous year
• Growth in demand in the previous year
• Quarterly dummies
2nd stage
Dependent variableGrowth in London ADR
Explanatory variables• Growth in London hotel demand
• Quarterly dummies
Dependent variableGrowth in Provinces ADR
Explanatory variables• Growth in Provinces hotel demand
• Growth in Provinces ADR in the previous year
• Quarterly dummies

42
UK
Hot
els f
orec
ast 2
017/
2018
Advantages of our econometric modelling approach
For the current forecasts, we conducted a literature review of academic research and tested several model specifications as part of an ongoing process to improve model performance. Based on our findings we used the two-stage least squares (2SLS) instrumental variables approach.
The 2SLS approach has several advantages, namely it does not require any distributional assumptions for explanatory variables, e.g. variables may take a binary or non-normal form. It is also computationally simple and allows the use of diagnostic testing procedures for problems such as heteroscedasticity, unit roots and specification error. In addition, the two-stage approach also allows us to estimate demand and price separately rather than projecting occupancy rates directly, recognising that these are driven by different factors.
However, the challenge of producing robust estimates using the 2SLS approach is the selection of “instruments” or variables that are sufficiently exogenous to price, but has an influence on hotel demand.
Our model specifications includes quarterly dummies, the lag of GDP growth, the lag of demand, the lag of price growth, and the lag of exchange rates as instruments. Results from the Hansen J statistic suggest that the instruments are exogenous and the model is valid at the 5% level. Equally, the t-tests in the first regression suggest that the variables are significant at the 5% level. This suggests that the instruments are both relevant and independent of the dependent variable.
Forecasts
Forecasts for ADR growth and hotel demand were generated using PwC forecasts of macroeconomic variables, supplemented by additional forecast data for hotel supply for London and the Provinces provided by AM:PM to produce forecasts for occupancy rates. Adjustments were made to ensure the comparability of STR and AM:PM data and an attrition factor was applied to simulate periodic drop-offs in rooms supply. RevPAR forecasts were constructed using ADR, demand and supply forecasts.
This model was used to generate forecasts through to Q4 2018, and these were generated separately for London and the provinces, with forecasts for the UK as a whole constructed from a weighted average of the London and Provinces forecasts. These weights were generated using the share of London and Provinces hotel room demand as a percentage of total (London + Provinces) demand.

UK
Hot
els f
orec
ast 2
017/
2018
43

44
UK
Hot
els f
orec
ast 2
017/
2018
44
UK
Hot
els f
orec
ast 2
017/
2018
ContactsDavid TrunkfieldUK Hospitality & Leisure Leader
T: +44 (0) 20 7804 6397E: [email protected]
Liz HallHospitality & Leisure Head of Research
T: +44 (0) 20 7213 4995E: [email protected]
Stephen BroomeSenior Hotels Consultant
T: +44 (0) 20 7212 8510E: [email protected]
Samantha WardUK Hotels Leader
T: +44 (0) 20 7212 2974E: [email protected]
Andrew SentanceSenior Economic Adviser
T: +44 (0) 20 7213 2068E: [email protected]
Philip A ShepherdPartner
T: +44 (0) 20 7804 9366E: [email protected]
Richard SnookSenior Manager, Macroeconomic Consulting Services
T: +44 (0) 20 7212 1195E: [email protected]
Beating Cyber Crime
Richard Horne Cyber Security Partner
T: +44 (0) 20 7213 3227E: [email protected]
James Rashleigh Director
T: +44 (0) 20 7212 2060E: [email protected]


www.pwc.comAt PwC, our purpose is to build trust in society and solve important problems. PwC is a network of firms in 157 countries with more than 208,000 people who are committed to delivering quality in assurance, advisory and tax services. Find out more and tell us what matters to you by visiting us at www.pwc.com/UK. This publication has been prepared for general guidance on matters of interest only, and does not constitute professional advice. You should not act upon the information contained in this publication without obtaining specific professional advice. No representation or warranty (express or implied) is given as to the accuracy or completeness of the information contained in this publication, and, to the extent permitted by law, PricewaterhouseCoopers LLP, its members, employees and agents do not accept or assume any liability, responsibility or duty of care for any consequences of you or anyone else acting, or refraining to act, in reliance on the information contained in this publication or for any decision based on it.
© 2017 PricewaterhouseCoopers LLP. All rights reserved. In this document, “PwC” refers to the UK member firm, and may sometimes refer to the PwC network. Each member firm is a separate legal entity. Please see www.pwc.com/structure for further details.
PWC100104A_HB_MISC_0917