uk offshore wind hse statistics - energy...
TRANSCRIPT

UK Offshore wind HSE statistics2014 report
www.g9offshorewind.com

ContentsIntroduction from the Chairman
2
Map of UK Offshore wind farm sites
3
List of the UK Offshore wind farm sites
4
2014 highlights 5
UK safety statistics for 2014 6
Incident data summary – incident area
7
Incident data summary – work process
9
Project and operation sites 10
Lost work day incidents 11
Top three risk analysis 12
Marine operations 12
Lifting operations 13
Operating plant and machinery 14
Annex A 15
Annex B 26
The primary aim of the G9 is to deliver world class health and safety performance in the offshore wind industry. To achieve this, senior executives of the G9 member companies have committed resources from their companies, and have also met under the auspices of the G9 Board, to actively lead the industry in finding solutions to the safety challenges faced by offshore wind projects throughout their life cycle, from design and development through construction and in operation.
Through the sharing and analysis of HSE incidents provided by G9 member companies, an evidence-based understanding has been developed of the risks encountered during the construction and operational phases of a wind farm project. This information is being used by the G9 to identify the risks in the offshore wind industry, allowing the group’s work to be focused in areas of high risk exposure.
About the G9 Offshore wind health and safety association

2
Introduction from the Chairman
Since 2000, there have been six leasing rounds of offshore wind which have increased in scale and complexity as the industry has developed. Leases for projects and programmes are associated with waters around England, Wales, Scotland and Northern Ireland. The UK is currently the global market leader in offshore wind with the largest amount of installed capacity in Europe. Through some of the largest infrastructure projects in the world, offshore wind can provide valuable jobs to local communities, as well as underpin the UK Government's commitment to renewable energy, a reduction in CO2 emissions and an increase in energy security.
The aim of the G9 Offshore Wind Health & Safety Association (G9) is to deliver world class health and safety performance in the offshore wind industry in the UK and internationally. Through the sharing and analysis of HSE incident data and information, an evidence-based understanding has been developed of the risks encountered during the development, construction and operational phases of an offshore wind farm. This analysis is being used by the G9 to identify the risks in the offshore wind industry, allowing the group's work to be focused in areas of high risk exposure.
I am delighted to see the publication of the UK Offshore wind HSE statistics 2014 report, which gives a comprehensive insight into the health and safety performance of UK offshore wind developers, including both G9 and non-G9 members. We are very grateful for the cooperation of non-G9 member companies, without which a UK statistics report would not have been possible. Published by the Energy Institute (EI) as a reference for offshore wind health and safety in the UK, we believe it will be a useful tool for industry to document the evolution and improvements in the sector's performance, and we are committed to publishing this report on an annual basis.
Within the G9, we will continue to strive to improve the health and safety performance of developers of offshore wind farms in the UK. It is our responsibility to ensure that the health and safety performance of our companies is continually improving and that this is understood and communicated to the wider industry and regulators.
Benj SykesChairman – G9 Offshore Wind Health and Safety AssociationHead of Asset ManagementDONG Energy Wind Power
UK Offshore wind HSE statistics 2014 report

UK Offshore wind HSE statistics 2014 report
Figure 1: UK Offshore wind farm sites
3
Map of UK Offshore wind farm sites
••
•••••••
•
•
••••••
••••••
•
•
••
•
•
•
•
•
•
•
•
•••
•

UK Offshore wind HSE statistics 2014 report
4
List of UK Offshore wind farm sites
Round one Round two Round three Round one and two extension sites
Scottish territorial waters
Barrow Dudgeon Dogger Bank Burbo Bank Extension BeatriceBeatrice Demo Greater Gabbard East Anglia Galloper (Greater Gabbard
Extension)Inch Cape*
Blyth Gunfleet Sands II Firth of Forth Kentish Flats II Extension Neart na Gaoithe*Burbo Bank Gwynt Y Mor Hornsea Walney III
Gunfleet Sands I Humber Gateway Moray FirthLynn & Inner Dowsing Lincs RampionKentish Flats London Array I Navitus BayNorth Hoyle London Array IIOrmonde Race BankRhyl Flats Sheringham ShoalRobin Rigg ThanetScroby Sands Triton KnollTeesside Walney I
Walney IIWestermost Rough
West of Duddon Sands
*These offshore wind farm sites did not supply incident data for this report.

UK Offshore wind HSE statistics 2014 report
5
Hazards 95
Near hits 546
First aid 59
Medical treatment injuries 49
Restricted work days 8
Lost work days 33
Lost Work Day
Restricted Work Day
Medical Treatment Injuries
First Aid
Near Hits
Hazards
2014 highlights
2014: key facts and figures
Key facts Work process
790 reported incidents 196 incidents during marine operations*
0 fatalities 107 lifting operations incidents
33 total lost work days 106 incidents occurred when operating plant and machinery
6 injuries to employees and contractors reported under RIDDOR Incident area
552 incidents occurred on operational sites 324 incidents occurred in the turbine region
218 incidents occurred on project sites 237 incidents occurred onshore
19 incidents occurred on survey sites 198 incidents occurred on vessels
Figure 2: 2014 incident severity summary
* Marine operations comprise the following work processes: maritime operations, transfer by vessel, vessel operations, vessel mobilisation.
UK Offshore wind HSE statistics 2014 report
6
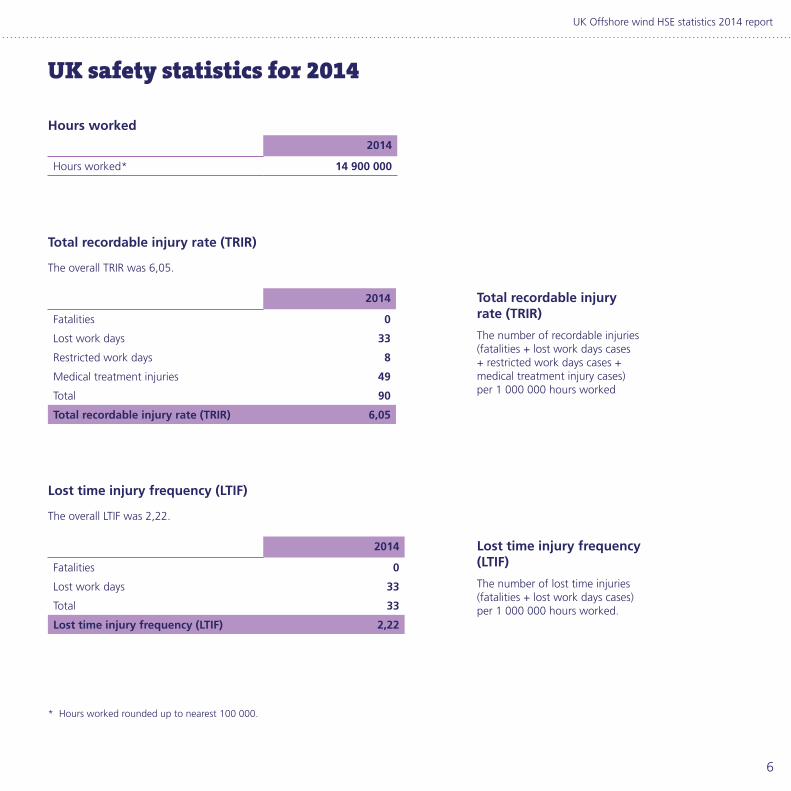
UK safety statistics for 2014
Hours worked2014
Hours worked* 14 900 000
Total recordable injury rate (TRIR)
The overall TRIR was 6,05.
2014
Fatalities 0
Lost work days 33
Restricted work days 8
Medical treatment injuries 49
Total 90
Total recordable injury rate (TRIR) 6,05
Lost time injury frequency (LTIF)
The overall LTIF was 2,22.
2014
Fatalities 0
Lost work days 33
Total 33
Lost time injury frequency (LTIF) 2,22
Total recordable injury rate (TRIR)
The number of recordable injuries (fatalities + lost work days cases + restricted work days cases + medical treatment injury cases) per 1 000 000 hours worked
Lost time injury frequency (LTIF)
The number of lost time injuries (fatalities + lost work days cases) per 1 000 000 hours worked.
* Hours worked rounded up to nearest 100 000.

UK Offshore wind HSE statistics 2014 report
Incident data summary – incident area
Figure 3: Incident area – summary
Areas where incidents occurred can be broadly categorised into five different categories (see Figure 3). Figures 4 – 6 show this breakdown in further detail.
Other 2 %
Onshore and offshore substation 2 %
Vessels 25 %
Onshore activity 30 %
Turbine 41 %
Figure 4: Incident area – turbine breakdown
0
20
40
60
80
100
120
LKJIHGFEDCBA
Access laddersA
B
C
D
E
F
G
H
I
J
K
Foundation external
Foundation internal
Helicopter hoisting and landing area
Hub and blades
Nacelle
Transition piece area
Turbine assembly area
Turbine tower
Turbine/substation outside
Yaw gear space
Key
Other
L
0
20
40
60
80
100
120
LKJIHGFEDCBA
Access laddersA
B
C
D
E
F
G
H
I
J
K
Foundation external
Foundation internal
Helicopter hoisting and landing area
Hub and blades
Nacelle
Transition piece area
Turbine assembly area
Turbine tower
Turbine/substation outside
Yaw gear space
Key
Other
L
7

UK Offshore wind HSE statistics 2014 report
8
Figure 5: Incident area – onshore activity breakdown
0
20
40
60
80
100
120
LKJIHGFEDCBA
Access roadsA
B
C
D
E
F
G
H
I
J
K
Administration
Boatlanding
Car park
Company vehicle
Excavations and civil works
Harbour, quay and pontoons*
Office
Public road/area
Storage
L Workshop
Warehouse
Key
* In 2014, one G9 member reported 100 incidents for the harbour quay and pontoons incident area (for further information on incident consequence see Annex A).
0
20
40
60
80
100
120
LKJIHGFEDCBA
Access roadsA
B
C
D
E
F
G
H
I
J
K
Administration
Boatlanding
Car park
Company vehicle
Excavations and civil works
Harbour, quay and pontoons*
Office
Public road/area
Storage
L Workshop
Warehouse
Key
Figure 6: Incident area – vessels breakdown
Vessels - small (<24 m) 68 %
Vessels - large (>24 m) 32 %

UK Offshore wind HSE statistics 2014 report
Incident data summary – work process
There were 26 different work processes where incidents occurred during 2014 (see Figure 7). For further information on the number of hazards, near hits, first aid incidents, medical treatment injuries, restricted work day and lost work day incidents see Annex A.
Figure 7: Work process – summary
* Marine operations comprise the following work processes: maritime operations, transfer by vessel, vessel operations, vessel mobilisation.
Asset damageA
B
C
D
E
F
G
H
Business travels
Catering/cleaning
Civil works
Diving operations
Facility management
Hot works
Lifting operations
Key
I
J
K
Manual handling
Marine operations
L Operating plant and machinery
Office work
Other
Replacing major components
Rigging/slinging
Surveys
M
N
O
P
Training/drills/team building events
Transfer by helicopter
Working at heights
Working in confined spaces
Working on energised systems
Working with chemicals and hazardoussubstances
Working with hand tools/power tools
Q
R
S
T
U
V
W
0
50
100
150
200
WVUTSRQPONMLKJIHGFEDCBA
9

UK Offshore wind HSE statistics 2014 report
10
Project and operation sites
Throughout 2014, incidents were classified as occurring in project, operation, survey sites or survey phase – these were defined as:
Project site: All stages of project (development, construction, commissioning).Operation site: Site in operation producing power. Survey phase: Development phase of project.
Breakdown of the incident data by site classification is shown in Figures 8 and 9.
Figure 8: Work process – project/operation site breakdown
Figure 9: Work process – project/operation site breakdown
* Marine operations comprise the following work processes: maritime operations, transfer by vessel, vessel operations, vessel mobilisation.
0
30
60
90
120
150
Prj PrjOps PrjOps PrjOps PrjOps Prj PrjOps PrjOps Prj OpsOps Prj Sur Ops Prj Sur
A B C D E F G H I J K
L
M
N
O
P
Q
R
S
T
U
Key
V
Operating plant and machinery
Other
Replacing major components
Rigging/slinging
Surveys
Training/drills/team building events
Transfer by helicopter
Working at heights
Working in confined spaces
Working on energised systems
Working with chemicals andhazardous substances
W Working with hand tools/power tools
A
B
C
D
E
F
G
H
I
J
K
Asset damage
Business travels
Catering/cleaning
Civil works
Diving operations
Facility management
Hot works
Lifting operations
Manual handling
Marine operations*
Office works
Sur
0
20
40
60
80
100
PrjOpsOpsPrjOpsOpsPrjOpsOpsOpsSurPrjOpsPrjOpsPrjOpsPrjOpsPrjOps
L M N O P Q R S T U V W
0
30
60
90
120
150
Prj PrjOps PrjOps PrjOps PrjOps Prj PrjOps PrjOps Prj OpsOps Prj Sur Ops Prj Sur
A B C D E F G H I J K
L
M
N
O
P
Q
R
S
T
U
Key
V
Operating plant and machinery
Other
Replacing major components
Rigging/slinging
Surveys
Training/drills/team building events
Transfer by helicopter
Working at heights
Working in confined spaces
Working on energised systems
Working with chemicals andhazardous substances
W Working with hand tools/power tools
A
B
C
D
E
F
G
H
I
J
K
Asset damage
Business travels
Catering/cleaning
Civil works
Diving operations
Facility management
Hot works
Lifting operations
Manual handling
Marine operations*
Office works
Sur

UK Offshore wind HSE statistics 2014 report
Lost work day incidents
In 2014, there were 33 lost work day incidents reported, including those which were reported under RIDDOR. 52 % (17) of lost work day incidents occurred on turbines and 33 % (11) on vessels. The highest number of lost work day incidents occurred during marine operations (11: 33 %) and manual handling (9: 27 %). See Figures 10 and 11.
Figure 10: Lost work day – incident area breakdown
Figure 11: Lost work day – work process breakdown
Turbine 52 %
Vessels 33 %
Onshore activity 15 %
0
2
4
6
8
10
12
JIHGFEDCBA
Catering/cleaningA
B
C
D
E
F
G
H
I
J
Civil works
Facility management
Lifting operations
Manual handling
Marine operations
Operating plant and machinery
Training/drills/team building events
Working at heights
Key
Working with hand tools/power tools
11
0
2
4
6
8
10
12
JIHGFEDCBA
Catering/cleaningA
B
C
D
E
F
G
H
I
J
Civil works
Facility management
Lifting operations
Manual handling
Marine operations
Operating plant and machinery
Training/drills/team building events
Working at heights
Key
Working with hand tools/power tools
Summary – breakdown by incident area and work process

UK Offshore wind HSE statistics 2014 report
12
Top three risk analysis: Marine operationsSummary – breakdown by incident area and work process
In 2014, the highest number of incidents occurred during marine operations (196), with 133 occurring on operational sites, 60 on project sites and three during the survey phase.
The majority of marine operations incidents occurred on the vessels themselves (136). 45 % of marine operations occurred during transfers by vessel, 33 % during maritime operations and 19 % during vessel operations.
Of the total number of incidents recorded, 66 % were classified as near hits and 18 % as hazards. There was a total of 11 incidents resulting in lost work days (see Figures 12, 13, and 14).
Figure 12: Marine operations – incident consequence
Figure 14: Marine operations – incident area breakdown
Hazards 18 %
Near hits 66 %
First aid 3 %
Medical treatment injuries 6 %
Restricted work days 1 %
Lost work days 6 %
0
20
40
60
80
100
120
SRQPONMLKJIHGFEDCBA
Access laddersA
B
C
D
E
F
G
H
I
J
K
Administration
Boatlanding
Car park
Excavations and civil works
Foundation external
Foundation internal
Harbour, quay and pontoons
Hub and blades
Nacelle
L
Office
Key
M
N
O
P
Q
R
S
Other
Storage
Substation work and cable areas
Transition piece area
Turbine tower
Turbine/substation outside
Vessels – large (>24 m)
Vessels – small (<24 m)
Figure 13: Marine operations – work process breakdown
Vessel operation 19 %
Vessel mobilisation 3 %
Maritime operations 33 %
Transfer by vessel 45 %
0
20
40
60
80
100
120
SRQPONMLKJIHGFEDCBA
Access laddersA
B
C
D
E
F
G
H
I
J
K
Administration
Boatlanding
Car park
Excavations and civil works
Foundation external
Foundation internal
Harbour, quay and pontoons
Hub and blades
Nacelle
L
Office
Key
M
N
O
P
Q
R
S
Other
Storage
Substation work and cable areas
Transition piece area
Turbine tower
Turbine/substation outside
Vessels – large (>24 m)
Vessels – small (<24 m)

UK Offshore wind HSE statistics 2014 report
Summary – breakdown by incident area and work process
In 2014, 107 incidents occurred during lifting operations. 82 incidents occurred on operational sites, 24 incidents occurring on project sites, one during the survey phase. 22 % of all incidents occurred on vessels. Excluding vessels, the majority of incidents which occurred during lifting operations occurred on the transition piece area (19 %) and turbine tower (16 %). There were two lost work day incidents which occurred during lifting operations and activities (see Figure 15 and 16).
Lifting operations
Figure 15: Lifting operations – incident consequence
Figure 16: Lifting operations – incident area breakdown
First aid 2 %
Near hits 81 %
Hazards 11 %
Medical treatment injuries 3 %
Restricted work days 1 %
Lost work days 2 %
0
5
10
15
20
25
PONMLKJIHGFEDCBA
Excavations and civil worksA
B
C
D
E
F
G
H
I
J
K
Foundation external
Foundation internal
Harbour, quay and pontoons
Hub and blades
Nacelle
Storage
Substation work and cable areas
Transition piece area
Turbine assembly area
L Turbine/substation outside
Turbine tower
Key
Vessels – large (>24 m)
Vessels – small (<24 m)
Warehouse
Workshop
M
N
O
P
13

UK Offshore wind HSE statistics 2014 report
Summary – breakdown by incident area and work process
In 2014, there were 106 incidents which occurred during plant and machinery operation. The majority of these incidents took place on operational sites (92 incidents) with the remaining 14 incidents occurring on project sites.
22 % of all incidents which occurred whilst operating plant and machinery occurred on harbour, quay and pontoons, 18 % on the turbine tower and 13 % on the nacelle. 86 % of incidents reported were classified as near hits, and there were two lost work day incidents (see Figures 17 and 18).
Operating plant and machinery
Figure 17: Operating plant and machinery – incident consequence
Figure 18: Operating plant and machinery – incident area breakdown
Hazards 4 %
Near hits 85 %
First aid 7 %
Medical treatment injuries 2 %
Lost work days 2 %
0
5
10
15
20
25
SRQPONMLKJIHGFEDCBA
Key
Access laddersA
B
C
D
E
F
G
H
I
J
K
Administration
Car park
Foundation external
Foundation internal
Harbour, quay and pontoons
Hub and blades
Met mast
Nacelle
Storage
L Substation work and cable areas
Substation HV areas (> 1000 V)
Transition piece area
Turbine assembly area
Turbine tower
Turbine/substation outside
Vessels – large (>24 m)
Vessels – small (<24 m)
Workshop
M
N
O
P
Q
R
S
14

UK Offshore wind HSE statistics 2014 report
Annex A
Table A1: Incident summary – incident category and area – all sites
Incident category and area Hazards Near hits First aid Medical treatment injuries Restricted work days Lost work days Total
Onshore activity 26 172 20 12 2 5 237Access roads 5 5Administration 10 1 1 1 13Boatlanding 1 9 1 11Car park 6 1 1 8Company vehicle 1 1 2Excavations and civil works 10 1 1 12Harbour, quay and pontoons 16 83 3 4 2 3 111Office 5 13 11 1 30Public road/area 2 3 5Storage 1 14 15Warehouse 3 7 1 11Workshop 12 1 1 14Onshore and offshore substation 2 11 1 14Substation HV areas (>1 000 V) 1 3 4Substation work and cable areas 1 8 1 10Other 1 11 3 2 17Kitchen and canteen 1 1 2Met mast 1 2 3Other 8 2 2 12Turbine 35 221 28 20 3 17 324Access ladders 13 1 3 1 18Foundation external 1 8 1 10Foundation internal 5 1 6Helicopter hoisting and landing area 1 3 1 5Hub and blades 11 1 1 13Nacelle 10 41 13 6 1 5 76Other 1 1Transition piece area 8 35 5 1 49Turbine assembly area 8 1 2 1 2 14Turbine tower 8 83 2 6 7 106Turbine/substation 5 11 1 1 18Yaw gear space 2 3 2 1 8Vessels 31 131 8 14 3 11 198Vessels – large (>24 m) 8 42 2 7 2 3 64Vessels – small (<24 m) 23 89 6 7 1 8 134 Total 95 546 59 49 8 33 790
15

UK Offshore wind HSE statistics 2014 report
16
Table A2: Incident area – operations sites
Incident category and area Hazards Near hits First aid Medical treatment injuries Restricted work days Lost work days Total
Onshore activity 24 138 13 5 1 2 183Access roads 2 2Administration 6 1 1 8Boatlanding 8 1 9Car park 5 1 6Company vehicle 1 1Excavations and civil works 2 1 3Harbour, quay and pontoons 15 74 3 1 1 1 95Office 5 13 5 1 24Public road/area 2 2Storage 1 11 12Warehouse 3 5 1 9Workshop 11 1 12Onshore and offshore substation 8 1 9Substation HV areas (>1 000 V) 2 2Substation work and cable areas 6 1 7Other 1 1 2Kitchen and canteen 1 1Met mast 1 1Turbine 26 180 21 9 1 10 247Access ladders 8 8Foundation external 6 1 7Foundation internal 5 1 6Helicopter hoisting and landing area 1 3 1 5Hub and blades 10 1 1 12Nacelle 10 32 10 4 1 2 59Other 1 1Transition piece area 5 33 4 42Turbine assembly area 4 1 5Turbine tower 5 68 2 6 81Turbine/substation outside 5 9 1 1 16Yaw gear space 2 2 1 5Vessels 12 83 4 4 1 7 111Vessels – large (>24 m) 1 14 1 1 17Vessels – small (<24 m) 11 69 4 3 1 6 94Total 63 410 38 19 3 19 552

UK Offshore wind HSE statistics 2014 report
Table A3: Incident area – projects sites
Incident category and area Hazards Near hits First aid Medical treatment injuries Restricted work days Lost work days Total
Onshore activity 2 32 6 7 1 3 51Access roads 3 3Administration 4 1 5Boatlanding 1 1 2Car park 1 1 2Company vehicle 1 1Excavations and civil works 7 1 8Harbour, quay and pontoons 1 9 3 1 2 16Office 5 5Public road/area 1 1 2Storage 3 3Warehouse 2 2Workshop 1 1 2Onshore and offshore substation 2 3 5Substation HV areas (>1 000 V) 1 1 2Substation work and cable areas 1 2 3Other 10 3 1 14Kitchen and canteen 1 1Met mast 2 2Other 8 2 1 11Turbine 9 41 7 11 2 7 77Access ladders 5 1 3 1 10Foundation external 1 2 3Hub and blades 1 1Nacelle 9 3 2 3 17Transition piece area 3 2 1 1 7Turbine assembly area 4 2 1 2 9Turbine tower 3 15 2 4 1 25Turbine/substation outside 2 2Yaw gear space 2 1 3Vessels 15 38 4 10 1 3 71Vessels – large (>24 m) 3 19 2 6 1 1 32Vessels – small (<24 m) 12 19 2 4 2 39Total 28 124 20 29 4 13 218
17

UK Offshore wind HSE statistics 2014 report
Table A4: Incident area – survey sites
Incident category and area Hazards Near hits First aid Medical treatment injuries Restricted work days Lost work days Total
Onshore activity 1 1 2Excavations and civil works 1 1Office 1 1Other 1 1Other 1 1Vessels 4 10 1 1 16Vessels – large (>24 m) 4 9 1 1 15Vessels – small (<24 m) 1 1Total 4 11 1 1 1 1 19
Table A5: Incident area – other sites
Incident category and area Near hits Total
Onshore activity 1 1Public road/area 1 1Total 1 1
18

UK Offshore wind HSE statistics 2014 report
Table A6: Incident summary – work process – all sites
Work process Hazards Near hits First aid Medical treatment injuries Restricted work days Lost work days Total
Asset damage 1 1Business travels 8 1 2 11Catering/cleaning 1 4 3 1 9Civil works 30 4 2 36Diving operations 5 5Facility management 32 79 5 5 1 2 124Hot works 1 1Lifting operations 12 87 2 3 1 2 107Manual handling 3 10 9 6 2 9 39Maritime operations 14 40 2 6 3 65Office work 5 8 1 14Operating plant and machinery 4 90 8 2 2 106Other 3 1 5 9Replacing major components 9 9Rigging/slinging 3 1 4Surveys 3 19 2 3 1 28Training/drills/team building events 3 1 1 5Transfer by helicopter 1 2 3Transfer by vessel 15 60 5 7 87Vessel mobilisation 5 1 6Vessel operation 6 25 5 1 1 38Working at heights 3 46 7 3 1 2 62Working in confined spaces 2 1 3Working on energised systems 9 9Working with chemicals and hazardous substances 1 1 1 3Working with hand tools/power tools 1 4 1 6Total 95 546 59 49 8 33 790
19

UK Offshore wind HSE statistics 2014 report
Table A7: Work process– operations sites
Work process Hazards Near hits First aid Medical treatment injuries Restricted work days Lost work days Total
Business travels 4 1 5Catering/cleaning 1 3 2 1 7Civil works 6 1 1 8Diving operations 2 2Facility management 30 71 5 2 1 109Lifting operations 7 72 1 1 1 82Manual handling 10 6 3 1 3 23Maritime operations 11 24 2 2 39Office work 5 3 1 9Operating plant and machinery 2 79 8 1 2 92Other 1 1 2Replacing major components 7 7Rigging/slinging 2 2Surveys 2 2Training/drills/team building events 3 1 1 5Transfer by helicopter 1 2 3Transfer by vessel 7 51 5 5 68Vessel mobilisation 5 5Vessel operation 18 2 1 21Working at heights 3 35 5 1 2 46Working in confined spaces 2 1 3Working on energised systems 5 5Working with chemicals and hazardous substances 1 1 1 3Working with hand tools/power tools 1 3 4 Total 63 410 38 19 3 19 552
20

UK Offshore wind HSE statistics 2014 report
Table A8: Work process– projects sites
Work process Hazards Near hits First aid Medical treatment injuries Restricted work days Lost work days Total
Asset damage 1 1Business travels 3 1 1 5Catering/cleaning 1 1 2Civil works 24 3 1 28Diving operations 3 3Facility management 2 8 3 1 1 15Hot works 1 1Lifting operations 5 14 1 3 1 24Manual handling 3 3 3 1 6 16Maritime operations 3 16 2 4 25Office work 4 4Operating plant and machinery 2 11 1 14Other 2 1 4 7Replacing major components 2 2Rigging/slinging 1 1 2Surveys 8 2 2 12Transfer by vessel 8 9 2 19Vessel mobilisation 1 1Vessel operation 5 6 3 1 15Working at heights 11 2 2 1 16Working on energised systems 4 4Working with hand tools/power tools 1 1 2Total 28 124 20 29 4 13 218
Table A9: Work process– surveys sites
Work process Hazards Near hits First aid Medical treatment injuries Restricted work days
Lost work days
Total
Lifting operations 1 1Maritime operations 1 1Office work 1 1Surveys 3 9 1 1 14Vessel operation 1 1 2Total 4 11 1 1 1 1 19
Table A10: Work process– other sites
Work process Near hits Total
Business travels 1 1
Total 1 1
21

UK Offshore wind HSE statistics 2014 report
Table A11: Lost work days breakdown by incident area and work process
Total
Catering/cleaning 1Nacelle 1Civil works 2Hub and blades 1Vessels – large (>24 m) 1Facility management 2Turbine tower 2Lifting operations 2Harbour, quay and pontoons 1Turbine tower 1Manual handling 9Harbour, quay and pontoons 2Nacelle 3Turbine assembly area 2Turbine tower 2Maritime operations 3Vessels – large (>24 m) 2Vessels – small (<24 m) 1Operating plant and machinery 2Foundation internal 1Nacelle 1Training/drills/team building events 1Administration 1Transfer by vessel 7Transition piece area 1Vessels – small (<24 m) 6Vessel operation 1Vessels – small (<24 m) 1Working at heights 2Turbine tower 2Working with hand tools/power tools 1Workshop 1Total 33
22

UK Offshore wind HSE statistics 2014 report
Table A12: Marine operations breakdown by incident area and consequence
Incident area Hazards Near hits First aid Medical treatment injuries Restricted work days Lost work days Total
Access ladders 1 1Administration 1 1Boatlanding 1 5 1 7Car park 1 1Excavations and civil works 1 1Foundation external 1 1 2Foundation internal 1 1Harbour, quay and pontoons 6 17 23Hub and blades 1 1Nacelle 3 3Office 3 3Other 2 2Storage 1 1Substation work and cable areas 1 1Transition piece area 7 1 8Turbine tower 3 3Turbine/substation outside 1 1Vessels – large (>24 m) 4 12 5 1 2 24Vessels – small (<24 m) 21 71 6 5 1 8 112Total 35 130 7 11 2 11 196
23

UK Offshore wind HSE statistics 2014 report
Table A13: Lifting operations breakdown by incident area and consequence
Incident area Hazards Near hits First aid Medical treatment injuries Restricted work days Lost work days Total
Excavations and civil works 1 1Foundation external 1 1Foundation internal 1 1Harbour, quay and pontoons 1 12 1 1 15Hub and blades 2 2Nacelle 3 9 1 1 14Storage 2 2Substation work and cable areas 2 2Transition piece area 4 17 21Turbine assembly area 2 1 3Turbine tower 1 15 1 17Turbine/substation outside 1 1 2Vessels – large (>24 m) 1 13 1 15Vessels – small (<24 m) 1 6 1 8Warehouse 1 1Workshop 2 2Total 12 87 2 3 1 2 107
24

UK Offshore wind HSE statistics 2014 report
Table A14: Operating plant and machinery breakdown by incident area and consequence
Incident area Hazards Near hits First aid Medical treatment injuries Lost work days Total
Access ladders 2 2Administration 4 1 5Car park 1 1Foundation external 1 1Foundation internal 1 1 2Harbour, quay and pontoons 1 21 1 23Hub and blades 4 1 5Met mast 1 1Nacelle 2 6 4 1 1 14Storage 2 2Substation HV areas (>1 000 V) 2 2Substation work and cable areas 4 4Transition piece area 1 3 1 5Turbine assembly area 2 1 3Turbine tower 19 19Turbine/substation outside 4 4Vessels – large (>24 m) 3 3Vessels – small (<24 m) 4 4Workshop 6 6Total 4 90 8 2 2 106
25

UK Offshore HSE wind statistics 2014 report
Annex B
The following incident consequence definitions have been used in the G9 incident data:
Fatality Incident that involves one or more people who died as a result of a work-related incident or occupational illness. 'Delayed' deaths that occur after the incident are to be included if the deaths were a direct result of the incident.
Lost work day Non-fatal incident that involves a person being unfit to perform any work on any day after the occurrence of the occupational injury. 'Any day' includes rest days, weekend days, leave days, public holidays or days after ceasing employment.
Restricted work day Incident that does not result in a fatality or a lost work day but does result in a person being unfit for the full performance of the regular job on any work on any day after the occurrence of the occupational injury.
Medical treatment injury Those incidents not severe enough to be reported as fatalities, lost work day incidents or restricted work days incidents but are more severe than requiring simple first aid treatment.
First aid An injury which requires simple medical treatment that is self-administered or by a first aider, doctor or nurse, but does not result in lost time or long-term medical care.
Near hit A near hit is any incident which could have resulted in a work-related accident but did not, either by chance or timely intervention.
Hazard A hazard is a condition or a situation where there is a potential to cause an incident.
The following statistical definitions have been used in the G9 incident data analysis:
Total recordable injury rate The number of fatalities, lost work days, restricted work days and other medical treatment injuries requiring treatment by a medical professional per million hours worked.
Lost time injury frequency The number of fatalities and lost work day injuries per million hours worked.
(TRIR)
(LTIF)
26

UK Offshore wind HSE statistics 2014 report
Copyright © 2015 by the Energy Institute, London.The Energy Institute is a professional membership body incorporated by Royal Charter 2003.Registered charity number 1097899, EnglandAll rights reserved
No part of this booklet may be reproduced by any means, or transmitted or translated into a machine language without the written permission of the publisher.
ISBN 978 0 85293 743 3
Published by the Energy Institute
The information contained in this publication is provided for general information purposes only. Whilst the Energy Institute and the contributors have applied reasonable care in developing this publication, no representations or warranties, express or implied, are made by the Energy Institute or any of the contributors concerning the applicability, suitability, accuracy or completeness of the information contained herein and the Energy Institute and the contributors accept no responsibility whatsoever for the use of this information. Neither the Energy Institute nor any of the contributors shall be liable in any way for any liability, loss, cost or damage incurred as a result of the receipt or use of the information contained herein.
Further copies can be obtained from: Energy Institute, 61 New Cavendish Street, London W1G 7AR, UK. t: +44 (0)20 7467 7100 e: [email protected]
Front cover image courtesy of London Array Limited.
Published by:
61 New Cavendish StreetLondon W1G 7AR, UK
t: +44 (0)20 7467 7100e: [email protected]
www.energyinst.orgwww.energyinst.orgFollow us: @EnergyInstitute
Join us: Energy Institute
www.energyinst.orgFollow us: @EnergyInstitute
Join us: Energy Institute
9780852937433