ukraine market industry - business views · 2020-04-16 · israel australia germany netherlands...
TRANSCRIPT

INFORMATION
TECHNOLOGYINDUSTRY
�IN UKRAINE
IMPACT ON ECONOMY
GLOBAL IT MARKETS
IT CONSUMPTION
IT EXPORTS
UKRAINE MARKET
INFOGRAPHIC ATLAS / 2017
© Top Lead LLC. All rights reserved

INTRODUCTION
MEDIA
PRINTED MEDIA MOBILE DATA
FIXED DATA
HARDWARE
SOFTWARE
SERVICES FIXED VOICE
MOBILE VOICE
ТV
RADIO
DIGITAL COMMUNICATIONS
TELECOMIT
ТМТICTWHY WE CREATED THIS REPORT
Information technology (IT) is a tool for the development of a modern economy.IT is capable of accelerating economic development. It can play the same role today as steam engines, the discovery of electricity and the automation of production did in previous epochs.IT is a relatively new and complex industry. Despite its relatively recent appearance, the IT industry has already become the essence of a modern digital economy. It promotes the emergence of new products and services and adds value to existing offers.This report explores the nature of the IT industry and describesits impact on business and the economy. We will also look at the Ukrainian IT market and its place on the global map.
REPORT SCOPE
In traditional market analysis, IT is part of broader technology, media and telecommunications sector (TMT). In this report, we will focus solely on Information and Telecommunications Technology (ICT).It is important to distinguish between the IT industry and the telecommunications industry. We focus on the IT market, but we have not overlooked the telecommunications industry because it plays the same role as roads in the transport industry.In this edition of the report, we have decided not to include the media industry due to a lack of reliable sources and established methodology.
HOW IT MARKET IS ARRANGED
HOW TO READ THIS REPORT
We depicted the IT industry from both global and domestic markets point of view.The latter shows the cost of information technology (in this report, we use the term "IT consumption", based on IDC methodology).This report shows IT consumption in its entirety
or by segment: hardware, software, services.Since we take data on consumption, exports and outsourcing volumes from different sources (IDC, World Bank Group, KPMG), the information may vary in different infographics despite overlapping segmentation.This is due to different methodologies and understandings of the market.
In the first section, we explore information technology, but we show exports generally in terms of ICT due to the lack of specific data for the IT sector.
Report analytical partner: IDC
2

WHY THIS IS IMPORTANT

INDUSTRIAL REVOLUTIONS KEY FACTORS, INSTRUMENTS, CONSEQUENCES AND OPPORTUNITIES
What’s appeared Steam engineRailwaysMechanized productionTransport �
Industrial enterprisesElectric networksMass production of goods��
ElectronicsRobots on productionInformation Technology Industry
INDUSTRIAL CAPITALISM MASS PRODUCTION AUTOMATED MANUFACTURING DIGITAL ECONOMY
Steam energy Electricity Computers and code Information and data
Integral high-performance ecosystem of data collection, analysis and application
PRODUCTIONTOOL
CONVEYER CYBER-PHYSICAL SYSTEMS
0,95 1,3 2,5 6,1
1000 1500
1 2 9
GDP in $ according to PPPper capita (2011 prices)
GDP in $ trillion for PPP (2011 prices)
Key professional ENGINEER MANAGER PROGRAMMER CHIEF DIGITAL OFFICER
Impact of the technology
MAIN ASSET
KEY TECHNOLOGY
Population, billion
The speed of delivery of goodsEfficiency of production
Mass production of goods Automation of productionReduction of the cost of mass production
Increase in the value of intangible assets in relation to material assets
MACHINE COMPUTERS AND ELECTRONICS
MANUFACTURING FACILITIES BRAND INFORMATION
END OF XVIII CENTURY
SECOND HALF OF XIX CENTURY
MIDDLE OF THE XX CENTURY
THE BEGINNING OF THE XXI CENTURY
INDUSTRY 1.0 INDUSTRY 2.0 INDUSTRY 3.0 INDUSTRY 4.0GDP PER CAPITA
POPULATION
Over the past 200 years, the size of the world economy has increased in 110 times. At the same time, GDP per capita has grown only 14 times.
Technology is the primary factor driving economic growth.
The use of electricity created an industrial model for the economy. Computers have promoted the creation of a service economy. Data progress has caused the so-called Industrial Revolution 4.0 and serves as the basis of the digital economy.
SERVICES69%
INDUSTRIES27%
AGRICULTURE4%
3600 10300
63
WORLD GDP2016, $112 trillion for PPP
According to IDC and TOP LEAD. Indicators of economic status and population courtesy of World Bank
4
RESOURCES AND TERRITORY

DIGITAL ECONOMY TECHNOLOGIES KEY TECHNOLOGIES TO INFLUENCE ECONOMY
2018-2020 рр. — estimatedAccording to Atos 2016, CB Insights. 2018-2020 forecast
Advanced Data VisualizationBiometrics
Digital SignageNFC
2018 2019+201720162000
WebRTCIn-memory computingCloud Service Integration
Open Source HardwareIPv6
Insight PlatformsSemantic TechnologiesDeep Learning
Edge computingTrusted DevicesLPWAN
Fabric-Based ComputingVirtual AssistantsContext Broker
BlockchainWearable ComputingNatural User InterfasesWeb-scale computing
Artificial IntelligenceAutonomos VehiclesInternet of Everything3D Printing
Distributed Social NetworksWireless PowerPlastic TransistorsLocation-Based Services NG
Ubiquitous PIM
Self-Adaptive SecurityPrivacy-Enhancing TechnologiesImmercive ExperienceSDx
BiocomputerSwarm Computing5GMemristorsExascale
Smart MachinesAdvanced RoboticsBrain-Computer InterfaseGenetic Engineering
LOW
AVERAGE
LEVEL OF INFLUENCE ON THE ECONOMY
HIGH
ECONOMIC TRANSFORMATION
The digital economy is characterized by a large number of new technologies that increase efficiency by introducing new business models and creating new markets.
This visualization shows the technologies that will have the greatest impact on the economy of the future.
The ranking indicates the level of potential impact on the economy - from minimal to an impact that transforms individual markets and the economy as a whole.
A digital economy is an economy in which virtual (non-physical) assets and transactions have the greatest value.
5
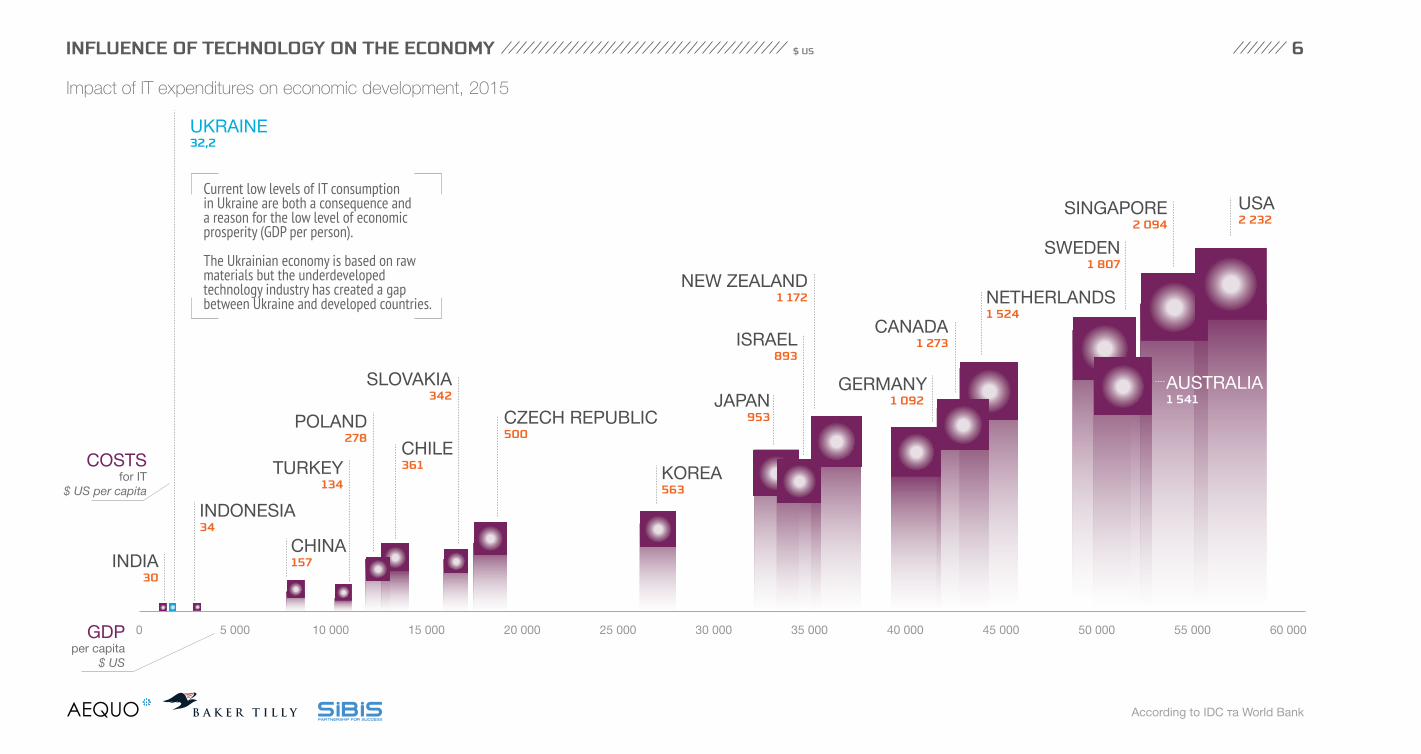
INFLUENCE OF TECHNOLOGY ON THE ECONOMY $ US 6
0 5 000 10 000 15 000 20 000 25 000 30 000 35 000 40 000 45 000 50 000 55 000 60 000
Current low levels of IT consumption in Ukraine are both a consequence and a reason for the low level of economic prosperity (GDP per person).
The Ukrainian economy is based on rawmaterials but the underdeveloped technology industry has created a gap between Ukraine and developed countries.
GDPper capita
$ US
UKRAINE32,2
CHILE361
INDONESIA34
CHINA157
SLOVAKIA342
POLAND278
INDIA30
TURKEY134
COSTSfor ІТ
$ US per capita
According to IDC та World Bank
SINGAPORE2 094
USA2 232
SWEDEN1 807
CANADA1 273
NEW ZEALAND1 172
ISRAEL893
JAPAN953CZECH REPUBLIC
500
GERMANY1 092
AUSTRALIA1 541
NETHERLANDS1 524
KOREA563
Impact of IT expenditures on economic development, 2015
ІТ GLOBAL IT MARKET
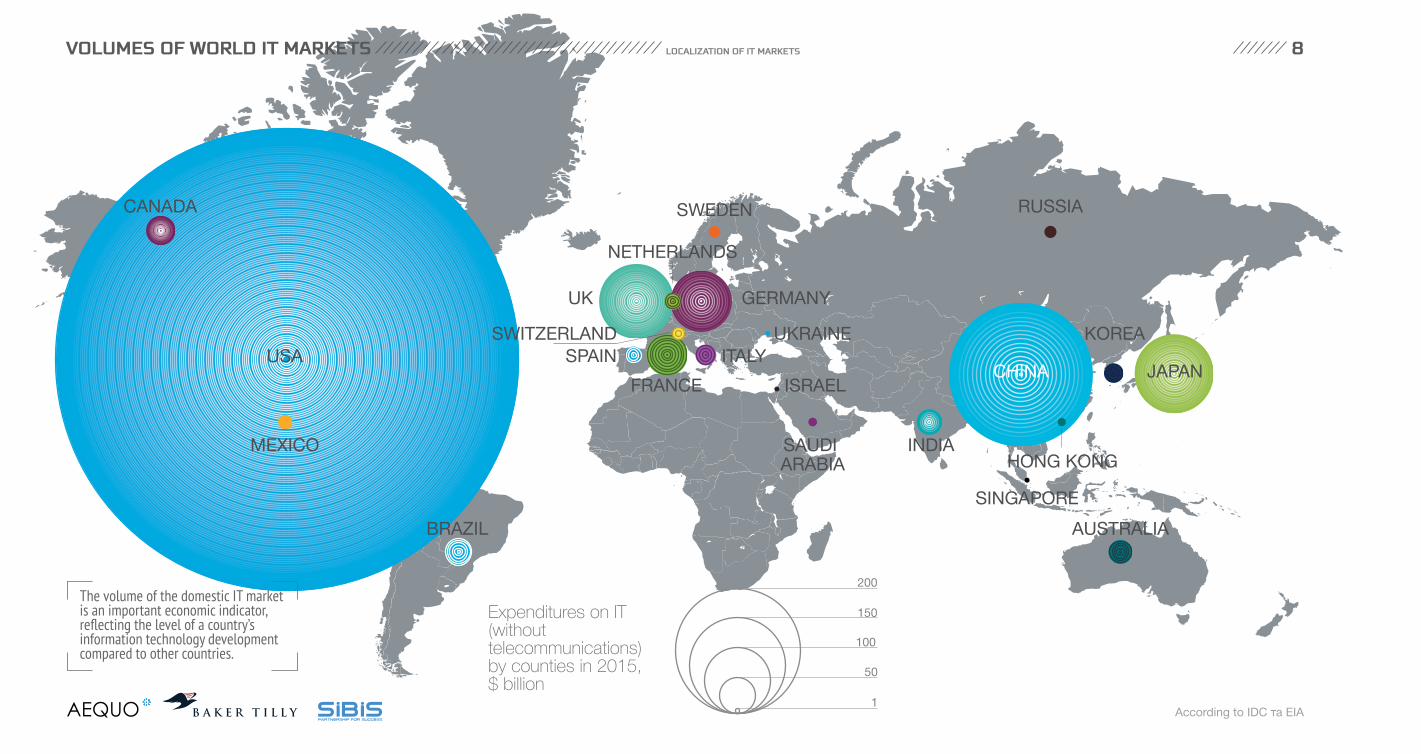
VOLUMES OF WORLD IT MARKETS 8
According to IDC та EIA
LOCALIZATION OF IT MARKETS
USA
MEXICO
CHINA
HONG KONG
SINGAPORE
RUSSIASWEDEN
UK
CANADA
BRAZIL
INDIASAUDI ARABIA
ISRAEL
AUSTRALIA
GERMANY
NETHERLANDS
FRANCE
ITALYSWITZERLAND UKRAINE
SPAINKOREA
JAPAN
Expenditures on IT (without telecommunications) by counties in 2015, $ billion
The volume of the domestic IT marketis an important economic indicator, reflecting the level of a country’s information technology development compared to other countries.
200
150
100
50
1
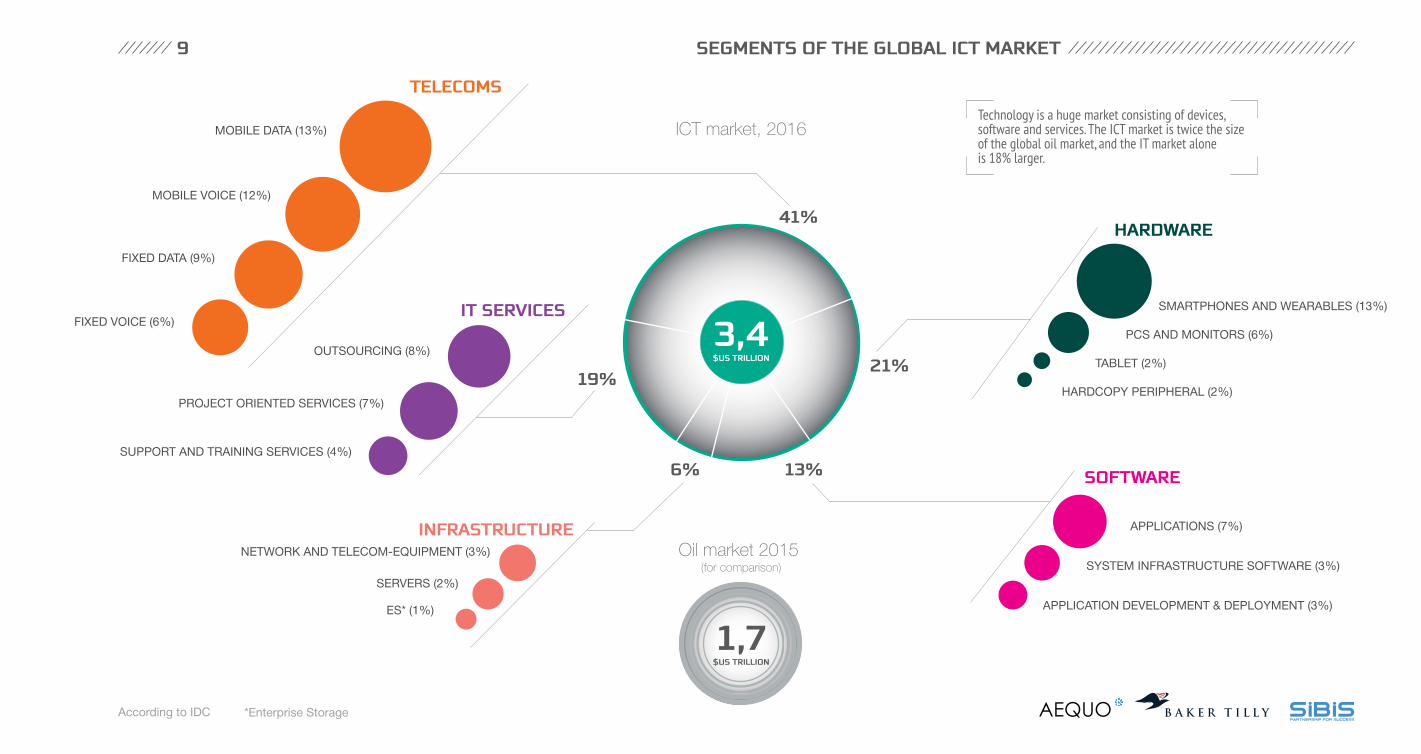
9 SEGMENTS OF THE GLOBAL ICT MARKET
41%
21%
6% 13%
19%
ІТ SERVICES
TELECOMS
HARDWARE
SOFTWARE
INFRASTRUCTURE
MOBILE DATA (13%)
MOBILE VOICE (12%)
FIXED DATA (9%)
FIXED VOICE (6%)
OUTSOURCING (8%)
PROJECT ORIENTED SERVICES (7%)
SUPPORT AND TRAINING SERVICES (4%)
NETWORK AND TELECOM-EQUIPMENT (3%)
SERVERS (2%)
ES* (1%)
SMARTPHONES AND WEARABLES (13%)
PCS AND MONITORS (6%)
TABLET (2%)
HARDCOPY PERIPHERAL (2%)
APPLICATIONS (7%)
SYSTEM INFRASTRUCTURE SOFTWARE (3%)
APPLICATION DEVELOPMENT & DEPLOYMENT (3%)
3,4$US TRILLION
Technology is a huge market consisting of devices, software and services. The ICT market is twice the size of the global oil market, and the IT market alone is 18% larger.
1,7$US TRILLION
Oil market 2015 (for comparison)
ICT market, 2016
*Enterprise Storage According to IDC

UKRAINIAN IT MARKET EXPORTS

ICT SERVICES EXPORTS11
114GERMANY
3,1MOROCCO
0,01LESOTHO
98,1FRANCE
177,8USA
№21 №32 №33 №34 №73
№1 №2 №3 №4 №5
16,3POLAND
3,9COSTA RICA
3,2UKRAINE*
105,1INDIA**
125UK
$ US BILLION
Ukraine in comparison with other countries of the world, $ US billion, 2016
PLACE IN THE WORLD
** information for 2015* Source mobilunity.comAccording to World Bank

12
Dynamics of ICT exports from Ukraine,$ US billion
The structure of IT services exports from Ukraine
19951994 1996 1997 1998 1999 2000 2001 2002 2003 2004 2005 2006 2007 2008 2009 2010 2011 2012 2013 2014 2015 2016*
0,5 0,4 0,5 0,6 0,3 0,4 0,4 0,3 0,4 0,5 0,7 0,81,1
1,72,3 2,1
3,23,8
4,35,0
4,53,9
3,2
According to World Bank * Source mobilunity.com
UKRINIAN ICT SERVICES EXPORTS
80% of Ukrainian IT exports are to USA
Ukraine is a relatively small player in the IT export market (IT + Telecom).For example, the volume of Polish ICT exports is 5 times higher than Ukrainian.
31% - ICT EXPORT SHAREIN THE EXPORT SERVICES SECTOR IN 2015
EXPORT OF OTHER SERVICES
IT OUTSOURCING
13
According toStatista, KMPG, Hackerrank, At Kearney, Oxford Internet Institute
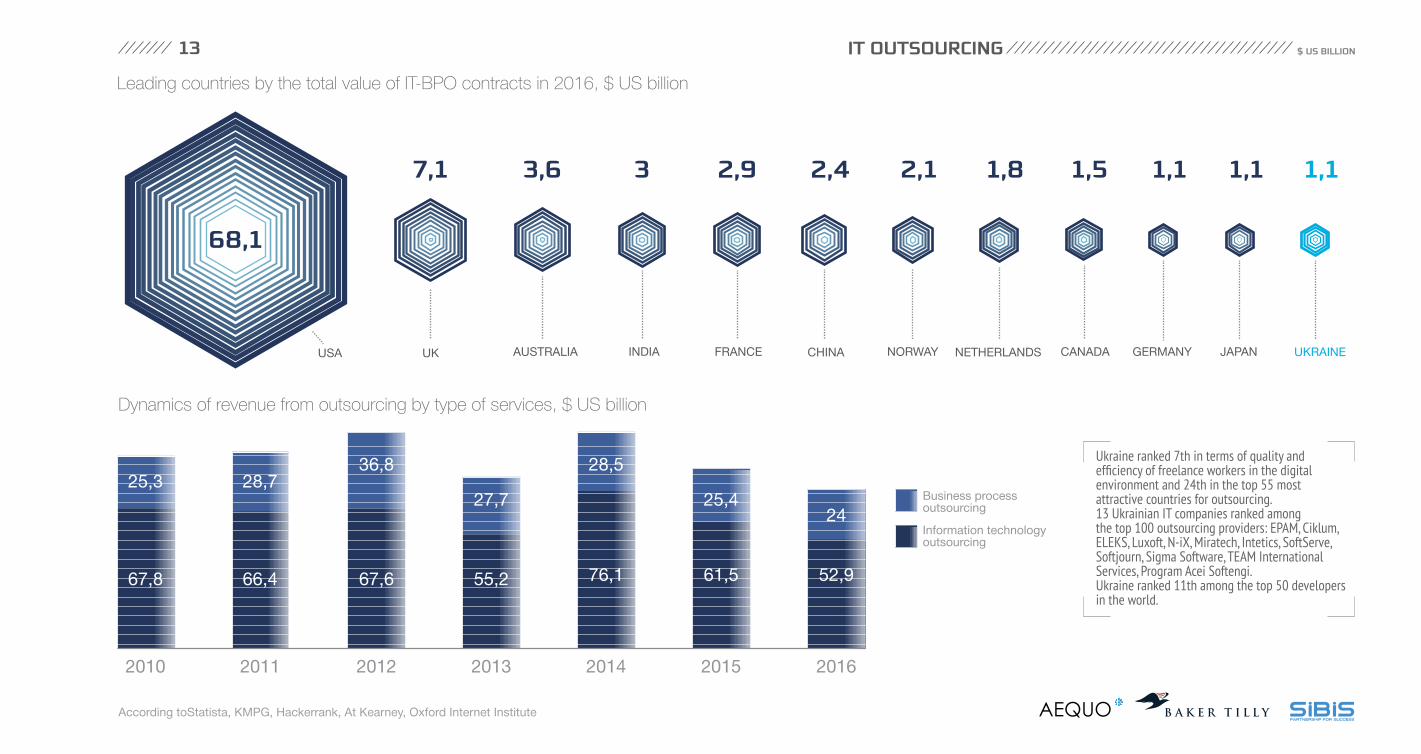
Leading countries by the total value of IT-BPO contracts in 2016, $ US billion
68,1
2,1
NORWAY
1,8
NETHERLANDS
1,5
CANADA
1,1
GERMANY
1,1
UKRAINE
1,1
JAPAN
7,1 3,6
AUSTRALIA
3
INDIA
2,9
FRANCE
2,4
CHINAUSA UK
Ukraine ranked 7th in terms of quality and efficiency of freelance workers in the digital environment and 24th in the top 55 most attractive countries for outsourcing.13 Ukrainian IT companies ranked among the top 100 outsourcing providers: EPAM, Ciklum, ELEKS, Luxoft, N-iX, Miratech, Intetics, SoftServe, Softjourn, Sigma Software, TEAM International Services, Program Acei Softengi.Ukraine ranked 11th among the top 50 developersin the world.
Dynamics of revenue from outsourcing by type of services, $ US billion
$ US BILLION
25,3
67,8 66,4 67,6 55,2 76,1 61,5 52,9
28,736,8 28,5
25,424
27,7
2010 2011 2012 2013 2014 2015 2016
Information technology outsourcing
Business processoutsourcing

DOMESTIC IT MARKETS
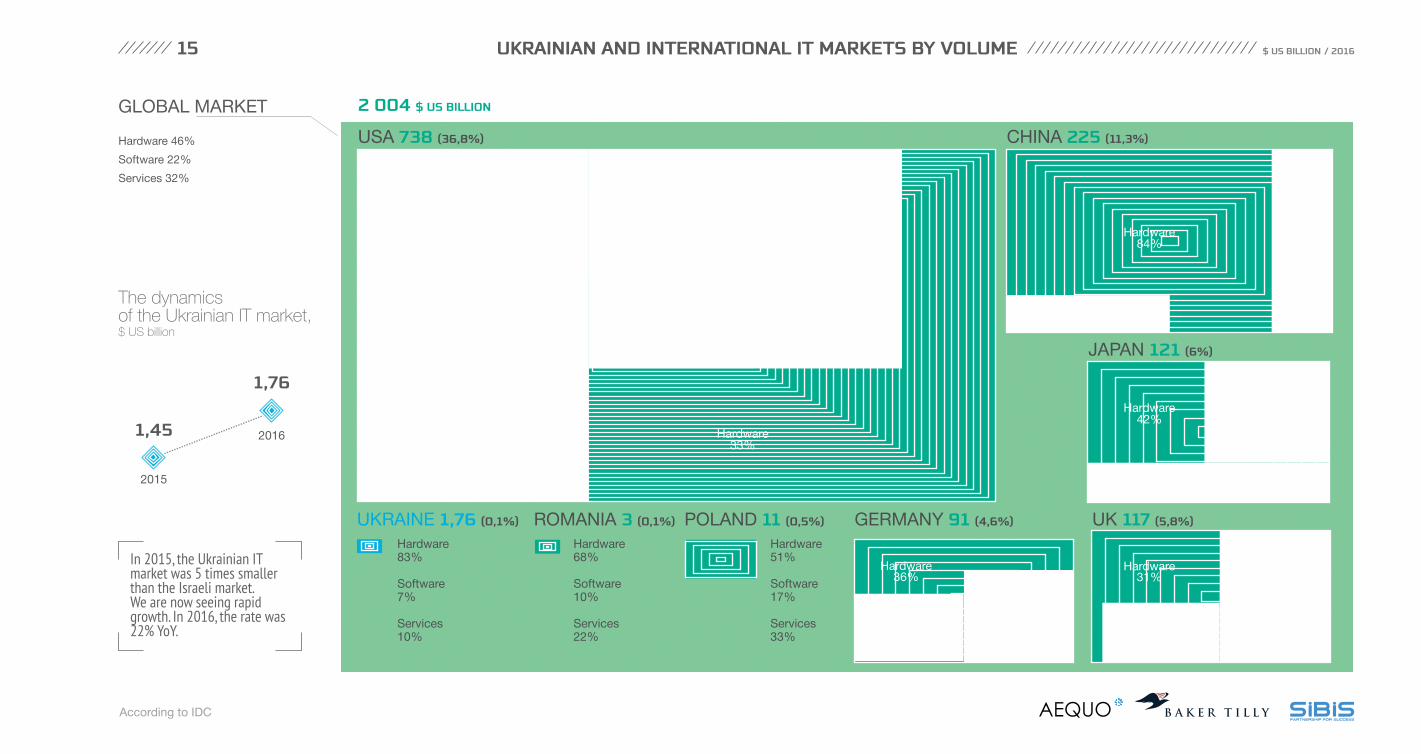
UKRAINIAN AND INTERNATIONAL IT MARKETS BY VOLUME 15 $ US BILLION / 2016
According to IDC
Hardware 46%
Software 22%
Services 32%
GLOBAL MARKET
UKRAINE 1,76 (0,1%)
Hardware33%
Software31%
Services36%
CHINA 225 (11,3%)
Hardware84%
Software6%
Services11%
GERMANY 91 (4,6%)
Hardware36%
Software27%
Services37%
POLAND 11 (0,5%)
Hardware51%
Software17%
Services33%
Hardware68%
Software10%
Services22%
Hardware83%
Software7%
Services10%
ROMANIA 3 (0,1%)
USA 738 (36,8%)
2 004 $ US BILLION
Hardware31%
Software22%
Services46%
UK 117 (5,8%)
Hardware42%
Software20%
Services38%
JAPAN 121 (6%)
2016
2015
1,45
1,76
The dynamics of the Ukrainian IT market, $ US billion
In 2015, the Ukrainian IT market was 5 times smallerthan the Israeli market. We are now seeing rapid growth. In 2016, the rate was22% YoY.

UKRAINE ON THE GLOBAL HARDWARE MARKET $ US BILLION
2006 2009 2010 2011 2012 2013 2014 2015 2016 2017* 2018 2019 20202007 2008
....
....
....
....
....
....
....
..
3,4
1,9
3,3
3,5 3,4 3,5
2,0
1,2
1,5
1,7 1,7 1,8
1,84,24,5
647761
927 994
....
....
....
....
....
....
....
..
GLOBALMARKET
$ US billion
UKRAINIANMARKET
$ US billion
DYNAMICSof the Ukrainian
hardware market$ US billion
16
Hawdware is the largest part of Ukrainian IT imports, but its volume is barely noticeable on the global scale.
According to IDC * evaluation 2018-2020 рр. — forecast
(selected years)
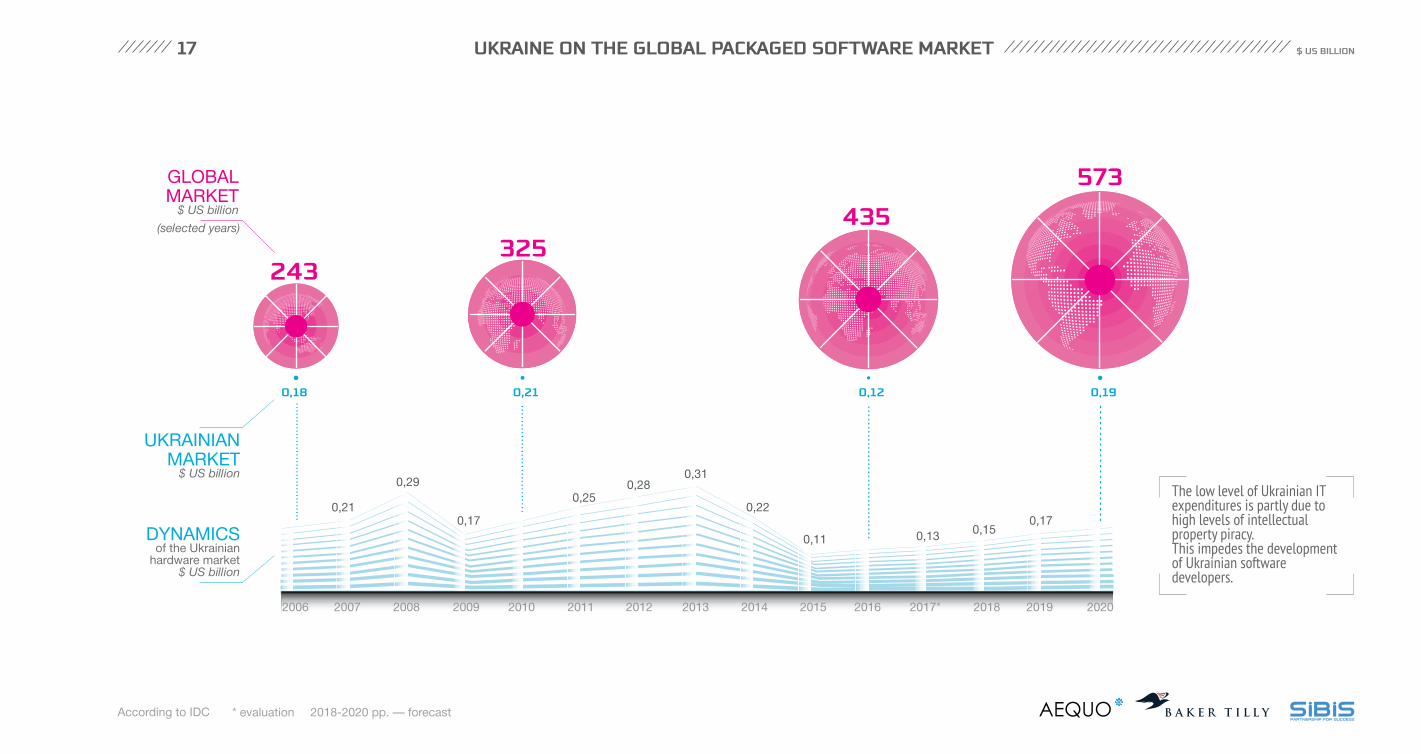
UKRAINE ON THE GLOBAL PACKAGED SOFTWARE MARKET $ US BILLION
2006 2009 2010 2011 2012 2013 2014 2015 2016 2017* 2018 2019 20202007 2008
......
......
......
......
......
.....
....
....
....
....
....
....
....
.
.................................
......................
243325
435
573
0,18
0,21
0,29
0,17
0,21
0,250,28
0,31
0,22
0,12
0,13 0,150,17
0,19
GLOBALMARKET
$ US billion
UKRAINIANMARKET
$ US billion
DYNAMICSof the Ukrainian
hardware market$ US billion
The low level of Ukrainian IT expenditures is partly due to high levels of intellectual property piracy.This impedes the development of Ukrainian software developers.
0,11
(selected years)
17
2018-2020 рр. — forecast* evaluationAccording to IDC
2018-2020 рр. — forecast
18
According to IDC * evaluation
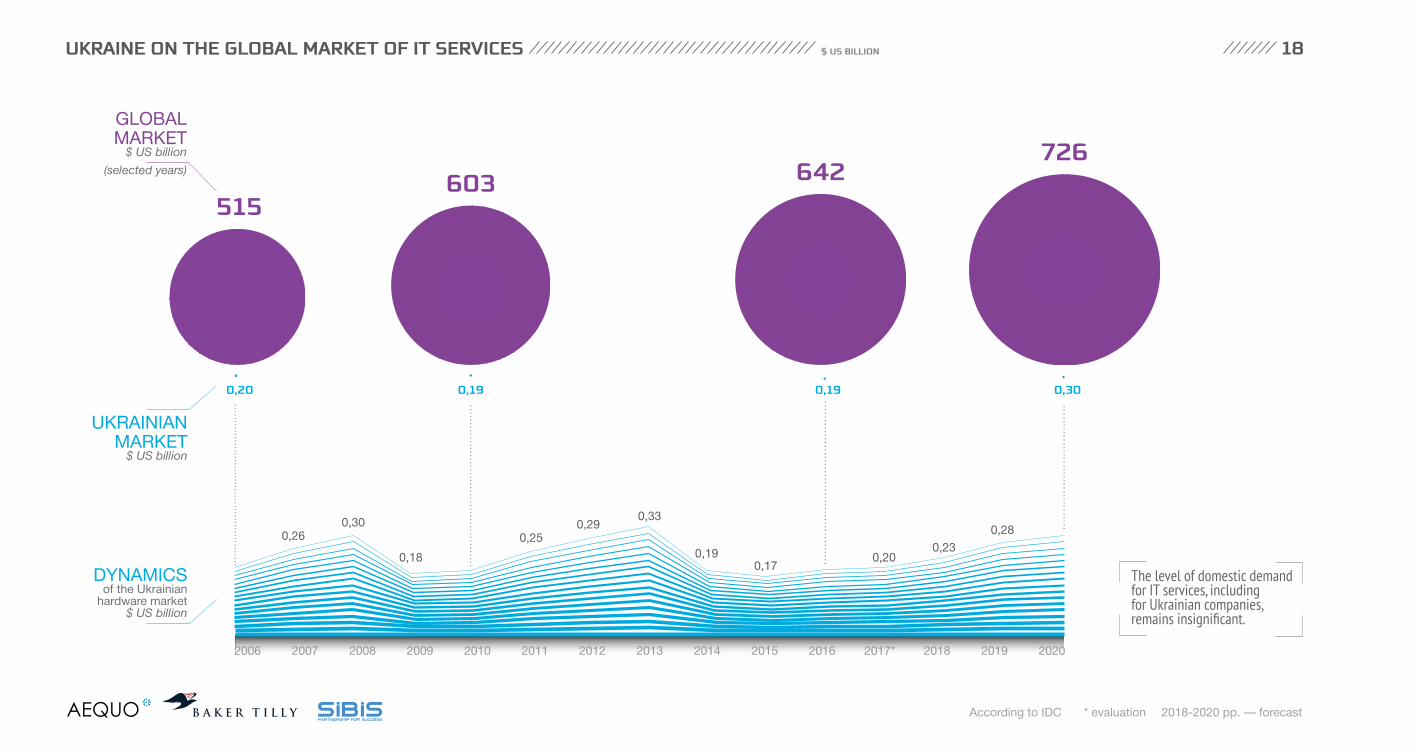
The level of domestic demandfor IT services, including for Ukrainian companies, remains insignificant.
UKRAINE ON THE GLOBAL MARKET OF IT SERVICES $ US BILLION
2006 2009 2010 2011 2012 2013 2014 2015 2016 2017* 2018 2019 20202007 2008
....
....
....
....
....
....
....
....
....
....
....
....
..
....
....
....
....
....
....
....
....
....
....
....
..
....
....
....
....
....
....
....
....
....
....
....
.
....
....
....
....
....
....
....
....
..
515603 642
726
0,20
0,18
0,19
0,250,29
0,33
0,190,17
0,19
0,200,23
0,28
0,30
0,260,30
GLOBALMARKET
$ US billion
(selected years)
UKRAINIANMARKET
$ US billion
DYNAMICSof the Ukrainian
hardware market$ US billion

DOMESTIC IT MARKETS
Bankingand Financial
Sector9%
Government and education49%
Communications (telecoms)-23%
Others34%
Services (incl. for business)10%
Process Manufacturing(including metallurgy, food
and chemical industry)-4%
Retail and Wholesale-10%
Transportation101%
Discrete Manufacturing (including engineering, electronics, automotive, aircraft construction and shipbuilding)14%Utilities1%
INDUSTRY SHARE OF IT CONSUMPTION AS %
35% 16%
12% 11%
7%6% 6%
3%
3%
2%
Telecom Services
Hardware
Services
Packaged software
1,85
1,46
0,19
0,12
The volume of the Ukrainian ICT market in 2016, $ US billion Structure of IT consumption by industry in Ukraine, 2016
According to IDC
The financial and public sectors are the largest consumers of technologies in Ukraine.
%, DYNAMICS COMPARINGTO THE PREVIOUS YEAR
19

IT MARKET SHARE BY REGION
REGIONAL SHARE OF IT CONSUMPTION
8%
3%6%
6%
6%
5%
5%
4%3%
3%
3%
3%
3%
3%
3%
3%2%
2%2%
2%
2%
2%
2%
2%
17%Kyiv
20
According to IDC
The largest consumers of IT services on the domestic market are the largest industrial regions of Ukraine.
Regional share of IT consumption in b2c segment, %
n.a.17 8 6 5 4 3 2

TELECOM

UKRAINE ON THE GLOBAL TELECOM SERVICES MARKET $ US BILLION
......
......
......
......
......
......
......
....
....
....
....
....
....
....
....
....
....
....
....
....
....
....
...
......
......
......
......
......
......
......
......
......
......
.....
2006 2009 2010 2011 2012 2013 2014 2015 2016 2017* 2018 2019 20202007 2008
4,24,4
4,8
3,1
3,8 3,8 3,8
2,8
1,7 1,9 2,1 2,3
3,2 1,9 2,5
1431 1367 1420
1118
22
Due to the fall of the hryvniaand the reduction of tariffs, the profits of Ukrainian telecom operators dropped by around 50% whilethe number of users increased.
GLOBALMARKET
$ US billion
(selected years)
UKRAINIANMARKET
$ US billion
DYNAMICSof the Ukrainian
hardware market$ US billion
2018-2020 рр. — forecastAccording to IDC * evaluation
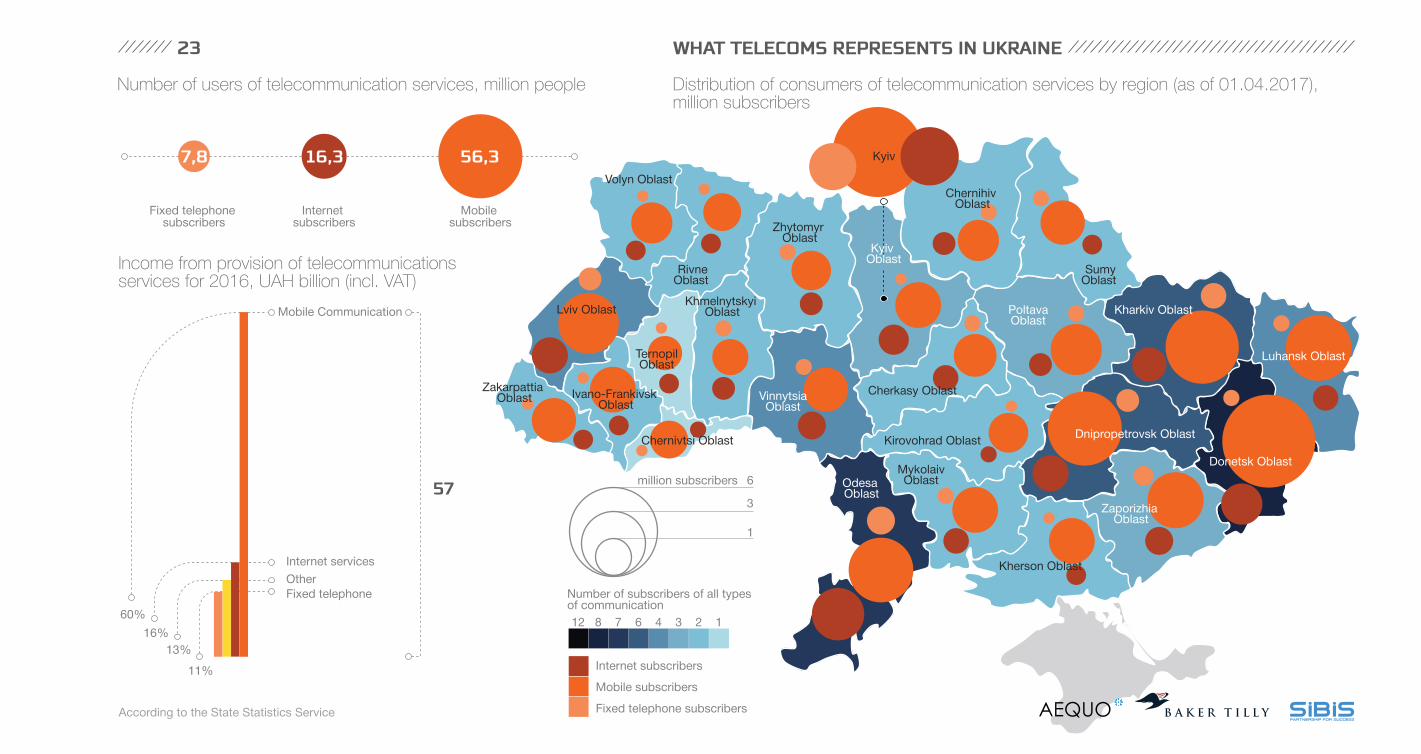
WHAT TELECOMS REPRESENTS IN UKRAINE23
60%
16%
13%
11%
Mobile Communication
Mobile subscribers
Mobile subscribers
Internet subscribers
Internet subscribers
Fixed telephone subscribers
Fixed telephone subscribers
Internet services
OtherFixed telephone
57
Одеська
Number of users of telecommunication services, million people Distribution of consumers of telecommunication services by region (as of 01.04.2017), million subscribers
Income from provision of telecommunications services for 2016, UAH billion (incl. VAT)
7,8 16,3 56,3
3
6million subscribers
Number of subscribers of all types of communication
1
12 8 7 6 4 3 2 1
Vinnytsia Oblast
Zhytomyr Oblast
Zaporizhia Oblast
Kirovohrad Oblast
Mykolaiv Oblast Odesa
Oblast
PoltavaOblast
Rivne Oblast
Kharkiv Oblast
Kherson Oblast
Khmelnytskyi Oblast
Chernihiv Oblast
Donetsk Oblast
Luhansk Oblast
Volyn Oblast
Lviv Oblast
Ternopil Oblast
Ivano-Frankivsk Oblast
Zakarpattia Oblast
Chernivtsi Oblast Dnipropetrovsk Oblast
Sumy Oblast
Cherkasy Oblast
Kyiv Oblast
Kyiv
According to the State Statistics Service
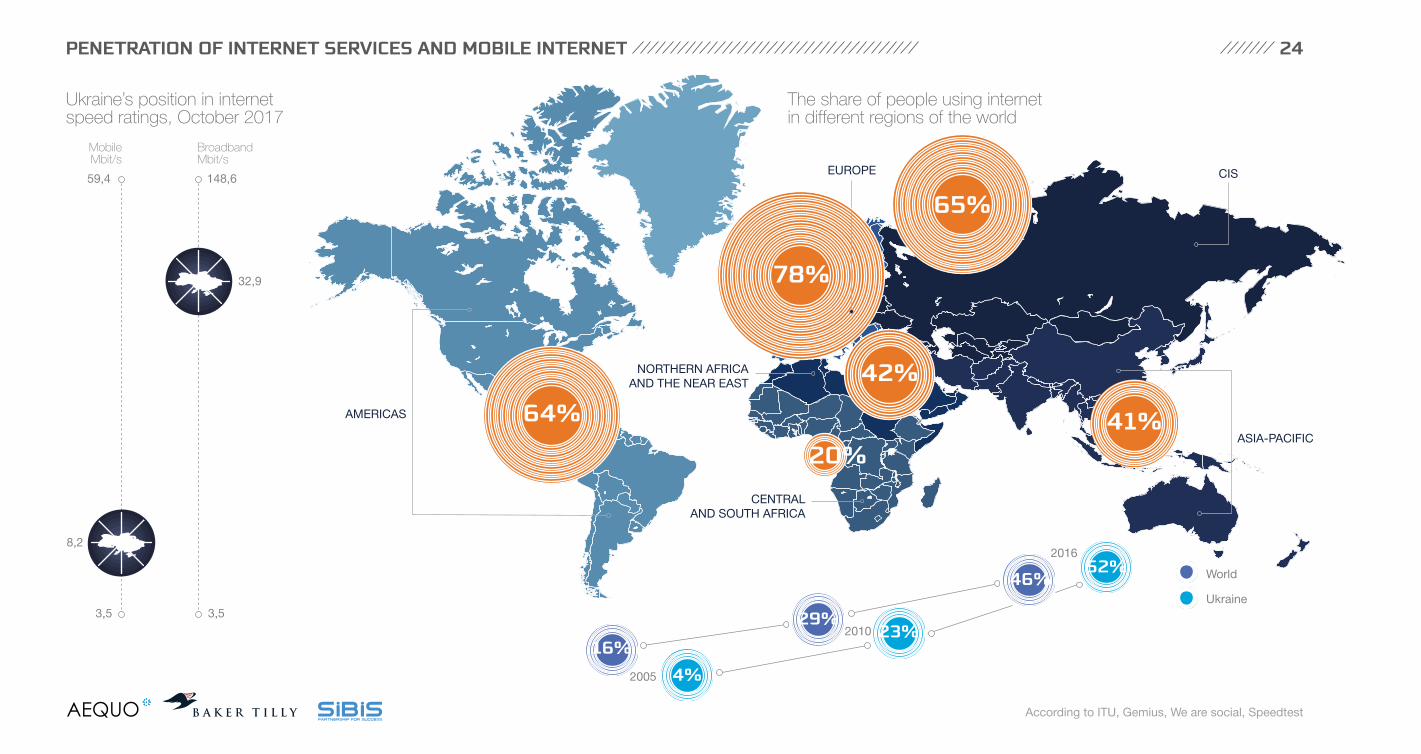
PENETRATION OF INTERNET SERVICES AND MOBILE INTERNET 24
The share of people using internet in different regions of the world
16%4%
29%23%
46%52%
2005
2010
2016
Ukraine
World
64%
78%
20%
42%
41%
65%
3,5
8,2
59,4
110
3,5
32,9
148,6
42
Ukraine’s position in internet speed ratings, October 2017
MobileMbit/s
BroadbandMbit/s
AMERICAS
CENTRALAND SOUTH AFRICA
EUROPE CIS
ASIA-PACIFIC
NORTHERN AFRICAAND THE NEAR EAST
According to ITU, Gemius, We are social, Speedtest

HOW TECHNOLOGIES IMPACT BUSINESS

IMPACT OF TECHNOLOGY ON BUSINESS
Exxon Mobil
General Electric
Citigroup
BP
Apple
Alphabet
Microsoft
Amazon
Technology has changed the market of space launches, market share by companies %
Financial result of the digital transformation
of companies, $ US billion
Sea Launch
Japan
China
Russia
Europe
Other U.S.
SpaceX
100%
90%
80%
70%
60%
50%
40%
30%
20%
10%
0%2010 2011 2012 2013 2014 2015 2016 2017 2018
The use of information technology enabled SpaceX to increase the efficiency of space launches and significantly reduce costs, allowing it to become the market leader within several years and take market share from Russia.
IT companies have overtaken traditional mining and productionsectors and consistently demonstratethe highest financial indicatorsgrowth rates.
According to Fortune, Forbes, Financial Times, PWC, IDC
752
580
508
427
343
261
166
114
363
372
239
233
53
81
281
20
2005 2016
3646
19
17
17
25
22
1 2
0,2
8
9
15
1
0,4
12CAPITALIZATION
NET INCOME
26

SECOND PLATFORM THIRD PLATFORM FOURTH PLATFORM
ТРЕТЯ ПЛАТФОРМА
According to IDC
Low compatibility of systems. Expensive equipment and proprietary software. Minimal opportunities for process automation. Low level of utilization of resources. High dependence on suppliers and vendors. Expensive and poor-quality communication services. Lack of IT development strategy and metrics to assesstheir effectiveness.
Development of system interfaces. Expanding the range of available IT solutions, reducing dependence on vendors.Distribution of automation at different levels.
Improvement of infrastructure utilization, including by means of virtualization and deployment of cloud services.Widespread distribution of available telecommunicationservices, including for mobile users. Binding IT Development Strategy to other business tasks.
Seamless integration of systems. Ability to create any solution in the XaaS / PAYG model.End-to-end automation of processes.High level of utilization of resources.Connectivity combines assets, devices, data and users into a single ecosystem. An unprecedented level of competition and globalization of markets. The DX strategy becomes a prerequisite for survival.
DX means building business around systems and business tools –this is the ability to create competitive services and products in the digital economy. From a technological point of view, the main driver of DX is the ecosystem of the "third platform".
The digital transformation of a business (DX) is the transformation of the company's activities to ensure its efficiency and competitiveness in the digital economy.
The third platform - the stage of the development of information technology, where infrastructure becomes centralized - through the creation of cloud platforms and data centers. The main components of the third platform are mobility (mobile users), big data, social platforms (networks) and cloud technologies.
IT IS SEPARATED FROM BUSINESS PROCESSES2000
IT INTEGRATED INTO BUSINESS PROCESSES2010
IT AND BUSINESS ARE INSEPARABLE2020
DIGITAL TRANSFORMATION: STAGES OF IMPLEMENTATION OF IT IN BUSINESS ACCORDING TO IDC PLATFORMS’ METHODOLOGY 27

THE FUTURE OF DIGITAL TRANSFORMATION
According to IDC
By 2018, half of all major companies will have already earned revenue from DaaS (data as a service), selling raw data, statistics and insights.
During 2018, half of the governments in the world will postpone or cancel implementation of e-gov solutions, such as e-voting platforms, due to risks associated with cyber attacks.
By 2019, ML, AI, and Cognitive will have the highest growth rates in the software development industry.
By 2019, P2P transactions from mobile devices will reach $ 6 trillion.
More than half of the executives of the SMB segment in 2019 will be from the millennials generation.
In 2019, expenditures on digital transformation (DX) in the world will be $1.7 trillion - 42% more than in 2017.
By 2020, the first wave of cyborgization of mankind will begin - systems and products associated with the third platform can be incorporated into the human body.
By 2020, every fifth company entrusts the creation of new content, such as presentations and reports, to machine learning platforms.
In 2020, 60% of CIO will be switched from IT to digital products.
By 2021, 20% of data from sources on open networks will be registered on a public blockchain. corresponding APIs will make that data more accessible and reliable.
At Least 15% of businesses' standard customer experience decisions will be handled by algorithms.
70% of digital advertising and marketing will be augmented or automated using artificial intelligence and machine learning.
90% of organizations will be incorporating cognitive/AI and machine learning into new enterprise apps.
By 2019, 35% of all enterprise applications users in the CEE region will have access to intelligent virtual assistants.
By 2019, AI will handle up to 70% of routine software development.
By 2019, 20% of all corporate mobile applications will have built-in augmented reality (AR) support.
More than 700 EB of unique data will be available in industry clouds for subscriber companies. This is 2.5 times higher than today.
By 2020, half of all new productive assets will be self-sustaining - independently tracking their condition while diagnosing and correcting possible crashes and breakdowns.
In 2020, 90% of organizations and companies will use several cloud platforms at once while more than a third of customers will implement integration and synchronization tools for multi-cloud ecosystem.
Three-quarters of companies will implement cloud-based strategies to support DX infrastructure allowing access to the benefits of the "API economy".
Every month, 180 million people around the world will watch 12 billion hours of virtual reality video.
By 2021, at least 50% of Global GDP will be digitized.
By 2021, 30% of online transactions in CEE region will use biometric authentication.
By 2021, 25% of the world's personal data will be compromised and housed in a data lake analyzed and utilized by consortiums of threat actors.
The use of robotic process automation enhanced by aI capabilities to automate business processes will grow threefold by 2021.
2018 2019 2020 2021
28

PROCESS OF DIGITAL TRANSFORMATION OF BUSINESS
Economic and technical indicators,as well as market trends, confirm: the world has moved to the stage of digital transformation.
The cost of material products,including high-tech, is rapidly decreasing."Virtual" values are increasingly important.
The application of new solutions is noticeable throughout the world, while most highly specialized professions are not able to track the impact of everything that is happening in the overall picture.
The Fourth Industrial Revolution redefines key professions, assets, competitive advantages and opportunities. And its consequences are manifested in all aspects of our lives.
Business and technology are increasingly inseparable. A new reality is rapidly forming while most companies are hopelessly backward.
The transformation trigger was the formation of the ecosystem of new technologies.
11
109
8
7
6
543
21
KPIs and approaches to doing business have changed. The Product Creation Chain and interaction with the market differ significantly from the approaches favored in previous times.
Dependence of "everything from everything". The rapid expansion of the "coverage area" by the technologies of communication, gathering and analysis of data has already plunged us into the "digital universe".
The service model incorporates everything. Customers are no longer buying a "box", which after hard and expensive setting will help them in their work. They expect a ready-made service (model PAYG), which they need here and now.
Everything is determined entirely by the level of understanding and limited by the imagination. Any tools necessary for the implementation of any idea are already available. The only question is how to combine them to get what you need.
Cargo-cults will not work. It makes no sense to blindly imitate and create dummies very similar to popular solutions. A reed crate is not a Boeing competitor.
29
According to IDC
Industry 4.0 involves the active useof big data for forecasting, management and automation, usingthe Internet of things and platformsof artificial intelligence. Service platforms (on which the customer pays only for services, not for the tools that provide them) and cyber-physics systems (CPS) in production, which combine physical assets and information systems, are crucial.
To be ready for the transition to a digital economy, businesses need to be substantially reformed. This means increasing the efficiency and innovation of a business to achieve digital transformation.
DXSTARTS
ECOSYSTEMEMERGES
VIRTUALVALUES
NEWSOLUTIONS CHANGES
ARE EVERYWHERE
NEWKPIS
COPY/PASTE DOES NOT
WORK
DIGITALWORLD
EVERYTHING IS SERVICE
KNOWLEDGE ECONOMY
THINGS CHANGE FAST

According to AEQUO
1. INITIALSTAGE
A. START OF NEGOTIATIONS between the seller and buyers;
B. DRAFTING a non-disclosure agreement,
exclusivity agreement, memorandum of understanding
A. SECURING PERMISSIONS from state bodies (merger clearance);
B. ADVANCE BANK PAYMENT;C. EXECUTION
of other conditions.
3. EXECUTION OF PURCHASE CONTRACT
A. EXECUTION OF SELLER'S NON-COMPETE ARRANGEMENTS;
B. EXECUTION OF ADDITIONAL PAYMENTS WITH
THE SELLER.
5. EXECUTION OF ADDITIONAL OBLIGATIONS
AFTER CLOSING (IF APPLICABLE)
A. LEGAL AUDIT: І. Confirmation of ownership of the object of the deal and verification of existing encumbrances; ІІ. Verification of the availability of all regulatory documents (in particular, license in the field of
telecommunications for telecommunications companies, registration of the operator, telecommuni-cations provider, availability of the license of the provider of the software service, etc.);
ІІІ. Checking the proper registration of relations with the developers of IT products (business entities or hired workers) and transfer of rights to them;
IV. Checking for rights to distribute copyright objects;B. TECHNICAL AUDIT:
І. . revision of the technical condition of the telecommunications network (for telecommunications companies), verification of assets
on the company's balance sheet; ІІ. Revision of IT products (for IT companies).
2. DUE DILIGENCE TO DETERMINE POSSIBLE RISKS
FOR NEW OWNER
4. ACQUISITION OF THE RIGHTS TO AN ASSET
A. EXECUTION OF PAYMENTS;B. TRANSFER OF TITLE
TO THE BUYER; C. APPOINTMENT OF NEW MANAGEMENT.
MAIN STAGES OF M&A TRANSACTIONS IN THE TMT SECTOR 30
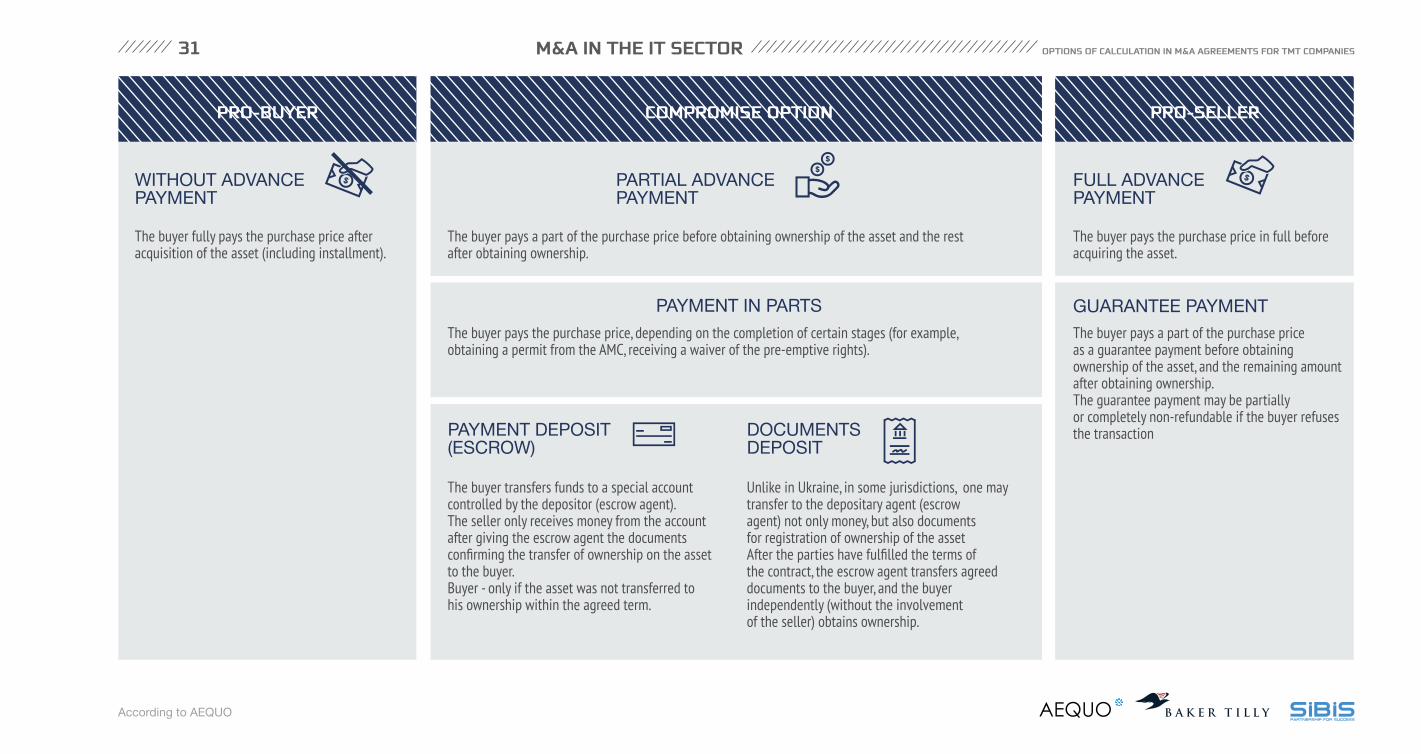
М&A IN THE IT SECTOR
PRO-BUYER COMPROMISE OPTION PRO-SELLER
WITHOUT ADVANCE PAYMENT
PARTIAL ADVANCE PAYMENT
FULL ADVANCE PAYMENT
GUARANTEE PAYMENTPAYMENT IN PARTS
PAYMENT DEPOSIT (ESCROW)
DOCUMENTSDEPOSIT
The buyer fully pays the purchase price after acquisition of the asset (including installment).
The buyer transfers funds to a special account controlled by the depositor (escrow agent). The seller only receives money from the account after giving the escrow agent the documents confirming the transfer of ownership on the asset to the buyer.Buyer - only if the asset was not transferred to his ownership within the agreed term.
Unlike in Ukraine, in some jurisdictions, one maytransfer to the depositary agent (escrowagent) not only money, but also documentsfor registration of ownership of the assetAfter the parties have fulfilled the terms of the contract, the escrow agent transfers agreed documents to the buyer, and the buyer independently (without the involvement of the seller) obtains ownership.
The buyer pays the purchase price in full before acquiring the asset.
The buyer pays a part of the purchase price as a guarantee payment before obtainingownership of the asset, and the remaining amount after obtaining ownership.The guarantee payment may be partially or completely non-refundable if the buyer refusesthe transaction
The buyer pays a part of the purchase price before obtaining ownership of the asset and the rest after obtaining ownership.
The buyer pays the purchase price, depending on the completion of certain stages (for example,obtaining a permit from the AMC, receiving a waiver of the pre-emptive rights).
According to AEQUO
OPTIONS OF CALCULATION IN М&A AGREEMENTS FOR ТМТ COMPANIES
31
VIVID VISUALIZATION for your content marketing:
Content for any stageof the customer journey
toplead.eu
Motion graphicPresentationsResearch

CREATED BY
TOP LEADtoplead.com.ua
Terms of use of this guide: partial reprint of the materials in this guide is possible with a direct hyperlink to the BUSINESSVIEWS page where this guide is located. Use of the full version of this guide and its placing on sites electronically is strictly prohibited. © Top Lead LLC. All rights reserved
AEQUOVector Business Center,st. B. Khmelnitsky 52, Kyiv, Ukraine
aequo.ua
BAKER TILLYAlexander Pochkun, Managing Partner
bakertilly.ua
SI BISIgor Fedchenko, CEO Lyudmila Bilyk-Beregova, CMO
sibis.com.ua
businessviews
businessviews.com.ua
DISCLAIMERThis report is created solely to inform users. We make every effort to ensure that the information provided in the directory is accurate and up-to-date. Despite the fact that this report was carefully prepared by specialists, it can be used to gain a general idea of the subjects discussed herein. It is not recommended to use the information contained in the report as professional advice on any particular issue or for professional assessment. Featured data was collected and prepared for publication in 2017.
For requests for sponsorship and partnership in infographic report projects
Partnership
BusinessViews
ANALITICAL PARTNER
MEDIA PARTNERS: