ukraine’s economy since independence and current situation · ukraine’s economy since...
TRANSCRIPT

W H E R E O P P O R T U N I T I E S E M E R G E
1
Ukraine’s Economy Since Independence and Current
Situation
Dr. Edilberto Segura SigmaBleyzer - The Bleyzer Foundation
July 2014 v5

W H E R E O P P O R T U N I T E S E M E R G E W H E R E O P P O R T U N I T I E S E M E R G E
2
Economic Performance in the 1990’s
After independence from the Soviet Union in August 1991, Ukraine had a large potential to grow fast:
• It was the second largest European country in land mass and the 4th largest in population (51 million people).
• Had well educated and skilled labor force. • Had extensive and rich agricultural soil: used to be the
grain-basket of the former Soviet Union. • Had good industrial activities. • Had good mineral resources (iron ore, coal). • Had a reasonably developed infrastructure.

W H E R E O P P O R T U N I T E S E M E R G E W H E R E O P P O R T U N I T I E S E M E R G E
3
What happened after Independence? • Despite favorable initial conditions, Ukraine had a difficult transition --
with a long recession lasting several years. • This was because:
1. Its economy was open and dependent on other FSU Republics -- but Independence cut these production & trade relations.
2. It had a large percentage of military industries (25% of enterprises produced military goods) -- which found themselves without markets.
3. Due to negligible energy cost, many industrial processes were very energy intensive (Ukraine used 6 times more energy/GDP than in EU) -- they became inefficient when energy cost increased 10 times.
4. Lack of serious and deep economic reforms. • Although corporate restructuring was needed, the government instead
followed a “preservation” strategy, giving huge subsidies to enterprises that produced large government deficits (of up to 25% of GDP in 1992) and which led to high inflation rates (of up to 10,160%% pa in 1993).

W H E R E O P P O R T U N I T E S E M E R G E W H E R E O P P O R T U N I T I E S E M E R G E
4
In 1995, President Kuchma was elected based on a reform agenda & progress was made in several areas:
─ Prices and international trade were liberalized. ─ Taxes were lowered and many subsidies eliminated. ─ The small & mass privatization programs advanced. ─ The NBU was strengthened with sound monetary policy. ─ A new currency (Hryvnia) was introduced in 1996. ─ Ukraine accepted the IMF Obligations under Article VIII
(convertibility for current account payments). ─ Inflation was reduced to 10% in 1997. ─ The exchange rate was maintained stable at 1.9 UAH/US$ ─ The NBU’s international reserves increased.
§ These measures led to financial support by the IMF, the World Bank and the European Bank.
§ But reforms were stalled in 1996-97 as government efforts shifted to political and constitutional reforms.

W H E R E O P P O R T U N I T E S E M E R G E W H E R E O P P O R T U N I T I E S E M E R G E
5
§ With a weak economy, the default by Russia on August 17, 1998, triggered a financial crisis in Ukraine: • Foreign banks were not willing to roll-over Ukraine’s foreign
debt which had increased rapidly in 1996-98. • Capital outflows accelerated. • International reserves fell sharply from US$2.5 billion in April
1998 to US$800 million by December 1998. • The exchange rate depreciated by 80% from 1.9 UAH/US$ in
December 1997 to 3.4 UAH/US$ by the end of 1998 and to 5.2 UAH/US$ in 1999.
• In two months, the local stock market index collapsed by 55% from 40 in August 1998 to 18 in October 1998.
In 1998, the Russian Default Hit Ukraine Hard

W H E R E O P P O R T U N I T E S E M E R G E W H E R E O P P O R T U N I T I E S E M E R G E
6
The post 1998 Crisis period – 1999-2007
§ But Ukraine recovered very well from the 1998 crisis: • It negotiated successfully with banks the restructuring of its debts. • The fiscal deficit was below 1% of GDP from 1999 to 2007 • Monetary policy stabilized the exchange rate at UAH 5.2 per US
$. • Key economic reforms were implemented, including adoption of
legislation for WTO accession, improved intellectual property rights, liberalization of many business activities, payment of wage and pension arrears, elimination of barter trade, enactment of Laws on Banks, better legislation on money laundering, etc.
§ The major Hryvnia devaluation of 1998, the improved fiscal situation, and new economic reforms provided the basis for export and GDP growth from 2000 to 2008.

W H E R E O P P O R T U N I T E S E M E R G E W H E R E O P P O R T U N I T I E S E M E R G E
7 Source: State Statistics Committee of Ukraine, National Bank of Ukraine, Ministry of Finance of Ukraine, The Bleyzer Foundation
§ From 2000 to 2008, Ukraine showed overall excellent performance.
Economic Performance between 2000 and Sept. 2008
2000-07 average
9m 2008
Real GDP Growth, % yoy 7.5 6.3Fiscal Balance, % GDP -0.8 1.7Consumer Inflation, %, eop 11.3 24.6UAH/$ Exchange Rate, eop 5.2 4.9Current Account, % GDP -6.4
Gross Int. Reserves, $ bn 37.5
Foreign Public Debt, % GDP 6.5Foreign Private Debt, % GDP 50.4
2000-05 2006-075.7 -2.620001.5
200732.5
200321.3
20078.7
26.2 47.4

W H E R E O P P O R T U N I T E S E M E R G E W H E R E O P P O R T U N I T I E S E M E R G E
8
§ For the period 2003-2007, Ukraine was one of the fastest growing economies in the region.
Comparative Economic Performance 2003-2007
Source: State Statistics Committee of Ukraine, IMF WEO Database April 2008
Real GDP growth in Ukraine and Selected Emerging Market Economies, % average for 2003-2007
0
2
4
6
8
10
6.1 5.5 5.1
6.3 7.1 7.0 7.3
7.9
9.6
Bulgaria Czech Rep. Poland Romania Slovak Rep. Turkey Kazakhstan Russia Ukraine

W H E R E O P P O R T U N I T E S E M E R G E W H E R E O P P O R T U N I T I E S E M E R G E
9
Growth Drivers During 2002 - 2007
• Exports were the main sources of growth in 2002 to 2004, driven by high growth in the EU and EMs and high metallurgical demand.
• But in 2005-2007, the main sources of GDP growth were domestic consumption and investments
• Domestic consumption and investments were stimulated by a large inflow of foreign capital that brought external foreign debt (principally private) from $20 bn in 2002 to $90 bn in 2007.

W H E R E O P P O R T U N I T E S E M E R G E W H E R E O P P O R T U N I T I E S E M E R G E
10
But in 2008, the Sub-Prime Crisis hit Ukraine hard, due to its high dependence on mineral exports and foreign capital
• Export of goods: - 40% yoy (2009)
• Real GDP: -14.8% yoy (2009) • Industrial production: -22% yoy (2009)
• PFTS stock price index: -74% (2008)
• UAH/$ Exchange Rate: 65% Depreciation (2009) • Unemployment (ILO): 9.4% (4Q 2009)
• Real households’ income: -8.5% yoy (2009)
• Broad fiscal balance: -11% of GDP (2009)

W H E R E O P P O R T U N I T E S E M E R G E W H E R E O P P O R T U N I T I E S E M E R G E
11
The Crisis Affected Ukraine Harder than other EMs
* The Bleyzer Foundation for Ukraine and Romania, The Economist for others countries Sources: The Economist, Central banks of the respective countries, The Bleyzer Foundation
Ukraine -14.8 65%
Mexico -6.9 27%
Latvia -17.5 9%
Estonia -14.5 Lithuania -14.4
Taiwan -3.5 6%
Russia -8.0
Hungary -6.7 Romania -7.1
Country GDP, % yoy 2009
Local Currency Depreciation vs. US Dollar (mid-2008 to
end-2009)
9%
29%
27% 26%
9%

W H E R E O P P O R T U N I T E S E M E R G E W H E R E O P P O R T U N I T I E S E M E R G E
12
Ukraine Handled the 2008 Crisis Relatively Well • Ukraine secured loans from the IMF and World Bank at the end of 2008. • Private firms & banks were able to restructure short-term foreign debt. • A program for troubled banks was implemented. The main aspect of this
program was the recapitalization of troubled banks with public funds. • The NBU supported banks liquidity through its refinancing operations;
eleven banks were taken under NBU temporary administration with one of them successfully sold to new shareholders; the Central Bank monitoring was placed in several other banks. All in all, four banks were recapitalized.
• At the beginning of November 2008, the guarantee on deposits of individuals was increased three times to UAH 150,000 (about $20,000).
• The authorities agreed to gradual fiscal consolidation and implemented structural reforms to revive growth.
• The Hryvnia depreciated by 65% in 2008-9, restoring competitiveness.

W H E R E O P P O R T U N I T E S E M E R G E W H E R E O P P O R T U N I T I E S E M E R G E
13
The Economic Recovered Quickly in 2010 and 2011
Sources: State Statistics Committee, The Bleyzer Foundation
Real GDP Growth by Sectors, Contribution to Growth, percentage points
• In 2010 and 2011, GDP grew rapidly at 4.1% and 5.2% pa, respectively, better than most European countries.
• Real GDP growth was driven by private consumption and public investments. • Agriculture, with a record high harvest, played a significant role in supporting
GDP growth in 2010 1nd 2011, and also in reducing inflation. Real GDP Growth by Demand,
Contribution to Growth, percentage points

W H E R E O P P O R T U N I T E S E M E R G E W H E R E O P P O R T U N I T I E S E M E R G E
14
But GDP Growth stalled in 2012, 2013 and 2014
• In 2012 and 2013, economic growth slowed down to 0.2% yoy and 0% yoy.
• GDP growth was depressed by weaker exports and steel prices (due to a unfavorable economic environments in Europe) and low domestic investment activity.
• Ukraine, however, avoided a decline in GDP due to increases in domestic consumption, stimulated by growth in real wages.
• In 2014, GDP will decline by about 5% yoy. • This GDP decrease will be due political
uncertainties that have led to (i) weak export performance, (ii) a decline in consumption, (iii) a fall in investment activity and (iv) an increase in imported gas prices.
• But the economy is expected to return to growth in 2015.
4.1
5.2
0.2 0.0
-4.7
1.5
-15
-10
-5
0
5
10
15
2010 2011 212 2013 2014f 2015fPrivate Consumption Government ConsumptionInvestment ExportImport Real GDP Growth
Real GDP Growth by Demand, Contribution to Growth, ppts
W H E R E O P P O R T U N I T I E S E M E R G E
15
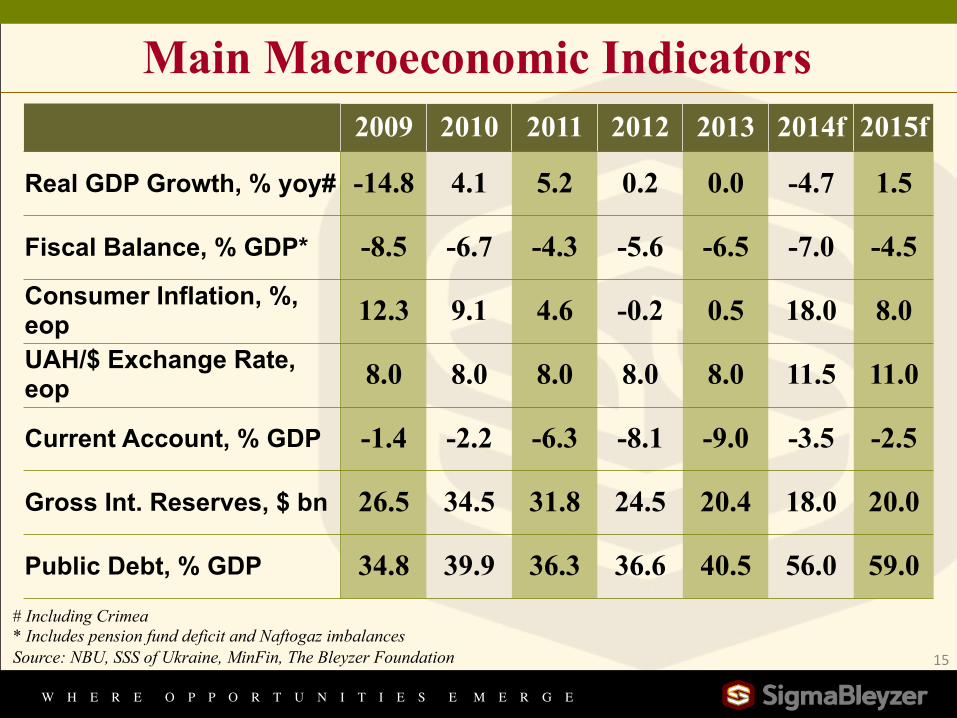
Main Macroeconomic Indicators 2009 2010 2011 2012 2013 2014f 2015f
Real GDP Growth, % yoy# -14.8 4.1 5.2 0.2 0.0 -4.7 1.5
Fiscal Balance, % GDP* -8.5 -6.7 -4.3 -5.6 -6.5 -7.0 -4.5 Consumer Inflation, %, eop 12.3 9.1 4.6 -0.2 0.5 18.0 8.0 UAH/$ Exchange Rate, eop 8.0 8.0 8.0 8.0 8.0 11.5 11.0
Current Account, % GDP -1.4 -2.2 -6.3 -8.1 -9.0 -3.5 -2.5
Gross Int. Reserves, $ bn 26.5 34.5 31.8 24.5 20.4 18.0 20.0
Public Debt, % GDP 34.8 39.9 36.3 36.6 40.5 56.0 59.0 # Including Crimea * Includes pension fund deficit and Naftogaz imbalances Source: NBU, SSS of Ukraine, MinFin, The Bleyzer Foundation

W H E R E O P P O R T U N I T I E S E M E R G E
Economic Issues and Future Prospects • Although economic and political uncertainties are large, the Association
Agreement and TFA with the EU may become an anchor for institutional development and economic reforms in Ukraine.
• Main areas of reform include: (i) public administration reform with focus on contraction and decentralization; (ii) further tax system reforms; (iii) judicial reform to ensure just and unbiased judgments; (iv) further property rights protection; (v) de-regulation of business activities to encourage entrepreneurship; (vi) effective anticorruption measures; (vii) banking sector reform with truly independent NBU; and (viii) energy sector reform.
• In fact, today, better than any other time, Ukraine has a good chance to make quantum jumps in its economic and business environments.
• These possibilities, however, may be overshadowed by a number of challenges as noted in the next slides. 16

W H E R E O P P O R T U N I T I E S E M E R G E
Challenge #1 – Open & Undiversified Economy…
• Exports represent 50% of GDP
• But exports are undiversified:
• Metals, Minerals and Chemicals account for 50% of exports.
• This lack of product diversification is the result of lack of reforms in the past.
Grain, seeds, & other
agricultural products
Russia 11% Egypt 9% India 6%
Locomotives, turbine engines & other equipment
Russia 52% Kazakhstan 6% Hungary 5%
Ukraine’s Exports by Commodities, % of Total, and Key Trading Partners, % of Commodity Exports, 2013
Other
Fertilizers, chemicals,
plastics Russia 35% Turkey 8% USA 5%
Ferrous metals, fuels, ores, other
metals and minerals
Russia 16% Turkey 10% China 7%
Sources: UN Comtrade, The Bleyzer Foundation
27
40
8
17
9

W H E R E O P P O R T U N I T I E S E M E R G E
…with high dependence on Steel Prices…
• Ukraine’s exports and industrial production are very dependent on international steel prices, which are very vulnerable to crises, as people stop buying cars and houses.
• World steel prices fell sharply from mid-2008 to mid-2009.
• In 2009, Ukraine’s exports of goods dropped by 40% yoy in US$ terms.
• And industrial production declined by 22% yoy.
• Product diversification must be a priority for economic reforms.
-40
-30
-20
-10
0
10
20
30
40
-80
-60
-40
-20
0
20
40
60
80
06 07 08 09 10 11 12 13 14
% yoy % yoy
Export of goods, 3m MA, left scale
World carbon steel prices, composite index, left scale
Monthly industrial production index, 3m MA, right scale
W H E R E O P P O R T U N I T I E S E M E R G E
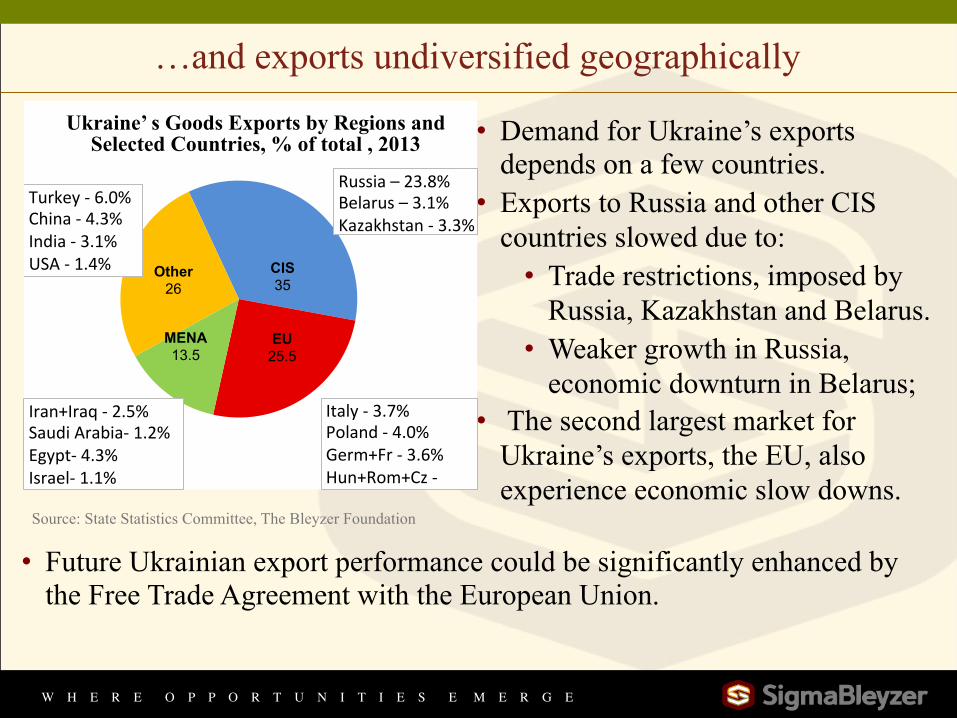
…and exports undiversified geographically
• Demand for Ukraine’s exports depends on a few countries.
• Exports to Russia and other CIS countries slowed due to:
• Trade restrictions, imposed by Russia, Kazakhstan and Belarus.
• Weaker growth in Russia, economic downturn in Belarus;
• The second largest market for Ukraine’s exports, the EU, also experience economic slow downs.
Source: State Statistics Committee, The Bleyzer Foundation
• Future Ukrainian export performance could be significantly enhanced by the Free Trade Agreement with the European Union.
CIS 35
EU 25.5
MENA 13.5
Other 26
Iran+Iraq -‐ 2.5% Saudi Arabia-‐ 1.2% Egypt-‐ 4.3% Israel-‐ 1.1%
Turkey -‐ 6.0% China -‐ 4.3% India -‐ 3.1% USA -‐ 1.4%
Russia – 23.8% Belarus – 3.1% Kazakhstan -‐ 3.3%
Italy -‐ 3.7% Poland -‐ 4.0% Germ+Fr -‐ 3.6% Hun+Rom+Cz -‐ 4.6%
Ukraine’ s Goods Exports by Regions and Selected Countries, % of total , 2013

W H E R E O P P O R T U N I T I E S E M E R G E
0
10
20
30
40
50
60
-10
-8
-6
-4
-2
0
2
2009 2010 2011 2012 2013e 2014f 2015f
Public Sector Fiscal Balance, left scalePublic Debt, right scale
20 20
Challenge 2: Public Finances Ukraine’s Fiscal Deficit (Incl.
Naftogaz and Pension Fund) and Public Debt, % of GDP
Source: MinFin, The Bleyzer Foundation
• In 2013, the fiscal budget deficit widened to 6.5% of GDP, due to low GDP growth, high social spending and energy subsidies
• In 2014, the fiscal deficit will increase to 7.0% of GDP, due to lower tax revenues associated with the economic downturn and advance collection of taxes in 2013.
• The new government has committed to tough austerity measures to reduce fiscal imbalances, but with results only in 2015.
• The measures include a rise in taxes, cuts in expenditures (incl. utilities and other social spending) and public sector employment, and reform of energy sector.
• With these measures, public sector deficit is forecast to narrow to 4.5% of GDP in 2015 and return to less than 3% of GDP in 2016.

W H E R E O P P O R T U N I T I E S E M E R G E
0
4
8
12
16
20
24
-3
0
3
6
9
12
15
2012 2013 2014
Bank credit in UAH, stock, right scale
Bank deposits, total stock, right scale
Consumer inflation, left scale
21 21
Challenge 3: Inflation and Banking Sector Weaknesses Consumer Price Inflation and Select
Banking Sector Indicators, % yoy
Source: SSS of Ukraine, NBU, The Bleyzer Foundation
• Ukraine enjoyed low inflation during 2012-13 thanks to good harvest and unchanged utility tariffs.
• In 2014, inflation is forecast to accelerate to 18% yoy (it was almost 12% yoy in June 2014) due to the 43% Hryvnia devaluation since the beginning of 2014 and rises in utility tariffs (natural gas, heating, electricity, water, etc.).
• Ukraine’s banking sector is under stress due to high level of non-performing loans, political instability, Hryvnia devaluation and deposit outflows.
• These adversely affected both the cost and availability of bank credit. • With the IMF program in place, banking sector weaknesses will be addressed,
but subdued bank lending will contribute to low GDP growth in 2014.

W H E R E O P P O R T U N I T I E S E M E R G E
Challenge # 4 – Large External Debt…
• External debt tripled in three years (2006-08) to about $100 billion (90% of GDP).
• As of mid-2008, ~ $40 billion of debt was due in 1 year –vs- $35 billion of international reserves.
• Debt rollover became very difficult during the initial stages of the 2008 crisis, pressuring the Hryvnia.
• Ukraine was considered high risk given its high level of external debt, compared to other countries.
0153045607590
105120135150
04 05 06 07 08 09 10 11 12 13
IntercomanyLending
CorporateSector
BankingSector
Public Debt
Ukraine's Gross External Debt, $ billion

W H E R E O P P O R T U N I T I E S E M E R G E
23
Challenge # 4 – …Large External Debt Repayments in 2014
Source: NBU, MInFin, The Bleyzer Foundation
• In 2014, Ukraine faces significant external financing requirements of about $80 billion, in order to meet private and public debt repayments as well as to cover current account deficit.
• But these large external requirements are expected to be covered by significant official financing from the IMF, the EU and other IFIs and individual countries (the US, Japan, etc.) as well as significant roll-overs of private debt.
Needs Potential Sources Public Debt (Government and NBU) 8.0 13.1 Financial Aid Package IMF 3.7 7.0 IMF Sovereign Eurobonds 1.0 2.1 EU Naftogaz Eurobonds 1.6 4.0
Other financing (EBRD, EIB, WB, individual countries) Naftogaz arrears to Gazprom 1.7
Private Debt 62.5 64.5 Rollover Banking sector 14.5 12.6 85-90% Corporate sector 48.0 51.8 105-110% Current account deficit 5.0 4.0 FDI Population purchases of FX 4.0 Total Needs 79.5 81.6 Total Sources International Reserves, as of end-February 15.4

W H E R E O P P O R T U N I T I E S E M E R G E
24
Challenge 5: Current Account Deficit and FX Rate • Exports were weak in 2013 due to
increased trade tensions with Russia, slow global recovery, and soft world commodity prices.
• In 2013, the CA deficit reached 9.0% of GDP.
• Although export performance will remain poor in 2014, the CA deficit is expected to narrow to 3.5% of GDP, thanks to a fall in imports caused by the Hryvnia devaluation and the economic recession.
• From early 2014, political and economic difficulties caused the Hryvnia to suffer a 43% devaluation to the current rate of UAH 11.8 per USD.
• We are forecasting that the exchange rate will remain stable at current rates up to the end of 2015, given the significant official financing made available (and assuming no further hostilities by Russia).
-12
-6
0
6
12
-50
-25
0
25
50
2005
2006
2007
2008
2009
2010
2011
2012
2013
2014
f
2015
fCurrent Account Balance, % of GDP, right scale
Export of Goods and Services, % yoy, left scale
Import of Goods and Services, % yoy, left scale

W H E R E O P P O R T U N I T I E S E M E R G E
50
150
250
350
450
550
Belarus
Moldova
Germany
France
Austria
Latvia
Slovakia
Italy
Ukraine*
Lithuania
Bulgaria
Poland
Challenge # 6: The Natural Gas Situation…. • In November 2013, Russia reduced gas
price for Ukraine from $400 per tcm to $268.5 after Yanukovych rejected the Association Agreement with the EU; but raised the price to $485 after Yanukovych ouster and Crimea’s annexation.
• Ukraine rejected the new price and the EC brokered negotiations.
• Russia suggested a cut of about 1/5 to around $385 per tcm (close to the average gas price for Europe in 2013).
25
* Gas price demanded by Gazprom since April 2014 Source: G. Kates, L. Lou. RFE/RL
Prices Select Countries Pay for Russian Gas, 2013, US Dollar per 1000 m3
• This offer was based on a “temporary good will” discount of $100 per tcm by removing again an export duty. Not written into the contract, it would have been under Moscow’s discretion to recall the discount.
• As a minimum, Ukraine wanted the discount to be reflected in the contract…

W H E R E O P P O R T U N I T I E S E M E R G E
Challenge 6: …The Natural Gas Situation • As a maximum, it wanted to change the 2009 gas contract that locked
Ukraine into buying a set volume of gas, whether it needs it or not, at $485 per USD.
• Russia claims that Ukraine has more than $5 billion in debts to Gazprom. • Kyiv paid off for gas consumed in Feb-Mar 2014 but has refused to pay
more as part of this debt was calculated by Russia based on a new gas price. • As further negotiations stalled, Moscow halted gas supplies on June 16th. • Both countries appealed to Stockholm Arbitration Court, but it will take
time to be resolved. • To satisfy domestic consumption and ensure reliable gas transit to Europe,
including during the winter season, the following measures are carried out: – There is about 14 billion m3 of natural gas in storages as of July 1st; – Ukraine has been securing reverse gas supplies from Europe (Poland, Hungary
and Slovakia routes); – The government has urged all consumers to save natural gas and use alternative
fossil fuels (which may save 6 billion m3 for the season, or 20% of total). 26

W H E R E O P P O R T U N I T I E S E M E R G E
27
2014: A Dramatic Change in Political Landscape • Yanukovych’s decision of November 2013 to postpone signing of the Free
Trade & Association Agreement with the EU - and increase cooperation with Russia -- sparked massive protests in Kiev and West Ukraine.
• Starting as pro-European demonstrations, the protesters later demanded an overhaul of a seriously corrupt and authoritarian political system.
• These protests resulted in the ouster of Yanukovych in February 2014, the return of the 2004 Constitution (under which the President shares power with the Parliament and Prime Minister), and early presidential elections.
• The President’s ouster led to unrest in East and South Ukraine, with Russia invading and annexing Crimea, an annexation not recognized internationally.
• Eventually the unrest localized in two oblasts – Donetsk and Luhansk, where pro-Russian and anti-Ukrainian sentiments were particularly strong.
• As protests in these two regions quickly evolved into armed insurgency supported by Russia, Ukraine started military operation to restore order.

W H E R E O P P O R T U N I T I E S E M E R G E
New President: Presidential Elections • Early presidential elections in May 25th were won by Petro Poroshenko, a
successful businessman and politician, who received 54.7% of the vote.
28

W H E R E O P P O R T U N I T I E S E M E R G E
New President: What to Expect • Pro-Europe candidates received close to 90% of the votes. Despite scarce
voting in eastern oblasts, the elections were recognized as free and fair. • Mr. Poroshenko is seen a person whom both the East and the West can
work. • In his June 7th’s inauguration, President Poroshenko said that he will:
– Bring peace under a plan that involves (i) the lay down by all groups of illegal arms, (ii) exemption from criminal responsibility for those without blood in their hands, (iii) provide a controlled corridor for Russian mercenaries to return home, and (iv) engage in a peaceful dialogue with peaceful citizens of Ukraine.
– Introduce a project of government decentralization with significant part of powers delegated from the center to local governments. But still, Ukraine will remain as a unitary state. Reform on decentralization will begin this year with amendments to the Constitution.
29

W H E R E O P P O R T U N I T I E S E M E R G E
Poroshenko’s Inauguration Speech – Guarantee free usage of Russian language in the south-east region.
Although the Ukrainian language will remain the single state language, free development of Russian and other languages will be guaranteed.
– Have early Parliamentary elections and early local elections in the Donbas later this year.
– Protect the territorial integrity of Ukraine and never accept the annexation of Crimea by Russia.
– Maintain a well-equipped and combat-ready military. – Ensure the signature of an international agreement that would replace the
Budapest Memorandum with direct and reliable guarantees of peace and security - up to military support in case of threat to territorial integrity.
– Ukraine will follow European countries in building an economy based on free competition, innovation, private business initiative, hard work, and constant self-improvement.
– For these ends, corruption will be reduced. 30

W H E R E O P P O R T U N I T I E S E M E R G E
Other Key Messages • All this is written in the agreement on political association and free
trade area with the EU, the political side of which was signed on March 21st.
• As pledged, Poroshenko signed the economic part of the agreement on June 27th.
• The same goes for the speedy introduction of visa-free regime with the EU for Ukraine. Ukraine has completed the first stage and will finish the second stage very quickly for Ukrainians to be able to travel without visas starting from January 2015.
• As for the Association Agreement, it is considered only as the first step towards full membership in the EU. Nobody has the right to veto the European choice of Ukraine.
• Ukraine will settle down relations with Russia; but there cannot be compromise in the issues on Crimea, European choice and state structure.
31

W H E R E O P P O R T U N I T I E S E M E R G E
Political Prospects -1 • Poroshenko should be able to implement most of his promises. He has
already appointed his Head of the President’s Administration and its Deputy Heads, including the one responsible for implementing reforms.
• But he may have difficulties in implementing some of his promises, particularly regarding Crimea and the holding of early Rada elections.
• By taking Crimea, Russia has ensured several things important to it: (i) the full control of port of Sevastopol for its naval fleet, (ii) negate the possibility that NATO’s ships may enter Sevastopol or any other port in Crimea; and (iii) ensure that Ukraine will not be able to join NATO (as NATO membership’s rules requires applicants to the Alliance to settle peacefully all border disputes).
• These benefits to Russia are so huge that Russia may not want to return Crimea to Ukraine, regardless of the economic cost of maintaining Crimea.
• On the other hand, Donetsk and Luhansk do not provide major strategic advantages to Russia (other than destabilizing Ukraine). 32

W H E R E O P P O R T U N I T I E S E M E R G E
Political Prospects - 2 • Therefore Russia may have (temporarily) abandoned plans to invade these
regions (partly in response to possible EU/US economic sanctions, partly due to the realization that local support for Russia is not strong enough, and partly because of the landslide election of Poroshenko).
• Only if Russia is able to take control of Donetsk, Zaporizhia, Kherson, Mykolaiv, and Odessa (the New Russia territory), Russia will get major advantages by having a land corridor to Europe bypassing Ukraine.
• But this will be hard for Russia to achieve given currently weak population support for Russia. Over time, Russia may want to revive its plans to control the New Russia territory if the local population support increases.
• In the interim, the strategy of Russia is probably just to cause enough disturbances in east-south Ukraine by supporting “separatists” in order to erode support to Kyiv, encourage new authorities to reverse Ukraine’s trend towards Europe, to reject both NATO and the EU FTA, and to show Russian citizens that any attempt to dispose of the current authoritarian power will lead to chaos and civil war. 33

W H E R E O P P O R T U N I T I E S E M E R G E
34
Recent Political Developments • As promised, the President Poroshenko set out a ceasefire plan for Donbas. • The plan was widely supported by the international community, including
Russia, but not by the rebels. • Given that the ceasefire turned to be unilateral, on July 1st Ukraine restored
military operation in eastern regions. • Since then Ukrainian army troops have made significant gains. The territory
under rebel’s control shrank almost 50%, concentrating in two largest cities of the region – Donetsk and Luhansk.
• The release of these million-citizen cities will be quite difficult as the Ukrainian army is restricted in the use of heavy weapons, artillery and aircraft.
• Hence, the success of the operation would crucially depend on the ability of the Ukrainian forces to seal the border with Russia to prevent the inflow of new weapons and ‘volunteers’.

W H E R E O P P O R T U N I T I E S E M E R G E
35 35
Summary • Due to unfavorable external environment and weak bank lending activity,
Ukraine’s real GDP growth was 0% yoy in 2013. • In 2014, GDP will decline by 5.0% due to austerity measures agreed upon with
the IMF and severe economic disruptions caused by Russia’s hostilities. • Under the IMF program, the fiscal deficit will be reduced but due to low GDP
growth and Hryvnia devaluation it will remain high in 2014. Public debt-to-GDP ratio, as a result, will approach 60% of GDP in 2015.
• Inflation is likely to accelerate to about 18% in 2014. • The exchange rate should stabilize at about UAH 11.5 per USD during 2014-15. • Ukraine will face significant external financing needs in 2014. • But with the IMF program and other external financing in place, Ukraine’s
external liquidity and fiscal challenges will be reduced, bringing the country onto a more sustainable path of growth.
• With good progress on structural reforms, pledged by new Kyiv authorities, Ukraine may achieve a quantum leap in economic development.

W H E R E O P P O R T U N I T E S E M E R G E W H E R E O P P O R T U N I T I E S E M E R G E
36
• Strategic location at the crossroads of Europe, Russia, Central Asia and Middle East.
• Great agricultural potential due to extensive and rich agricultural soil: used to be the grain-basket of the former Soviet Union.
• Rich in other resources (iron ore, coal, water). • Highly educated labor (60% university enrolment) with low wages. • Large domestic market (with growing purchasing power) • A reasonably developed infrastructure. • Industrial and high-tech potential • Many inefficiently-run companies that provide significant
opportunity for value creation through improved operations, marketing, finance, customer and quality focus – bottom line growth
• But Hostilities and political uncertainties must be controlled
Ukraine is an Attractive Country for Investment

W H E R E O P P O R T U N I T E S E M E R G E W H E R E O P P O R T U N I T I E S E M E R G E
37
Ukraine
Russia
India
Ukraine is a country of great potential