ultrasonic measurement of loads in bolts used in ... · ultrasonic measurement of loads in bolts...
TRANSCRIPT
Ultrasonic Measurement of Loads in Bolts Used in Structural Joints
Ajay M. Koshti, D.Sc. PE
NASA Johnson Space Center, Houston TX
NESC NDE Face to Face Meeting, Michoud, LA March 24, 2015
https://ntrs.nasa.gov/search.jsp?R=20150002989 2018-06-11T09:56:47+00:00Z
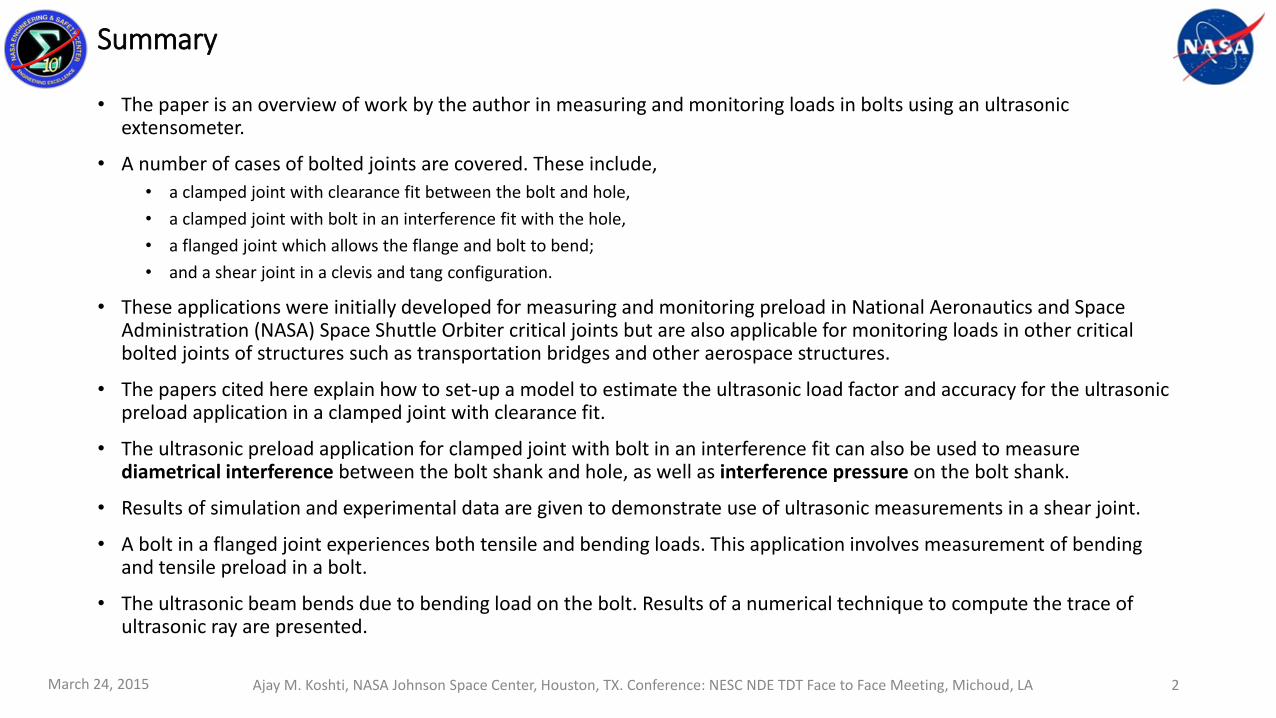
Summary
• The paper is an overview of work by the author in measuring and monitoring loads in bolts using an ultrasonic extensometer.
• A number of cases of bolted joints are covered. These include,
• a clamped joint with clearance fit between the bolt and hole,
• a clamped joint with bolt in an interference fit with the hole,
• a flanged joint which allows the flange and bolt to bend;
• and a shear joint in a clevis and tang configuration.
• These applications were initially developed for measuring and monitoring preload in National Aeronautics and Space Administration (NASA) Space Shuttle Orbiter critical joints but are also applicable for monitoring loads in other critical bolted joints of structures such as transportation bridges and other aerospace structures.
• The papers cited here explain how to set-up a model to estimate the ultrasonic load factor and accuracy for the ultrasonic preload application in a clamped joint with clearance fit.
• The ultrasonic preload application for clamped joint with bolt in an interference fit can also be used to measure diametrical interference between the bolt shank and hole, as well as interference pressure on the bolt shank.
• Results of simulation and experimental data are given to demonstrate use of ultrasonic measurements in a shear joint.
• A bolt in a flanged joint experiences both tensile and bending loads. This application involves measurement of bending and tensile preload in a bolt.
• The ultrasonic beam bends due to bending load on the bolt. Results of a numerical technique to compute the trace of ultrasonic ray are presented.
Ajay M. Koshti, NASA Johnson Space Center, Houston, TX. Conference: NESC NDE TDT Face to Face Meeting, Michoud, LAMarch 24, 2015 2

List of Papers Included in This Paper
Ajay M. Koshti, NASA Johnson Space Center, Houston, TX. Conference: NESC NDE TDT Face to Face Meeting, Michoud, LA
Section 1
[11] Koshti, A. M., “Estimation of Accuracy in Ultrasonic Preload Measurements,” Proceedings of SPIE – The International Society for Optical
Engineering, 4335, 300-311 (2001).
Section 2
[12] Koshti, A. M., “Preload Measurement in Sleeve Bolts Using an Ultrasonic Technique,” Materials Evaluation, 54(2), 308-313, (1996).
[13] Koshti, A. M., “Preload Measurement in Sleeve Bolts Using an Ultrasonic Technique,” Proceedings of SPIE - The International Society for
Optical Engineering, 2455, 406-418, (1995).
[14] Koshti, A. M., “Simulation of Ultrasonic Preload Measurement on a bolt in an Interference Fit Joint,” Proceedings of SPIE – The International
Society for Optical Engineering, 4702, 423-437, (2002).
Section 3
[15] Koshti, A. M., “Ultrasonic Measurement of Bending of Bolt in a Shear Joint,” Experimental Mechanics, 36(4), 270-277, (1998).
[16] Koshti, A. M., “Simulation of Ultrasonic Measurement on a Bolt in a Shear Joint,” Proceedings of SPIE – The International Society for Optical
Engineering, 4702, 411-422, (2002).
Section 4
[17] Koshti, A. M., “Effect of Bending on Ultrasonic Preload Measurements in Bolts,” Proceedings of SPIE – The International Society for Optical
Engineering, 4335, 143-154, (2001).
Section 5
[18] Koshti, A. M., “Simulation of Effect of Bending Stress on the Ultrasonic Beam,” Proceedings of SPIE – The International Society for Optical
Engineering, 4702, 148-156, (2002).
March 24, 2015 3
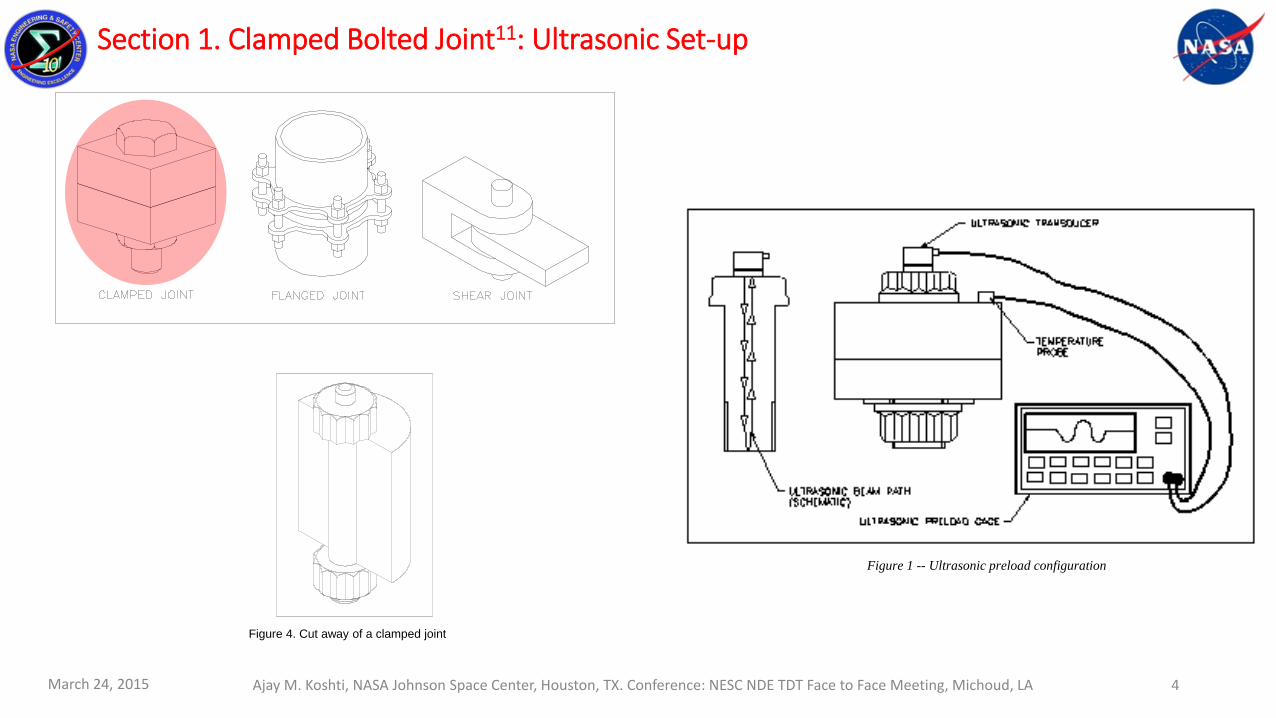
Section 1. Clamped Bolted Joint11: Ultrasonic Set-up
Ajay M. Koshti, NASA Johnson Space Center, Houston, TX. Conference: NESC NDE TDT Face to Face Meeting, Michoud, LA
Figure 1 -- Ultrasonic preload configuration
Figure 4. Cut away of a clamped joint
March 24, 2015 4

Ajay M. Koshti, NASA Johnson Space Center, Houston, TX. Conference: NESC NDE TDT Face to Face Meeting, Michoud,
LA
1. Clamped Bolted Joint11: Ultrasonic Measurement of Bolt Tension, Two Instruments
• Ultrasonic Method
• Couple an ultrasonic transducer to one end of the bolt
• Pulse/echo mode
• Measure the apparent length of the bolt
• Length measurement before and after application of the tension
• Compute ultrasonic stretch
• Preload is proportional to ultrasonic stretch
YLV
V
L
AEKP c
i
mRR
P = Preload, lb,
A = Bolt ross section area, in2’
E = Young’s modulus, lb/in2’
KR = Raymond Stress factor(~0.3 for steel),
L = Bolt effective length under tensile stress, in,
Vm = Ultrasonic velocity in material, in/sec,
Vi = Instrument setting for ultrasonic velocity, in/sec,
δLc = Temperature compensated ultrasonic stretch, in,
Y = Y intercept of calibration linear fit
α = Acoustoelastic constant
ε = Strain.
YLL
LAE
V
VP
c
cmS
1
V
V
m
m
Raymond Boltgage Equation StressTel Boltmike Equation
Raymond Boltgage is predecessor to extensometers by Bidwell Industrial
Group, Middletown, CT, USA) and StressTel Boltmike is predecessor to
extensometers by General Electric Inspection Technology.
March 24, 2015 5
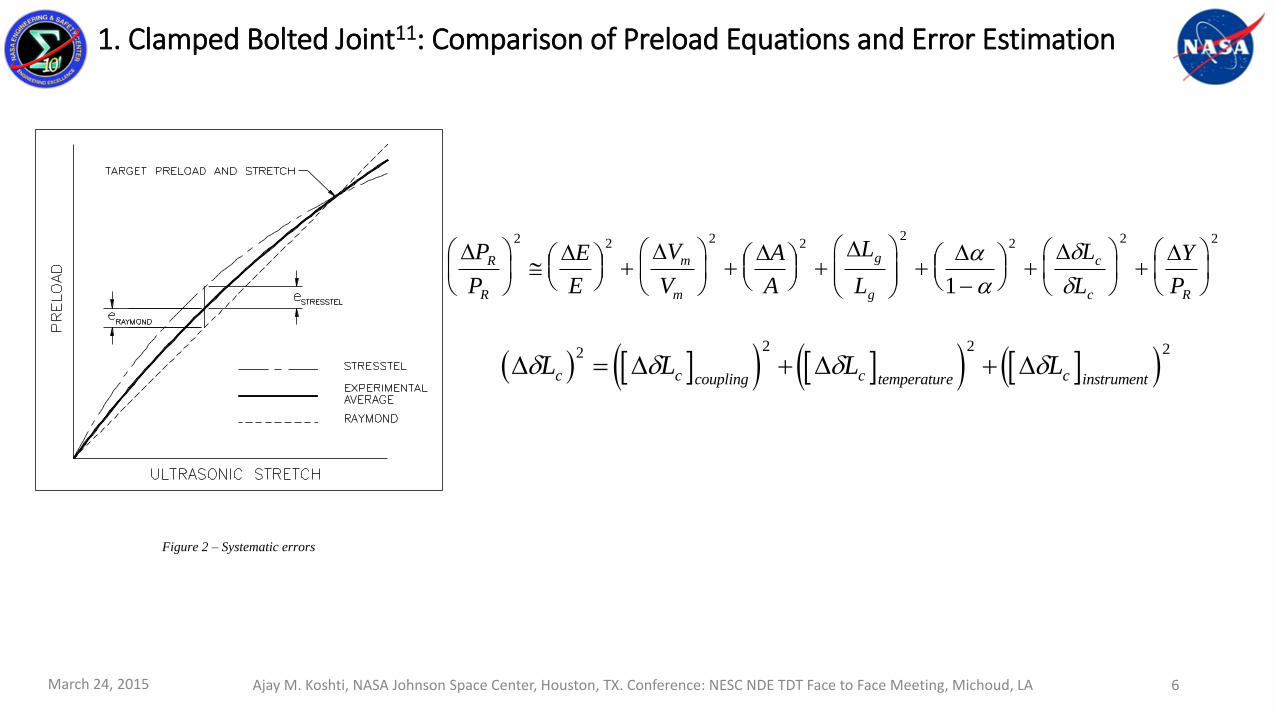
1. Clamped Bolted Joint11: Comparison of Preload Equations and Error Estimation
Ajay M. Koshti, NASA Johnson Space Center, Houston, TX. Conference: NESC NDE TDT Face to Face Meeting, Michoud, LA
Figure 2 – Systematic errors
P
P
E
E
V
V
A
A
L
L
L
L
Y
P
R
R
m
m
g
g
c
c R
2 2 2 22
2 2 2
1
L L L Lc c coupling c temperature c instrument
2 2 2 2
March 24, 2015 6

1. Clamped Bolted Joint11: Example of Error Estimation
March 24, 2015 Ajay M. Koshti, NASA Johnson Space Center, Houston, TX. Conference: NESC NDE TDT Face to Face Meeting, Michoud, LA 7
Parameter Description Parameter
Symbol
Engineering Units SI units
Shank diameter D 0.705 in 17.907 mm
Tolerance on the shank diameter D 0.001 in 0.0254 mm
Velocity setting V 232494 in/sec 5.90535 x 10⁶
mm/sec
Ultrasound velocity in the fastener Vm 232494 in/sec 5.90535 x 10⁶
mm/sec
Tolerance on the ultrasound velocity V 232.494 in/sec 5.90535 x 10³
mm/sec
Young’s modulus E 3.10 x 10⁷ psi 21840.9 kg/mm2
Tolerance on the Young’s modulus E 3.10 x 10³ psi 2.1841 kg/mm2
Effective length LgR 6.12 in 155.448 mm
Tolerance on the effective length l 0.025 in 0.635 mm
Grip correction gR 0.649 in 16.485 mm
Actual length L 8.5 in 215.9 mm
Acoustoelastic constant -2.5714 -2.5714
Tolerance on the acoustoelastic constant 0.00257 0.00257
Tolerance on the instrument calibration Lc instrument 0.0003 in 0.00762 mm
Coupling error for the ultrasonic length Lc coupling 0.0003 in 0.00762 mm
Temperature coefficient Cp 5.4 x 10⁻⁵ /oF 9.72 x 10⁻⁵ /oC
Tolerance on the temperature coefficient Cp 5.4 x 10⁻⁷/oF 9.72 x 10⁻⁷ /oC
Operating temperature Ti 80 oF 26.7 oC
Tolerance on the operating temperature Ti 0.5 oF 0.28 oC
Reference temperature Tr 75 oF 23.9 oC
Targeted preload P 53,000 lb 24091 kg
Computed Parameter Symbol Equation
Number
Engineering Units SI Units
Cross-sectional area A 0.390 in2 251.846 mm2
Stress factor KR 6 0.28 0.28
Fractional tolerance on the stress factor KR/KR 29 0.00092 0.00092
Fractional tolerance on the shank area A/A 27 0.00284 0.00284
Fractional tolerance on the ultrasound
velocity V/V 0.001 0.001
Fractional tolerance on the Young’s
modulus E/E 0.0001 0.0001
Fractional tolerance on the effective
length Lg/Lg 28 0.00457 0.00457
Tolerance on the ultrasonic stretch due to
the coupling Lc coupling
36 0.0004 in 0.010 mm
Tolerance on the ultrasonic stretch due to
the temperature Lc temperature
37, 38, 39 0.0003 in 0.0076
Tolerance on the ultrasonic stretch Lc 34 0.0006 in 0.0152
Estimated ultrasonic stretch Lc 12b 0.0957 in 2.431
Elongation LcKR 12a 0.0268 0.681
Estimated load factor FR 10b 553,651.4 lbf/in 9,907.9 kg/mm
Tolerance on the load factor
F
F
R
R
31 or 32 0.00555 0.00555
Fractional preload measurement accuracy P
P
R
R
33a or 26a 0.00846 0.00846
Preload measurement accuracy PR 33 448 lb 204 kg

Section 2. Ultrasonic Measurements on a Bolt in an Interference Fit Joint12,13,14
Paper covers
• Measurement of preload in interference fit joint bolts
• Includes temperature compensation
• Measurement interference quantities such as
• Diametrical interference and interference pressure
• Includes two configurations
• Case I: Pull one of the ends in a universal testing machine – No nut turning, not a bolted joint
• Case II: Turning/torqueing the nut – Real life bolted joint
• Popularly, for no interference Case I condition is used to approximate Case II!
• Difference between the two cases
• Analytical model for ultrasonic measurements
• Analytical model for clamped joint with no interference is derived as a special case of the above model diametrical interference set to zero.
• Comparison of experiments with the simulation is provided.
Ajay M. Koshti, NASA Johnson Space Center, Houston, TX. Conference: NESC NDE TDT Face to Face Meeting, Michoud, LAMarch 24, 2015 8

2. Interference Fit Joint12,13,14: Cross Section of the Sleeve-bolt Joint and Regular Bolt Joint
lLl
D
ND
Sleeve Bolt Joint
Regular Interference Fit Joint
Ajay M. Koshti, NASA Johnson Space Center, Houston, TX. Conference: NESC NDE TDT Face to Face Meeting, Michoud, LAMarch 24, 2015 9
Two sleevebolts are used to attach forward end of vertical tail
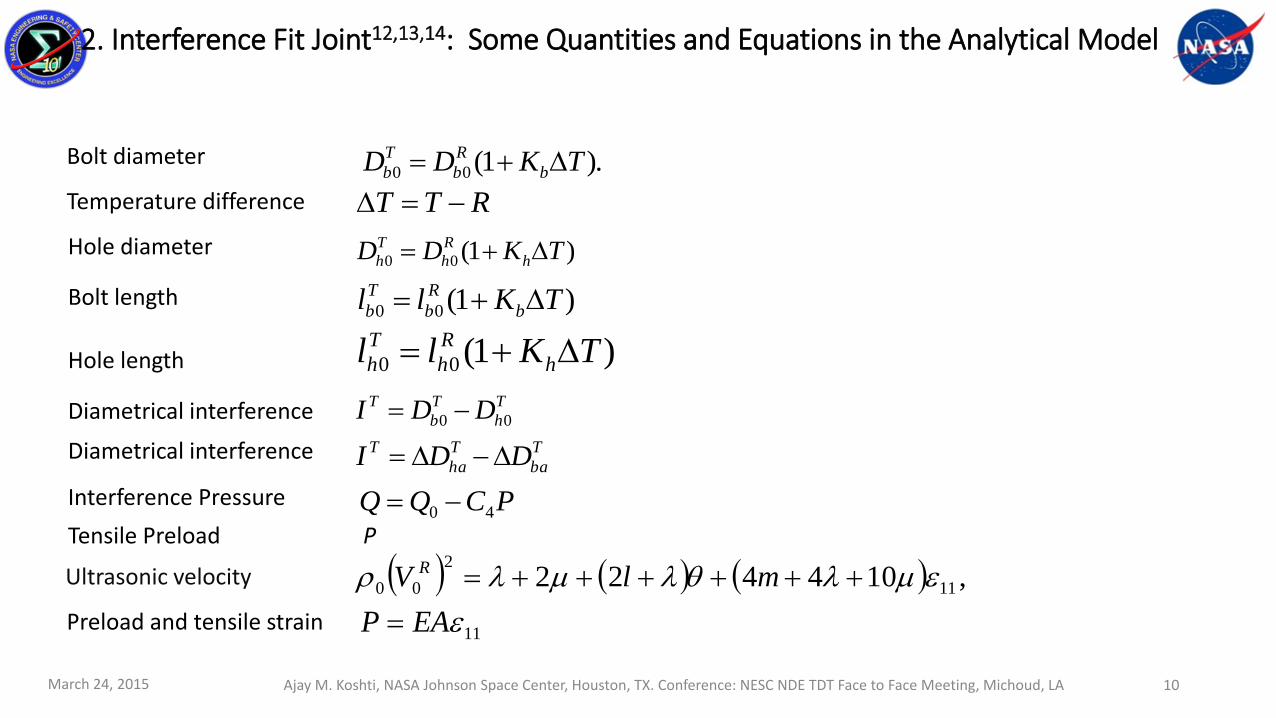
2. Interference Fit Joint12,13,14: Some Quantities and Equations in the Analytical Model
.)1( 00 TKDD b
R
b
T
b
RTT
)1(00 TKll b
R
b
T
b
)1(00 TKDD h
R
h
T
h
)1(00 TKll h
R
h
T
h
Bolt diameter
Hole diameter
Temperature difference
Bolt length
Hole length
T
h
T
b
T DDI 00
T
ba
T
ha
T DDI
PCQQ 40
Diametrical interference
Diametrical interference
Interference Pressure
Tensile Preload P
,104422 11
2
00 mlV R
11EAP
Ultrasonic velocity
Preload and tensile strain
Ajay M. Koshti, NASA Johnson Space Center, Houston, TX. Conference: NESC NDE TDT Face to Face Meeting, Michoud, LAMarch 24, 2015 10

2. Interference Fit Joint12,13,14: Analytical Model for Two Cases
i
R
R
b
b
i
av
V
V
l
AE
L
PW 0
0 1
R
iR
bR
iR
b
iR
cs
i
V
Vl
V
Vl
VtL
011
011
011
110
1
11
1
1
2
Ultrasonic stretch with interference
Load factor without interference
RiR
b
iR
cs
i VVlVtL 0011 12 Ultrasonic stretch without interference
R
i
bn
Te
bsT
i
bn
Te
bs
i
V
V
TKfl
V
V
TK
T
flL
0
11
0
11
1
11
1
1
1
11
1
1
Ri
b
Te
bs
i VVTKlL 011 111
iav LPW
11
0
Re
0
1
hhhh
R
hbTe
bs
TKTKlll
Ultrasonic stretch with interference
Ultrasonic stretch without interference
Load factor
Effective length
CASE I: Bolt Pulled CASE II: Nut Tightened
These expressions are more accurate than used inRaymond and StressTel Boltgages
Ajay M. Koshti, NASA Johnson Space Center, Houston, TX. Conference: NESC NDE TDT Face to Face Meeting, Michoud, LAMarch 24, 2015 11

2. Interference Fit Joint12,13,14: Schematic of Preload Characteristic Curves
All characteristic lines theoretically meet and merge after exceeding a certain load when bolt interference is lost.
Ajay M. Koshti, NASA Johnson Space Center, Houston, TX. Conference: NESC NDE TDT Face to Face Meeting, Michoud, LAMarch 24, 2015 12

2 Interference Fit Joint12,13,14: Analytical Model for Friction and Pressure on Shank
000
0
max QlDfF T
h
T
b
T
0h
T
0b4
NL40L
lfDC5.01
PCQQ
T
0h
T
0b4
NU40U
lfDC5.01
PCQQ
200 QlDfPP T
h
T
bNL
200 QlDfPP T
h
T
bNU
i
mLNLL LPW YLWP i
m
Preload at nut end - Loading
Preload at nut end - Unloading
Frictional force to push bolt out of the hole
Shank pressure during – Loading and unloading
Load Factor - Loading Preload characteristic equation
Ajay M. Koshti, NASA Johnson Space Center, Houston, TX. Conference: NESC NDE TDT Face to Face Meeting, Michoud, LAMarch 24, 2015 13

2. Interference Fit Joint12,13,14: Simulation Run Results for Applied Load Versus the Ultrasonic Stretch for Various Cases
0 0.2 0.4 0.6 0.8 -0.5
0
0.5
1
1.5
2
2.5 x 10 4
Ultrasonic Stretch [mm]
Ap
plie
d L
oa
d [
kg
]
O Loading
___ Average
+ Unloading
0 0.2 0.4 0.6 0.8 0
0.5
1
1.5
2
2.5 x 10 4
Ultrasonic Stretch [mm] A
pp
lied
Lo
ad [
kg
]
…. No interference
___ Interference - average
0 1 2 3 4 5 0
0.5
1
1.5
2
2.5 x 10 4
Difference in Ultrasonic Stretch [micron]
Ap
plie
d L
oa
d [
kg
]
(Case I – Case II)
Very small difference in this case
The two lines theoretically meet and merge after exceeding a certain load whenBolt interference is lost.
Ajay M. Koshti, NASA Johnson Space Center, Houston, TX. Conference: NESC NDE TDT Face to Face Meeting, Michoud, LAMarch 24, 2015 14

2. Interference Fit Joint12,13,14: Simulation Run Comparison with Experiments
R
HP
iL1
Quantities defining the load characteristics Simulation Experiment
Residual preload kg 1127 1123
Assembly stretch mm 0.0260 -
Residual stretch mm 0.0164 0.016
Initial stretch mm 0.0424 -
WL Load factor during loading kg/mm 34,037 34,019
WU Load factor during unloading kg/mm 34,447 34,460
iL2
i
0L
Simulation based on the analytical model compares well with experiments.
Ajay M. Koshti, NASA Johnson Space Center, Houston, TX. Conference: NESC NDE TDT Face to Face Meeting, Michoud, LAMarch 24, 2015 15

2. Interference Fit Joint12,13,14: Analytical Model, Determination of Bolt Interference
• Method to measure the interference between the bolt and hole without removing the bolt.
• The bolt is subjected to a loading/unloading cycle without removing it from the hole.
• The ultrasonic stretch is measured and the load characteristics are plotted.
• Measure the friction F and residual stretch. Using Preload versus ultrasonic stretch plot.
• Determine the maximum interference pressure from the friction using following Eq.
• Determine interference pressure Q0 using following Eq.
• Determine the interference from the interference pressure using following Eq.
max00max QlDfF T
h
T
b
T
h
T
b lfDCQQ 0040max 5.01
300 === CQIII TTT
s
Ajay M. Koshti, NASA Johnson Space Center, Houston, TX. Conference: NESC NDE TDT Face to Face Meeting, Michoud, LAMarch 24, 2015 16
2. Interference Fit Joint12,13,14: Conclusions
• An analytical model for ultrasonic tensile preload measurements on a bolt in a joint given.• The model covers two cases of the joint, with and without the diametrical interference.
• The model accounts for change in the joint temperature.
• Paper provides results of a computer application based on the model that simulates the ultrasonicpreload gage to provide preload from the transit time measurements.
• The model in this paper considers both, the constant effective length (machine pull) and the variableeffective length (nut torque).
• The paper provides an ultrasonic technique to measure the interference pressure and the diametricalinterference of a bolt in a joint.
• The simulated characteristics compare well with the experimental results.
Ajay M. Koshti, NASA Johnson Space Center, Houston, TX. Conference: NESC NDE TDT Face to Face Meeting, Michoud, LAMarch 24, 2015 17
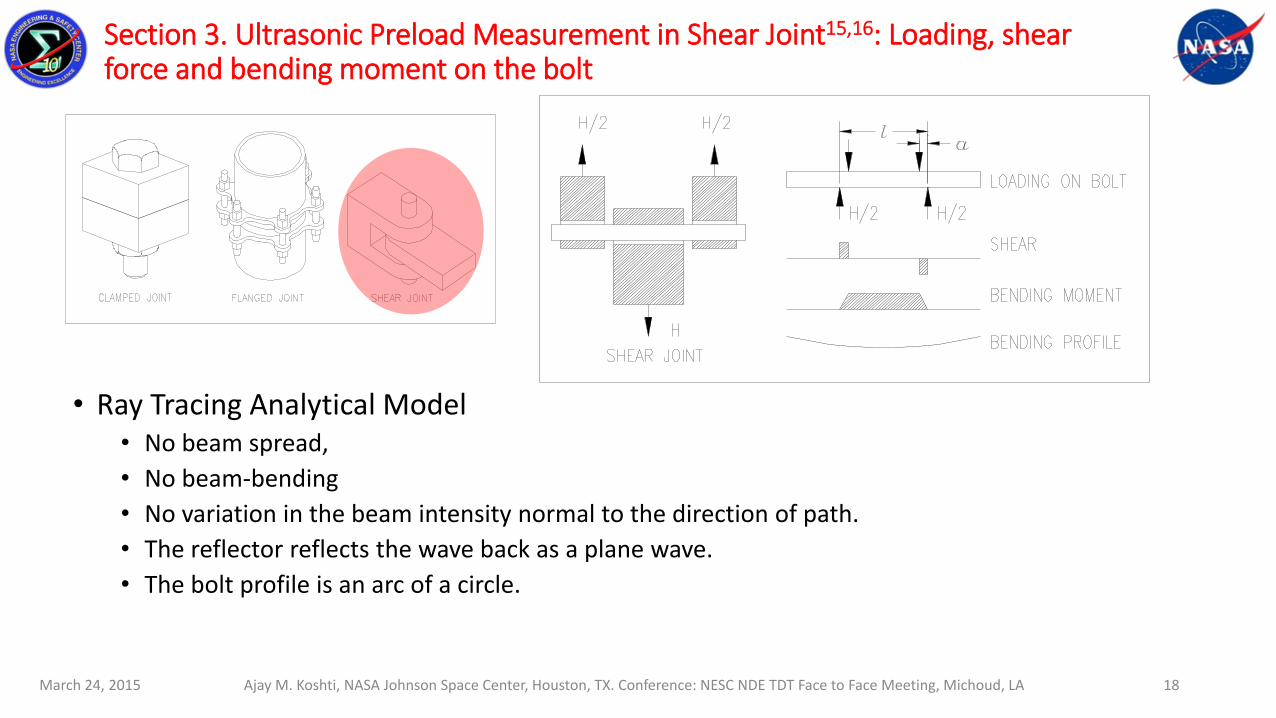
Section 3. Ultrasonic Preload Measurement in Shear Joint15,16: Loading, shear force and bending moment on the bolt
Ajay M. Koshti, NASA Johnson Space Center, Houston, TX. Conference: NESC NDE TDT Face to Face Meeting, Michoud, LAMarch 24, 2015 18
• Ray Tracing Analytical Model• No beam spread,
• No beam-bending
• No variation in the beam intensity normal to the direction of path.
• The reflector reflects the wave back as a plane wave.
• The bolt profile is an arc of a circle.

3. Ultrasonic Preload Measurement in Shear Joint15,16: Ultrasonic Ray Path in a Bent Bolt
Ajay M. Koshti, NASA Johnson Space Center, Houston, TX. Conference: NESC NDE TDT Face to Face Meeting, Michoud, LAMarch 24, 2015 19

3. Ultrasonic Preload Measurement in Shear Joint15,16: Ultrasonic Ray Path in a Bent Bolt
Ajay M. Koshti, NASA Johnson Space Center, Houston, TX. Conference: NESC NDE TDT Face to Face Meeting, Michoud, LAMarch 24, 2015 20

3. Ultrasonic Preload Measurement in Shear Joint15,16: Analytical Model
lR
2tan2tantansin2sin2 1 ACxl
CQ
6
5
3
256230
76544321
1
P
P
P
PV
ds
V
ds
V
PPPPPPPPt
6
5
3
256230
76544321
1 2sec
P
P
P
PV
dy
V
dy
V
PPPPPPPPt
1
123
tan
m
xRy
1
156
tansin2
m
CxRy
2tantan1
2tan2tantansin2sin21
ACRCxx ef
Radius, effective length and bending angle
Ray shift
Ray returning point
Integration increment
Pulse transit time
Pulse transit time
Integration increment
Ajay M. Koshti, NASA Johnson Space Center, Houston, TX. Conference: NESC NDE TDT Face to Face Meeting, Michoud, LAMarch 24, 2015 21

3. Ultrasonic Preload Measurement in Shear Joint15,16: Analytical Model
R
rcVV
c 2
10
cos1
rRr c
I
rM c
av
vcVV 10 1
dzdxtzxutUA
1
'
1 ,,
2
12
1
2
12sin2
),(z
N
ii
r
eN
iic
ixu
Radial Coordinate
Velocity
Velocity
Stress
Received ultrasonic signal
Ajay M. Koshti, NASA Johnson Space Center, Houston, TX. Conference: NESC NDE TDT Face to Face Meeting, Michoud, LAMarch 24, 2015 22

3. Ultrasonic Preload Measurement in Shear Joint15,16: Values of Some Parameters Used in the Simulation
fx1
l mm (in.) 95.5 (3.76)
A mm (in.) 91.95 (3.62)
C mm (in.) 28.45(1.12)
Vo Mm/sec (in./sec) 5905347.6(232494)
E Mpa, kg/mm2 (psi) 21.3729 x 10⁴, 21.8 x 10³, (31 x 106)
c1 -2.45
c 5
N 1024
f Hz 5 x 10⁶
a 1
rz mm (in.) 6.35 (0.25)
xe mm (in.) 1.5 (0.059)
mm (in.) 2.894 (0.114)
m1 40
m2 40
H kg (lb) 45.5, 90.9, 136.4, 181.8, 227.3 (100, 200, 300, 400, 500.0)
I mm4 (in.4) 4.91 x 10³(0.01179)
Radian for 45.45 kg (100 lb) 0.0006455
U/H mm/kg, (in/lb) at 227.3 kg (500 lb) -1.9 x 10⁻⁴ (-3.4 x 10⁻⁶)
Ajay M. Koshti, NASA Johnson Space Center, Houston, TX. Conference: NESC NDE TDT Face to Face Meeting, Michoud, LAMarch 24, 2015 23
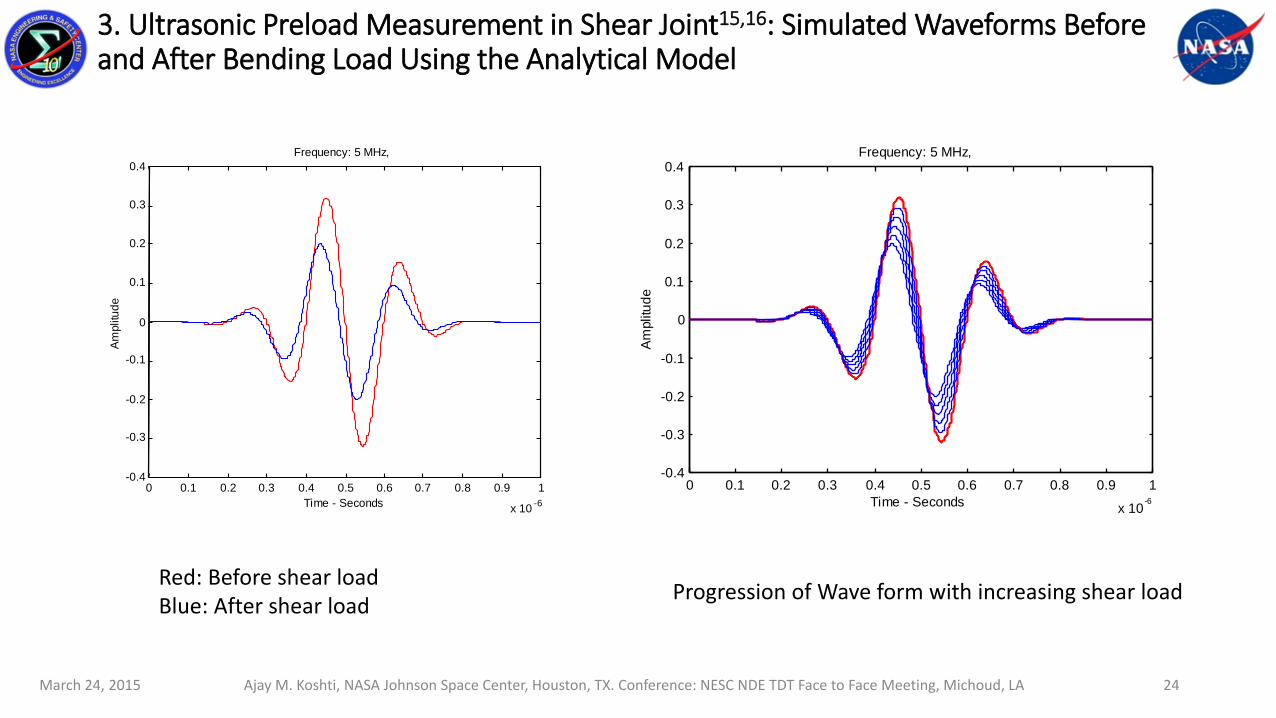
3. Ultrasonic Preload Measurement in Shear Joint15,16: Simulated Waveforms Before and After Bending Load Using the Analytical Model
0 0.1 0.2 0.3 0.4 0.5 0.6 0.7 0.8 0.9 1 x 10 -6
-0.4
-0.3
-0.2
-0.1
0
0.1
0.2
0.3
0.4
Time - Seconds
Am
plitu
de
Frequency: 5 MHz,
0 0.1 0.2 0.3 0.4 0.5 0.6 0.7 0.8 0.9 1 x 10 -6
-0.4
-0.3
-0.2
-0.1
0
0.1
0.2
0.3
0.4
Time - Seconds
Am
plitu
de
Frequency: 5 MHz,
Red: Before shear loadBlue: After shear load
Progression of Wave form with increasing shear load
Ajay M. Koshti, NASA Johnson Space Center, Houston, TX. Conference: NESC NDE TDT Face to Face Meeting, Michoud, LAMarch 24, 2015 24

Ajay M. Koshti, NASA Johnson Space Center, Houston, TX. Conference: NESC NDE TDT Face to Face
Meeting, Michoud, LA
3. Ultrasonic Preload Measurement in Shear Joint15,16: Measurements On a Bolt in a Shear Bending Set-up
• Study effect of bolt bending on ultrasonic measurements• Used slotted, counterbored and stepped end bolts• Used single and dual element transducers in pulse/echo
mode• Simply supported at ends, load in the center• Load from 0 to 455 kg (1,000 lb) with steps of 45.5 kg (100
lb)• 23 runs
March 24, 2015 25
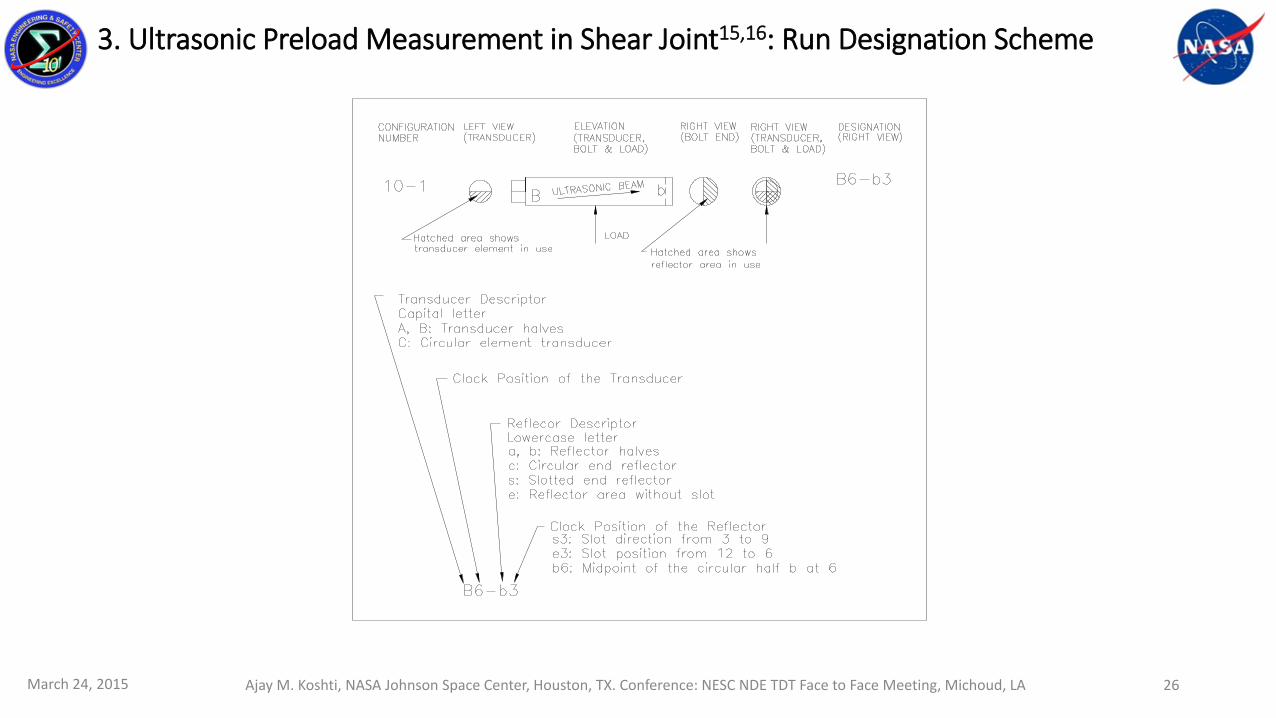
3. Ultrasonic Preload Measurement in Shear Joint15,16: Run Designation Scheme
March 24, 2015 Ajay M. Koshti, NASA Johnson Space Center, Houston, TX. Conference: NESC NDE TDT Face to Face Meeting, Michoud, LA 26

3. Ultrasonic Preload Measurement in Shear Joint15,16: Run Configurations
Ajay M. Koshti, NASA Johnson Space Center, Houston, TX. Conference: NESC NDE TDT Face to Face Meeting, Michoud, LAMarch 24, 2015 27
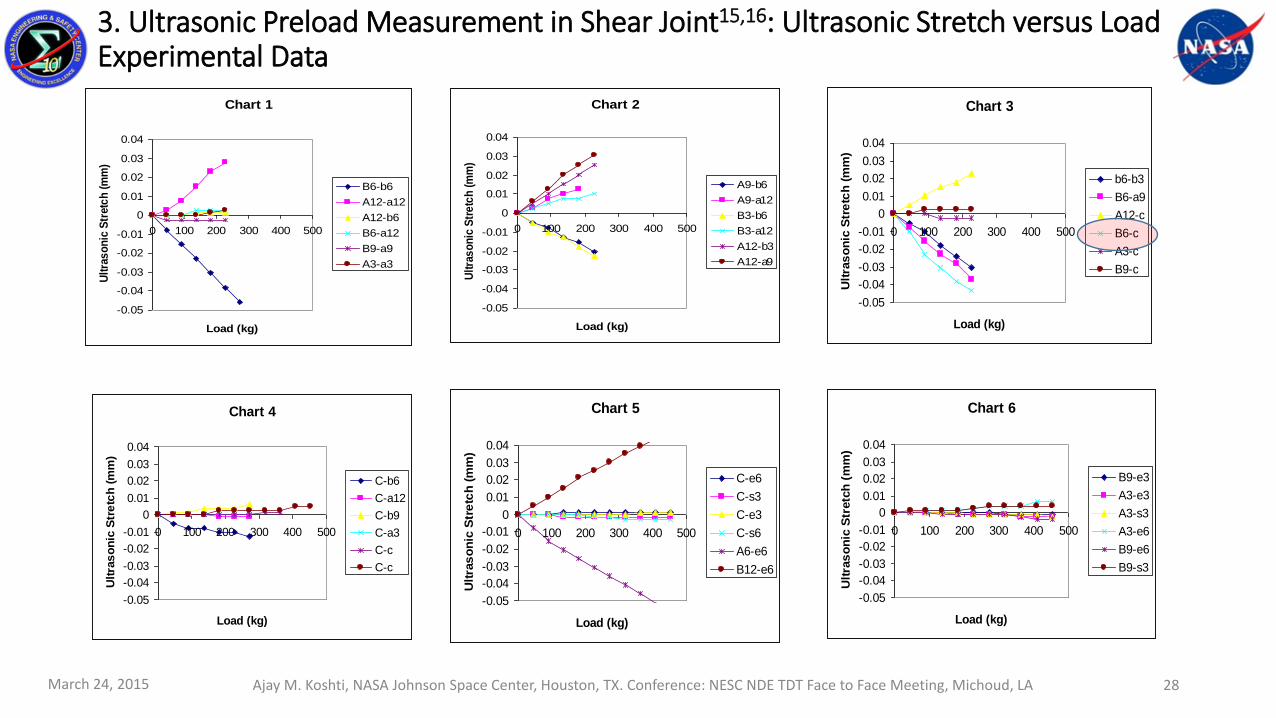
3. Ultrasonic Preload Measurement in Shear Joint15,16: Ultrasonic Stretch versus Load Experimental Data
Ajay M. Koshti, NASA Johnson Space Center, Houston, TX. Conference: NESC NDE TDT Face to Face Meeting, Michoud, LA
Chart 1
-0.05
-0.04
-0.03
-0.02
-0.01
0
0.01
0.02
0.03
0.04
0 100 200 300 400 500
Load (kg)
Ult
ras
on
ic S
tretc
h (
mm
)
B6-b6
A12-a12
A12-b6
B6-a12
B9-a9
A3-a3
Chart 2
-0.05
-0.04
-0.03
-0.02
-0.01
0
0.01
0.02
0.03
0.04
0 100 200 300 400 500
Load (kg)
Ult
ras
on
ic S
tre
tch
(m
m)
A9-b6
A9-a12
B3-b6
B3-a12
A12-b3
A12-a9
Chart 3
-0.05
-0.04
-0.03
-0.02
-0.01
0
0.01
0.02
0.03
0.04
0 100 200 300 400 500
Load (kg)
Ult
ras
on
ic S
tre
tch
(m
m)
b6-b3
B6-a9
A12-c
B6-c
A3-c
B9-c
Chart 4
-0.05
-0.04
-0.03
-0.02
-0.01
0
0.01
0.02
0.03
0.04
0 100 200 300 400 500
Load (kg)
Ult
ras
on
ic S
tre
tch
(m
m)
C-b6
C-a12
C-b9
C-a3
C-c
C-c
Chart 5
-0.05
-0.04
-0.03
-0.02
-0.01
0
0.01
0.02
0.03
0.04
0 100 200 300 400 500
Load (kg)
Ult
ras
on
ic S
tre
tch
(m
m)
C-e6
C-s3
C-e3
C-s6
A6-e6
B12-e6
Chart 6
-0.05
-0.04
-0.03
-0.02
-0.01
0
0.01
0.02
0.03
0.04
0 100 200 300 400 500
Load (kg)
Ult
ras
on
ic S
tretc
h (
mm
)
B9-e3
A3-e3
A3-s3
A3-e6
B9-e6
B9-s3
March 24, 2015 28

3. Ultrasonic Preload Measurement in Shear Joint15,16: Simulation versus Experiment
-0.05
-0.04
-0.03
-0.02
-0.01
0
0 100 200 300
Load (kg)
Ult
ras
on
ic S
tre
tch
(mm
)Experiment
Simulation
Experiment and Simulation of ultrasonic stretch versus load for
run 12 (B6-c)
Ajay M. Koshti, NASA Johnson Space Center, Houston, TX. Conference: NESC NDE TDT Face to Face Meeting, Michoud, LAMarch 24, 2015 29
Ajay M. Koshti, NASA Johnson Space Center, Houston, TX. Conference: NESC NDE TDT Face to Face Meeting,
Michoud, LA
3. Ultrasonic Preload Measurement in Shear Joint15,16: Conclusions
• Ultrasonic measurements can be linear with bending for small amount of bending
• For larger amount of bending the ultrasonic measurements become erratic due to excessive signal distortion
• Although phased array transducers with full matrix capture and custom processing would eliminate the issues with distortion.
• Ultrasonic measurements can be used to measure • Bending loads in some bolts
• Combined tensile and bending loads in some bolts
• The experiment and simulation show a similar relationship between theultrasonic stretch and applied load in the experimental load range.
• The analytical model forms basis for the method of measuring bending loadsusing ultrasonic measurements.
• The model is used here applicable for all shear/bending load configurations given here.
• It would be desirable to incorporate effect of beam-bending in the model
March 24, 2015 30

Section 4. Effect of Bolt Bending in Flanged Joint on Ultrasonic Measurements17
• Shuttle Booster Hold Down Post Bolts
• Orbiter/747 Aft Attach Bolts• Two 2” Dia. Inconel 718 bolts
• Loaded to 115 to 155 kip
• Clamped joint, clearance fit
• Vertical Tail Forward Attach Bolts• Two 1” Dia. MP35N bolts
• Loaded to 50 kip
• clamped joint, interference fit
Ajay M. Koshti, NASA Johnson Space Center, Houston, TX. Conference: NESC NDE TDT Face to Face Meeting, Michoud, LAMarch 24, 2015 31

4. Flanged Joint on Ultrasonic Measurements17: Orbiter/External Tank Umbilical Mate
Orbiter Side Liquid Oxygen Umbilical Plate
Ajay M. Koshti, NASA Johnson Space Center, Houston, TX. Conference: NESC NDE TDT Face to Face Meeting, Michoud, LAMarch 24, 2015 32
Orbiter/ET Umbilical Attach BoltsTwo umbilicals, Left one for liquid hydrogen and Right one for liquid oxygenThree 0.7” Dia. X 8” long MP35N bolts per umbilical, Flanged joint in a clearance fit, 45 to 61 kip loadProvides structural joint and pressure on fluid line seals to prevent leakage. Three bolts of an umbilical are preloaded simultaneously using hydraulic tensioners. The tensioners pull the bolt and allow the nut to be tightened by a small torque.
Umbilical ET Side Locations
Umbilical ET Side Side View
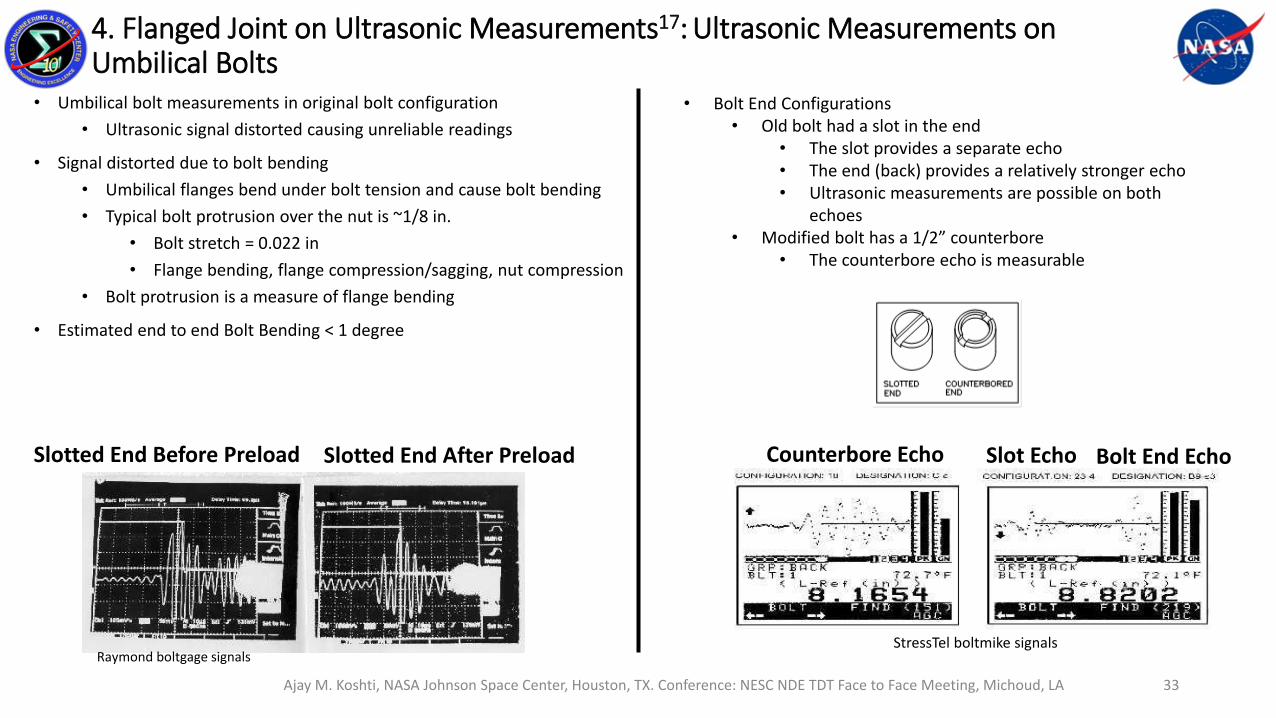
4. Flanged Joint on Ultrasonic Measurements17: Ultrasonic Measurements on Umbilical Bolts
• Umbilical bolt measurements in original bolt configuration
• Ultrasonic signal distorted causing unreliable readings
• Signal distorted due to bolt bending
• Umbilical flanges bend under bolt tension and cause bolt bending
• Typical bolt protrusion over the nut is ~1/8 in.
• Bolt stretch = 0.022 in
• Flange bending, flange compression/sagging, nut compression
• Bolt protrusion is a measure of flange bending
• Estimated end to end Bolt Bending < 1 degree
• Bolt End Configurations• Old bolt had a slot in the end
• The slot provides a separate echo• The end (back) provides a relatively stronger echo• Ultrasonic measurements are possible on both
echoes• Modified bolt has a 1/2” counterbore
• The counterbore echo is measurable
Slotted End After Preload Counterbore Echo Slot Echo Bolt End Echo
Raymond boltgage signalsStressTel boltmike signals
Slotted End Before Preload
Ajay M. Koshti, NASA Johnson Space Center, Houston, TX. Conference: NESC NDE TDT Face to Face Meeting, Michoud, LA
March 24, 2015
33

4. Flanged Joint on Ultrasonic Measurements17: Test Fixtures with Umbilical Joint Hardware
• Simulated Joint with ultrasonic transducer and temperature probe
Long Fixture Short Fixture
Ajay M. Koshti, NASA Johnson Space Center, Houston, TX. Conference: NESC NDE TDT Face to Face Meeting, Michoud, LAMarch 24, 2015 34

4. Flanged Joint on Ultrasonic Measurements17: Short Fixture with Umbilical Joint Hardware
Test Assembly with Ultrasonic TransducerTest Assembly Joint Assembly without Fixture
Top View Assembly Parts Boltmike with Temperature Probe
Ajay M. Koshti, NASA Johnson Space Center, Houston, TX. Conference: NESC NDE TDT Face to Face Meeting, Michoud, LAMarch 24, 2015 35

4. Flanged Joint on Ultrasonic Measurements17: Analytical Model with Geometric and Bending Effect
4
'222tan
2 Qx
SLx
LGb
Phase change due to Geometry and bending effect.
dxdyt,y,xu)t(UA
Ultrasonic signal response.
Ajay M. Koshti, NASA Johnson Space Center, Houston, TX. Conference: NESC NDE TDT Face to Face Meeting, Michoud, LAMarch 24, 2015 36

4. Flanged Joint on Ultrasonic Measurements17: Comparison of Simulated Signals
Effect of Phase Gradient on Ultrasonic Pulse
Time
Am
plit
ud
e
Flat reflector surface normal to beam
Flat reflector surface with slot and off-normal to beam
Beam shift, signal shift, and loss of signal amplitude
Effect of Phase Gradient on a Flat Reflector (Without Slot) Effect of Phase Gradient with Slot
Beam shift, signal shift, loss of signal amplitude, and higher signal distortion.
Geometry Effect• Path length of rays decrease in the compressive
region• Path length increases in the tensile region• Part of the beam is lost due to beam shift• Signal width increases but amplitude decreases
Stress Effect• Bolt tension increases the path length
• Ultrasonic stretch = 3 x Physical stretch• Bolt bending results in bending stress in the bolt
• On tensile region the path length increases• On the compressive side the path length decreases
• The bending stress results in slight bending of the beam away from the compressive side
Ajay M. Koshti, NASA Johnson Space Center, Houston, TX. Conference: NESC NDE TDT Face to Face Meeting, Michoud, LAMarch 24, 2015 37

4. Flanged Joint on Ultrasonic Measurements17: Bolt and Transducer Orientations in the Fixture, End Gap
End Gap Bolt and Transducer Orientations
End gap as a measure of bending load
Short fixture, single element transducer, edge shimmed, Gap closing = 0.203 mm (0.008 in.)
Reference Runs
Run andconfiguration
Fixture Bolt Reflector Reflectorangles
Transducer Transducerangle
Stretch at 54%nominal load,mm (in.)
Stretch at 100%nominal load,mm (in.).
R1A Short Slotted End 72 & -108 Single N/A 0.927 (0.0365) 1.824 (0.0718)R1B Short Slotted Slot -18 & 162 Single N/A 0.917 (0.0361) 1.803 (0.0710)
R2A Short Counterbored
End N/A Single N/A 0.927 (0.0365) 1.867 (0.0735)
Ajay M. Koshti, NASA Johnson Space Center, Houston, TX. Conference: NESC NDE TDT Face to Face Meeting, Michoud, LAMarch 24, 2015 38

4. Flanged Joint on Ultrasonic Measurements17: Summary of Regular RunsRun andconfiguration
Fixture Bolt end Reflector Reflectorangles,Deg.
Transducertype
Transducerangle, Deg.
Relative stretch(%) at 54 % ofnominal load,mm
Relative stretch(%) at 100 % ofnominal load,mm
1A Long Slotted End 72 & -108 Single N/A 4.4 2.8
1B Long Slotted Slot -18 & 162 Single N/A 5.5 4.5
1C Long Slotted End 72 & -108 Dual 72 -4.4 -6.5
1D Long Slotted End 72 & -108 Dual -108 25.2 21.2
2A Long Slotted End 0 & 180 Single N/A 11.0 8.1
2B Long Slotted Slot 90 & -90 Single N/A 8.6 7.6
2C Long Slotted End 0 & 180 Dual 180 14.5 13.0
2D Long Slotted End 0 & 180 Dual 0 11.8 12.8
3A Long Slotted End 72 & -108 Single N/A 4.7 1.9
3B Long Slotted Slot -18 & 162 Single N/A 6.4 5.6
3C Long Slotted Slot -18 & 162 Dual 0 10.2 12.5
3D Long Slotted Slot -18 & 162 Dual 180 3.0 2.8
3E Long Slotted End 72 & -108 Dual 0 7.1 0.8
3F Long Slotted End 72 & -108 Dual 180 7.4 -8.6
4A Long Counterbored End N/A Single N/A 17.0 10.1
4B Long Counterbored End N/A Dual 180 10.4 Distorted
4C Long Counterbored End N/A Dual 0 9.3 Distorted
4D Long Counterbored End N/A Dual 90 5.2 -4.6
4E Long Counterbored End N/A Dual -90 40.3 29.4
5A Short Counterbored End N/A Single N/A 9.86 8.84
5B Short Counterbored End N/A Dual 180 22.7 Distorted
5C Short Counterbored End N/A Dual 0 8.49 Distorted
5D Short Counterbored End N/A Dual 90 -0.82 -7.6
5E Short Counterbored End N/A Dual -90 27.39 22.58
6A Short Slotted End 72 & -108 Single N/A 7.1 1.9
6B Short Slotted Slot -18 & 162 Single N/A 5.0 6.1
6C Short Slotted End 72 & -108 Dual 72 -7.4 -6.1
6D Short Slotted End 72 & -108 Dual -108 23.8 24.8
6E Short Slotted Slot -18 & 162 Dual -18 12.2 12.0
6F Short Slotted Slot -18 & 162 Dual 162 4.2 4.9
7A Short Slotted End 0 &180 Single N/A 7.7 -7.1
7B Short Slotted Slot 90 &-90 Single N/A 7.5 8.5
7C Short Slotted End 0 &180 Dual 180 18.1 19.1
7D Short Slotted End 0 &180 Dual 0 13.2 Distorted
7E Short Slotted Slot 90 &-90 Dual 90 -4.2 -3.4
7F Short Slotted Slot 90 &-90 Dual -90 23.0 23.7
7G Short Slotted End 0 &180 Dual 90 -5.2 -5.0
7H Short Slotted End 0 &180 Dual -90 20.3 20.8
Ajay M. Koshti, NASA Johnson Space Center, Houston, TX. Conference: NESC NDE TDT Face to Face Meeting, Michoud, LA
• Gap closing
• Short fixture: 2.1 mm (0.083 in.)
• Long fixture: 2.74. mm (0.108 in.)
• Three measurement points
• Zero load
• 54% nominal load: 41,370 kPa (6,000 psi) hydraulic pressure
• 100% nominal load: 77,222 kPa (11,200 psi) hydraulic pressure
• Ten regular runs
• Short and long fixture
• One slotted and one counterbored bolt
• Two orientations for the slotted bolt
• Single and dual element transducer in each run
• Many orientations for the dual transducer
March 24, 2015 39

4. Flanged Joint on Ultrasonic Measurements17: Actual and Estimated Relative Stretch
• Used single ray analysis
• Shows some corroboration with the analytical model
• More variation in actual measurements
-0.2
-0.1
0
0.1
0.2
0.3
0.4
-0.5 0 0.5
Actual Stretch, mm
Esti
mate
d S
tretc
h, m
m
Estimated Stretch, mm
Predicted Estimated Stretch, mm
Ajay M. Koshti, NASA Johnson Space Center, Houston, TX. Conference: NESC NDE TDT Face to Face Meeting, Michoud, LAMarch 24, 2015 40
Run andconfiguration
Transducer angle,degree
% ofnominalload
Chosen raydistance x,mm (in.)
Chosenangle q,degree
Ray shift, Q,mm (in.)
Estimatedstretch, mm (in.)
Actual stretch,mm, (in.)
5A N/A 54 -1.01 (-0.04) 0.4 -2.8 (-0.11) 0.083 (0.0033) 0.0914 (0.0036)5A N/A 100 -1.77 (-0.07) 0.6 -4.26 (-0.17) 0.2030 (0.0080) 0.1651 (0.0065)5D 90 54 3.048 (0.12) 0.4 -2.84 (-0.11) -0.0745 (-0.0029) -0.0076 (-0.0003)5D 90 100 4.572 (0.18) 0.6 -4.26 (-0.17) -0.1675 (-0.0066) -0.1422 (-0.0056)5E -90 54 -3.556 (-0.14) 0.4 -2.84 (-0.11) 0.1824 (0.0072) 0.2540 (0.0100)5E -90 100 -2.032 (-0.08) 0.6 -4.26 (-0.17) 0.2178 (0.0086) 0.4216 (0.0166)
Table 3: Comparison of theoretically estimated stretch with actual stretch

Ajay M. Koshti, NASA Johnson Space Center, Houston, TX. Conference: NESC NDE TDT Face to Face
Meeting, Michoud, LA
4. Flanged Joint on Ultrasonic Measurements17: Results and Conclusions
• Results• Relative ultrasonic stretch ranged from -8% to 40%• More relative stretch in certain orientations• Distortion
• More distortion in the signal for certain orientations• Counterbore echo has less distortion than end echo• The slot echo has the least distortion
• Certain slot clocking orientations are more favorable for measurement• Slot measurement: -18 to 162 degrees gives 6.4 % increase• End halves measurement: 72 to 108 degrees 2.8% increase
• Counterbore echo gives stronger echo but gives up to 15.6% increase in the ultrasonic stretch
• Conclusions• Larger reflector gives higher amplitude echo but distortion and relative stretch are high• The end halves give different distortion and relative stretch depending upon the angular
orientation• The distortion is relatively high because of the spacing between the halves and the size of the halves
• The slot gives different distortion and relative stretch depending upon the angular orientation• The slot echo is weak compared to the end echo• The slot echo (8.6% max) has less distortion and relative stretch compared to the end echo (11 % max,
some completely distorted)
March 24, 2015 41
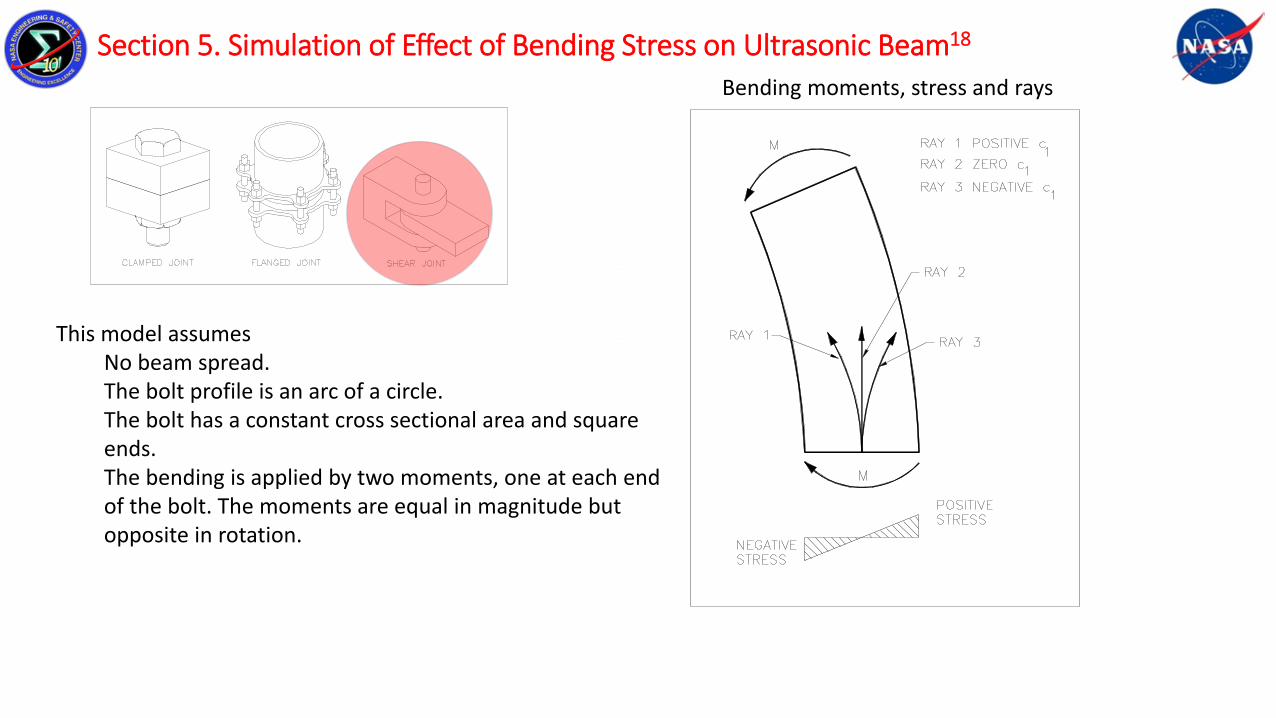
Section 5. Simulation of Effect of Bending Stress on Ultrasonic Beam18
This model assumes No beam spread.The bolt profile is an arc of a circle.The bolt has a constant cross sectional area and square ends. The bending is applied by two moments, one at each end of the bolt. The moments are equal in magnitude but opposite in rotation.
Bending moments, stress and rays

5. Simulation of Effect of Bending Stress on Ultrasonic Beam18 : Ultrasonic Ray, Bolt Geometry and Analytical Model
Ajay M. Koshti, NASA Johnson Space Center, Houston, TX. Conference: NESC NDE TDT Face to Face Meeting, Michoud, LAMarch 24, 2015 43
M r R I/
/lR
EIMl /
E/
RRrf /
vs cVV 10 1
20 /11 dsdrRrbVVs
Rcb /1
Bending stress
Radius, effective length and bending angle
Hooke’s law
Strain
Velocity
Velocity
Bending angle
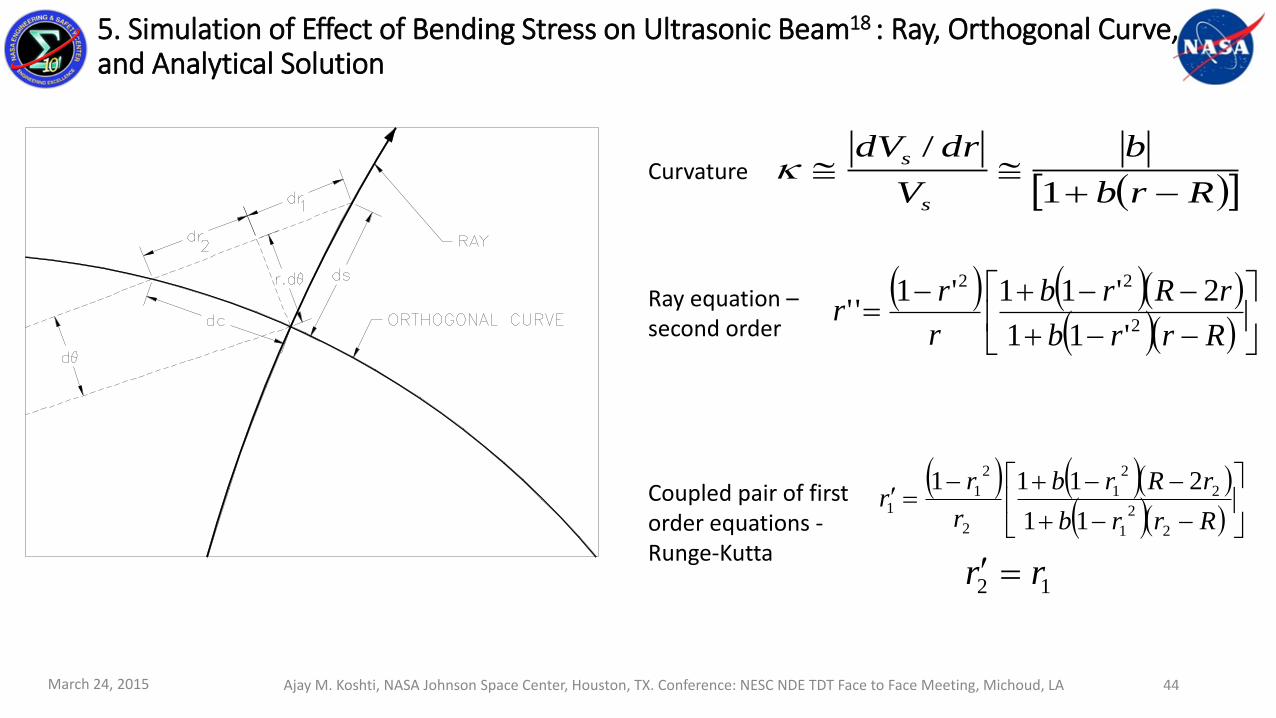
5. Simulation of Effect of Bending Stress on Ultrasonic Beam18 : Ray, Orthogonal Curve, and Analytical Solution
Ajay M. Koshti, NASA Johnson Space Center, Houston, TX. Conference: NESC NDE TDT Face to Face Meeting, Michoud, LAMarch 24, 2015 44
Rrb
b
V
drdV
s
s
1
/
Rrrb
rRrb
r
rr
2
22
'11
2'11'1''
Rrrb
rRrb
r
rr
2
2
1
2
2
1
2
2
11
11
2111
12 rr
Curvature
Ray equation –second order
Coupled pair of first order equations -Runge-Kutta
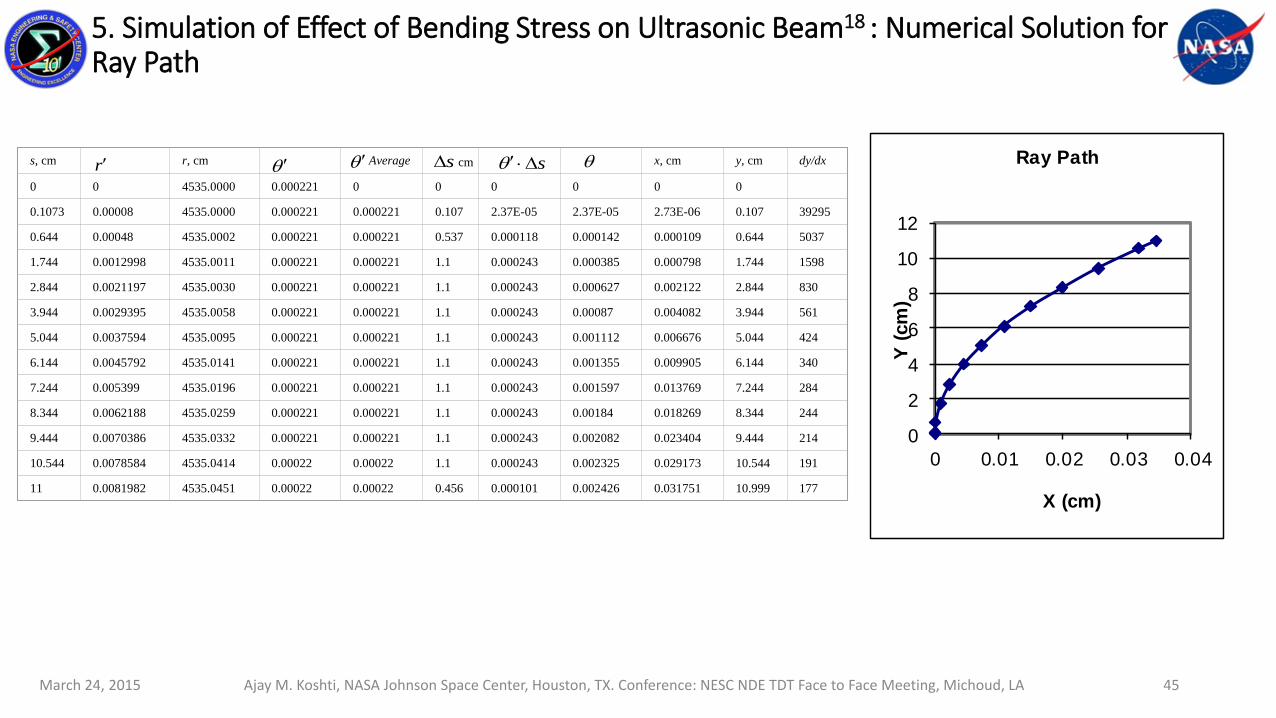
5. Simulation of Effect of Bending Stress on Ultrasonic Beam18 : Numerical Solution for Ray Path
r s s s, cm r, cm Average cm x, cm y, cm dy/dx
0 0 4535.0000 0.000221 0 0 0 0 0 0
0.1073 0.00008 4535.0000 0.000221 0.000221 0.107 2.37E-05 2.37E-05 2.73E-06 0.107 39295
0.644 0.00048 4535.0002 0.000221 0.000221 0.537 0.000118 0.000142 0.000109 0.644 5037
1.744 0.0012998 4535.0011 0.000221 0.000221 1.1 0.000243 0.000385 0.000798 1.744 1598
2.844 0.0021197 4535.0030 0.000221 0.000221 1.1 0.000243 0.000627 0.002122 2.844 830
3.944 0.0029395 4535.0058 0.000221 0.000221 1.1 0.000243 0.00087 0.004082 3.944 561
5.044 0.0037594 4535.0095 0.000221 0.000221 1.1 0.000243 0.001112 0.006676 5.044 424
6.144 0.0045792 4535.0141 0.000221 0.000221 1.1 0.000243 0.001355 0.009905 6.144 340
7.244 0.005399 4535.0196 0.000221 0.000221 1.1 0.000243 0.001597 0.013769 7.244 284
8.344 0.0062188 4535.0259 0.000221 0.000221 1.1 0.000243 0.00184 0.018269 8.344 244
9.444 0.0070386 4535.0332 0.000221 0.000221 1.1 0.000243 0.002082 0.023404 9.444 214
10.544 0.0078584 4535.0414 0.00022 0.00022 1.1 0.000243 0.002325 0.029173 10.544 191
11 0.0081982 4535.0451 0.00022 0.00022 0.456 0.000101 0.002426 0.031751 10.999 177
Ajay M. Koshti, NASA Johnson Space Center, Houston, TX. Conference: NESC NDE TDT Face to Face Meeting, Michoud, LAMarch 24, 2015 45
0
2
4
6
8
10
12
0 0.01 0.02 0.03 0.04
Y (
cm
)
X (cm)
Ray Path
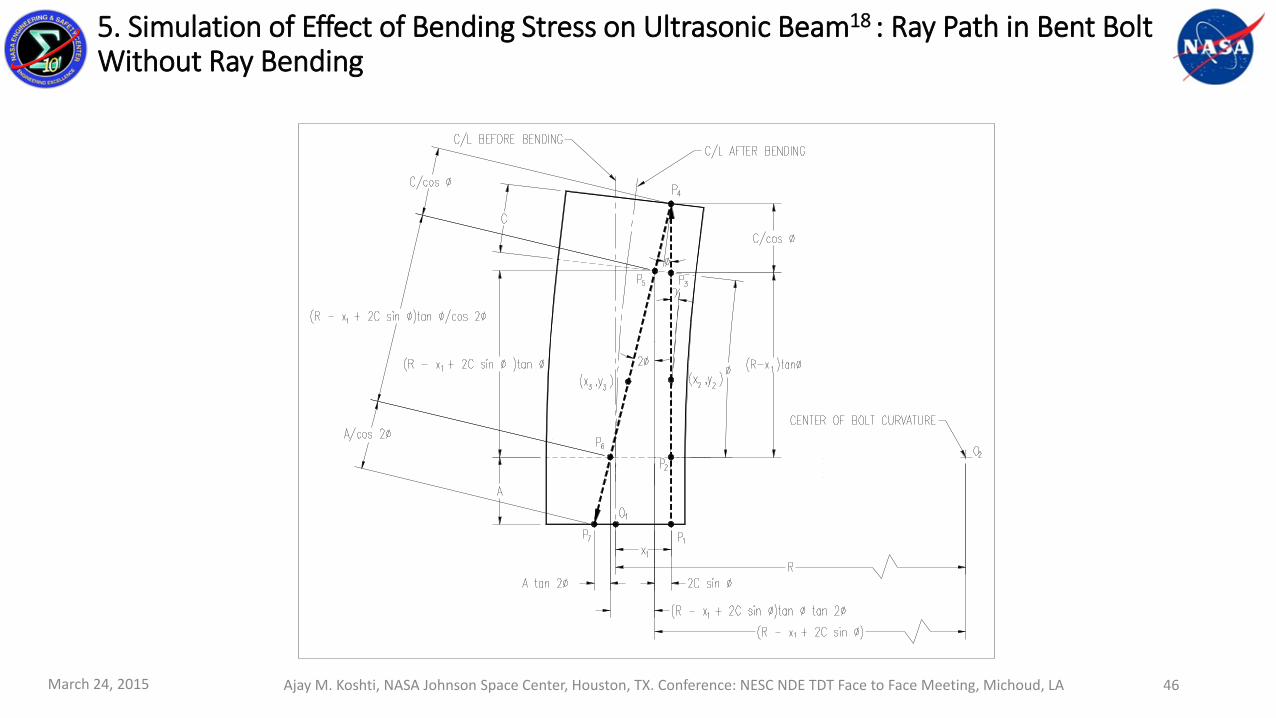
5. Simulation of Effect of Bending Stress on Ultrasonic Beam18 : Ray Path in Bent Bolt Without Ray Bending
Ajay M. Koshti, NASA Johnson Space Center, Houston, TX. Conference: NESC NDE TDT Face to Face Meeting, Michoud, LAMarch 24, 2015 46

5. Simulation of Effect of Bending Stress on Ultrasonic Beam18 : Return Trip of Ray
Ajay M. Koshti, NASA Johnson Space Center, Houston, TX. Conference: NESC NDE TDT Face to Face Meeting, Michoud, LAMarch 24, 2015 47
54321 Q
23 Cl
14
A25
cm012.01
C 2
Ray shift

5. Simulation of Effect of Bending Stress on Ultrasonic Beam18 : Ray Shift
A,
cm
C,
cm
l,
cm
1,cm
2, cm 3, cm 4,cm
5, cm Ray
Shift,
Q cm
10.8 4.4 6.4 0.0014 0.0029 0.012 0.0128 0.0616 0.012 0.0929 0.1912
Effective
length, l
cm
Acm
C
cm
rad R,
cm
Stretch
Slope
mm/kg
%
Difference
from actual
slope
Ray Shift,
Q cm
6.4 10.8 4.4 0.0014 4535 -8.0 x 10⁻⁴ -55.9 0.0616
7.62 10.2 3.81 0.0021 3628 -1.17 x 10⁻⁴ -38.2 0.0887
8.9 9.5 3.2 0.0028 3175 -1.6 x 10⁻⁴ -14.7 0.1208
9.6 9.2 2.8 0.0032 2984 -1.9 x 10⁻⁴ 0 0.1394
Without ray bending
With ray bending
Ajay M. Koshti, NASA Johnson Space Center, Houston, TX. Conference: NESC NDE TDT Face to Face Meeting, Michoud, LAMarch 24, 2015 48

5. Simulation of Effect of Bending Stress on Ultrasonic Beam18 : Conclusions
• The work provides an analytical model that describes the effect of bending stress on the path of an ultrasonic ray.
• The paper attempts to explain the effect of beam bending on the ultrasonic measurements of bending loads in abolt.
• It is shown that the ray bending is a major contributor to the beam shift and therefore affects the stretch slope tosome extent.
• The paper provides a numerical method to trace the path of incident (non-reflected) ray.
• The ray and therefore the beam bend in an opposite direction to the physical bending direction of bolt.
Ajay M. Koshti, NASA Johnson Space Center, Houston, TX. Conference: NESC NDE TDT Face to Face Meeting, Michoud, LAMarch 24, 2015 49

• Ultrasonic preload measurement applications for many bolt configurations are provided in author’s cited papers11-18.
• The first of the applications involves the ultrasonic measurement of preload in the interference fit bolt or sleeve bolt. The friction on the shank of the interference fit bolt affects the ultrasonic preload measurements. A theoretical model, which forms the basis for the application, is provided.
• A second application of bolts in a shear joint is considered. A theoretical model and results of simulation of the bending measurement are provided. The bending measurement theory and the simulation forms the basis for this application as well the flanged joint application.
• A bolt in a flanged joint experiences both the tensile and bending loads. The third application involves measurement of the bending and tensile preload in the flanged joint bolt.
• Ultrasonic beam in a bolt bends due to bending stress in the bolt, if under bending load. A theoretical model governing this phenomenon is given. A numerical technique to compute the ultrasonic beam profile for a beam passing through bending stress is presented.
• A procedure to estimate accuracy of the ultrasonic preload measurements in the original bolt configuration by the two makes of commercial ultrasonic extensometers is provided. The relationships between the corresponding parameters of the two makes are provided. A precise analytical model for computing the preload characteristic curve in the original configuration is also provided.
Conclusions
March 24, 2015 Ajay M. Koshti, NASA Johnson Space Center, Houston, TX. Conference: NESC NDE TDT Face to Face Meeting, Michoud, LA 50