ultrastructural morphometric analysis by transmission...
TRANSCRIPT

Ultrastructural morphometric analysis by transmission electron microscopy associated with stereology methods
N. Nathaly Rigoglio*1, M. V. Mendes Silva1, V. Pavanelo Junior1, S. A. Ferreira Lima1, J. Luiz Nogueira1, R. Avancini Fernandes1 and M. A. Miglino1
1Surgery Department , Faculty of Veterinary Medicine and Animal Science (FMVZ-USP), São Paulo University (USP), Cidade Universitária, Av. Prof. Dr. Orlando Marques de Paiva 87, São Paulo SP 05508270, Brazil. *Corresponding author: [email protected]
The stereology is a method used to quantify uniform, systematic and random samples. Usually use the method a two-dimensional (2D), with limitations. For extrapolated from planar measurements performed on 2D slices images, to three-dimensional (3D), the stereology use a test-system usually composed by test-points, test-lines over a known frame (or test-area). All indices are estimated by the application of specific formulas. However, the accuracy of calculations is based on the statistics principles (sample size, randomization, and isotropy). A new tool that can complement a stereological analysis is transmission electron microscopy (TEM) to obtain ultrastructural information. This technique can be used, for example to quantify morphological changes of mitochondrial component, such as relate it to the ATP synthesis. Furthermore, estimate the mitochondrial volume density (Vvm), numerical density (Nvm), absolute volume (Vm) and numerical density per area (Nam) for each cellular type, to verify if the cells have some differences. This study aimed to describe the importance of the stereology as a method to quantify organelles and other structures.
Keywords: stereology; ultrastructural; mitochondria; transmission electron microscopy (TEM)
1. Introduction
To understand physiological adaptations that occur on the structure of the organs is essential to be able to characterize and quantify the underlying structural changes in the tissues. A common approach is to examine some microscopic sections taken from the organ of interest and to qualitatively describe the structures observed. But the 2D methods have some limitations when are used to quantify biological structures. These can be avoided by stereology, where the stereological methods offer practical and scientifically valid approaches for obtaining accurate, precise quantitative estimates of subtle structural changes in tissues from histological sections [1]. The three-dimensional (3D) representations of cellular ultrastructure are essential for structure function studies in all areas of cell biology, as well as, to obtain quantitative insights into the subcellular localization, geometric arrangement and distribution of cellular components [2]. Stereology is the first choice whenever 3D structural quantities need to be extrapoled from planar measurements performed on 2D slice images [3]. To obtain ultrastrustural information some studies have used the Transmission Electron Microscopy (TEM) [4]. As an alternative to TEM, scanning electron microscopy methods have been developed [2]. The first application of confocal microscopy for stereological measurements was presented by Howard et al. [5] in their concept of unbiased sampling brick. The aim of the sampling design for stereology is to obtain the maximal amount of quantitative structural information at a given total cost or effort [6]. The stereology use a test-system, for example test-points, test-lines over a know frame (test-area). We can estimate densities per volume: volume density (Vv), length density (Lv), surface density (Sv), and numerical density (Nv). And densities per area can also be estimated: area density (Aa) and numerical density per area (Na or Qa) [7,8]. Volume density, Vv, is the volume proportion of one phase within a reference volume. Is also known as volume fraction; Surface density, Sv, is the area of an interface within a unit reference volume; Length density, Lv, is the length of a linear feature within a unit reference volume; for example, the length of fibers per cm3; Numerical density, Nv, is the number of discrete objects in a unit reference volume.
Current Microscopy Contributions to Advances in Science and Technology (A. Méndez-Vilas, Ed.)
© 2012 FORMATEX 309

Table 1 The dimension, units and notation used for some parameters
PARAMETER DIMENSION UNITS TEST SYSTEM
Volume density (Vv) L3/L3= L0 None Points Surface density (Sv) L2/L3= L-1 µm-1 Lines Length density (Lv) L1/L3= L-2 µm-2 Planes
Number density (Nv) L0/L3= L-3 µm-3 Volumes Volume (V) L3 µm3 Surface (S) L2 µm2 Length (L) L1 µm
Number (N) L0 None Connectivity (X) L0 None
Profile density(QA) L/L2= L-2 µm-2 Intersection density (IL) L0/L1= L-1 µm-1
Specific formulas are applied to estimate all indices. However, the accuracy of calculations is based on the statistics principles, such as sample size, randomization and isotropy. The validity and the efficiency (number of samples and counts of interaction with geometric probes) are determined by design-based random sampling. The random samples can be applied at all levels of sampling process, e. g. cut an organ into uniform random slices, select tissues blocks at a set distance, and place a regular pattern of test probes on those sections [3]. Intrinsic distortion of structures can occur due the skrinkage caused by fixation, dehydration and paraffin infiltration, and the compression cause by the knife action in microtomy direction [9], and we can considered this [10].
2. Basic principles
The tissues, structurally, occupy 3D space, associated with length, space and height. But when these structures are sectioned with a microtome, we have a series of 2D planes and the reconstruction of 3D structural information from histological sections is not simple. The position and orientation of the sectioning plane will influence size, shape, and frequency of these 2D profiles. To obtain statistically valid histological sections from an organ to reduce the amount of tissue for analysis without reducing the precision of the estimate are used the statistical sampling principles to guarantee that no bias is introduced in choosing sections or microscopic fields for analysis. According to [11], appropriate geometric probes are superimposed on sections and the number of interactions of the probes with the structural features being estimated is determined. To ensure that probe-structure interactions are random, the position of the relevant probe set is always randomized relative to the structure, that is, the probe sets are randomly positioned onto the sections. There is no direct mathematical relationship between the number of structures profiles counted in a single thin histological section and the number of structures that exist in 3-D tissue space. So, the problem of how to accurately estimate cell number in sections was solved with the development of the disector, a probe based on pairs of thin sections [11]. Conventional transmission electron microscopy (TEM) played an early and essential role in formulating and shaping the concepts of mitochondrial bioenergetics [12]. In many types of cell the mitochondria have different geometric shapes, the predominant being elliptical, spherical and cylindrical. In hepatocytes the mitochondria have cylinder or ellipsoid shape [13], and in lymphocytes it has been treated as spheres [14]. The problem of particle shape heterogeneity is of especial concern to those interested in counting and sizing mitochondria.
3. Material and methods
3.1 Transmission Electron Microscopy
The tissue was cut into a series of slices. A single slice was then divided in blocks, approximately equal in size. After these blocks were rinsed in buffer, and post-fixed in 1% osmium tetroxide in cacodylate buffer for 1 h. Blocks were rinsed, dehydrated in acetone, and embedded in Spurr Resine® (Low Viscosity Embedding Kit, Electron Microscopy Sciences, Hatfield, PA). Ultrathin sections were prepared from randomly area. These sections were mounted on 200-mesh grid (G200-Cu, Electron Microscopy Sciences, Hatfield, PA), stained with uranyl acetate and lead citrate and examined in a electron microscope Morgagni 268 microscope (FEI Company, Oregon, USA) through the Mega View – Soft Imaging System.
Current Microscopy Contributions to Advances in Science and Technology (A. Méndez-Vilas, Ed.)
© 2012 FORMATEX 310

Microphotographs, generally, were taken at a low (x3600), intermediate (x11000) and high (x22000) magnification. The micrographs with low magnification are taking to show the whole cell and the other two magnifications with focus on mitochondria.
3.2 morphometric analysis
Random test points were assigned on the low power micrographs (x3600), and estimates of volume density (VV) of mitochondria in the cells:
Vvm = Pm\Pt
where Pm is the number of points on mitochondria, and Pt is the number of points in the frame [15]. The absolute volume (Vm) for a cellular component can be calculated for the multiplying volume density by organ volume:
Vm = Vvm x V(organ) The number of mitochondria per unit area (Nam) was obtained using random test-points on the intermediate power micrographs (x11000):
Nam = number of points hitting profile Weibel and Gomez [16] developed a formula for deriving the numerical density of particles from the number of objects per unit area (Nam) and their volume density (Vvm):
Nvm = K x Nam 3\2
β Vvm 1\2
The factor K (>1) is a dimensionless coefficient which depends on the mitochondrial size distribution. The shape of the object examined depends on factor β which is therefore variable and should be taken into account when calculating numerical density. Two values of β have been employed, the one appropriate for spheres (β=1.382) and the other for ellipsoids of axial ratio 4:1 (β=2.25). The absolute number of mitochondria can be estimate if the organ (tissue) volume (Vorgan) is known:
Nm = Nvm x V The surface density (SV) of the mitochondrial outer membrane can be estimate on the high power micrographs (x22000):
Svm = 2 x I\Lt
where I is the number of intersections of the structure boundary with the lines, and Lt is the total length of the lines [6]. The surface area of the structure can be estimate using the formula:
Sm = 2 · I x V(organ)
The most complex problems involved in obtaining stereological parameters is the variant of shapes and sizes of biological objects which difficult the determination of numerical density of the structures.
Table 2 Units used to specific parameters
PARAMETERS UNITS Mitochondrial Volume Density µm3/µm3
Mitochondrial Numerical Density no./µm3
Mean Mitochondrial Volume µm3
Mitochondria per cell no.
Current Microscopy Contributions to Advances in Science and Technology (A. Méndez-Vilas, Ed.)
© 2012 FORMATEX 311

3.3 Models of probes
Fig. 2 – Models of probes used to quantify area and volume (A), number estimation (B) and length and surface (C).
BA
C Fig. 1 – Electronmicrographs model for studies related to stereological estimates. A – For volume density (VV) of mitochondria in the cells (x3600); B – For the number of mitochondria per unit area (Nam) (x11000), and C – For the surface density (SV) of the mitochondrial outer membrane (X22000).
Current Microscopy Contributions to Advances in Science and Technology (A. Méndez-Vilas, Ed.)
© 2012 FORMATEX 312
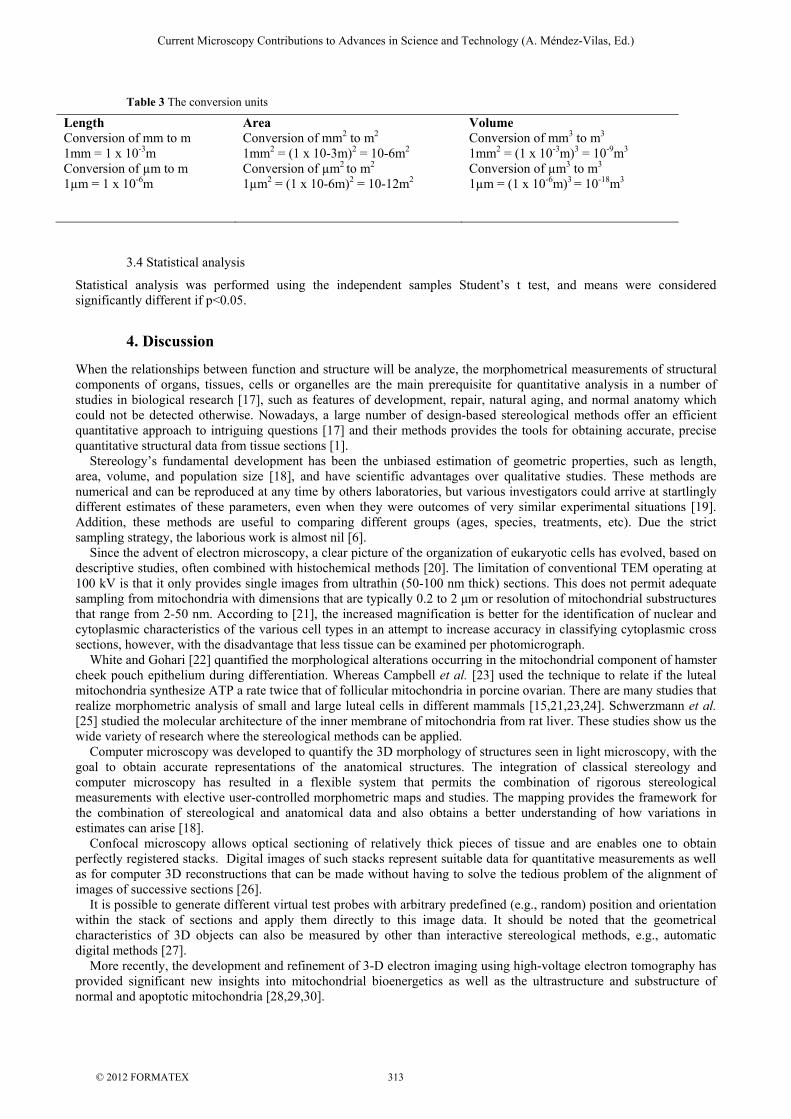
Table 3 The conversion units
Length Conversion of mm to m 1mm = 1 x 10⁻³m Conversion of µm to m 1µm = 1 x 10⁻⁶m
Area Conversion of mm2 to m2 1mm2 = (1 x 10⁻³m)2 = 10-6m2 Conversion of µm2 to m2 1µm2 = (1 x 10⁻⁶m)2 = 10-12m2
Volume Conversion of mm3 to m3
1mm2 = (1 x 10⁻³m)3 = 10-9m3
Conversion of µm3 to m3
1µm = (1 x 10⁻⁶m)3 = 10-18m3
3.4 Statistical analysis
Statistical analysis was performed using the independent samples Student’s t test, and means were considered significantly different if p<0.05.
4. Discussion
When the relationships between function and structure will be analyze, the morphometrical measurements of structural components of organs, tissues, cells or organelles are the main prerequisite for quantitative analysis in a number of studies in biological research [17], such as features of development, repair, natural aging, and normal anatomy which could not be detected otherwise. Nowadays, a large number of design-based stereological methods offer an efficient quantitative approach to intriguing questions [17] and their methods provides the tools for obtaining accurate, precise quantitative structural data from tissue sections [1]. Stereology’s fundamental development has been the unbiased estimation of geometric properties, such as length, area, volume, and population size [18], and have scientific advantages over qualitative studies. These methods are numerical and can be reproduced at any time by others laboratories, but various investigators could arrive at startlingly different estimates of these parameters, even when they were outcomes of very similar experimental situations [19]. Addition, these methods are useful to comparing different groups (ages, species, treatments, etc). Due the strict sampling strategy, the laborious work is almost nil [6]. Since the advent of electron microscopy, a clear picture of the organization of eukaryotic cells has evolved, based on descriptive studies, often combined with histochemical methods [20]. The limitation of conventional TEM operating at 100 kV is that it only provides single images from ultrathin (50-100 nm thick) sections. This does not permit adequate sampling from mitochondria with dimensions that are typically 0.2 to 2 μm or resolution of mitochondrial substructures that range from 2-50 nm. According to [21], the increased magnification is better for the identification of nuclear and cytoplasmic characteristics of the various cell types in an attempt to increase accuracy in classifying cytoplasmic cross sections, however, with the disadvantage that less tissue can be examined per photomicrograph. White and Gohari [22] quantified the morphological alterations occurring in the mitochondrial component of hamster cheek pouch epithelium during differentiation. Whereas Campbell et al. [23] used the technique to relate if the luteal mitochondria synthesize ATP a rate twice that of follicular mitochondria in porcine ovarian. There are many studies that realize morphometric analysis of small and large luteal cells in different mammals [15,21,23,24]. Schwerzmann et al. [25] studied the molecular architecture of the inner membrane of mitochondria from rat liver. These studies show us the wide variety of research where the stereological methods can be applied. Computer microscopy was developed to quantify the 3D morphology of structures seen in light microscopy, with the goal to obtain accurate representations of the anatomical structures. The integration of classical stereology and computer microscopy has resulted in a flexible system that permits the combination of rigorous stereological measurements with elective user-controlled morphometric maps and studies. The mapping provides the framework for the combination of stereological and anatomical data and also obtains a better understanding of how variations in estimates can arise [18]. Confocal microscopy allows optical sectioning of relatively thick pieces of tissue and are enables one to obtain perfectly registered stacks. Digital images of such stacks represent suitable data for quantitative measurements as well as for computer 3D reconstructions that can be made without having to solve the tedious problem of the alignment of images of successive sections [26]. It is possible to generate different virtual test probes with arbitrary predefined (e.g., random) position and orientation within the stack of sections and apply them directly to this image data. It should be noted that the geometrical characteristics of 3D objects can also be measured by other than interactive stereological methods, e.g., automatic digital methods [27]. More recently, the development and refinement of 3-D electron imaging using high-voltage electron tomography has provided significant new insights into mitochondrial bioenergetics as well as the ultrastructure and substructure of normal and apoptotic mitochondria [28,29,30].
Current Microscopy Contributions to Advances in Science and Technology (A. Méndez-Vilas, Ed.)
© 2012 FORMATEX 313

To obtain introductions to the basic concepts of quantification, probes and sampling, we can use as references the following authors [3,31,32,33], whereas to obtain the application we can use as references [34,35].
5. Conclusions
Stereological methods provide the means of efficiently producing quantitative data on the internal structure of organs, tissues, and cells. These methods can easily be applied to cytological work at the electron microscope level of resolution. The techniques of stereology allow quantification of structural features within three-dimensional organs that relate in a meaningful way to integrated function
References
[1] Boyce RW, Dorph-petersen KA, Lyck L, Gundersen HJ. Design-based Stereology: Introduction to Basic Concepts and Practical Approaches for Estimation of Cell Number. Toxicologic Pathology. 2010;38:1011-1025.
[2] Horstmann H, Körber C, Sätzler K, Aydin D, Kuner T. Serial Section Scanning Electron Microscopy (S3EM) on Silicon Wafers for Ultra-Structural Volume Imaging of Cells and Tissues. PLoS One. 2012;7(4): 35172.
[3] Mayhew TM, Gundersen HJG. If you assume, you can make an ass out u and me: a decade of the dissector for sterological counting of particles in 3D space. Journal of Anatomy. 1996;188:1-15.
[4] Inuwa IM, Peet M, Williams MA, QSAR modeling and transmission electron microscopy stereology of altered mitochondrial ultrastructure of white blood cells in patients diagnosed as schizophrenic and treated with antipsychotic drugs. Biotechnic & Histochemistry. 2005;80(3-4):133-137.
[5] Howard CV, Reid S, Baddeley AJ, Boyde A. Unbiased estimation of particle density in the tandem scanning reflected light microscope. Journal of Microscopy. 1985;138:203-212.
[6] Mandarim-de-lacerda CA. Stereological tools in biomedical research. Annals of the Brazilian Academy of Sciences. 2003;75(4):469-486.
[7] Pereira LM, Mandarim-de-lacerda CA. Glomerular profile numerical density per area and mean glomerular volume in rats submitted to nitric oxide synthase blockade. Histology and Histopathology. 2001;16:15-20.
[8] Howard CV, Reed MG. Unbiased stereology. New York: Ed. Bios Scientific Publishers, 2005, 277. [9] Weibel ER. Stereological Methods. Practical Methods for biological morphometry. London: Ed. Academic Press, 1979, 415. [10] Dorph-petersen KA, Nyengaard JR, Gundersen HJG. Tissue shrinkage and unbiased stereological estimation of particle number
and size. Journal of Microscopy. 2001;204:232-246. [11] Sterio DC. The unbiased estimation of number and size of arbitrary particles using the disector. Journal of Microscopy.
1984;134:127-136. [12] Scheffler IE. A century of mitochondrial research: achievements and perspectives. Mitochondrion. 2000;1:3-31. [13] Weibel ER, Stãubli W, Gnägi HR, Hess FA. Correlated morphometric and biochemical studies on the liver cells. I.
Morphometric model, stereological methodsand normal morphometric data for rat liver. The Journal of Cell Biology. 1969;42: 68-91.
[14] Petrzilka GE, Graf-de-beer M, Schroeder HE. Stereological model system for free cells and base-line data for human peripheral blood-derived small T-lymphocytes. Cell and Tissue Reearchs. 1978;192:121-142.
[15] Kenny N, Farin CE, Niswender GD. Morphometric Quantification of Mitochondria in the Two Steroidogenic Ovine Luteal Cell Types. Biology of reproduction. 1989;40:191-196.
[16] Weibel ER, Gomez DM. A principle for counting tissue structures on random sections. Journal of Applied Physiology. 1962;17:343-348.
[17] Mühlfeld C, Nyengaard JR, Mayhew TM. A review of state-of the-art stereology for better quantitative 3D morphology in cardiac research. Cardiovascular Pathology. 2010;19:65–82.
[18] Glaser JR, Glaser EM. Stereology, morphometry, and mapping: the whole is greater than the sum of its parts. Journal of Chemical Neuroanatomy. 2000;20:115–126.
[19] Kubínová L, Janaček J. Confocal microscopy and stereology: estimating volume, number, surface area and length by virtual test probes applied to three-dimensional images. Microscopy Research and Technique. 2001;53:425-435.
[20] Weibel ER. Stereological Methods in Cell Biology: Where Are We-Where Are We Going? The Journal of Histochemistry and Cytochemistry. 1981; 29(9):1043-1052.
[21] Farin CE, Moeller HR, Sawyer F, Gamboni, Niswender GD. Morphometric Analysis of Cell Types in the Ovine Corpus Luteum throughout the Estrous Cycle. Biology of reproduction; 1986;35:1299-1308.
[22] White FH, Gohari K Stereological studies of differentiation in hamster cheek pouch epithelium: variations in the volume and frequency of mitochondria Journal of Anatomy. 1983; 136(4):801-819.
[23] Campbel MD, NeymarK MA, Hill PK, Rothkopf MM, Dimino MJ. Biochemical and Structural Differences Between Porcine Ovarian Follicular and Luteal Mitochondria. Biology of reproduction. 1980;23: 231-235.
[24] O'shea JD, Rodgers RJ, D'occhio MJ. Cellular composition of the cyclic corpus luteum of the cow. Journal of Reproduction and Fertility. 1989;85:438-487.
[25] Schwerzmann K, Cruz-Orive LM, Eggman R, Singer A, Weibel ER. Molecular Architecture of the Inner Membrane of Mitochondria from Rat Liver: A Combined Biochemical and Stereological Study. The Journal of Cell Biology. 1986;102:97-103.
[26] Pawley J (ed). Handbook of biological confocal microscopy, 2 th ed. New York: Ed. Plenum Press. 1995.
Current Microscopy Contributions to Advances in Science and Technology (A. Méndez-Vilas, Ed.)
© 2012 FORMATEX 314

[27] Kubínová J, Janaček J, Ribaric S, Cebasek V, Erzen I. Three-dimensional study of the capillary supply of skeletal muscle fibres using confocal microscopy. Journal of Muscle Research and Cell Motility. 2001;22:217-227.
[28] Perkins G, Renken C, Martone ME, Young SJ, Ellisman M, Frey T. Electron tomography of neuronal mitochondria: three-dimensional structure and organization of cristae and membrane contacts. Journal of Structural Biology. 1997;119:260-72.
[29] Frey TG, Mannella CA. The internal structure of mitochondria. Trends in Biochemical Sciences. 2000;25:319-24. [30] Mannella CA, Pfeiffer DR, Bradshaw PC, Morau II, Slepchenko B, Loew LM, Hsieh CE, Buttle K, Marko M. Topology of the
mitochondrial inner membrane: dynamics and bioenergetic implications. IUBMB Life. 2001;52:93-100. [31] Gundersen HJG. Stereology of arbitrary particles. A review of unbiased number and size estimators and the presentation of
some new ones, in memory of William R. Thompson. Journal of Microscopy. 1986;143: 3-45. [32] Cruz-orive LM, Weibel ER. Recent stereological methods for cell biology: a brief survey. The American Journal of Physiology.
1990;258:148–156. [33] Royet JP. Stereology: a method for analyzing images. Progress of Neurobiology. 1991;37:433–474. [34] Gundersen HJG, Bagger PP, Bendtsen TF, Evans SM, Korbo M, Marcussen N et al. The new stereological tools: disector,
fractionator, nucleator and point sampled intercepts and their use in pathological research and diagnosis. Acta Pathologica, Microbiologica et Immunologica Scandinavica. 1988;96:857-881.
[35] Mayhew TM. A review of recent advances in stereology for quantifying neural structure. Journal of Neurocytology. 1992;21:313–328.
Current Microscopy Contributions to Advances in Science and Technology (A. Méndez-Vilas, Ed.)
© 2012 FORMATEX 315