umalusi site visits to independent schools in 2007
TRANSCRIPT

UMALUSI’S SITE VISITS TO INDEPENDENT SCHOOLS IN 2007
May 2008

UMALUSI’S SITE VISITS TO INDEPENDENT SCHOOLS IN 2007
PUBLISHED BY
37 General Van Ryneveld Street, Persequor Technopark, PretoriaTelephone: 27 12 3491510 • Fax: 27 12 3491511 • [email protected]

COPYRIGHT 2006 UMALUSI COUNCIL FOR
QUALITY ASSURANCE IN GENERAL AND FURTHER
EDUCATION AND TRAINING. ALL RIGHTS RESERVED.

iii
PART ONE: CONTEXTUAL AND THEORETICAL BACKGROUND TO THE SITE VISITS . . . . . . . . . . . . . . . . . . 1
Background to the 2007 site visits . . . . . . . . . . . . . . . . . . . . . . . . . . . . . . . . . . . . . . . . . . . . . . . . . . . . 1
Umalusi’s approach to accreditation and quality assurance (Umalusi, 2006) . . . . . . . . . . . . . . . 2
Background to independent schooling in South Africa (Umalusi, 2006) . . . . . . . . . . . . . . . . . . . . 4
Profi le of non-government provision of secondary schooling in South Africa . . . . . . . . . . . . 5
PART 2: SCOPE, INTENTIONS AND APPROACH . . . . . . . . . . . . . . . . . . . . . . . . . . . . . . . . . . . . . . . . . . . . . 7
Selection of schools . . . . . . . . . . . . . . . . . . . . . . . . . . . . . . . . . . . . . . . . . . . . . . . . . . . . . . . . . . . . . . . 7
Information gathered included: (Umalusi, 2006) . . . . . . . . . . . . . . . . . . . . . . . . . . . . . . . . . . . . . . . 7
Broad aims of the site visits (Umalusi, 2006) . . . . . . . . . . . . . . . . . . . . . . . . . . . . . . . . . . . . . . . . . . . . 8
Specifi c goals of the site visits . . . . . . . . . . . . . . . . . . . . . . . . . . . . . . . . . . . . . . . . . . . . . . . . . . . . . . . 8
Questions that the site visits should clarify . . . . . . . . . . . . . . . . . . . . . . . . . . . . . . . . . . . . . . . . . . . . . 8
Approach to the site visits . . . . . . . . . . . . . . . . . . . . . . . . . . . . . . . . . . . . . . . . . . . . . . . . . . . . . . . . . . 9
Chronology . . . . . . . . . . . . . . . . . . . . . . . . . . . . . . . . . . . . . . . . . . . . . . . . . . . . . . . . . . . . . . . . . . . . . . 9
The unfolding of the 2007 site visit programme . . . . . . . . . . . . . . . . . . . . . . . . . . . . . . . . . . . . . . . . . 10
Limitations . . . . . . . . . . . . . . . . . . . . . . . . . . . . . . . . . . . . . . . . . . . . . . . . . . . . . . . . . . . . . . . . . . . . . . . 10
PART 3: RESULTS OF THE SITE VISIT PROGRAMME . . . . . . . . . . . . . . . . . . . . . . . . . . . . . . . . . . . . . . . . . . . . 11
Orientation . . . . . . . . . . . . . . . . . . . . . . . . . . . . . . . . . . . . . . . . . . . . . . . . . . . . . . . . . . . . . . . . . . . . . . . 11
Demographic and socioeconomic features of the 2007 schools . . . . . . . . . . . . . . . . . . . . . . . . . 11
Enrolment of learners . . . . . . . . . . . . . . . . . . . . . . . . . . . . . . . . . . . . . . . . . . . . . . . . . . . . . . . . . . . . . . . . . 13
Gender of learners . . . . . . . . . . . . . . . . . . . . . . . . . . . . . . . . . . . . . . . . . . . . . . . . . . . . . . . . . . . . . . . . 13
Foreign staff members . . . . . . . . . . . . . . . . . . . . . . . . . . . . . . . . . . . . . . . . . . . . . . . . . . . . . . . . . . . . . 14
Affi liations to school associations . . . . . . . . . . . . . . . . . . . . . . . . . . . . . . . . . . . . . . . . . . . . . . . . . . . . 15
Reasons for establishment of school . . . . . . . . . . . . . . . . . . . . . . . . . . . . . . . . . . . . . . . . . . . . . . . . . 18
Offerings and facilities at schools in 2007 . . . . . . . . . . . . . . . . . . . . . . . . . . . . . . . . . . . . . . . . . . . . . 19
Physical inspection of premises . . . . . . . . . . . . . . . . . . . . . . . . . . . . . . . . . . . . . . . . . . . . . . . . . . . . . . 22
Accreditation, reporting and verifi cation processes . . . . . . . . . . . . . . . . . . . . . . . . . . . . . . . . . . . . . . . 22
Progression data, GET band . . . . . . . . . . . . . . . . . . . . . . . . . . . . . . . . . . . . . . . . . . . . . . . . . . . . . . . . 26
Senior Certifi cate results over three years . . . . . . . . . . . . . . . . . . . . . . . . . . . . . . . . . . . . . . . . . . . . . 29
Failing practices . . . . . . . . . . . . . . . . . . . . . . . . . . . . . . . . . . . . . . . . . . . . . . . . . . . . . . . . . . . . . . . . . . 30
Views of focus groups. . . . . . . . . . . . . . . . . . . . . . . . . . . . . . . . . . . . . . . . . . . . . . . . . . . . . . . . . . . . . . 32
Accreditation . . . . . . . . . . . . . . . . . . . . . . . . . . . . . . . . . . . . . . . . . . . . . . . . . . . . . . . . . . . . . . . . . . . . 36
Internal evaluation of the site visit process . . . . . . . . . . . . . . . . . . . . . . . . . . . . . . . . . . . . . . . . . . . . 36
General perceptions of the site visits . . . . . . . . . . . . . . . . . . . . . . . . . . . . . . . . . . . . . . . . . . . . . . . . . 36
Queries from the schools relating to the site visit . . . . . . . . . . . . . . . . . . . . . . . . . . . . . . . . . . . . . . . . . . 37
Relationships between factors in school performance . . . . . . . . . . . . . . . . . . . . . . . . . . . . . . . . . . 38
Fees and overall enrolment . . . . . . . . . . . . . . . . . . . . . . . . . . . . . . . . . . . . . . . . . . . . . . . . . . . . . . . . . 38
Date of establishment set against fees and endorsements . . . . . . . . . . . . . . . . . . . . . . . . . . . 38
Educator qualifi cations, experience, results . . . . . . . . . . . . . . . . . . . . . . . . . . . . . . . . . . . . . . . . . . . 42
Contents

iv
PART 4: DISCUSSION . . . . . . . . . . . . . . . . . . . . . . . . . . . . . . . . . . . . . . . . . . . . . . . . . . . . . . . . . . . . . . . . . . 46
Issues that emerged from the site visits . . . . . . . . . . . . . . . . . . . . . . . . . . . . . . . . . . . . . . . . . . . . . . . 46
The road ahead for the accreditation and quality assurance process . . . . . . . . . . . . . . . . . . . . 46
School characteristics . . . . . . . . . . . . . . . . . . . . . . . . . . . . . . . . . . . . . . . . . . . . . . . . . . . . . . . . . . . . . 46
Emerging perspectives on quality . . . . . . . . . . . . . . . . . . . . . . . . . . . . . . . . . . . . . . . . . . . . . . . . . . . 47
Educators’ years of experience as an important factor in the pass rate . . . . . . . . . . . . . . . . . . . 48
To what extent were the aims and goals of the site visit programme satisfi ed? . . . . . . . . . . . . . . 48
Aims: . . . . . . . . . . . . . . . . . . . . . . . . . . . . . . . . . . . . . . . . . . . . . . . . . . . . . . . . . . . . . . . . . . . . . . . . . 48
Specifi c goals of the site visits . . . . . . . . . . . . . . . . . . . . . . . . . . . . . . . . . . . . . . . . . . . . . . . . . . . . . . . 49
Questions that the site visits should clarify . . . . . . . . . . . . . . . . . . . . . . . . . . . . . . . . . . . . . . . . . . . . . 50
PART 5: RECOMMENDATIONS . . . . . . . . . . . . . . . . . . . . . . . . . . . . . . . . . . . . . . . . . . . . . . . . . . . . . . . . . . . 52
Where to from here? . . . . . . . . . . . . . . . . . . . . . . . . . . . . . . . . . . . . . . . . . . . . . . . . . . . . . . . . . . . . . . 52
Recommendations for Umalusi’s attention . . . . . . . . . . . . . . . . . . . . . . . . . . . . . . . . . . . . . . . . . . . . 52
General recommendations for improvement made by the schools . . . . . . . . . . . . . . . . . . . . 52
Other possibly useful recommendations . . . . . . . . . . . . . . . . . . . . . . . . . . . . . . . . . . . . . . . . . . . 53
How should Umalusi respond to providers that make false claims for accreditation? . . . . . . . . 54
How should Umalusi respond to the need to improve its monitoring and verifi cation
system? . . . . . . . . . . . . . . . . . . . . . . . . . . . . . . . . . . . . . . . . . . . . . . . . . . . . . . . . . . . . . . . . . . . . . . 54
How should Umalusi respond to unaccredited providers/fl y-by-nights outside the
quality assurance loop? . . . . . . . . . . . . . . . . . . . . . . . . . . . . . . . . . . . . . . . . . . . . . . . . . . . . . . . . . 54
How should Umalusi respond to the main challenges? . . . . . . . . . . . . . . . . . . . . . . . . . . . . . . . 54
Recommendations for consideration by PDEs . . . . . . . . . . . . . . . . . . . . . . . . . . . . . . . . . . . . . . . . . 56
What should the PDEs or the national DoE do? . . . . . . . . . . . . . . . . . . . . . . . . . . . . . . . . . . . . . 56
Provincial subsidies for independent schools . . . . . . . . . . . . . . . . . . . . . . . . . . . . . . . . . . . . . . . 56
Recommendations for consideration by the schools . . . . . . . . . . . . . . . . . . . . . . . . . . . . . . . . . . . 57
Schools’ own responsibilities for improvement . . . . . . . . . . . . . . . . . . . . . . . . . . . . . . . . . . . . . . 57
Recommendations for research . . . . . . . . . . . . . . . . . . . . . . . . . . . . . . . . . . . . . . . . . . . . . . . . . . . . . 57
What future research is needed? . . . . . . . . . . . . . . . . . . . . . . . . . . . . . . . . . . . . . . . . . . . . . . . . . 57
REFERENCES . . . . . . . . . . . . . . . . . . . . . . . . . . . . . . . . . . . . . . . . . . . . . . . . . . . . . . . . . . . . . . . . . . . . . . . . . 59
APPENDIX . . . . . . . . . . . . . . . . . . . . . . . . . . . . . . . . . . . . . . . . . . . . . . . . . . . . . . . . . . . . . . . . . . . . . . . . . . 60
Schools’ raisons d’être and distinctiveness . . . . . . . . . . . . . . . . . . . . . . . . . . . . . . . . . . . . . . . . . . . . . . . 62

1
Part one Contextual and theoretical background to the site visitsWhile the data for this report were approached separately, the report draws heavily on information provided by the comprehensive analysis completed after the 2006 site visits to independent schools because the fi ndings were very similar in many cases. This serves to strengthen arguments made in 2006 and give them even greater emphasis.
BACKGROUND TO THE 2007 SITE VISITS
Umalusi’s Evaluation and Accreditation Unit made site visits to 101 independent schools in 2007. These site visits were part of the formal process of accreditation and focused on schools that had participated for several years as holders of provisional accreditation. This meant that they had submitted self evaluation, progress reports and organisational profi les, and were considered by themselves and Umalusi to be likely candidates for full accreditation. The point of the site visits was, in the fi rst place, to verify information provided by these providers. However, the process also served to continue informing the further management and administration of the process of accreditation and quality assurance that has been developed by Umalusi since 2002. As in 2006, they were intended to enhance Umalusi’s presence in the band and initiate interventions with poorly performing schools. This report will show that they have also increased Umalusi’s understanding of the task and the fi eld. The schools visited in 2007 could be described in general as “good schools”. Hence particular points of interest in this report may revolve around academic issues such as comparing indicators of good practice and in examining implied questions about value for money. There were a few schools, however, that appeared regularly amongst the low scores in most evaluative categories and possibly need further attention from Umalusi.
Once again the project revealed much information that could be useful to authorities and schools and might serve to identify areas for future research and improvement of Umalusi’s processes. Further refi nement of the processes is important because of the implications they hold for the quality assurance of the provision of schooling in South Africa as a whole, not just for private providers. Umalusi has the same responsibility for quality assuring learning in public education as in independent schooling. However, Umalusi develops criteria and monitors policy and implementation but does not accredit public schools. Instead, it must monitor the implementation of quality improvement by provincial departments (the General and Further Education and Training Quality Assurance Act, No. 58, 2001 [hereafter referred to as the GENFETQA Act], Section 22(2) and (5)). By contrast, Umalusi is directly responsible for awarding or withholding the accreditation of independent schools (GENFETQA Act, Section 23 (1) and (7)).
The accreditation of independent schools gives Umalusi the opportunity to develop the practical application of principles and model procedures, and exemplify the values and criteria that it promotes. Recording the work completed during the programme of school visits thus adds value to the process of sharing and guiding the quality assurance of public provision. This is accomplished through inviting the participation of the provincial education departments as evaluators or as observers, as well as through making reports available to provincial education leadership. The reports may, therefore, be seen as a contribution to the development of quality in education nationally rather than in one sector alone.
The accreditation and quality assurance of education providers was unknown in South Africa prior to the GENFETQA Act. Umalusi is, therefore, pioneering an approach and developing criteria for use in South Africa. The reports completed after the site visits enable the process to be monitored and used constructively.

2
It is important for Umalusi and the Ministry of Education to be aware of what is happening within the arena of private provision. This report will show the necessity for informed insight in order to provide sympathetic developmental interventions, as well as to ensure that the potential for exploitative and unscrupulous practices is eliminated or kept to a minimum. Such interventions could further advance the interests of general and further education nationally.
As will be seen in this report, the intentions of the programme of site visits were diverse, and were dominated by the practical and bureaucratic demands of Umalusi’s responsibilities in its actual work in progress on the accreditation of schools. However, questions asked by the monitors and the participating schools during the site visits this year show that the scope of the visits is beginning to broaden, and information is starting to feed into the creation of guidelines for the development of all schools.
The intention behind the selection of schools and the data collected on the site visits was to bring back wide-ranging multi-purpose information to inform the exercise of Umalusi’s responsibilities, not to contribute to theory.
Umalusi’s broad approach to accreditation in the spirit of quality assurance is described in Part 2. The historical background of private provision of education in South Africa is described in Part 3. This is followed by an account of the site visits and the observations that they have yielded in Part 4. In closing, recommendations are made in Part 5.
UMALUSI’S APPROACH TO ACCREDITATION AND QUALITY ASSURANCE (UMALUSI, 2006, p.7-9)
Umalusi, as the body with overarching statutory responsibility for quality assurance in general and further education and training in South Africa, must of necessity explore the possibility and limits of the quality assurance mission. With its legacy from the South African Certifi cation Council (SAFCERT) of quality control at the fi nal point of certifi cation in schooling, Umalusi draws extensively on its insights into the results of the Senior Certifi cate. However, its quality assurance role is most clearly located in its work for accreditation.
Umalusi’s approach to accreditation and quality assurance has been guided by an extended engagement with the literature and debates about accreditation and quality assurance, as well as by frequent consultation with the key stakeholders in the process. Clear lessons from the literature relate to the following:• The newness of accreditation in South African education, and the newness worldwide of the
idea and practices of quality assurance; the adaptation and use of techniques that were initially designed for professions, business and industry require approaches that are cautious, innovative and exploratory. For example, features of the business orientations and values involved in some models of quality assurance are offensive in education, and techniques such as the tendency to focus wholly on inputs and capacity may not be appropriate.
• The primary commitment of quality assurance to improvement and maintenance of quality in the interests of the stakeholders of education.
• The need to recognise that quality assurance comes into its own in situations of rapid social change and policies of greater inclusion and therefore needs to be responsive and fl exible itself. It is essential to provide the confi dence in learning outcomes necessary for fl exible access and growth in learning pathways.
In order to ensure the maximum positive impact of its practices, Umalusi has favoured comprehensiveness rather than a lean approach from the start. This fi ts well with the observation of MacGilchrist, Myers and Reed (1997 in Umalusi, 2006 p.8) that the main message of many studies

3
of school quality “is the danger of concentrating on too narrow a defi nition of achievement when assessing a school’s effectiveness” (p.4). They also stress that knowledge about the characteristics of effectiveness is not enough…
…to strengthen a school’s capacity to raise standards and enhance pupils’ progress and achievement… All important is what a school does with the knowledge; how it uses it to improve its own effectiveness. What marks out the intelligent school is its ability to apply the knowledge and skills it has to maximum effect in classrooms and across the school as a whole. (MacGilchrist et al.,1997, p.110)
The chronology in Part 2 gives an overview of the steps Umalusi has taken in shaping its accreditation practices. In essence, the process of accreditation as set out in Umalusi’s (2004) Framework for the Quality Assurance of General and Further Education and Training involves the application by the provider; the submission of evidence of eligibility for provisional accreditation, including an initial self-evaluation; and a three-year period of monitored self-improvement, systems development and progress reports leading to full accreditation (or refusal of full accreditation). The fully accredited institution then submits periodic reports for further monitoring. (The programme of site visits centred on the verifi cation of self-evaluations and/or progress reports, at least in the case of those schools that had already entered the accreditation process.)
Key features of the approach to accreditation are captured in the following extracts from the Draft criteria for the accreditation and monitoring of independent schools (Umalusi, 2006):
The criteria essentially consist of qualitative measures against which a school’s effectiveness can be determined…
They enable Umalusi to provide an independent account of the quality of education and training, the effectiveness of management and the suffi ciency of institutional results in independent schools. In addition they highlight the strengths, weaknesses and good practice in the sector, to serve as a foundation for improving quality.
They also serve as a benchmark and guideline for school quality management. They are intended to encourage and enable schools to analyse and refl ect on the quality of their provision and management and to guide the development of self-evaluation reports and improvements…
Umalusi Council recognises that while effective systems for the management and improvement of quality are a necessity, of greater importance is the quality of teaching and learning. Teaching and learning is the core business of a school and as such it is the focus of accreditation and monitoring processes...
Umalusi uses school performance indicators as the lens through which it views, measures and monitors the ongoing quality improvement of provision. School performance includes learner success rates, user satisfaction rates and estimates of value for money. Analysed and interpreted over time to establish trends, a profi le of the quality of provision can be drawn and reported on…
The criteria enable Umalusi to report on:• the effectiveness of leadership and governance in raising school performance;
• the effectiveness of self-regulated quality management in securing improvement and user satisfaction; this would include the areas of curriculum, planning and design of learning programmes, teaching and learning, delivery, assessment of learning, learner support, resources and results;
• achievements in terms of standards and learner success; • the extent to which independent schools provide best value for money; and • the extent to which independent schools meet their own objectives and national objectives

4
in refl ecting the requirements and values of the South African Constitution.
The criteria cover four broad areas that form the focus of the accreditation and monitoring processes:
• leadership and management; • the school ethos; • teaching and learning; and • school performance results…
Collectively the information gathered during the evaluation against the criteria should answer the following questions:
• Is the school managing and supporting the quality of its provision effectively? • Does the school meet its own and national objectives as defi ned in its vision and mission
statements? • Does the ethos of the school create an enabling environment for learning and refl ect
appropriate values? • Is the teaching and learning offered by the school of suffi cient quality? (Umalusi, 2006, p.9)
These broad statements are then elaborated in detail and summarised for use. As the detail is picked up in the questions and issues raised in the site visits, it is not necessary to set them out here. The document can be accessed on www.umalusi.org, where it is easy to recognise the extent to which Umalusi has been attentive to the debates and positions outlined above.One of the main intentions of the site visit programme and this report is to examine Umalusi’s progress in the light of the richer, educationally appropriate notions of accreditation and quality assurance.
BACKGROUND TO INDEPENDENT SCHOOLING IN SOUTH AFRICA (UMALUSI, 2006:p.9-10)
During Umalusi’s programme of site visits to independent schools, the UK Department for International Development (DfID) released its study of non-government secondary schooling in sub-Saharan Africa (Lewin & Sayed, 2005). Focusing on South Africa and Malawi, this publication offers a comprehensive survey of private provision of secondary schooling in South Africa itself. Formerly insight could be derived mainly from monographs and argumentative papers. Catholic education has been served by Christie (1990) and Potterton and Johnstone (n.d.). Recently Hofmeyr and Lee (2004) have alerted us to the radically changing profi le of private schooling away from its elite image. Information has otherwise been scattered in the partial records of associations of private providers – notably the Independent Schools Association of Southern Africa (ISASA) – and in the sometimes incomplete provincial registration records.
Lewin and Sayed’s most striking fi nding is of the rapid increase in non-elite non-government provision in South Africa, although the increase would not seem to be nearly as great as in other sub-Saharan states. Comparatively speaking, the policy and regulatory environments for private provision in South Africa, shaped by provisions in the national constitution, are shown to be well-conceived, liberal and possibly even generous in the subsidising of independent schools. On the other hand, there is a complex and ambivalent set of views of private provision among education leadership. At the same time there is uneven capacity in the different provincial departments of education (PDEs) to implement policy on registration, subsidy and monitoring.”
The South African profi les have been extracted from Lewin and Sayed’s exceptionally useful summary tables (as cited in Umalusi, 2006, p.10–11).

5
PROFILE OF NON-GOVERNMENT PROVISION OF SECONDARY SCHOOLING IN SOUTH AFRICA
Size of Sector Relatively small but varied, with between 1 200 and 2 000 providers. Rapid growth from a small base since 1990. New school registrations peaked in 2000, since when growth appears to have slowed. About 6% of independent schools in the sample enrol more than 500 students and a further 41% more than 200. The remainder are small schools, 17% of which have less than 50 students.
Equity Most independent schools operate at mid to high-fee levels, beyond the level of affordability of the poor. Quality and performance are very low in low-fee schools. High cost schools perform as well or better than the best government schools with which they compete.
Access Most independent schools are urban or sub-urban. Few have rural catchment areas and few are in townships. Schools remain characterised by differences in religious and community orientation linked to cost, entrance criteria and location. Low-cost schools have few entry criteria and admit foreign students who can register easily.
Ownership Most independent schools have Christian religious affi liations (71%). About 31% are church owned, 22% are owned by Trusts, 22% by companies and about 25% by individuals or families.
Governance Elite, top-end schools have good governance structures which conform to regulatory requirements. Middle and low-cost schools tend to be commercial, with proprietor governance. Non-government schools generally often have hierarchical management structures with low levels of transparency or staff involvement.
Fees About 21% of schools operate with fees above R20 000, 17% R12 000–R20 000, 24% R6 000–R12 000, 34% R1 000–R6 000, and only 4% below R1 000
Subsidies Low-fee schools depend on subsidies based on fee levels and other criteria including examination performance. Lower fee schools receive the maximum 60% subsidy based on the average cost per student in the Province. Subsidy amounts have been falling, bringing into doubt the fi nancial viability of low-cost schools. If schools receive subsidies they must be registered as non-profi t organisations, which allows tax exemption.
Quality High-cost schools have extensive facilities and very low pupil:teacher ratios. Low-cost providers are often in unsuitable rented accommodation with no sports facilities, specialised rooms or equipment.
Curriculum All schools follow the national curriculum and take South African examinations.* Some high-cost schools may take international qualifi cations. Faith-based schools provide a particular religious ethos. Few but the highest cost schools offer innovatory teaching and learning.
Achievement High-cost schools produce results comparable with the best public schools, many of which are Ex Model C schools. Mid-range schools are comparable or better than average public schools. Low-end independent schools may achieve better than the worst public schools and may fail if they do not.
Teachers Teachers need to be qualifi ed and registered if schools receive subsidies and most are, though they may be temporarily registered whilst upgrading. Their employment falls under labour law. Low-fee schools may have problems paying salaries, especially where subsidies are delayed or not paid.

6
Regulation and Facilitation
The regulatory system in South Africa is extensively legislated and often enforced, especially as it relates to subsidies. It places a signifi cant overhead on providers, especially small schools, to respond to all its requirements. Some aspects of the regulatory system are more inhibiting than facilitating.
* This is not strictly accurate. Some independent schools write foreign examinations.
Looking more closely at the fi gures, Lewin and Sayed (p.25) quote United Nations Educational, Scientifi c and Cultural Organisation (UNESCO) statistics indicating that the proportion of secondary learners enrolled in private schools (compared with national fi gures) in South Africa doubled between 1990 and 2000 – and this at a time of growth in national enrolment. However, they point out that the growth in South Africa is modest compared to a number of sub-Saharan countries.
Lewin and Sayed’s own fi gures (Table 6, p.51) show that independent schools form large minorities within total secondary provision in Gauteng (14,1%) and the Western Cape (8,0%), and are tiny minorities in all other provinces, with by far the lowest proportion in the Eastern Cape (0,5%).
Probably the most interesting single set of fi gures relates to fees. This indicates that schools with annual fees above R30 000 represent only 6.4% of independent secondary schools, while schools with fees below R6 000 represent 37.9%. (Lewin & Sayed, Table 8, p.52.)
Lewin and Sayed’s categorisation of independent secondary schools in relation to fees, religious affi liation and ownership is revealing, and is again worth quoting in full:
The following categories emerge when fees are cross-tabulated with religious affi liation.
• Elite schools: 35% of schools charging over R20,000 per annum were Anglican; most of the rest were inter-denominational Christian; 14% claimed to be secular;
• Top-end schools: 46% of schools charging fees between R12,000 and R19,999 were classifi ed as inter-denominational Christian; 39% were Catholic;
• Upper middle: 36% of schools charging fees between R6,000 and R11,999 were inter-denominational Christian; 24% were charismatic; and 19% were Catholic;
• Lower middle: 65% of schools charging fees between R1,000 and R5,999 were classifi ed as inter-denominational Christian.
Anglican, Methodist and Jewish schools are concentrated in the highest fee range. Over half (54%) of Catholic schools in the sample charge above R12,000 as do 58% of secular schools. 46% of interdenominational schools and 48% of charismatic schools charge below R6,000…
…when fees are cross-tabulated with ownership: • High-cost schools are most commonly owned by Churches and Trusts, very few are privately
owned; • Upper-middle fee schools are predominantly Church owned; • Lower-middle fee schools are mostly owned by individuals or families. (Lewin & Sayed, 2005,
p.52–53 in Umalusi, 2006:p.12).

7
Part 2Scope, intentions and approach
SELECTION OF SCHOOLSInitially, 150 schools were recommended as accreditation candidates, subsequent to Umalusi’s desktop evaluation. However, some of these schools were found not to have full compliance with one to fi ve provisional accreditation criteria. Accreditation candidates with full compliance in all the areas were therefore prioritised and, to a limited degree, some schools were included as they did not fully comply with the criteria in only one or two areas.
The 101 remaining schools in this group comply with the provisional accreditation criteria in that they have all applied for accreditation, submitted a detailed portfolio of evidence to Umalusi and, as a result of a desktop evaluation, were found to comply in all respects with the provisional accreditation criteria.
Site visits to verify self evaluation information have been conducted and these schools are now confi rmed as accreditation candidates. Some schools started this process three years ago; others applied in 2006. Ninety-six of the schools appear to be almost ready for full accreditation. This will entail their completing the Self Evaluation Part B (with a particular focus on the effectiveness of teaching and learning) and undergoing a comprehensive site visit. Full accreditation will only be granted once the Minister has approved the full accreditation criteria.
In completing the present report, information contained in site visit booklets together with data contained in descriptive profi les completed by each school was analysed both quantitatively and qualitatively. However, as this year’s group of schools consisted of schools that consider themselves to be in a high state of readiness for full accreditation, the fi ndings are relatively bland and lack some of the contrasts that made the 2006 report interesting. For example, very few schools have less than a 100% matriculation pass rate, and there are few exceptions to high ratings by the evaluators.
The 2007 site visit programme yielded several hundred items of information for each school.
INFORMATION GATHERED INCLUDED: (UMALUSI, 2006)a) Extensive contact detailsb) Information about accreditation status, ownership, location, for-profi t status and other data
refl ecting the nature and status of the school, such as pass rate in the Senior Certifi cate in 2005, fees, subsidies, date of establishment, affi liations and subject offerings
c) Demographic and other information about learners and educatorsd) A range of details about performance over time in external examinationse) Details about facilities and resourcesf) Extensive information about compliance of provisionally accredited schools with requirements
and process for full accreditationg) Information about the schools, examining matriculation results with exemption, including pass
rates over three years. (Umalusi, 2006, p.13)
Most of the information in points a to g is presented and analysed in Part 3.

8
BROAD AIMS OF THE SITE VISITS (UMALUSI, 2006)There were four broad aims in conducting the site visits to independent schools in 2007.1. For the fi rst time, after several years of participation, schools that were ready needed to be
moved into the fi nal stages of full accreditation.2. More broadly, Umalusi must be seen to exercise its statutory responsibility to quality assure
education and training in the general and further education bands. This includes a range of tasks concerned with monitoring and developing the validity of certifi cation and, more generally, promoting the meaningfulness of what happens in South African education provision:
(i) The accreditation of independent schools (ii) Guiding the improvement of public schools according to the same criteria (iii) Moderating and certifi cating exit examinations (iv) Quality assuring the work of assessment bodies (v) The Evaluation and Accreditation Unit was committed to carrying forward its work in
progress on the accreditation of independent schools, notably by monitoring the response to the fi rst two steps in the development of Umalusi’s accreditation role.
3. In the interests of its mission, Umalusi needed to continue its more proactive and visible role in the quality assurance of independent schools
4. There was also the ongoing need to develop and sustain Umalusi’s own institutional capacity in terms of a more concrete understanding of the nature of the sector and to give shape to its practices; the present programme will inform the processes in subsequent rounds. (Umalusi, 2006, p.14)
SPECIFIC GOALS OF THE SITE VISITSThe specifi c goals of the site visits were to:1. Start to develop an endogenous set of benchmarks for good practices in independent
schooling2. Verify the accuracy of information provided by provisionally accredited schools as submitted in
self-evaluation reports and, in the light of this,3. Assess the initial impact of, and response to the three-year provisional accreditation process
launched in 2005.
QUESTIONS THAT THE SITE VISITS SHOULD CLARIFY Highly concrete and practical questions needed answers or clarifi cation:• Verifi cation of provider information: o Is there a correlation between accreditation and results where available? o Are the claims made by provisionally accredited providers during self-evaluation true? o To what extent are the data consistent with the self evaluation? o Are schools as compliant as they claim to be?
• Effective strategies for dealing with the situation: How should Umalusi respond to: o The need to improve its monitoring and verifi cation system? o Promoting good practices in the sector? o Future research? And what should the PDEs or the national Department of Education (DoE) do? o About improving “systems” for private schools o Implications for the public schools
1 Consultations in the follow-up to Umalusi’s 2005 evaluation of assessment bodies led to agreement that the standard quality assurance term “best practices” might be useful in an industrial situation, but that the diversity and contextual variation in education meant that the term “good practices” was more suitable.

9
APPROACH TO THE SITE VISITS• Selection and training of evaluators and moderators: Umalusi selected evaluators and monitors who: o Are current senior teachers and principals at their schools o Are suitably experienced and qualifi ed o Have considerable experience with Umalusi’s quality assurance programmes
In addition, the PDEs were invited to monitor a sample of site visits.
The site visits were organised on a provincial basis. Each of the participating provinces had a panel of evaluators and at least one monitor to oversee and quality assure the work of the evaluators.
The training of the evaluators and monitors included developing an understanding of Umalusi’s mandated role, the objectives of the site visits, their roles and responsibilities in conducting the site visits and report writing. In the interests of confi dentiality and fairness evaluators and moderators were required to sign an oath of secrecy and a code of ethics.
Evaluators and monitors shared constructively in the creation of the procedures and questionnaires. A preliminary report on the data analysis was discussed at a plenary workshop of evaluators and other participants in the process. Feedback from the workshop informed further investigation and interpretation of the data. A short progress report was sent to the Umalusi Council which appeared to have been satisfi ed with the process thus far.
While the observations from the visits begin to provide useful indications of what constitutes good practice, interesting trends that are developing and challenges that exist in the fi eld in the interests of creating guidelines for the development of all schools, the fi ndings cannot be generalised to be representative of the independent schools’ sector in South Africa.
CHRONOLOGYThe chronology is taken from The development of Umalusi’s accreditation practices (Umalusi, 2006, p.17):
2001: The idea of accreditation of independent schools is implicit in the GENFETQA Act.
2002: Umalusi starts to conceptualise policy and create capacity and structures for accreditation.
2003: Umalusi commences with provisional accreditation.
2004: Umalusi is restructured to create an Evaluation and Accreditation Unit. Provider workshops are held for the fi rst time and provisionally accredited schools are requested to conduct a self-evaluation for submission in 2005. Umalusi starts the ongoing consultative process for developing the Accreditation and Monitoring Criteria for Independent Schools.
2005: The accreditation framework and accreditation and monitoring criteria are fi nalised and approved by the Council; independent schools submit their fi rst self-evaluation reports, which are evaluated and reported on. Provisional accreditation and provider workshops continue.
2006: A sample of 100 independent schools with highly contrasting profi les is involved in an intensive site visit programme intended to clarify questions about the sector and test Umalusi’s procedures.

10
THE UNFOLDING OF THE 2007 SITE VISIT PROGRAMME2007: Provisional accreditation continues; the second programme of site visits is undertaken,
with the following schedule:
Month Activity
June/July 2006 • Evaluation of portfolios of evidence submitted by accredited schools • Fully compliant schools are recommended for a verifi cation site visitMarch 2007 • Initial planning for the verifi cation site visitsApril 2007 • Appointment and training of site evaluators and monitorsApril 2007 • PDEs notifi ed about the site visits and also invited to participate as
observersMay 2007 • Verifi cation site visits to fully compliant schools • Feedback from schools about site visits at their schools • Umalusi offi cials visit randomly selected schools to ensure that site visits
conducted in accordance with Umalusi requirementsMay 2007 • Debriefi ng session with monitors and report writers • Report by monitors on initial challenges and strengths of the verifi cation
site visitsJune 2007 • Receipt of site visit reports, monitor reports and completed feedback
forms from schoolsJune–August 2007 • Appointment of a moderator and moderation of site visit reportsJuly 2007 • Submission of site visit profi les and site verifi cation reports to Khulisa for
data capturingJuly 2007 • Plenary meeting with site evaluators, monitors and report writers • Report on emerging trends – consolidated site visit reportAugust 2007 • PDEs informed about the provincial workshops and also invited to attendSeptember 2007 • Annual provincial workshops with all independent schoolsNovember 2007 • Preliminary report to Umalusi Council
LIMITATIONSThe aims and goals of the 2007 site visit programme described above illustrate how the visits contribute to the development of Umalusi’s capacity to conduct informed, developmental processes in its work in accreditation and school improvement. The present report attempts to present as much of the information emerging from the survey as possible.
The insights yielded relate only to the 2007 group of schools, with all its idiosyncrasies, and cannot be generalised to be seen as representative of the whole sector. In addition, there are inevitable constraints as well as benefi ts in using peer evaluators in a competitive sector. The monitors and evaluators were nonetheless well qualifi ed, and all appear from the qualitative data to have been fair minded in general in their assessment.
In spite of the limitations, the data is analysed as fully as possible in Part 3.

11
Part 3Results of the site visit programme
ORIENTATIONThis section describes and analyses the data gathered during the site visits. The fi ndings will be discussed in Part 4. The description draws in the fi rst place on the quantitative data, but supplements this with qualitative insights from the site visit booklets and from the plenary workshop of monitors and evaluators.
The data collected from the group of schools selected in 2007 has been analysed in particular using fees as a divider. In 2006 it was possible to use Senior Certifi cate results, province and Umalusi accreditation status as analytical categories. In 2007, 35 of the schools were primary schools, while the remaining schools were good to high achievers on the Senior Certifi cate. This limited the capacity of the matriculation results to provide insights. All the schools had the same accreditation status with Umalusi, and province was quite arbitrary (with the vast majority of schools that put themselves forward for accreditation being in Gauteng and KZN). These two categories were therefore completely unhelpful for purposes of analysis.
The use of fees in the analysis in no ways indicates a preoccupation with fees. Fees simply provided the single most interesting basis for gaining insight into the profi les of the schools involved.
DEMOGRAPHIC AND SOCIOECONOMIC FEATURES OF THE 2007 SCHOOLSIn this group of schools, Gauteng has the highest number of schools represented (44) and, not surprisingly, has the highest number of schools where the annual fees are high, with 13 of the 44 schools having fees of R40 000–R50 000+ per annum. KZN was represented by 24 schools, of which only fi ve had fees in the top bracket. There were no other schools with fees at this level. Nine schools were included from the Western Cape and 19 schools were found in other provinces. These 28 schools were fairly evenly distributed between the four lower fee levels (Table 1).• Of the schools in the 2007 group, 35 are primary schools, 16 are high schools and 49 are
combined primary and high schools. It is interesting to note that as many as 28 (57%) of the combined schools have fees in the two lower levels, that is below R19 999 per annum.
• Of the 101 participating schools, 85 were described by evaluators as being non-profi t public benefi t organisations (PBOs), which is interesting seeing that 15 of these 86 schools have fees at the highest levels. In contrast, 44 of the schools have fees below R20 000 per annum. Only 15 were classifi ed as being for profi t and three of these have relatively low fee levels of R40 000 and R49 000 per annum.
Table 1: Basic information according to fee levels
Fee level* 1 2 3 4 5 6 Total
School level
All schools 26 21 15 21 15 3 101
Primary 7 7 6 7 8 0 35
Secondary 4 1 3 5 1 2 16
Combined 15 13 6 8 6 1 49
Province

12
Gauteng 10 6 7 8 12 1 44
KZN 9 4 1 5 3 2 24
W Cape 2 3 2 2 0 0 9
Other 5 8 5 1 0 0 19
Location
Urban city centre 5 3 3 4 0 0 15
Town/ City 13 14 12 16 14 1 70
Township 6 1 0 0 0 0 7
Informal settlement 0 0 0 0 0 0 0
Rural 2 3 0 1 1 2 9
Status
Non-profi t 26 18 11 16 12 3 86
For profi t 3 4 5 3 0 15
Ownership
Board/ Trust 11 8 5 9 9 2 44
Private/ Personal 1 3 1 2 1 0 8
Charitable/ Religious 10 6 2 1 2 0 21
Private company 4 4 7 9 3 1 28
Religious affi liation
Catholic 3 2 2 1 1 0 9
Hindu 2 2 0 0 0 0 4
Jewish 0 0 0 0 1 0 1
Muslim 4 2 0 0 0 0 6
Other Christian 14 12 9 15 7 3 60
None 3 3 4 5 6 0 21
Receive subsidy
5%–10% 1 2 3
11%–20% 2 8 1 11
21%–30% 5 5
31%–40% 6 3 9
41%–50% 2 2
51%–60% 4 4
Total subsidy 20 13 1 34
Key:* Code for annual fees per learner:1. R0–R9 9992. R10 000–R19 9993. R20 000–R29 9994. R30 000–R39 9995. R40 000–R49 9996. R50 000+
• Of the schools in the group, 34 receive a subsidy, 33 of them having fee levels below R20 000 per annum. One school receiving a subsidy of 11%–20% charges fees within the R20 000–R29 999 level.
• Of the group, 91% is urban, with a small minority in the rural areas (9%). However, two of these schools charge fees of over R100 000 per annum, and would be far from the normal connotations of “rural”. Interestingly, unlike the 2006 sample, there are seven schools in this

13
sample in so-called township areas, six of these with fee levels below R9 999 per annum and one with fee levels below R20 000 per annum.
Table 1 also reports on various characteristics of the selected schools.
• The largest group of schools (44) is owned by a Board or a Trust.• Twenty-one schools are owned by charitable or religious organisations and slightly more (28) are
owned by a private company.• Unlike 2006, where the largest group of schools overall was owned privately (by an individual or
family close corporation, for example), only eight of this group of schools are owned privately.
ENROLMENT OF LEARNERSSeven schools did not report their total enrolment. The total enrolment of learners at the 101 schools selected in 2007 has therefore been projected from the total enrolment of 40 708 in 93 schools.• Of the 93 schools that report total enrolment, the smallest school has 14 learners, two other
schools have 16 learners, and another school has 22.• Fifteen schools have enrolments of between 50 and below 200.• Thirty-eight schools have an enrolment between 201 and 500.• Thirty-two schools have between 501 and 1 000 learners enrolled.• Four schools have over 1 000 learners. (One has no fewer than 2 267 learners, but is a distance
learning institution.)
GENDER OF LEARNERSGender ratios are more balanced and seem very fair among the learners (Table 2). Girls predominate overall at 52%, but only just, with boys at 48%. The only thing that stands out is the bulge in enrolments for both girls and boys in grade 9. This is the last year of formal schooling in the General Education and Training (GET) band. It could indicate a fi nal surge of hope from parents that the child gets a better education at independent rather than at public schools and, therefore, the child’s chances of doing better in matriculation are improved by registering at an independent school. Enrolments do seem to level out in the grade 12 year, perhaps when the reality of the amount of work required has set in.
(The available fi gures for the gender of learners relate to grade 1 for initial intake, grade 7 for common end of primary school, grade 9 for the end of the GET band and grade 12, matriculation.)
Table 2: Distribution of enrolment in the sample in terms of selected grades and gender
Total N Schools Average
Grade 1
Girls 1 828 77 24
Boys 1 860 71 26
Grade 7
Girls 1 685 75 22
Boys 1 546 70 22
Grade 9
Girls 2 098 56 37
Boys 1 711 50 34
Grade 12
Girls 1 760 56 31
Boys 1 470 47 31

14
Total Girls 7 371
Total Boys 6 687
FOREIGN STAFF MEMBERSIn 2006, there appeared to be some reluctance to report the nationality of educators. However, despite the likelihood that fi gures might under-represent the number of foreign teachers teaching in these schools, of the 101 schools in the 2007 group, 30 admit to employing foreign staff. In total, 55 foreign teachers are employed in these schools:• Eighteen schools employ one foreign staff member each.• Eight employ two each.• Two employ three each.• One long-established, well-respected school employs as many as six foreign staff members, but
these are probably teachers of foreign languages, for example, French and/or German.• Another school employs no fewer than nine. The school has a problem with staff turnover. The
explanation given is that the black staff members are headhunted by other schools because of their good results. In the section of the site visit booklet dealing with indicators of good practice, it is stated that teachers at this school are highly qualifi ed and experienced and given support by the school management team. The evaluator maintained that this is generally a very well-organised, effi cient school with evident working ethos. The school is located in amongst seven squatter camps. Teachers are hard working and loving, ensuring disciplined and well-mannered students.
• Twenty-one of the schools say their foreign staff members are registered with the South African Council for Educators (SACE).
• Nine say they are not.• Twenty schools say that provisional registration with SACE is monitored. (Twelve say it happens
annually, three have it happen four times per year, one school is monitored four times per year, and four say it happens in different stages.)
• There were no responses to the question about who monitors the provisional registration status of foreign teachers.
The registration issue is discussed further in Part 4.
When one examines the data concerning the educators’ years of experience (Table 3), it is striking to see how many more very experienced teachers (with more than 10 years’ experience, and this is even more noticeable for those with 20+ years of experience) are employed by the most expensive schools than by the least expensive schools. One school employs as many as 36 teachers with 21+ years of experience, and another has 26. The highest number of similarly experienced teachers in the least expensive schools is 15 at a school with strong religious affi liations. Of the responses describing what made a school special, 16% spoke of “Highly qualifi ed and experienced staff with great track records.”
Table 3: Educators’ years of experience: contrastive analysis, ten most expensive schools
Annual Fees Unqualifi ed Diploma Bachelor Masters Doctorate Total % Endorse Foreign
45535 5 35 32 3 75 98% 2
46665 1 15 22 2 40 96% 1
46816 25 40 2 67 94%
47280 1 43 3 47 Primary

15
48000 6 4 10 100%
48570 17 39 3 59 92% 1
49410 18 61 6 85 Primary
56535 5 40 1 46 96% 2
106000 1 3 49 6 59 Primary 1
115000 2 42 10 1 55 99% 0
Average 7 127 372 36 1 7
% of Staff 1.20% 23.40% 68.50% 6.60% 0.10% Av 96% 1.2%
T Staff 543
Table 4: Educators’ years of experience: contrastive analysis, ten least expensive schools
Annual Fees Unqualifi ed Diploma Bachelor Masters Doctorate Total % Endorse Foreign
NC 0 1 3 1 5 68% 2
0 19 6 3 28 0
1200 7 7 1 15 0
1200 2 5 6 13 Primary 0
1600 2 17 4 2 7 32 10% 0
1850 3 18 0 1 22 1
3000 16 8 1 3 28 Primary 9
3600 4 11 2 17 54% 0
3700 31 9 40 81% 0
3900 2 12 3 17 1
Average 1.9 12.9 4.9 1 1 1.3% of T Staff 8.70% 59.40% 22.60% 4.60% 4.60% Av 53.3% 5.90%
T Staff 217
Comments:In the more expensive schools educator qualifi cations are skewed markedly towards academic degrees. In the least expensive schools educator qualifi cations tend towards professional educator qualifi cations. There are few foreign teachers in both groups, but fi ve times as many in the least expensive schools. A far higher ratio of university endorsements (to the number who wrote matric) is found in the most expensive schools. Only one school was found to be not fully compliant by the evaluators, and that was in the least expensive set (NC)
Note: “Other” refers, for example, to technical or skills trainers
AFFILIATIONS TO SCHOOL ASSOCIATIONSTable 4 shows that as many as 90 schools say they are affi liated to a South African association of independent schools and several have multiple association membership. ISASA is mentioned in no less than 58 of the 101 records.

16
Table 4: Affi liations to school associations
ACE Ministries 1
ACE School of Tomorrow 2
ACSI 7
ISASA/ SAHISA/ ISJLG/ IFCC 1
Adventist Accrediting Association 1
Association of Muslim Schools 6
Beweging vir Christelike Onderwys 1
Black Independent Schools 1
Catholic Institute Of Education 2
Catholic Schools Board 1
Catholic Schools Offi ce 1
CIE/ ISASA 1
Independent Institute of Education 1
Independent Schools Association of SA 1
ISASA 58
ISASA/ SAHISA/ SABISA 1
ISASA/ ACSI 1
ISASA/ Catholic Schools Board 1
ISASA/ IEB/ SAHJSA/ ICP/ SAALED 1
ISASA/ SAHISA/ CIE 1
National Association Of Private Schools SA 1
Non-aligned Private School Association 1
SAMA 1
Fourteen schools are affi liated to an international association (Table 5).
Table 5: International associations
ACE School of Tomorrow 1
ACSI 4
Franklyn Covey Foundation 1
International Boys Coalition 4
Marist Brothers 1
NUFFIC 1
UK Boarding Schools Association 1
UNSW 1
Of the 2007 schools, 95 offer the National Curriculum Statements (grades R–12) developed by the DoE.• Five schools do not use this curriculum and one school did not respond to the question.• Three of the fi ve schools are offering the curriculum for Accelerated Christian Education.• One school is offering the Cambridge Higher International General Certifi cate of Secondary
Education (HIGCSE).• One school appears to have its own curriculum, which is assessed by the Independent
Examination Board (IEB).

17
In terms of external assessment bodies, 37 schools use the IEB; 18 use the KwaZulu-Natal DoE and 17 use the Gauteng DoE. Other assessment bodies are represented by much smaller numbers of schools (Table 6).
Table 6: External assessment
BCVO 1
EC 4
FS 3
Gauteng 17
IEB 37
KZN 18
Limpopo 1
Mpumalanga 2
NC 0
NW 1
WC 6
Only two schools indicate participating in DoE’s evaluations for grades 3 and 6. Five schools have participated in whole school evaluation (WSE) or an integrated quality management system (IQMS) conducted by PDEs. Eighty-three schools say they are monitored by the PDE but 13 say they are not monitored. Five schools did not answer the provincial monitoring question.
Eighty-three schools say they are monitored by their association. Eighty-two have the submission of statistics of the numbers of learners enrolled monitored and 81 say the monitoring includes the fi lling in of membership forms (Table 7). These fi gures drop substantially to 33 schools having their annual reports on matriculation results monitored and only 27 that have their annual reports on grade 9 results monitored. However, 57 schools send quality assurance reports to their association and 59 have their sites evaluated by the association.
Table 7: Monitoring activity by association
N schools answering yes
Enrolment statistics 82
Membership forms 81
Annual reports on matriculation results 33
Annual reports on grade 9 results 27
Quality assurance reports to association 57
Site evaluation 59
Table 8 reports that 14 schools described other forms of monitoring activity that they experienced as follows: Matriculation and grades 9, 10, and 11 entries were monitored; a special needs school survey was conducted; education management information system (EMIS); employment equity was monitored; as were March statistics.
Table 8: Monitoring activity
N schools answering yes
10th day school survey report 79
Annual audited fi nancial statements 37 (if subsidised)

18
Site visits by PDE offi cials 34
Site visits by district offi cials 40
Written reports to PDEs 13
Written reports to district offi ces 15
Annual school survey 17
Other 14
Seventy-four schools said they received other support from the provincial education department. The nature of this support is shown in Table 9.
Table 9: Support provided by PDE
N schools answering yes
Circulars 70
Annual meetings with ISs 49
Workshops 57
Rewards for best matriculation achievers 14
Site visits 33
Other 3
Two schools said they received support for the statistics required for the tenth-day school survey and one was given support for a headcount.
REASONS FOR ESTABLISHMENT OF SCHOOLIt is interesting to note the variety of reasons given for establishment and the relative popularity of each as indicated in Table 10.
Table 10: Reasons for establishment of school
Reason chosen Incidence Constituency
To maintain/ nurture/ develop particular values and or religious practices
42 Across the board, predominantly from lower fee and religious schools
To offer specialisation in subjects not offered … in accessible public schools
1 A riding/ racing academy
To provide education in a language other than that available in public schools
1 A Cape school in a rural environment
To realise a special vision of educational quality…
7 Mainly lower/ middle fee schools
To give learners the best chance of getting a good place in higher education
8 Across the board, though few “establishment” schools
To provide special education … for learners facing particular challenges
3 Two low fee schools, one high fee
To provide single-sex schooling… 10 All single-sex “establishment” schools
Other 27 Individual responses analysed in narrative
Some of the other reasons for being established are as follows:• The provision of a coeducational environment• An emphasis on high-quality, holistic education

19
• The provision of educational experiences of quality occurring in small classes guaranteeing a high level of teacher–pupil interaction
• Access to an internationally recognised IEB curriculum and examinations• Giving parents who previously had to make use of boarding schools, the opportunity to
educate their children locally at reasonable fees, thus accommodating the middle-class family• An opportunity for children to learn, using a particular ideology• A lack of good private schools in the area
One school was founded in 2002 with the purpose of breaking the cycle of poverty. The founder organisation has strong ties with the school, especially with quality and the management of quality. The core focus of the school is to provide outstanding education to an under-served population. The school plays a vital role in the community and it strongly encourages parent involvement. The school also supports parents’ emotional needs by running workshops for parents to deal with social issues.
OFFERINGS AND FACILITIES AT SCHOOLS IN 2007Table 11 lists the subjects offered in the 2007 group of schools.
Table 11: Subject offerings
Number of schools offering English home language 93
Schools not offering English home language 8
1. English second language 6
2. African language, home 12
3. African language, second 43
4. Both 2 and 3 4
5. Afrikaans 89
6. Both 3 and 5 39
7. European language 19
8. Mathematical literacy 54
9. Mathematics 95
10. Both 8 and 9 51
11. Physical sciences 71
12. Life sciences 67
13. Both 11 and 12 59
14. Geography 69
15. History 61
16. Both 14 and 15 57
17. Accounting 51
18. Economics 23
19. Business studies 44
20. All three: 17, 18 and 19 16
21. Agricultural studies 1
22. Information technology 47
23. Life orientation 87
24. Religion studies 9
25. Visual arts 28
26. Tourism 10
27. Foundation phase literacy 47

20
28. Foundation phase numeracy 47
29. Foundation phase life skills 44
The following features of Table 11 might be noted:
• English, mathematics and mathematical literacy, physical science and life sciences are prominent. Information technology, accounting, economics and business studies are not as prominent as one might expect, yet the traditional subjects of geography and history appear to be signifi cant offerings. The high number of schools offering life orientation (87) can partly be explained by adding the numbers of primary schools to the combined schools, as this produces a fi gure of 84.
• As many as 93 schools offer English as a home language.• It is encouraging that in this group of schools, 47 schools offer an African language as a second
language, but this could be an even larger number. However, this picture changes completely if Afrikaans is encoded under African languages.
• As many as 80 schools of this year’s group of schools have religious affi liations; therefore it seems surprising that not more than nine offer religious studies as a subject.
• The medium of instruction in 97 schools is English, with Afrikaans in three schools.
Table 12: Learner support programmes/ services
Other 66
Counselling 64
Additional tutoring 60
School towns of fi eld trips 11
Saturday/ holiday school 8
Guidance for parents 7
Social work 6
A predominant issue in many schools since the publication of Education White Paper 6, Building an Inclusive Education and Training System, is that of learner support. Table 12 shows that 63% of the schools in this sample offer counselling to their learners. This support is becoming more necessary in South African schools for several reasons. For example, few people understand the high prevalence in schools of childhood depression. It is one of the most common symptoms of stress experienced by children for a multitude of different reasons, ranging from the situation of poverty described in the section on concerns expressed by focus groups to coping with an excessively competitive ethos at the school.
Sixty of the schools offer additional tutoring. This would endorse comments made in site visit booklets that additional tutoring is taken seriously by most of the schools as an important form of support in order to achieve in the Senior Certifi cate. Again, this is not necessarily an indictment about the level of teaching and learning at the school. Learners form a very diverse group in modern schools and ability testing, particularly at the entrance level to the school, is frowned upon. Consequently, it is not surprising to fi nd that schools provide additional tutoring for those learners who are perhaps not performing at the same high level as their peers. In addition, it is not unusual to fi nd some learners who excel in some areas but who need extra assistance in others. The arena of independent schooling has become very competitive and one of the fi rst criteria parents use in deciding where to send their child is matriculation results.
However, only eight schools offer school on Saturdays or during holidays. These eight schools vary in that only four of them have good results with very few failures. One school seems to have improved the number of endorsements received within the last two years but another school has only received 16% of endorsements over the last three years.

21
It is interesting that only seven schools offer parental guidance. This aspect can often be underrated. In the past parents were not encouraged to play an active role in their child’s schooling but again, Education White Paper 6 emphasises the centrally important role of parents in their child’s learning and development.
It appears only six schools in the 2007 group have access to a social worker. This is another aspect that requires further understanding by school authorities today. Many problems experienced by children in the home impact severely on their school progress. Often the problem can only be solved when referred to a social worker who advises/visits the family. One of the low achieving schools in the 2007 group has no policy for learner support, although the procedures are known to staff and learners.
Table 13: Additional activities/ programmes
Sports 90
Other 59
Drama 42
Music 39
Chess 32
Choir 34
Social responsibility/ outreach 26
Debate 25
Gardening 1
Drum majorettes 1
In the provision of extracurricular activities, the 2007 group shows that the schools acknowledge the need for learners to participate in cultural activities. Table 13 reports that many of the schools offer learners opportunities to participate in debating societies (25%), choirs (34%), music (39%), drama (42%) and chess (32%). It is interesting to note that only 28% (9 schools) of the group of schools offering chess fall within the fee levels of R30 000–R50 000+ per annum. The others are all less expensive schools. Sport is offered by 89% of the schools. Eleven schools do not offer sport at all, but one of these is a distance learning institution, and another engages in strenuous physical activity as part of its curriculum.
Of the 2007 schools, 26% encourage learners to engage in social responsibility or outreach programmes. The schools range from some of the least expensive to the most expensive.Fifty-nine percent of the schools offer other extracurricular activities that are very varied and must have exciting appeal for the young participants. Some of the choices range from playing in a jazz or a marimba band, to aerobics, to eco-school projects, drum majorettes and even gardening.
Table 14: Special instruction rooms
Computer room 96
Library 90
Laboratory 73
Home economics room 22
Woodwork room 14
Other 61
Table 14 shows the special instruction rooms available in the schools of the 2007 group. No fewer than seventy schools have a computer room, a library and a laboratory. Five schools have neither

22
a laboratory nor a library, and only one school has no computer room, no library and no laboratory. This school appears regularly among the low scorers throughout the analysis.
Examination of the table will also show that certain vocational subjects are provided for. For example, 22 schools have special home economics rooms. Boys attend certain of the schools with this facility and one wonders whether they are permitted to choose this option. Fourteen schools (some of which are very expensive and some of which are schools for girls) have a woodwork room. This is encouraging as often independent schools can become enclaves of conservative practice. Many of the special facilities described next could also be said to be vocational, as in the highly specialised show-jumping arena, dressage arena or training track and sauna in one school.
Other special instruction rooms mentioned in the site booklets gave glimpses into varied and exciting learning opportunities available for some young learners, for example, a video laboratory, music room, therapy room, art room, reading room, technology room, media room, pottery room, specialised biology and physics laboratories, a geography laboratory, an indoor sports centre, even a sport science centre, a specialist art and drama centre, prayer rooms for boys and for girls, and an aftercare facility.
PHYSICAL INSPECTION OF PREMISESThere are very few problems in Section B, where school premises and facilities were physically inspected by the evaluators. Several monitors commented on the quality or charm of the buildings, grounds and facilities of some of the schools.
Evaluators found staff toilets unsatisfactory at only one school. Toilet facilities for learners were unsatisfactory at two schools, one of which also had substandard furniture and hostel accommodation. The evaluator wrote, “I was deeply saddened by the living conditions of the girls, some of whom had responded so co-operatively during the focus interview. There was such promise of potential amongst the learners that may not be tapped to the full.”
Classroom windows and doors were found to be defi cient in one of the two schools mentioned above. Two other schools had unsatisfactory evacuation procedures. Sports fi elds were described as inadequate at three schools and nine schools did not have sports fi elds at all.
ACCREDITATION, REPORTING AND VERIFICATION PROCESSESTable 15 reports on the management system and reporting of the few schools with a lower rating in this fi eld. The small number of schools here indicates a highly satisfactory reaction from evaluators to the reporting process. (Scores of 4 or less indicate there are areas for improvement in the best instances, that the levels of implementation are inadequate in others and even unacceptable in some.) According to accounts in the site visit booklets, several of the schools have highly sophisticated management and information systems.
Table 15: Schools with lower ratings for management system and reporting
Fees Wrote Endorsements Rating
School A 48 000 4
School B 3 000 20 2 4
School C 7 080 1
School D 0 3.3
School E 20 853 43 12 4
School F 10 360 104 14 4
For all the other areas the scores are generally very high. There were categories however where, relatively speaking, scores refl ect areas that perhaps need monitoring. In each instance, the names

23
of the same low achieving schools appear, which seems to indicate a general malaise within certain schools in this group. These categories are presented in Table 16.
Table 16: Schools with lower ratings for staff establishment
Fees Wrote Endorsements Rating
School A 7 080 2
School B 0 2.5
School C 20 853 43 12 4
School D 24 310 52 41 4
School E 35 600 68 62 4
School F 7 920 7 3 3.2
School G 29 000 19 4
School H 6 790 13 5 2.6
School I 13 750 2.5
School J 37 150 111 99 4
School K 6 500 39 14 3
School L 3 000 20 2 4
School M 19 327 3.9
School N 16 800 40 26 1.1
School O 11 500 19 14 3.9
School P 5 100 4
School Q 10 360 104 14 2
Average fees: R15 002
Table 16 shows that 17 schools achieved scores of 4 or less for staff establishment. Three of these schools have fee levels of over R20 000 per annum and the rest fall within the lower fee levels. It may be of interest that nine of these low scoring schools have a high staff turnover as well. Five of these schools regularly achieve low scores in virtually every category. If internal quality management is to be encouraged, it would seem necessary to monitor whether the staff of a school feel motivated, are communicated with, are encouraged to embark on development programmes and feel as though they are part of a team. Greater commitment from staff and bolstering of educators’ morale could be the result. The issue of staff retention was a cause for concern expressed by focus groups.
Table 17: Schools with lower ratings for instruction and delivery
Fees Wrote Endorsements Rating
School A 7 080 2
School B 0 3.6
School C 20 853 43 12 0
School D 35 600 68 62 3.8
School E 48 000 4
School F 6 790 13 5 2.7
School G 6 500 39 14 4
School H 40 050 3

24
School I 106 000 91 87 4
School J 36 828 3.4
School K 16 800 40 26 3.8
School L 5 100 4
School M 10 360 104 14 4
Average fees: R26 150
Examination of the data in Table 17 shows that three schools were given scores of 4 or less for their instruction and delivery. While the usual low-scoring schools are there, there are also two well-respected schools, which is surprising. One of these only achieved a score of 3. In view of what has been said in p.61 Section 5, it is interesting that both these schools were evaluated by the same person. However, the school that achieved a score of 3 also has a different approach to classroom visits to the one advocated by the Umalusi site booklet. The question of a lack of alignment between school approaches and national criteria is also mentioned in the same section.
Table 18: Schools with lower ratings for policies, procedures, internal monitoring and review
Fees Wrote Endorsements Rating
School A 16 800 40 26 2.2
School B 10 360 104 14 3
School C 7 080 3
School D 0 3
School E 24 000 4
School F 20 853 43 12 4
School G 20 000 31 24 0
School H 7 920 7 3 4
School I 48 000 4
School J 6 790 13 5 1.2
School K 13 750 3.8
School L 3 000 20 2 4
Evaluators gave scores of 4 or less to 12 schools for their policies, procedures, internal monitoring and review. This is an important area if one of the objectives of the site visits is to facilitate a culture of internal quality management.
Table 19: Schools with lower ratings for safety and security
Fees Wrote Endorsements Rating
School A 7 080 3
School B 0 2.2
School C 20 853 43 12 4
School D 27 900 69 59 1.4
School E 29 000 19 3
School F 6 790 13 5 2
School G 6 500 39 14 2
School H 36 828 4
School I 7 480 3 2 2.8
School J 16 800 40 26 2.2
School K 10 360 104 14 3

25
Average fees: R15 417
Table 19 shows that 11 schools were given scores of 4 and below. While 11 is not a large proportion in a group of 101 schools, it is still disturbing to see that this many schools are not more concerned about the safety and security of their premises, especially as this year there was a period when schools appeared to become targets of crime. Nine of them achieved scores below 4. In one of these schools, the evaluator reported that the staff is of the opinion that the learners know the procedures for evacuation. The learners, however, were not sure what they would do, but were sure they would have to get to a safe place. However, there is no evidence whatsoever of health, safety or security in the hostels or any procedures to monitor this. There are no safety procedures displayed in any of the classes. Seven of the schools fall within the lower fee levels but the remaining four charge fees between R20 000 and R40 000 per annum.
Table 20: Schools with lower ratings for client satisfaction
Fees Wrote Endorsements Rating
School A 7 080 3
School B 0 2
School C 15 000 19 9 4
School D 20 000 4
School E 24 310 52 41 4
School F 29 000 19 3
School G 6 790 13 5 3
School H 36 497 31 3 2
School I 3 000 20 2 4
School J 9 800 4 1 4
School K 16 800 40 26 3.6
School L 17 880 2.3
School M 10 360 104 14 2
Average fees: R18 866
Sixty schools achieved perfect scores for client satisfaction. Twenty-seven schools achieved between 4.1 and 5.9, and 14 schools achieved 4 or less. Most of the low scoring schools are less expensive schools with fee levels below R19 990 per annum. Those who wrote matriculation only received endorsements for 38%–13% of learners who wrote.One of the regularly low scoring schools in this sample was given a score of 3.6 by the evaluator, indicating that the level of implementation and the supporting evidence meet the minimum standard and that there are more strengths than weaknesses. Yet examination of the site booklet shows that no evidence of implementation of problems or concerns from learners, educators or parents was presented. Further, learners reported that inputs made by them are not considered or implemented.
In other low scoring schools, surveys with learners and parents have either not been completed, or are waiting to be evaluated. In one case, while no survey has ever been done with the parents, teachers have informal discussions with them when possible. No parents’ meeting was held last year at this school. In fact, there is very little evidence of structured interaction of any kind with parents at this school. It would appear that if the continuous enhancement of quality is to be facilitated by Umalusi, such schools need to be made aware of the fact that quality assurance underpins the contractual relationship between an organisation and its clients (Umalusi, 2006). In other words, a school’s relationships with parents and the community, as well as the necessity for sharing of aims and aspirations for learners and their learning, is an important indicator of the quality of the service rendered to its clients by the school.

26
PROGRESSION DATA, GET BANDTable 21 shows two progression profi les of 14 schools in the 2007 group of schools with distinctive features in grade 4 in 2004. Of this group, 12 schools seem to have promoted more learners than have been assessed, yet there should be assessment data available for every learner in a school, especially at this level. Continuous assessment should be ongoing throughout the year and there should be some form of fi nal assessment at the end of the year. It is interesting to note that the two schools, which have assessed more learners than have been promoted, cater for learners who experience barriers to learning and possibly understand more than the average school about assessment in all its forms.
It is encouraging to see the acknowledgement of the number of learners requiring assistance/ support. It is to be hoped that the teachers in each case have been empowered to give the assistance themselves or are working in collaborative partnerships together with special support staff.
Table 21: Fourteen schools with fi ve or more assisted learners in grade 4
1 2 3 4
School A 62 100 62
School B 27 10 90
School C 56 96 13 4
School D 94 100 5
School E 17 94 12 6
School F 176 100 8
School G 28 100 12
School H 36 69 27 3
School I 31 100 19 0
School J 25 96 20 4
School K 19 100 8 0
School L 24 100 8 0
School M 50 100 30 0
School N 31 100 6 0
Key: 1: Assessed; 2: Promoted; 3: Assisted; 4: Not readyNote that in Table 22, one school in particular has a large number of learners who are not ready to progress to the next level. There is no evidence of assistance/ support being given to learners at this level. Moreover, it is the same school that consistently fails large numbers of learners in the following section on failing practices.
Table 22: Eight schools with more than 3 learners not ready in grade 4
1 2 3 4
School A 32 95 2 5
School B 56 96 13 4
School C 17 94 12 6
School D 23 96 4
School E 39 93 2 5
School F 25 96 20 4
School G 42 90 10
School H 29 93 7
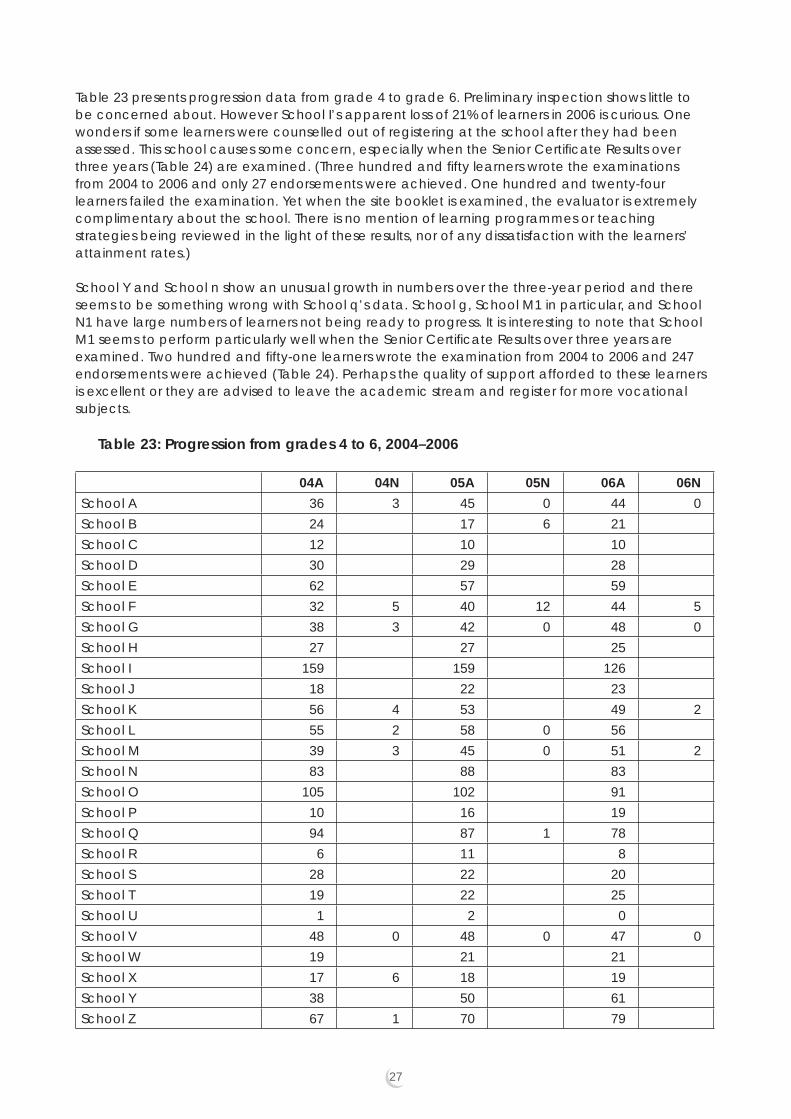
27
Table 23 presents progression data from grade 4 to grade 6. Preliminary inspection shows little to be concerned about. However School I’s apparent loss of 21% of learners in 2006 is curious. One wonders if some learners were counselled out of registering at the school after they had been assessed. This school causes some concern, especially when the Senior Certifi cate Results over three years (Table 24) are examined. (Three hundred and fi fty learners wrote the examinations from 2004 to 2006 and only 27 endorsements were achieved. One hundred and twenty-four learners failed the examination. Yet when the site booklet is examined, the evaluator is extremely complimentary about the school. There is no mention of learning programmes or teaching strategies being reviewed in the light of these results, nor of any dissatisfaction with the learners’ attainment rates.)
School Y and School n show an unusual growth in numbers over the three-year period and there seems to be something wrong with School q’s data. School g, School M1 in particular, and School N1 have large numbers of learners not being ready to progress. It is interesting to note that School M1 seems to perform particularly well when the Senior Certifi cate Results over three years are examined. Two hundred and fi fty-one learners wrote the examination from 2004 to 2006 and 247 endorsements were achieved (Table 24). Perhaps the quality of support afforded to these learners is excellent or they are advised to leave the academic stream and register for more vocational subjects.
Table 23: Progression from grades 4 to 6, 2004–2006
04A 04N 05A 05N 06A 06N
School A 36 3 45 0 44 0
School B 24 17 6 21
School C 12 10 10
School D 30 29 28
School E 62 57 59
School F 32 5 40 12 44 5
School G 38 3 42 0 48 0
School H 27 27 25
School I 159 159 126
School J 18 22 23
School K 56 4 53 49 2
School L 55 2 58 0 56
School M 39 3 45 0 51 2
School N 83 88 83
School O 105 102 91
School P 10 16 19
School Q 94 87 1 78
School R 6 11 8
School S 28 22 20
School T 19 22 25
School U 1 2 0
School V 48 0 48 0 47 0
School W 19 21 21
School X 17 6 18 19
School Y 38 50 61
School Z 67 1 70 79

28
School a 12 16 15
School b 35 33 31
School c 176 177 182 2
School d 8 11 7
School e 28 29 31
School f 48 48 46
School g 36 3 27 22 22 19
School h 74 2 77 5 64 4
School i 25 25 25
School j 45 47 49
School k 23 4 27 27
School l 31 0 31 0 30 3
School m 44 50 45
School n 30 33 54
School o 53 55 58
School p 62 62 58
School q 27 100 23 100 21 100
School r 39 5 42 0 52 0
School s 25 4 27 0 26 0
School t 71 70 69
School u 11 2 14 3 9
School v 11 11 12
School w 49 50 53
School x 11 20 16
School y 29 7 26 30
School z 19 0 15 0 17 0
School A1 66 66 66 1
School B1 45 0 44 0 42 0
School C1 53 54 54
School D1 54 53 52
School E1 28 32 17
School F1 75 75 75
School G1 23 21 24
School H1 21 23 24
School I1 27 0 29 0 21 0
School J1 21 0 22 0 25 0
School K1 24 0 26 0 26 0
School L1 50 0 50 2 50 6
School M1 36 56 35 57 50 60
School N1 31 0 31 3 31 10
School O1 72 70 71
School P1 42 10 43 0 43 2
School Q1 51 52 54
School R1 40 0 41 0 46 2
School S1 37 3 43 43 5
School T1 42 22 30

29
School U1 6 4 6
School V1 8 7 8
Key: 04A: Assessed 2004; 04N: Not ready 2004, etc.
SENIOR CERTIFICATE RESULTS OVER THREE YEARSOn the whole, Table 24 shows considerable stability and achievement. There are schools that have achieved 100% or very high numbers of endorsements (schools A, P, T, V, and Z, as well as b, c, m and o) but there are also schools refl ecting very few endorsements, if any, and high percentages of failures. (Schools F, K, and P are particularly noticeable but, equally, schools E, S, Y, a, and q do not achieve very many endorsements.) School F is one of the schools that cause concern in the next section because of the number of failures it has in grade 12; school K features in each of the last three tables in the next section for high failure rates in grades 9, 11 and 12; and School p appears in every one of the tables in the next section with high failure rates in grades 1, 7, 9, 11 and 12.
Table 24: Senior Certifi cate results over three years
W04 W05 W06 TW4–6 F04 F05 F06 TF4–6 E04 E05 E06 TE4–6
School A 50 56 35 141 50 56 35 141
School B 1 3 4 8 0 0 0 0 0 3 1 4
School C 45 46 52 143 37 38 41 116
School D 62 56 55 173 42 40 51 133
School E 17 13 20 50 2 1 2 5
School F 126 109 115 350 71 27 26 124 7 6 14 27
School G 87 64 81 232 0 1 0 1 87 61 79 227
School H 23 21 19 63 1 2 3 17 15 14 46
School I 48 42 50 140 45 38 47 130
School J 17 33 26 76 0 0 0 0 13 17 14 44
School K 108 102 104 314 21 32 43 96 16 9 14 39
School L 38 52 52 142 0 0 0 0 37 42 44 123
School M 41 39 44 124 0 0 0 0 32 27 30 89
School N 25 23 35 83 17 9 20 46
School O 111 95 112 318 0 0 0 0 107 89 103 299
School P 5 1 6 5 1 6
School Q 68 55 57 180 1 1 2 46 45 46 137
School R 19 12 14 45 8 4 6 18
School S 18 26 19 63 1 1 4 4 8
School T 66 56 47 169 61 54 46 161
School U 97 109 91 297 90 95 87 272
School V 131 146 117 394 125 139 116 380
School W 30 27 43 100 26 25 36 87
School X 83 75 69 227 71 62 59 192
School Y 20 42 40 102 1 5 6 16 24 26 66
School Z 12 19 15 46 11 19 15 45
School a 91 93 91 275 1 5 4 10 3 1 3 7
School b 70 71 71 212 69 69 70 208
School c 83 74 61 218 83 74 61 218
School d 30 21 39 90 1 4 4 9 19 5 14 38

30
School e 25 20 19 64 0 0 0 0 11 9 9 29
School f 25 27 39 91 15 24 29 68
School g 64 55 74 193
School h 21 21 19 61 19 18 18 55
School i 88 86 91 265 0 0 1 1 80 85 85 250
School j 40 43 44 127 0 0 0 0 32 24 56
School k 18 16 27 61 11 14 22 47
School l 34 29 27 90 2 1 3 25 20 19 64
School m 51 49 50 150 0 0 0 0 50 47 48 145
School n 81 68 76 225 0 0 0 0 70 60 70 200
School o 73 92 86 251 73 88 86 247
School p 43 42 45 130 7 4 5 16 5 9 7 21
School q 43 40 43 126 3 1 1 5 19 12 12 43
School r 28 29 31 88 0 0 0 0 18 21 24 63
School s 68 68 77 213 0 0 0 0 65 64 77 206
School t 109 121 111 341 84 109 99 292
School u 65 64 68 197 63 58 62 183
School v 44 41 44 129 3 1 1 5 22 26 30 78
School w 35 28 23 86 5 2 7 16 17 16 49
School x 10 2 7 19 2 2 2 1 3 62 587 2 522 2 579 7 688 118 78 95 291 1 794 1 786 1 834 5 414
Key: W04 = Wrote in 2004; F05 = Failed in 2005; E06 = Endorsements in 2006 etc. TW 4–6 Total wrote over the 3 years; TE 4–6 Total endorsements over the 3 years
FAILING PRACTICESMany independent schools in South Africa use state policy as a guideline. In the failure or retention of learners, the new, more supportive approach introduced with Education White Paper 6 in 2001 for public schooling maintains that, where it is felt that a learner needs more or less time to demonstrate achievement, decisions should be made based on the advice of the relevant role-players: educators, learners, parents and education support services. If a learner needs more time to achieve particular outcomes, he or she need not be retained in a grade for a whole year. No learner should stay in the same phase for longer than four years, unless the provincial Head of Department (HOD) has given approval based on specifi c circumstances and professional advice (Department of Education, 2006, p.76).
The name of one school crops up in every table; another school appears in each table except one; four schools appear in three of the tables; while three of these schools appear in each of the last three, and a considerable number of learners have been failed by these schools in each instance. (One of the schools appearing in the last three tables is one of the schools regularly achieving low scores in this 2007 group.)
Table 25 shows the numbers of grade 1 failures over three years in certain primary schools in the set. Only in three to fi ve of them might questions be asked about the failure rate at this level.
Only a handful of schools practise failing in grade 1. This seems inappropriate in view of the new policy in Education White Paper 6, but perhaps some independent schools feel it does not apply to them? The Foundation Phase, which encompasses grade 0 to grade 3, is now meant to be perceived as a fl exible teaching and learning period. Children experiencing diffi culty in grade 1 should progress with their age cohort but receive greater support during the next teaching and learning period. However, problems occur when children do not possess basic skills at this level.

31
Many experienced teachers feel they should not progress to the next level as this will only cause greater confusion and create further barriers to learning.
Table 25: Grade 1 failures over 3 years
Fees 2004 2005 2006
School A 3 700 2 1
School B 0 10 3 5
School C 2 1890 2 2 1
School D 30 030 2
School E 29 000 2 1
School F 16 200 2 1
School G 5 000 9 8 8
School H 3 000 10 8 7
School I 15 900 2
School J 14 300 4 5 7
School K 5 800 5 7 7
Table 26 shows that only eight schools have failed learners in grade 7 over the past three years; however only one could be problematic. One interpretation could be that failures at the end of the senior phase of primary school show that learning diffi culties of whatever kind have not been corrected yet and there could be serious implications with the requirements of high school learning. There is a risk that a failure cycle could begin, if one is not already in place, because of a lack of appropriate support for learners.
Table 26: Grade 7 failures over 3 years
Fees 2004 2005 2006
School A 8 004 3 1
School B 44 244 1 1
School C 30 000 4 0 0
School D 36 300 1 2
School E 3 000 5 0 2
School F 36 828 4 3 1
School G 5 000 16 1 6
School H 1 600 2
Table 27 shows the numbers of failed learners at grade 9 in seven schools. Two or three of these could be problematic. This is where more vocational subjects could be made available for learners where academic content seems inappropriate.
Table 27: Grade 9 failures over three years
Fees 2004 2005 2006
School A 3 700 19 15 39
School B 10 000 2 2 5
School C 47 280 3 2 2
School D 5 900 2 1 2
School E 6 500 3 1 2
School F 10 360 39 25 10
School G 5 000 15 2 8

32
Table 28 shows that 10 schools have failed learners in grade 11, two of which are quite severe. The possibility of failing large numbers to ensure adequate matriculation results seems to arise only in a couple of other cases.
Table 28: Grade 11 failures over three years
Fees 2004 2005 2006
School A 3 700 12 2 15
School B 10 000 12 4 5
School C 5 900 2 5 7
School D 6 500 3 5 9
School E 3 000 3 9 8
School F 16 800 3 3 1
School G 5 000 8 4 4
School H 15 900 7 3 8
School I 3 900 3 13 2
School J 10 360 15 17 13
Table 29 shows that only nine schools have notable grade 12 (matriculation) failures, and only two of them might be cause for concern.
Table 29: Grade 12 failures over three years
Fees 2004 2005 2006
School A 3 700 3 1 1
School B 10 000 4 5 4
School C 20 853 3 1 1
School D 5 900 71 27 26
School E 36 300 2 1
School F 7 920 2
School G 5 000 7 4 5
School H 4 750 5 2
School I 10 360 21 28 67
The vast majority of schools in the 2007 group of schools (89) were considered by the evaluators to have given evidence that was fully consistent with the claims in the self-evaluation report. Nine schools were consistent in most areas – a total of 97% is thus quite acceptable. (It may be of interest that the two schools that were rated as not being consistent are two of the regular low scoring schools.) Possibly feedback such as these observations from the evaluators will make it easier for Umalusi to track and monitor those schools rated as weak in their response to the accreditation process.
VIEWS OF FOCUS GROUPSViews expressed by focus groups of randomly selected educators and learners in all the schools were consistent in all areas with those of the principal/senior management in 91 schools and 10 schools were rated as consistent in most areas. There were a number of areas of concern raised by the focus groups, however. Some of these refl ect the specifi c nature of either the school or the learners concerned as refl ected in these examples taken from site visit booklets – only the teachers and the principal, and not the HoD, checked the books or did class visits; learners felt that they would like a bigger variety of sports offered at the school and another group said that they would prefer not to have to take part in all the sport and cultural activities of the school. Another group

33
wanted to have junior and senior learners separated at break times; one worried about the lack of a school vehicle and so on.
The more common concerns (several of which relate to each other) mentioned are as follows:• Subject choices for matriculants in the new curriculum as well as a lack of educators in certain
subjects in certain schools• Financial constraints• Market-related teacher salaries (and this has become a challenge since the educators in the
public sector have been given substantial salary increases)• Teacher retention• Management’s attitude towards educators• A staff appraisal system• Unsatisfactory or lack of sports and specialised facilities• Learners’ attitude towards discipline• The lack of parental involvement, and illiterate parents• The low self-esteem of learners, many coming from poor socioeconomic environments with a
lack of resources at home, unemployment, language barriers, and the ravages and implications of HIV/AIDS for schools.
Prevalent international and local themes in education systems are partnership and collaboration. The concept of “welcoming schools” is advocated. In such establishments it is accepted that the whole school has to change in order to address many of the concerns described above. The concept of support should extend to teachers as well and the management structures of schools are one of the fi rst pillars of support that should be in place.
One of the most challenging issues for schools to emerge from the focus group interviews appeared to be how to involve parents meaningfully in the learning process of their child. This was discouraged by schools in the past and teachers admitted that parents need to be encouraged to play a role in the education of their children again, but do not know how to do this successfully. In some of the schools discussion groups are held where information is shared, but cultural differences need to be acknowledged and accommodated.It is good that so many of the 2007 schools are giving opportunities for community outreach programmes because the role of the community has become important within educational systems. Schools also need to be shown by provincial representatives how to partner with community stakeholders such as non-governmental organisation (NGOs) to facilitate the use of support mechanisms that are already in place in the local community to help them manage the implications of the HIV/AIDS pandemic, help with poverty alleviation or a lack of resources, to provide voluntary help, or to give advice on illiteracy and unemployment amongst parents.
Some schools made important recommendations for improvement during the focus group interviews. The more common forms of improvement that are recommended are refl ected in Table 30.
Table 30: Incidence of recommendations for improvement arising from the evaluation
Frequency Responses from 101 school visits
25 Develop relevant policies and procedures
9 Establish internal quality assurance structure
5 Compliance with health and safety
5 Involvement of stakeholders by management team
5 Minutes of staff meetings and other committees
5 Active role for parents
4 Conduct client satisfaction surveys

34
4 Improve communication with stakeholders
0 Provision for adequate learner support
0 Continual observance of the school (rules?)
In each case there is little clear pattern, with diverse schools in each. Many schools had no listing here. Most had one or two indicators.
There were several additional points for improving the school that were made in focus group interviews. The issues for improvement are different and seem to have a more “personal” tone than those listed above. They also relate strongly to the concerns felt by focus groups that are described earlier. They are as follows:• The most frequent additional call was for more subject choices and more information about
making subject choices for grade 10s. Some schools wanted more sport (and facilities for sport).• Making provision for the development and implementation of staff appraisal systems comes
next. Some schools linked staff appraisal to salaries and performance. One focus group even stated that they felt that the school fees were too high for the product received and that staff turnover was excessive.
• Financial constraints affect school staffi ng in more ways than one. Competent, qualifi ed staff members in less expensive schools have to carry a heavy load, as is seen in the example from the site booklets of the principal who had to act as administrator, manager, educator and HoD for all learning areas in the Further Education and Training (FET) phase. The recommendation made by the focus group was for the deployment of more management staff.
• One evaluator gave an interesting spin on the lack of qualifi ed staff in certain schools with religious affi liations when he recommended that the school should embark on a learnership programme and a drive to solicit the services of more potential teachers. He suggested that the school should look to “the vast reservoir of teachers in the Indian sub-continent, especially in the fi elds of Commerce, Science and Maths.” He added that “Since the (religious) headquarters are in India, without transgressing local employment laws, the school can even get its own teachers to train in India on a rotational basis.”
• Resource shortages of various descriptions were also mentioned fairly frequently by focus groups from less expensive schools: buildings need renovating; facilities are overcrowded; textbooks and library books were mentioned by learners in one focus group.
• A refl ection of recent changes being seen within educational systems is seen in the recommendation for access to a social worker and a remedial teacher to help with immigrant and second language learners. The main responsibility for coping with learners experiencing barriers to learning in public schools rests with the teachers, who should have had (but often haven’t) in-service training in the management of barriers to learning together with the support of the Institution Based Support Team and District Based Support Team. Independent schools have to fi nd their own resources from the community or the funds to pay them as staff members. Very few educators, irrespective of the nature of their qualifi cations, have had specialised training in the management of learning diffi culties. Those individuals who have had special training are usually employed as learning support staff or “remedial education teachers”. There are some expensive independent schools where the services of paramedical staff are offered as added value but, inevitably, the parents end up paying extra for this.
• Another interesting recommendation was that transformation issues within the school need to be “seriously addressed”. This issue cropped up in the site booklets in various places.
• Other recommendations seem almost parochial in that they mention “raising the profi le of the prefects” or “having two breaks a day” and that “lunch and supper are too close together”.
• Further signs of changes in traditional approaches are seen in the learners’ recommendations that disciplinary procedures need to become more empathetic and sensitive toward the need of the learners and that curfews or restrictions need to be relaxed for learners. Learners at an

35
expensive boys’ school recommended the use of professional coaches, not just teachers, for their sports tuition. Again, at an expensive boys’ school, notes of elitism seem to be creeping in when recommendations were made for boys of a higher academic ability to be admitted to the school. They also wanted a clear uniform policy as they feel uniforms change often and people are wearing old uniforms.
The responses made by schools participating in this evaluation process by Umalusi seem to reveal recurrent themes. Similar issues as in the previous section emerge again when challenges experienced by schools are described. The main challenges are seen in Table 31.
Table 31: Incidence of main challenges arising from the evaluation
Frequency Responses from 101 school visits
15 Other – see list below
12 Staff turnover
12 Inadequate resources / facilities
8 Change in school leadership (principal)
8 Work overload on teachers
8 Changes in legislation
8 Changes in curriculum
5 Staff with inadequate qualifi cations and experience
5 Duplication in monitoring and evaluation requirements (a different set of schools experience this, mainly Catholic or special schools. Certain other schools have to send similar statistics to two different departments of education with different forms and statistical requirements.)
4 Inadequate support from parents
3 Inadequate support from Board
2 Change in school ownership
1 Inadequate support from the school management teamFifteen predominantly high-fee schools have no challenges listed.
Other challenges mentioned by schools are as follows:• To remain fi nancially viable• To maintain high academic standards• To build the school to capacity• To keep abreast of educational trends both locally and internationally• To equip staff to meet the transition to the IEB and to cope with curriculum change. Statements
in the site booklets maintain that this affects the FET teachers in particular. They feel that there is no pool of expertise from which teachers can draw, thus causing a sense of insecurity.
• To motivate staff within the current teaching context, where they are constantly challenged by change and bureaucracy
• Large intakes of learners from varied backgrounds• The need to remain relevant within the Independent Sector• The maintenance of values and teaching of values• The implementation of a performance management system• Both primary and high schools using alternative curricula and exit examinations have to align
themselves with the National Curriculum Statement
All the main indicators of good practice listed in Table 32 would appear to be endorsed by between 66 and 89 of the 101 schools. While the differences are marginal, nonetheless, the mentioned indicators stand out somewhat.

36
Table 32: Incidence of main indicators of good practice arising from the evaluation
Frequency Responses from 101 school visits
Indicators favoured by 80 or more schools:
89 Evident commitment by teachers and learners
89 Daily and weekly staff meetings
86 Effective maintenance of discipline
85 Effective support system for learners
Indicators approved of by fewer than 79 schools:
77 Highly qualifi ed and experienced teachers
77 Internal moderation of assessment of achievement and the planning and delivery of lessons
77 Strong parental involvement and support
76 Outreach programmes
71 Learner mentoring system
Least enthusiasm was shown for a common planning template for teachers by 66 schools.
ACCREDITATIONAs many as 96 of the 101 schools in this 2007 group were confi rmed as fully compliant once the verifi cation forms had been fi lled. Five schools were not, but two of these schools were judged compliant on a conditional basis. The evaluator recommended that the one school be offered the opportunity to complete and implement its quality management review process that could lead to an improvement of the matriculation pass rate of 59% in 2006. It was also strongly recommended that the school should resubmit a progress report describing the implementation of the quality management structure presently under review at the school. It was recommended that the other school be given the opportunity to complete the process of reviving its policies and then incorporating them with the practices in the school – in so doing, the evaluator thought that procedures could be documented in line with the activities in the various divisions. It was recommended for a third school that the school return to the status of provisional accreditation for three years with conditions.
INTERNAL EVALUATION OF THE SITE VISIT PROCESSTwo focus groups were formed through random selection from selected members of staff and learners and then interviewed. Information obtained in these interviews provided the most useful evidence in the verifi cation of the points in the school’s more formal accounts of itself. The interviews gave insights into the less easily measurable qualities of the school. In many cases, these were reassuring. In one instance they reinforced the evaluator’s concern in that they revealed deeply unsatisfactory features of the management of the school. For example, the school’s kitchen facilities were found to be totally inadequate. Appropriate facilities do exist but are not being used. When the evaluator questioned this, she was told it was because of the cost of the electricity and because no one had had been taught how to use them. Consequently the cooking is done in an outside shack on an open hearth-like fi re in one big pot. One woman is responsible for cooking for the 104 girls as well as the boarders who attend a local school for grades 10–12.
Most of the other responses refl ected a pride in the caring, nurturing environment of the school and the quality of the educational service received.
GENERAL PERCEPTIONS OF THE SITE VISITSThe 2007 schools completed feedback forms about their perceptions of the quality of the site visits. The fi ndings are presented below in their order of appearance in the questionnaire:

37
1. The programme was felt to be well constructed and effi cient by 100% of the respondents (71 schools).
2. Only three cases did not feel that they understood the Umalusi accreditation process. Some schools asked for “More detail regarding the process involved in being awarded full accreditation”. These schools did not feel they had benefi ted from the site visits. However, two of these are schools that have low scores throughout and possibly found the requirements threatening. The other responses were very positive, for example: “A must for all schools, very developmental and encouraging”.
3. It was generally felt that schools had benefi ted from the site visits and that the process had been valued by nearly all schools. One comment illustrates this: “It helped us consolidate policy documents and rethink procedures”. A number of the schools showed eagerness and pride in showing how they had managed their evidence: “Thank you we loved showing off our fantastic school, staff and learners and being appreciated”.
4. Umalusi’s logistical arrangements were highly rated in 80% of cases, with the remaining responses only a little less than satisfi ed. (In the section asking for a rating to be given, however, 73% gave ratings of 5 or 4, while 27% rated the arrangements between scores of 3 and 1, the rating of 5 being taken as the highest rating descending to 1 being the lowest.) Several schools made repeated mention of the fact that they had not had enough time to prepare “...follow up notifi cation of the visit after the initial documentation early in the year (January 2007) was lacking from Umalusi head offi ce”. “Inadequate notice was given of the exact date. There was confusion with the advance notice. Initially one day was given – it takes time to organise substitution and arrangements for staff.”
5. In 93% of cases there were no reservations about the clarity and usefulness of Umalusi’s documentation and guidelines for the site visit. The remaining 7% had reservations. (In the section asking for a rating to be given, however, 66% gave scores of 5, 22% gave scores of 4 and 12% gave scores of 3–1.) Comments reveal impatience with what were perceived as repetitive questions and documentation requirements, because of the length of time it took to comply. Another school asked for a benchmark for policies and procedures to help schools meet Umalusi’s requirements adequately.
6. The relevance of the presentation to the school was felt to be slightly less than satisfactory in only 4% of the cases.
7. There were slight reservations about the process of verifying the monitoring reports in only three cases. Comments made betray feelings of confusion: “This is still somewhat confusing”; “The site visit report varied considerably from the report on our fi le”; “It was not clear, evaluator used fi rst submission (2005)”.
8. In 98% of cases there was full satisfaction with the information and insights provided by the site visit/ evaluator.
9. In 100% of cases there was full satisfaction with the usefulness of the inspection of the premises.10. Many of the independent schools fi nd that their capacity is constrained owing to the many
regulatory and fi nancial demands made on them. (This issue is further discussed later in the report in the section entitled Accreditation and monitoring costs.) The fi nancial burden felt by some schools in the 2007 group was expressed in this way: “I had understood that on completion of this process we would receive full accreditation, but now understand there is another site visit which will be another expense”. And “As this is mandatory, I feel that it should be government funded. We are already at a disadvantage as we receive no subsidy at all”. Another school said, “The cost of Umalusi registration is too high for a school of fewer than 200 pupils. We would appreciate it if Umalusi looks at a different scale relating the cost to the size, i.e. number of pupils. The rising costs of Umalusi as well as our membership of the ISASA and the Independent Quality Assurance Agency (IQAA) are taking their toll on our budget especially as our costs are high in a special needs school where specialist therapists and staff are employed as well as teachers”.
QUERIES FROM THE SCHOOLS RELATING TO THE SITE VISIT• Several schools asked if the written report could be sent to them in suffi cient time for them to

38
address any areas needing attention.• Many schools expressed an anxiety about the next site visit. They wanted to know when it would
happen and what would be expected of them. For example, “This visit was described as a soft visit and we should expect a hard visit next year. The 2006 visit involved a great deal of time and our school would welcome a clearer guideline of the expectations of next year’s visit especially if we are undergoing an IQAA evaluation in the same year”.
• Some schools described various discrepancies: o “We waited quite long for the report to be sent to the school but it did not refl ect the report
on our fi le.” o “There were discrepancies between high school and primary school in terms of the
feedback on the respective paper submissions handed in on 31/05/2006. Umalusi gave the primary school an indication that some areas were not fully compliant but the high school was indicated as being fully compliant, while the submissions were the same in these areas. This cast a cloud on the site visit as it put the primary school and its principal in a bad light.”
Recommendations for improvement were made by the schools and these have been included in Part 5 of this report.
On the whole, the data and the quality of qualitative records speak very highly for the way in which the site visit programme was conceptualised and managed. The problems that were noted provide useful pointers to correction.
RELATIONSHIPS BETWEEN FACTORS IN SCHOOL PERFORMANCE
FEES AND OVERALL ENROLMENT
When seen in broad categories, there seems to be no pattern at all between average fees and overall enrolment (Table 33). However, when we contrast the 10 most expensive with the 10 cheapest schools, we fi nd a striking difference (Table 36).
Table 33: Relationship between fees and size of enrolment
Fee level* Number in group Total enrolment Average Range
1 26 8 751 365 14–2267
2 21 7 610 401 16–1243
3 15 5 626 402 99–901
4 21 8 754 486 22–805
5 18 9 967 554 178–1 043
Key:* Code for annual fees per learner:1: R0–R9 9992. R10 000–R19 9993. R20 000–R29 9994. R30 000–R39 9995. R40 000–R49 9996. R50 000+
DATE OF ESTABLISHMENT SET AGAINST FEES AND ENDORSEMENTS
Matriculation results are a major indicator of school performance. The data showing the relationship between the levels of fees paid and matriculation endorsements achieved indicate

39
that the number of endorsements achieved increases as the fee levels increase. This could be because the more expensive schools are better able to pay the salaries of more experienced staff members. It could also be that the more expensive schools possess a competent, collaborative management culture building powerful relationships of service and trust between various partners in the management of the school, thereby offering a quality service with satisfactory outcomes (Umalusi, 2006).
However, certain of the low fee paying schools have very good records and a very high fi nal grade; in other words more fees in these cases are not a marker of quality.Table 34 shows the ratio of learners to educators and to classrooms in a comparison between the 10 most expensive schools with the 10 least expensive schools. It also shows the distribution of educators in the sample in terms of gender.
Table 34: Contrastive analysis: Ten most expensive schools with ten least expensive schools: Learners to educators and classrooms
Ten most expensive schoolsAnnual
fees
Total
enrolment
N
Classrooms
Educators
PM
Educators
PF
Educators
CM
Educators
CF
Total
Educators
45 535 881 39 17 52 69
46 665 385 27 17 21 38
46 816 1004 64 11 55 2 7 75
47 280 476 41 13 33 46 92
48 000 178 16 1 13 4 14 32
48 570 699 51 3 56 59
49 410 869 69
56 535 691 20 6 40 9 17 72
106 000 547 58 42 17 59
115 000 549 54 44 11 2 5 62
Average 60 981.1 627.9 43.9 15.4 29.8 1.7 8.9 55.8
Ratios
Learners:educators 11.25269
Learners:classrooms 14.30296
Overall, there are more than twice as many women educators than men in the more expensive schools and as many as three times more women educators are found in the least expensive schools. This could be because their salaries are lower than those of men.
Ten least expensive schoolsAnnual
fees
Total
enrolment
N
Classrooms
Educators
PM
Educators
PF
Educators
CM
Educators
CF
Total
Educators
0 104 4 3 2 1 6
0 523 22 7 15 2 4 28
1 200 205 12 4 12 16
1 200 203 11 13 4 17
1 600 253 29 6 24 30
1 850 390 15 8 15 1 24
3 000 778 20 2 16 18
3 600 299 15 17 17

40
3 700 308 34 6 33 39
3 900 328 16 4 13 1 2 20
Average 2005 339.1 17.8 4 14.4 0.5 2.6 21.5
Ratios
Learners:educators 15.77209
Learners:classrooms 19.05056
It is interesting to note that the least expensive schools are, on average, half the size of the most expensive schools (which must exacerbate their fi nancial diffi culties). They have higher ratios of learners to educators and classrooms and half the size of staff. However, in comparison with some of the schools in the public sector, these ratios are easily managed, and should still allow for suffi cient individual attention. Therefore, the quality of the teaching and learning process in the classroom should not be negatively affected by this variable. (This is endorsed by the fact that, when asked what made their schools special, 43% of the schools were valued for the relative smallness of their classes and the amount of individual attention received, and 19% of these were schools within the two lowest fee levels. Twenty-four percent of the schools were also acknowledged for creating a caring, family environment for their learners away from home. Again, 10 of these schools fell within the lowest fee levels.)
Table 35: Contrastive analysis: Ten most expensive schools with the ten least expensive schools: Educator qualifi cations and endorsements
Ten most expensive schoolsAnnual
fees
Unqualifi ed Diploma Bachelor Master Doctor Total % Endorse Foreign
R45 535 5 35 32 3 75 98% 2
46 665 1 15 22 2 40 96% 1
46 816 25 40 2 67 94%
47 280 1 43 3 47 Primary
48 000 6 4 10 100%
48 570 17 39 3 59 92% 1
49 410 18 61 6 85 Primary
56 535 5 40 1 46 96% 2
106 000 1 3 49 6 59 Primary 1
115 000 2 42 10 1 55 99% 0
Average 7 127 372 36 1 7
% of Staff 1.20% 23.40% 68.50% 6.60% 0.10% Av 96% 1.20%
T Staff 543
Ten least expensive schoolsAnnual
fees
Unqualifi ed Diploma Bachelor Master Other Total %
Endorse
Foreign
0 1 3 1 5 68% 2 NC
0 19 6 3 28 0
1 200 7 7 1 15 0
1 200 2 5 6 13 Primary 0
1 600 2 17 4 2 7 32 10% 0
1 850 3 18 0 1 22 1
3 000 16 8 1 3 28 Primary 9
3 600 4 11 2 17 54% 0
3 700 31 9 40 81% 0

41
3 900 2 12 3 17 1
Average 2005 1.9 12.9 4.9 1 1 1.3
% of T
staff
8.70% 59.40% 22.60% 4.60% 4.60% Av 53.3% 5.90%
T Staff 217
Key: “Other” refers, for example, to technical or skills trainers
In the more expensive schools, educator qualifi cations are skewed markedly towards academic degrees. (As many as 70.5% of these teachers have degrees.) In the least expensive schools, educator qualifi cations tend towards professional educator qualifi cations. There are few foreign teachers in both groups, but fi ve times as many in the least expensive schools. Lower salaries could be a contributing reason for both these factors.
A far higher ratio of university endorsements (to the number who wrote matriculation) is found in the most expensive schools An average of 96% endorsements (to the number who wrote matriculation) is found in the most expensive schools, which is a far higher ratio of university endorsements than the average of 53.3% endorsements in the least expensive schools. This could indicate that the presence of experienced staff does impact effectively on important results and therefore they do add value to the schools that can afford them.
(See comments made under the earlier section entitled Date of establishment against fees and endorsements, and Table 36.)
Table 36: Contrastive analysis: Educators’ experience and results
Most expensive schools
Fees Endorse/ Wrote Enrol/ Exp
School C 39 615 84% 20
School D 40 000 93% 18
School E 45 535 99% 23
School F 46 816 94% 23
School G 47 280 98% 10
School H 48 570 97% 17
School I
School J 56 535 98% 16
School K 106 000 96% 12
School L 115 000 92% 13
School M 54 535.1 85% 15
Least expensive schools
Fees Endo/Wrote Enrol/Exp
School C 1 600 54% 15
School D 3 000 10% 389
School E 3 700 68% 0
School F 3 900 81% 82
School G 4 750 70% 24
School H 5 000 16% 0
School I 5 280 100% 18
School J 5 900 12% 162
School K 6 500 36% 34

42
School L 6 790 38% 54
School M 4 642 48% 78
Note: In this analysis the 10 least and 10 most expensive schools that entered candidates in the Senior Certifi cate in 2006 have been selected. The selection is therefore different from the other contrastive analyses, which included primary schools.
Unfortunately the data offers no basis for linking educator experience with qualifi cations. In other words, it is impossible to test the correlation of, for example, the proportion of teachers with both high qualifi cations and long experience with aspects of school quality.
The inclusion of Table 36 is important as it adds another dimension to the information learned previously about the more expensive schools in this sample and their results. In essence the table shows that:• In the nine expensive schools (barring one for lack of data), there are on average 15 learners for
each permanent educator with more than 10 years’ experience, and the matriculants achieve 85% endorsements (in 2006).
• In the 10 least expensive schools, there are on average 78 learners for each permanent educator with more than 10 years experience, and they achieve 48% endorsements (in 2006).
EDUCATOR QUALIFICATIONS, EXPERIENCE, RESULTS
To use Table 37:
T Enrol is the total enrolment of the school
Wrote = n who wrote matriculation in 2006
Endorse = n who obtained endorsement in 2006
The Ratio is endorsements to n who wrote
Total B is the total number of staff (M and F, Perm and Contract) with Bachelor’s Degrees
B/Enrol is the ratio of educators with Bachelor’s degrees to the enrolment
T 10–20yrs is the total number of staff (M and F, Perm and Contract) with between 10–20 years experience
E/Enrolment is the ratio of educators with 10 – 20yrs experience to enrolment
Thus, for example, School D has 17% endorsements, 15 learners for each teacher with a B degree, and 46 learners for every teacher with between 10 and 20 years’ experience.
Table 37: Educator qualifi cations, experience and results
T Enrol Wrote Endorse Ratio Total B B/Enrol T 10–20y E/Enrol
School A 1243 19 0% 20 62 16 78
School B 74 72 97% 39 0 22 0
School C 691 54 0 0% 32 22 30 23
School D 91 6 1 17% 6 15 2 46
School E 805 4 1 25% 3 268 2 403
School F 542 20 2 10% 8 68 5 108
School G 22 3 2 67% 1 22 1 22

43
School H 476 7 3 43% 7 68 3 159
School I 1043 31 3 10% 29 36 32 33
School J 2267 91 3 3% 30 76 15 151
School K 363 13 5 38% 8 45 2 182
School L 612 14 6 43% 10 61 16 38
School M 304 45 7 16% 11 28 23 13
School N 765 19 9 47% 21 36 15 51
School O 505 43 12 28% 6 84 4 126
School P 678 104 14 13% 19 36 1 678
School Q 901 26 14 54% 4 225 14 64
School R 415 19 14 74% 14 30 1 415
School S 72 115 14 12% 4 18 8 9
School T 742 39 14 36% 5 148 3 247
School U 269 15 15 100% 16 17 10 27
School V 452 15 15 100% 9 50 11 41
School W 23 16 70% 11 0 9 0
School X 1004 19 18 95% 39 26 34 30
School Y 419 27 19 70% 30 14 #DIV/0!
School Z 804 35 20 57% #DIV/0!
School a 869 27 22 81% 22 40 4 201
School b 269 44 24 55% 13 21 9 97
School c 330 31 24 77% 30 11 5 54
School d 637 40 26 65% 14 46 22 15
School e 878 39 29 74% 18 49 12 53
School f 171 44 30 68% 9 19 11 80
School g 778 44 30 68% 38 20 9 19
School h 549 35 35 100% 42 13 29 27
School i 547 43 36 84% 41 13 19 29
School j 604 52 41 79% 15 40 21 26
School k 204 52 44 85% 23 9 14 43
School l 160 47 46 98% 44 4 14 15
School m 14 57 46 81% 13 1 19 8
School n 702 50 47 94% 43 16 3 5
School o 740 50 48 96% 12 62 25 28
School p 253 55 51 93% 34 7 20 37
School q 239 69 59 86% 51 5 18 14
School r 699 61 61 100% 64 11 21 11
School s 583 68 62 91% 27 22 25 28
School t 76 70 92% 45 0 22 27
School u 328 71 70 99% 32 10 29 0
School v 503 77 77 100% 45 11 29 11
School w 257 81 79 98% 43 6 28 18
School x 557 91 85 93% 52 11 20 13
School y 263 86 86 100% 61 4 35 16
School z 881 91 87 96% 49 18 25 11
School zi 363 111 99 89% 41 9 29 30

44
School Yii 112 103 92% 49 0 33 0
School xiii 117 116 99% 57 0 24 0
If one examines the ratio of endorsements achieved in the group of 10 schools with percentages below 30%, one would expect that they should also have very few experienced teachers on the staff, as shown earlier in Table 36. In other words, the column showing the ratio of teachers with 10–20 years of experience to the number of learners enrolled at the school would be very high. However, there are fi ve of the ten schools with relatively low or very low numbers. This seems to indicate that there are other infl uential variables at work in these schools.
There is an impressive number of schools (26 out of 55) that achieved endorsements of 80% and above. Five of these schools have high (above 30%) to very high ratios of learners enrolled to educators with 10–20 years of experience. (School “a” has 201, yet still manages to achieve 81% endorsements!)
Table 38: Fees paid, together with “What makes your school special?”
Fees 1 2 3 4 5 Null Total
Total in group: 21 20 13 16 14 17 101
Small classes with lots of individual attention
8 11 6 7 6 5 43
A caring family away from home 2 8 5 5 2 2 24
Nurture the best values and/or foster religious belief
12 9 5 10 3 9 48
Top tuition, additional support, almost guarantee top matriculation passes etc.
1 4 0 7 2 3 17
Safe, peaceful, attractive and healthy environment with excellent facilities
1 2 3 5 4 3 18
Maintain a particular tradition for a particular group of people
3 0 0 1 0 5 9
Specialised offerings for learners with special needs
1 0 2 1 2 0 7
Highly qualifi ed and experienced staff with great track records
2 3 2 3 5 1 16
Other (set out in narrative) 9 6 4 6 6 4 35
Key:* Code for annual fees per learner:1: R0–R9 9992. R10 000–R19 9993. R20 000–R29 9994. R30 000–R39 9995. R40 000–R49 9996. R50 000+Null: No fees listed
Note the similarity between the number of responses claiming that their school “nurtures the best values and/or fosters religious belief” (48) and the earlier description of the reason chosen for the establishment of a school being “To maintain/ nurture/ develop particular values and or religious practices” (42). In each instance, this is the highest response. It would appear that signifi cant sections of the population feel that the protection and emphasis of their religious beliefs is important in a society where religious ethics and values are becoming increasingly generalised into social values.
45
Possibly it can also be said that another reason for establishing a particular school is refl ected in the next most popular response for a school being special, in other words it is to be hoped that the goal “To realise a special vision of educational quality” is realised in “Small classes with lots of individual attention” (43).
The next most popular response, “A caring family away from home” (24) as well as “Safe, peaceful, attractive and healthy environment with excellent facilities” (18) endorses the fact that in the quest for quality service delivery in education many cherish the quality of the experience; the ethos; the quality of nurture and the values imparted in daily interactions, etc. (Umalusi, 2006).
Many parents welcome the opportunity to send their children to schools established on the premise that they will “give learners the best chance of getting a good place in higher education.” This could explain the numbers of responses for “Top tuition, additional support, almost guarantees top matriculation passes, etc.” (17) and “Highly qualifi ed and experienced staff with great track records” (16).

46
PART 4 DISCUSSIONIn this part of the report we look fi rst at the broad picture emerging from the site visit programme, and then revisit the aims and goals of the project and the specifi c questions that it set out to answer. Of necessity, this section cannot cover all of the points of interest made in Part 3.
ISSUES THAT EMERGED FROM THE SITE VISITSThe visits once more provided a valuable window into the sector and allow some important observations to be made. The most obvious relate to the uncertain policy situation of Umalusi itself.
THE ROAD AHEAD FOR THE ACCREDITATION AND QUALITY ASSURANCE PROCESSUmalusi continues to persevere in the achievement of its mandated task as outlined in the GENFETQA Act and, in so doing, is moving substantially towards meeting the objects of the Act. However a number of unresolved issues have delayed Umalusi’s progress in certain aspects of this work. These matters relate particularly to gaps in policy; contestations created by overlapping mandates and contradictory legislation; conceptual differences in qualifi cations design and other features of the National Qualifi cations Framework (NQF) quality assurance model; a serious lack of coherence and articulation in the General and Further Education and Training (GFET) bands, not only in the various qualifi cations but in quality assurance practices in general; and the appropriateness of the South African Qualifi cations Authority (SAQA) / Education and Training Quality Assurance Body (ETQA) accreditation model (Umalusi, 2007).
Two recurring concerns reported from the schools are the delay in clarifying full accreditation status and the fact that the public school system does not seem to be subject to the same requirements and procedures as the independent school sector. The harmonising of provincial registration processes and Umalusi accreditation needs urgent attention.
Perhaps Umalusi’s intention to take what is learned about the quality of education forward initially within the independent schools and then into the public school sector to set a national standard should be communicated to the stakeholders within the process.
Certain schools with strong religious affi liations are asking why their own provider associations cannot give them accreditation. They are concerned that values that are core to their functioning are not being acknowledged within the accreditation process. Umalusi recognises the importance of a school’s being strongly guided by values and seeks to protect diversity around core values. However, Umalusi can only note that a school is seriously aligned to a set of acknowledged values. It can look for that quality in general, but obviously cannot undertake accreditation on the basis of specifi c religious or ethical orientations. The schools concerned might well organise their own external quality assurance to affi rm that aspect for their clientele. This would add to the demands of the current number of authorities schools must account to in different ways in the case of the particular school. However, it must be accepted that Umalusi is the only statutory body responsible for their general accreditation. This issue may need to be given greater prominence in Umalusi’s advocacy of quality assurance.
SCHOOL CHARACTERISTICSThe schools in the 2007 group were fairly evenly distributed between those charging the lowest

47
annual fees and others charging the highest fees per annum. Most of them were located within towns or cities. The following picture emerges from a reading of the site visit booklets and other qualitative feedback and from the quantitative data: • The traditional, long established, single sex schools charging annual fees upward of R40 000 per
year for excellent results are represented, but alongside them are more recently established, equally expensive, well respected, coeducational schools, also achieving very well.
• The largest number of schools in this sample was established for religious reasons. Some of the best results were achieved by schools with religious affi liations charging modest fees. But there was also one school in the set with a quite unacceptable record, from which accreditation has been withheld, where one problem area is described thus: “All the learners in the focus group complained very much that there was very little choice of books in the library. Most were religious books or a few reference books. They very much want novels and books to read for enjoyment or books about ‘life.’”
• There were some schools charging the lowest annual fees that had impressive records, high results and offered a quality service. These appeared to be the kind of school that could easily be used as national exemplars. One would feel privileged if one’s child were admitted to a school like this.
• While most of the schools in the sample offer a good service to the families and the learners using them, there was a small group of schools that regularly appeared with low evaluator ratings in most categories. Schools like this must be given specifi c attention to ensure that the problems they experience are corrected but, more broadly, to protect the credibility of the accreditation process. They risk being overlooked, with the possibility of slipping through the quality net, because the large majority in the sample happens to be performing well. Similar sentiments were expressed in the 2006 report.
• Certain schools also appear to be responding to the public demand for an accommodation of diversity. Part of this response seems to have resulted in some good schools offering open access and providing opportunities for children from informal settlements within their local communities. The challenges inherent within this situation are refl ected in the concerns described in focus group interviews. These schools need to learn how to attract parents and then to involve them in the learning process of their child. They struggle to cope with the considerable costs of educating these children and with the differences in awareness about the educational fi eld between the disparate groups attending their school. These are daunting challenges faced by many schools in South Africa today, in both the public and the independent sectors.
• In other cases the response has meant either including paramedical staff on the school staff in order to meet the needs of support experienced by many learners or learning how to work collaboratively with such specialists. Previously in many instances when learners did not meet the required standard they were encouraged to fi nd a more “appropriate” educational placement.
(While in some cases the visit possibly raised expectations of positive intervention beyond Umalusi’s capacity or the proper role of a quality assurance body, perhaps the fact that the concerns have been noted may draw them to the attention of the provincial authorities.)
• This year’s group of schools consisted of schools that consider themselves to be in a high state of readiness for full accreditation. Accreditation candidates with full compliance in all the areas were therefore prioritised and, to a limited degree, some were included with only one or two areas in which they did not fully comply with the criteria. Very few schools have less than a 100% matriculation pass rate, and there are few exceptions to high ratings by the evaluators.
EMERGING PERSPECTIVES ON QUALITYBased on frequency of mention in the site visit reports, the factors bearing positively on quality are commitment by teachers and learners; effi cient school management; learner support of every description, nurturance of religious values and effective maintenance of discipline. The importance of parent involvement was also mentioned only slightly less often.
The fi gures linked to the site visits suggest that the rates of endorsements for access to higher

48
education together with educators with lengthy teaching experience are strong discriminators of quality. However, such factors must always be seen against the particular school’s context and intentions.
EDUCATORS’ YEARS OF EXPERIENCE AS AN IMPORTANT FACTOR IN THE PASS RATEA striking fi nding in the analysis of the extensive array of data related to the site visits is the strength in this group of schools of the positive correlation between educator experience and the achievement of endorsements. This stands out in the contrastive analysis comparing educators’ experience and results as well as where the date of establishment is examined against fees paid and endorsements achieved. But the contrastive analysis investigating relationships between educator qualifi cations, experience and results seems to indicate that there are also other factors involved.
This information serves to confi rm the signifi cant role played by the experience of teachers in the effectiveness of teaching and learning. The fi nding can be added to the fi nding in 2006 of a high correlation between teachers’ qualifi cations and results. The factors contributing to quality and their interrelationship are extremely complex, and these observations are subject to constant critique and development.
TO WHAT EXTENT WERE THE AIMS AND GOALS OF THE SITE VISIT PROGRAMME SATISFIED?Here we revisit each point in the light of the evidence and argument offered above.
AIMS
OneUmalusi must be seen to exercise its statutory responsibility to quality assure education and training in the general and further education bands. This includes the accreditation of independent schools and guiding the improvement of public schools according to the same criteria.
This report demonstrates how seriously and fully Umalusi has approached its responsibility for accreditation and school improvement. Feedback by those involved in the process suggests that the programme has brought credit to Umalusi, and a positive response to the institution of accreditation. The value for public schooling is essentially that of example and infl uence, both of which have been fostered by the site visit programme.
TwoThe Division for Accreditation was committed to carrying forward its work in progress on the accreditation of independent schools, notably by monitoring the response to the fi rst two steps in the development of Umalusi’s accreditation role.
The site visit programmes, the way in which they were conducted and the reports on their fi ndings have set a high standard for the future growth and development of this process.
49
ThreeIn the interests of its mission, Umalusi needed to move into a more proactive and visible role in the quality assurance of independent schools.
After several years of consultation, system building and technical implementation, the site visit programme has clearly moved Umalusi into a highly visible position of positive initiative in the accreditation and quality assurance of independent schooling. Stakeholders are asking when it will perform its less direct role in public schooling.
FourThere was also a need to develop Umalusi’s own institutional capacity in terms of a more concrete understanding of the nature of the sector and to give shape to its practices; in this sense the present programme is a pilot for later monitoring and evaluation.
The second site visit programme has continued to contribute to Umalusi’s capacity to accredit and assure the quality of independent schools in an informed and constructive manner. Experience, human contact and understanding of the sector have been extended and deepened. The schools themselves are now contributing valuable recommendations that provide further information for streamlining and focusing the work in future.
SPECIFIC GOALS OF THE SITE VISITS
OneStart to develop an endogenous set of benchmarks for good practices in independent schooling.
An indicator on its own is insuffi cient. On the whole, and specifi cally in an educational setting, the idea of an indicator is poorly understood. So much more is involved than simply recognising an example of good practice. (In this instance, the meaning of the term “indicators” has been taken to be: “Indicators are statements of aspiration against which existing arrangements can be compared in order to set priorities for development” (Booth and Ainscow, 2002).) Aspects like tough but loving discipline and the nurturance of religious values rate highly, as well as systematic management. Yet a reading of the site visit booklets suggests the overwhelming importance of leadership and positive attitudes from management towards the staff, and of professional commitment by the educators. In addition fi gures show that greater professional experience is positively correlated with achievement. It is these qualities that give depth and meaning to good discipline, ethos and cognitive excellence.
TwoAssess the initial impact of and response to the three-year provisional accreditation process launched in 2005.
As can be seen in Part 3, the general response in this sample to Umalusi’s action for accreditation is almost universally positive. Schools that had entered the accreditation process showed a high degree of compliance to Umalusi’s requirements. In spite of the positive response, though, there were cases where schools seemed to feel threatened by the process and complained about

50
certain aspects of it.
Many schools claimed that they valued the impact of Umalusi’s requirements. As usual in situations of innovation in education, it was the more capable institutions that seemed to benefi t most from the accreditation process. Finding ways to help low achieving schools to benefi t will need special strategies and possible modifi cations to procedures that are currently beyond their capacity.
ThreeGather information to inform Umalusi’s future approach to potentially at-risk schools and undesirable practices.
The site visit programme has provided information and insights that will be used in planning the way forward. These are followed through in the recommendations in Part 5.
FourVerify the accuracy of information provided by provisionally accredited schools as submitted in self-evaluation reports
As in 2006, the intensive verifi cation process was very positive indeed on the whole, with very few examples of unsatisfactory information; a small handful of schools can be identifi ed for Umalusi’s attention in this regard.
QUESTIONS THAT THE SITE VISITS SHOULD CLARIFYCertain practical questions needed answers or clarifi cation:• Verifi cation of provider information:
o Are the claims made by provisionally accredited providers during self-evaluation true? Yes, they appear to be remarkably reliable in most cases.
o To what extent is the data consistent with the self evaluation? For the most part the data is recorded as consistent.
o Are schools as compliant as they claim to be? Yes. With some exceptions, the schools concerned seem to be quite honest
about their levels of compliance.
• Unaccredited and/or unregistered providers:o Is the “fl y-by-night” element one to be concerned about? Are learners being exploited? There are still a number of providers that have managed to dodge the regulatory
environment, particularly regarding qualifi cations. This disadvantages the compliant providers, in that the non-compliant providers provide certifi cates and diplomas of suspect credibility. This has also been identifi ed as a reason for loss of revenue and learner numbers – a learner is more inclined to enrol for a six-month diploma (not registered on the NQF but purporting to be a qualifi cation because it has the same title as the NQF-registered one), than for a higher certifi cate at NQF 5 of two-year duration (Umalusi, 2007, p 11). Umalusi needs to be able to act against
2 Consultations in the follow-up to Umalusi’s 2005 evaluation of assessment bodies led to agreement that the standard quality assurance term “best practices” might be useful in an industrial situation, but that the diversity and contextual variation in education meant that the term “good practices” was more suitable.

51
such unscrupulous provision by, for instance, continually updating and exchanging registration lists and accreditation lists with the PDEs. The monitors agree because only the DoE can close these providers down. However the Department does not get a biannual report. This will start this year and Umalusi could ask the Department to act on these problems. Umalusi’s statutory authority to act on unscrupulous provision has been limited by the fact that its accreditation policies have not yet been approved and declared policy by the Minister of Education (as stipulated in the GENFETQA Act), despite numerous submissions, the most recent being May 2007 (Umalusi, 2007, p.5).
o Are subsidies being paid to under-performing schools or those that do not meet the criteria? Only a third of the schools in the 2007 group of schools receive subsidies. All except
one of them charge fees under R20 000 per annum. A few of the lowest fee paying schools offer excellent services and have good results. But there are also four of the recurrent low achieving schools amongst the low fee paying schools.
o What is the general impact of “accreditation”/ registration? The best answer to this hasn’t changed since 2006, which is “already positive in high
achieving schools, and highly promising in the low achieving schools – if Umalusi manages to sustain its current quality of professionalism; if the PDEs play a fuller, clearer role; and if appropriate political will and business support can be brought to bear on this sub-sector” (Umalusi, 2006, p.54). It is to be hoped that accreditation action for independent schools will set an example for action in public education.
• Effective strategies for dealing with the situation: The questions under this heading are dealt with in Part 5.

52
PART 5RECOMMENDATIONS
WHERE TO FROM HERE?This report confi rms the impression gained in 2006 that Umalusi is moving in the right direction, both in its accreditation practices for independent schools and in its modelling of a process that could be helpful in the quality assurance and improvement of public schools.
However, Umalusi is not the sole custodian of educational standards and the interests of learners, parents and communities. The stakeholders themselves need to be active partners in promoting improvement. There have been major paradigm shifts within the education fi eld, in particular in recent times, which endorse this factor. (Paradigm shifts can be seen as liberations from old limits, presenting new ways of thinking about old problems.) For example, old styles of management have been replaced by new participatory approaches. Various comments made during these site visits in focus group interviews or in evaluative questionnaires illustrate both the need for such approaches and their success when implemented in certain schools. The future is seen as a collaborative effort.
This new paradigm emphasises values rather than growth, control and manipulation. Again, the number of responses from schools that approved of the nurturance of the best values comes to mind, as do the comments made earlier about indicators. Apparently outcomes are driven by the ways we choose to relate – to ourselves, to each other, between institutions, etc.; so much so that our very survival may depend on our ability to relate in new ways. We can choose competition (forces in opposition), co-operation (forces in parallel) and co-creation (forces in fusion). Over-reliance on competition can be destructive, yet co operation can be a superior form of relationship in nature and in organisations, psychologically, physiologically and economically. New science has contributed to a paradigm of wholeness and interconnectedness, although it must be remembered that overdependence on any single form of relationship may be dysfunctional (Joba, Maynard & Ray, 1993, p.50–52).
It should be stressed, then, that few of the approaches recommended for Umalusi below can be successfully carried through by Umalusi alone. The active participation and responsibility of other role-players is vital.
RECOMMENDATIONS FOR UMALUSI’S ATTENTION
GENERAL RECOMMENDATIONS FOR IMPROVEMENT MADE BY THE SCHOOLS
Several schools commented on the way in which Umalusi documents had been expressed. For example:• “The wording could be simplifi ed – to know exactly what “proof” the monitors are looking for.
Perhaps a key could be added to simplify it.”• “The only criticism we have with this process is with the narratives themselves. Umalusi really
needs to pay immediate attention to the documents. It is very diffi cult to interpret what the requirements are. Umalusi needs to be far more direct in what they require and specify what supporting documentation they require. There is also a lot of overlap between narratives. The document in general can be simplifi ed and more specifi c.”
• ”Our school feels that the structure and terms of the evaluation needs to be simplifi ed and phrased in language familiar to the SA school environment. This refers in particular to the documentation requested prior to the site visits.”

53
OTHER POSSIBLY USEFUL RECOMMENDATIONS
• “The pre-visit workshop and the resource package were very useful. It would be interesting if an annual meeting of this nature could take place with all the independent schools in each province, so that good practice workshops and ideas for running an effective school as well as report back from the site visit could be shared.”
• “More clarity on the way forward for our school – presume this will come in feedback report from Umalusi. We were made aware of the fact that this is an ongoing process. Is there space for us to fulfi l a requirement according to our own method rather than a prescribed method, for example, presentation of strategic plan, way in which we monitor departments, etc.? Overall the whole experience was positive and our evaluator was great.”
• “Indicate the time-frame that must be used for evidence to be relevant. Umalusi should be careful not to become prescriptive. Our parent survey was done by a professional person but could not be used by Umalusi in their survey. Our strategic plan’s time-frames do not coincide with the requirements of the instrument provided by Umalusi. It is common practice to have a plan over a three- to fi ve-year period. I would suggest to ask for the current strategic plan.”
• “I think that the evaluators should arrive with the school portfolios and do a few crosschecks to see if the required evidence is in fact refl ected in the portfolio. This will avoid contradictory reports on the same school site.”
• “Select the assessor carefully. Focus must be on a much more consistent approach on meeting Umalusi’s minimum requirements.”
• Please ensure the evaluator has looked at the school’s documents at the Umalusi offi ce before making the site visit. It would be preferable for the site evaluator of a special needs school to have some knowledge of the specialist therapy and approaches used in order to understand the school’s philosophy.”
“Umalusi is not empowered to take on the role of an activist agency. As a national quality assurance body it can analyse, inform and provide guidelines. Its powers lie in infl uence, not in provision or intervention” (Umalusi, 2006). Yet, perhaps because it is seen as effective and infl uential, and possibly because other stakeholders still operate within old paradigms of authoritarian control and dependency, expectations arise that it is able to engage in corrective action. “These expectations are found both among the schools and the national and provincial education authorities. Managing these expectations, stimulated by projects like the site visits, is an important challenge for Umalusi.” (Umalusi, 2006)
It would seem that one of the fi rst recommendations is that these points should be communicated to all participants in the process. Umalusi uses a developmental approach. Inherent within such an approach is the belief in the potential of others to be effective. However, development cannot be forced; it can only be supported and nurtured. Therefore, part of this communicative process should be to actively inform agencies with the power to act, and encourage them to respond appropriately.
As recommended in 2006, facilitating workshops on issues of key concern emerging from this report will be a valuable consequence of the site visit programme. Perhaps these workshops would be a good place to share another principle of the developmental approach, which is that the present and future is more important than the past. The past can inform the here and now, but there is no emphasis on causes. The emphasis is on the best use of each moment in order to take the next step in the process of improvement. In facilitating, development agencies need to ask what does this school need to know now or be able to do now in order to be effective, that is to take the next steps and continue to grow; the focus being on the next steps, not on the next 10 years!
The following recommendations are set out in response to the questions that Umalusi raised at the start of the site visit programme in 2006. In most instances there is no change with this group of schools, but the content is repeated here because the issues are important.

54
HOW SHOULD UMALUSI RESPOND TO PROVIDERS THAT MAKE FALSE CLAIMS FOR ACCREDITATION?On the whole the schools do not appear to make false claims. In the few cases where focus group responses indicate that they do, they may be requested to rectify the situation and be given a polite fi rst warning that their accreditation would be jeopardised by lack of confi dence in their ability to provide valid information. In at least one clear case and another potential case from the 2007 school visits, there were serious inconsistencies in the presentation of results. Umalusi will follow up anomalies like this on an individual basis.
HOW SHOULD UMALUSI RESPOND TO THE NEED TO IMPROVE ITS MONITORING AND VERIFICATION SYSTEM?Both the evaluators and the schools have made suggestions on the refi nement of procedures and these should be used to inform amendments made to the design of data collection and management.
Given that Umalusi must ultimately concern itself with many more independent schools (estimated at between 1 200 and 2 000), procedures will have to be simplifi ed and streamlined, with major but discerning use being made of ICT. It will be most important to develop a clear and purposeful use of a limited set of indicators. At the same time, Umalusi must stick to its widely valued commitment to process and insight. (Umalusi, 2006, p.56)
Perhaps the mechanism used by evaluators for scoring needs examination because it can be very subjective. Examples of this issue were pointed out on p.26, 2nd paragraph; p.28, 2nd paragraph, and on p.30, fi rst paragraph. Another example is as follows: One of the low achieving schools mentioned throughout the report was found to be compliant with a score of 3 while another was found not to be compliant with a score of 2.9. A principal of a school commented: “The grading system used by Umalusi is too dependent on the opinion of the evaluator. In some cases our school was given a 5. How do I get from a 5 to a 6?” In a sense, this issue relates to the drive toward providing a service of higher quality. Effective sensitive measurement of performance therefore needs to be found together with some means of improving on past performance.
HOW SHOULD UMALUSI RESPOND TO UNACCREDITED PROVIDERS/FLY-BY-NIGHTS OUTSIDE THE QUALITY ASSURANCE LOOP?Schools that have been identifi ed and visited or at least contacted are properly required to set a date by which they will enter the loop. This must be strictly followed up. It would seem advisable to commission a dedicated study with specialised investigative tools to locate and identify all unaccredited schools. Umalusi would then have to use appropriate carrots and sticks to get them into the process. At the same time, the provinces with poor databases regarding independent schools must be encouraged to improve these. (Umalusi, 2006, p.56)
HOW SHOULD UMALUSI RESPOND TO THE MAIN CHALLENGES?The need to align registration and accreditationThe consolidated report on the Umalusi site visits in 2006 pointed out that improved capacity might be developed in some PDEs for registering and monitoring independent schools. This year the need still persists, particularly with input issues like the adequacy and suitability of premises and facilities, compliance of school premises with health and safety regulations, and the suffi ciency and quality of staff members that should be dealt with through the registration process. This would enable the accreditation process to focus on the capacity of schools to provide quality education.
The confusion and duplication caused through the lack of understanding of the link between registration and accreditation places sometimes unsustainable burdens on resource-poor schools

55
without full capacity for the management and administration needed. As described earlier in the report – competent, qualifi ed staff members in less expensive schools have to carry a heavy load, as is seen in the example from the site booklets of the principal who had to act as administrator, manager, educator and HoD for all learning areas in the FET phase. Another school has to send similar statistics to two different departments of education each with different forms and statistical requirements (Table 31).
It is also important to ensure that application for accreditation becomes one of the requirements for school registration but schools and authorities are burdened with numerous forms of bureaucratic reporting to Umalusi, their associations and provincial departments.
“This problem of an overload of bureaucratic reporting is found in public education provision as well, but is worsened in the independent sector by the fact that independent schools must be run as businesses or public benefi t organisations, requiring further reporting, especially to the South African Revenue Service. Such additional data, where it is not confi dential, might be usefully incorporated into Umalusi’s quality assurance process.” (Umalusi, 2006, p.57)
In addition, a strong recommendation made in 2006 is that Umalusi convene a meeting with the DoE, PDEs and the effective independent schools associations to look at the possibility of harmonising the demands on independent schools to provide information of a similar type in very different formats for registration, accreditation, association membership and taxation purposes. (Common formats would make it easier for all stakeholders to access rich data. At the same time, care would have to be taken not to limit the independent roles of each stakeholder.)
In general, Umalusi must continue with the development of benchmarks for good practice and adequate capacity in the sector through the continued use of peers as evaluators and the sharing of good practices. In addition to the once-off series of workshops suggested above, annual good practice workshops might well be instituted. Some schools asked for these when they completed the internal evaluation of the site visit process. (See earlier comment under the title General recommendations for improvement made by the school.)
Finally under this heading, it is clear that in spite of extensive efforts to communicate with the sector, many institutions are either unaware of the accreditation process or of all its requirements. Umalusi must, therefore work on a more effective and far reaching “communication strategy” This would satisfy several of the schools’ queries and recommendations made when giving feedback on the site visit programme.
Accreditation and monitoring costsThe capacity of private providers in particular is strained owing to the many regulatory and fi nancial demands made on them. Issues from the section above also exacerbate this situation even further.
Umalusi’s Report to the Minister of Education (2007, p.11) explains that a number of providers have brought to Umalusi’s attention the accumulative effect of the costs of the various registration and quality assurance processes, as well as the costs of converting their provision to unit-standard-based materials and decentralised individual assessments. This is further endorsed by comments made in the feedback from the site visits.
The report to the Minister notes that typical costs might include a combination of the following:• Registration: Annual registration fees and extension of registration fees• Assessment: If examinations are centralised, examination centre registration fees and annual
examination fees per subject; if examinations are decentralised, repeated moderation fees• Certifi cation: Repeated certifi cation fees• Accreditation: Accreditation fees and repeated annual monitoring fees; and site visit fees• Learning programmes: Programme approval fees (Ranging from R5 000 to R30 000 per

56
programme depending on the ETQA or professional body – keeping in mind qualifi cations are reviewed every three years)
• Learning materials: Learning material alignment and development costs – consultants quote approximately R30 000 per unit standard, depending on the size of the unit; a full qualifi cation therefore costs literally hundreds of thousands of rand if professionally developed, with an entire private industry having grown up around this aspect of the system.
In addition, providers have indicated that the assessment requirements for unit-standard-based qualifi cations are excessively expensive as each learner is assessed individually over a period. As these costs are passed on to the learner for the most part, full qualifi cations are now often beyond the means of learners in the GFET bands. Consequently, providers that are trying to be compliant (especially large national providers) report a dramatic drop in revenue and student numbers.
RECOMMENDATIONS FOR CONSIDERATION BY PDES
WHAT SHOULD THE PDES OR THE NATIONAL DOE DO?The national and provincial authorities should consider setting up common national criteria for registration of schools and examinations centres. The capture of NSC results in future might be rationalised and made more accessible and open to analysis. As indicated above, Umalusi, the DoE and the PDEs should work towards stronger articulation between accreditation and registration processes. (Umalusi, 2006, p.58)
PROVINCIAL SUBSIDIES FOR INDEPENDENT SCHOOLS
While the same level of urgency doesn’t exist in this regard with the 2007 group of independent schools, there were one or two cases where questions could be asked. Therefore this report endorses what was said last year and this is repeated here for further emphasis:
“The offi cial rules and formulae for the allocation of subsidies to needy and deserving independent schools have been carefully worked out in order to satisfy constitutional rights and obligations in a disciplined, fair and accountable way. It would seem, however, that the rules and formulae are subject to various levels of confusion, neglect or potential abuse in different provinces. (For example, the requirements regarding the Senior Certifi cate pass rate and the employment of unqualifi ed teachers may be overlooked in some instances.)
More generally, the capacity of provincial departments to carry out their responsibilities in relation to the registration, monitoring and subsidy of independent schools is sometimes lacking. The development and implementation of uniform national policies for subsidies for independent schools constitutes therefore one of the most urgent recommendation of this report. The national policy and norms are well constituted, so this recommendation should be relatively easy to carry out. Once this has been done, monitoring of subsidised schools, which would seem to be weakly handled in some provinces, would become more consistent and regular. (There might be good reason to carry out an immediate investigation into possible inconsistencies in the present allocation of subsidies to low achieving schools.” (Umalusi, 2006, p.59)
There were schools in the 2007 group that owe their existence to the alternative way they manage the teaching and learning process. Different curricula are used, unusual examinations are written, dissimilar assessment strategies are used and teachers with seemingly strange qualifi cations are employed. While they were complimented on their general Umalusi compliance and teamwork, the schools are concerned about the lack of alignment of these centrally important issues with the national criteria. One suggestion was that perhaps a code system that was aligned with national requirements could be implemented. This problem needs to be addressed.

57
RECOMMENDATIONS FOR CONSIDERATION BY THE SCHOOLS
SCHOOLS’ OWN RESPONSIBILITIES FOR IMPROVEMENT
This group of schools is no different from the 2006 schools in that…
…the usual irony applies in terms of the schools’ responsibilities for self-improvement: the strong schools carry them out, usually voluntarily as part of their professionalism; the weaker schools may not have the capacity to conceive, initiate and implement much self-improvement (Umalusi, 2006, p.59)
It is here that careful, appropriate intervention or links such as working with a “mentor school” might be considered (See section above: How should Umalusi respond to schools with poor results?) Such action would, of necessity, be of an enabling, empowering nature, rather than direct provision that encourages dependencies to develop. Acceptance and ownership of responsibility is a well-known requirement in any rehabilitative programme.
If internal quality management is to be encouraged by the Umalusi approach, it seems that nearly all of the schools should give additional attention to the monitoring of the implementation of their own improvement plans. Once realistic goals have been carefully and cautiously set, a member of staff or a small working group might be given the responsibility to report quarterly on improvement targets. (In their internal evaluation of the site visit, schools indicated that they would appreciate it if Umalusi clarifi ed the extent to which it expects targets to be met.) Provided the will to improve is there, even the weakest schools could carry out such exercises, especially if guidance can be given through productive relationships with other schools in the area.
RECOMMENDATIONS FOR RESEARCH
WHAT FUTURE RESEARCH IS NEEDED?The succinct explanation provided in the report for the 2006 site visits does not need any additions; all the major points are made. It is, therefore, repeated here for further emphasis:
“As indicated already, the reasons for the existence and continuity of independent schools need to be studied. The needs being served by private schools especially in rural areas must be better understood. At the same time, an investigation should be undertaken of the feasibility of expanded public provision to obviate the need for (poorly performing) private schools in certain contexts.
In addition, an investigation might be made into the appropriateness of differentiation of accreditation requirements and procedures for different types of schools with different purposes and levels. The Senior Certifi cate pass rate proved to be a useful starting point for broad analysis, but should be used cautiously in judging individual schools. For example, a few “Matriculation Schools” that take in drop-outs and repeaters at the start of grade 12, may be seen as high achievers with the low percentage of passes they obtain. However, this affi rmation is based mainly on conjecture. More fi nely grained studies of the meaning of the matriculation examination as an indicator of good education and a predictor of various kinds of achievement are constantly demanded.
The question of indicators remains problematic and poorly understood in practice. A process of refi ning indicators plus a longitudinal study of their value (in relation to learner achievements) might prove useful. Umalusi should identify and select the most appropriate information required from schools as ongoing indicators of quality provision in order to make reporting, handling and interpretation less onerous and to avoid duplication.

58
In general the present report should be studied as part of the exploration of areas for in depth investigation and research. The correlation of teacher experience with high achievement is a particularly interesting observation, which may feed into an area of considerable controversy and debate. How the observation might impact on accreditation practices needs further study.
There is little doubt that the emerging practices of accreditation and quality assurance have great promise for school improvement in the medium to long term. The processes involved potentially yield much information of interest for research into the state of education and into school improvement efforts. At the same time research is needed to deepen, clarify and refi ne the approaches to accreditation and the essential insight demanded by quality assurance.” (Umalusi, 2006, p.60)

59
REFERENCES
Booth, T. & Ainscow, M. (2002). The Index for Inclusion. Bristol: Centre for Studies in Inclusive Education.
Department of Education. Draft National Strategy on Screening, Identifi cation, Assessment and Support. February 2006. Pretoria: Government Printers.
Joba, C., Maynard, H.B., Jr., & Ray, M. (1993). Competition, cooperation and co-creation: Insights from the World Business Academy. In M. Ray & A. Rinzler (Eds.), The New Paradigm in Business. Emerging Strategies for Leadership and Organisational Change. New York: Jeremy P. Tarcher – Perigree Books, The Putnam Publishing Group.
Republic of South Africa. (2001). General and Further Education and Training Quality Assurance Act, No. 58 of 2001. Pretoria: Government Printers.
a. Umalusi. (2006). Consolidated report on site visits to independent schools. Pretoria: Umalusi.
b. Umalusi. (2007). Report to the Minister of Education. Pretoria: Umalusi.

60
APPENDIX
Table 39: Date of establishment against fees and endorsements (Fees less than R10 000)
Fees Date of establishment
Wrote 2006 Endorsement
School A 3 900 1869/03/01 57 46; 81%
School B 5 800 1908/01/29
School C 9 130 1928/ /
School D 6 500 1951/01/01 39 14; 36%
School E 1 200 1980/01/01
School F 1 600 1986/04/ 26 14; 54%
School G 5 900 1987/01/01 115 14; 12%
School H 9 800 1987/04/01 4 1; 25%
School I 8 525 1991/01/01
School J 5 000 1991/01/01 45 7; 16%
School K 3 1993/09/01 55 51; 93%
School L 8 004 1993/12/03
School M 7 645 1994/ /
School N 7 080 1995/ /
School O 6 790 1996/01/01 13 5; 38%
School P 1 200 1998/01/19
School Q 1 850 1998/01/26
School R 7 480 2000/01/01 3 2; 67%
School S 3 600 2000/03/30
School T 3 000 2001/04/19 20 2; 10%
School U 0 2003/11/15
Table 40: Date of establishment against fees and endorsements (Fees R10 000 to R19 000)
Fees Date of establishment
Wrote Endorsements
School A 15 000 1872/01/01 112 103; 92%
School B 10 600 1896/01/01 91 87; 96%
School C 14 300 1950/01/19
School D 18 590 1963/02/13
School E 15 900 1984/12/14 35 35; 100%
School F 19 740 1985/01/01 44 30; 68%
School G 14 858 1988/01/01 14 6; 43%
School H 16 800 1991/01/01 40 26; 65%
School I 10 000 1992/01/10 91 3; 3%
School J 12 650 1995/01/01
School K 19 327 1995/01/01
School L 10 360 1995/02/07 104 14; 13%

61
School M 16 800 1996/01/01 39 29; 74%
School N 15 000 1997/01/01 19 9; 47%
School O 17 880 1997/01/01
School P 16 200 1997/01/16
School Q 13 800 1998/01/01
School R 11 500 2000/01/01 19 14; 74%
School S 13 750 2002/01/03
School T 12 000 2006/01/01
Table 41: Date of establishment against fees and endorsements (Fees R20 000 to R29 999)
Fees Date of establishment
Wrote Endorsements
School A 25 918 1903/03/01 61 61; 100%
School B 20 000 1909/01/01
School C 25 600 1928/ /
School D 24 000 1936/01/10
School E 20 853 1963/01/01 43 12; 28%
School F 20 000 1986/01/01 31 24; 77%
School G 27 900 1991/01/ 69 59; 86%
School H 21 890 1994/ /
School I 20 850 1995/01/01 44 24; 55%
School J 20 000 1997/01/01
School K 23 760 1997/05/15
School L 29 000 1998/08/08 19 0%?
School M 25 000 1999/01/01
Table 42: Date of establishment against fees and endorsements (Fees R30 000 to R39 999)
Fees Date of establishment
Wrote Endorsements
School A 36 300 1848/ / 27 19; 70%
School B 35 000 1897/ / 50 48; 96%
School C 37 260 1898/08/17 52 44; 85%
School D 30 000 1921/10/04
School E 30 000 1935/02/04 54 0; 0%
School F 32 550 1958/01/01 6 1; 17%
School G 36 000 1966/01/01
School H 32 000 1979/09/08 76 70; 92%
School I 35 240 1990/01/01 77 77; 100%
School J 34 000 1996/01/01
School K 38950 1997/01/01
School L 37150 1997/01/01 111 99; 89%
School M 39615 1998/01/01 43 36; 84%
School N 35 600 1998/01/01 68 62; 91%
School O 36 497 2001/01/01 31 3; 10%
School P 30 030 2002/01/01 15 15; 100%

62
Table 43: Date of establishment against fees and endorsements (Annual fees above R40 000)
Fees Date of establishment
Wrote Endorsements
School A 49 410 1888/ / 86 86; 100%
School B 48 570 1902/01/22 74
School C 45 535 1907/01/01 71 70; 99%
School D 42 000 1916/01/30
School E 46 665 1919/01/01
School F 40 000 1923/01/01
School G 56 535 1934/10/10 47 46; 98%
School H 40 000 1941/01/01 91 85; 93%
School I 40 000 1942/05/17
School J 41 736 1966/01/01
School K 44 244 1967/01/01
School L 48 000 1985/01/01
School M 40 000 1996/01/15
School N 47 280 1999/01/01 81 79; 98%
SCHOOLS’ RAISONS D’ÊTRE AND DISTINCTIVENESSThis variable contains complex sociological issues that have formed the basis of theoretical arguments for decades. For the purposes of this report, it is suffi cient simply to say that independent schools represent the rights of individuals to choose the manner in which their children learn and, to some extent, what they learn. While most independent schools deliver the same curriculum used by state schools, they also refl ect certain norms, values and aspirations that some concerned parents felt were missing in the public school system. In order to discern the distinct character of the schools in the 2007 group, the reasons for the schools being established were examined.

63

64

65

37 General Van Ryneveld Street, Persequor Technopark, Pretoria
Telephone: 27 12 3491510 • Fax: 27 12 3491511 • [email protected]