underemployment in the australian labour market
TRANSCRIPT

Underemployment in the Australian Labour Market
Mark Chambers, Blair Chapman and Eleanor Rogerson[*]
Photo: Marko Novkov/EyeEm – Getty Images
Abstract
Underemployment in Australia has been moving higher for several decades. This article reviews the trends that have been driving this, including the long-run increase in part-time employment and changes in how the labour market adjusts to fluctuations in labour demand. The article also discusses the implications of the upwards trend in the underemployment rate for assessing spare capacity in the labour market. One implication is that the unemployment rate may need to decline by more than has previously been the case before wage pressures start building strongly.
Introduction Historically, the unemployment rate has been used as the key indicator for measuring spare capacity in the labour market. However there is growing evidence that the underemployment rate – the share of workers in the economy who want and are available to work additional hours – has increased in importance as a measure of spare capacity. Underemployed workers represent additional labour supply that can be called upon before there is upward pressure on wages. Underemployment also affects the welfare of Australians, if increasing underemployment indicates that an increasing
number of workers are not able to earn enough income to satisfy their needs.[1]
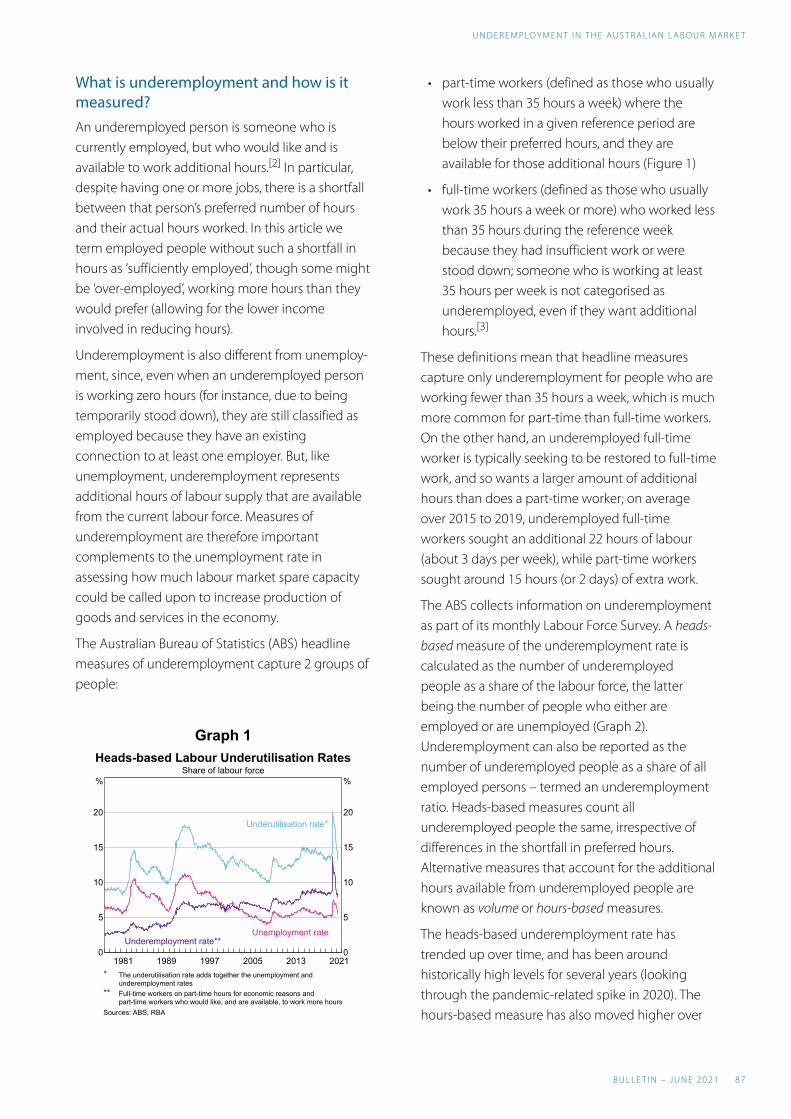
Underemployment in Australia has been increasing for several decades, driven by both structural and cyclical factors; in contrast, over the same period the unemployment rate has fluctuated but has broadly moved lower (Graph 1). In this article, we discuss the factors that have shaped the path of the underemployment rate in Australia over recent decades, how people transition in and out of underemployment, and what this means for assessing spare capacity in the Australian labour market.
8 6 R E S E R V E B A N K O F AU S T R A L I A
What is underemployment and how is it measured? An underemployed person is someone who is currently employed, but who would like and is available to work additional hours.[2] In particular, despite having one or more jobs, there is a shortfall between that person’s preferred number of hours and their actual hours worked. In this article we term employed people without such a shortfall in hours as ‘sufficiently employed’, though some might be ‘over-employed’, working more hours than they would prefer (allowing for the lower income involved in reducing hours).
Underemployment is also different from unemploy-ment, since, even when an underemployed person is working zero hours (for instance, due to being temporarily stood down), they are still classified as employed because they have an existing connection to at least one employer. But, like unemployment, underemployment represents additional hours of labour supply that are available from the current labour force. Measures of underemployment are therefore important complements to the unemployment rate in assessing how much labour market spare capacity could be called upon to increase production of goods and services in the economy.
The Australian Bureau of Statistics (ABS) headline measures of underemployment capture 2 groups of people:
Graph 1
20132005199719891981 20210
5
10
15
20
%
0
5
10
15
20
%
Heads-based Labour Underutilisation RatesShare of labour force
Unemployment rateUnderemployment rate**
Underutilisation rate*
* The underutilisation rate adds together the unemployment andunderemployment rates
** Full-time workers on part-time hours for economic reasons andpart-time workers who would like, and are available, to work more hours
Sources: ABS; RBA
• part-time workers (defined as those who usually work less than 35 hours a week) where the hours worked in a given reference period are below their preferred hours, and they are available for those additional hours (Figure 1)
• full-time workers (defined as those who usually work 35 hours a week or more) who worked less than 35 hours during the reference week because they had insufficient work or were stood down; someone who is working at least 35 hours per week is not categorised as underemployed, even if they want additional hours.[3]
These definitions mean that headline measures capture only underemployment for people who are working fewer than 35 hours a week, which is much more common for part-time than full-time workers. On the other hand, an underemployed full-time worker is typically seeking to be restored to full-time work, and so wants a larger amount of additional hours than does a part-time worker; on average over 2015 to 2019, underemployed full-time workers sought an additional 22 hours of labour (about 3 days per week), while part-time workers sought around 15 hours (or 2 days) of extra work.
The ABS collects information on underemployment as part of its monthly Labour Force Survey. A heads-based measure of the underemployment rate is calculated as the number of underemployed people as a share of the labour force, the latter being the number of people who either are employed or are unemployed (Graph 2). Underemployment can also be reported as the number of underemployed people as a share of all employed persons – termed an underemployment ratio. Heads-based measures count all underemployed people the same, irrespective of differences in the shortfall in preferred hours. Alternative measures that account for the additional hours available from underemployed people are known as volume or hours-based measures.
The heads-based underemployment rate has trended up over time, and has been around historically high levels for several years (looking through the pandemic-related spike in 2020). The hours-based measure has also moved higher over
U N D E R E M P LOY M E N T I N T H E AU S T R A L I A N L A B O U R MA R K E T
B U L L E T I N – J U N E 2 0 2 1 8 7

the past 10 years, although to a lesser extent. In April 2021 the heads-based underemployment rate was 7.8 per cent; that is, nearly 1.1 million people were underemployed, out of the total labour force of a little under 14 million people. Of these, around 1 million were part-time underemployed people, which was around one-quarter of all part-time workers. Full-time workers typically comprise only a small share of total underemployment; 2020 was an exception, as discussed in Box A.
Graph 2
20132005199719891981 20210
5
10
%
0
5
10
%Underemployment Measures*
Heads-based underemployment ratio**
Heads-based underemployment rate***
Hours-based underemployment rate****
* Full-time workers on part-time hours for economic reasons andpart-time workers who would like, and are available, to work more hours
** Share of employed persons*** Share of the labour force**** Share of potential hours (sum of hours sought by the unemployed,
additional hours sought by the underemployed, and hours usuallyworked by all employed persons; there are some inconsistencies inthe calculation over time due to data availability)
Sources: ABS; RBA
What has driven the increase in underemployment in Australia? Structural changes in Australia’s labour market over the past 40 years have been an important part of the increase in underemployment. In particular, for much of this period, the share of part-time employ-ment has been increasing. More recently, employers have increasingly tended to adjust their workforce by changing the hours of existing employees, rather than changing headcount. This has also contributed to the increase in underemployment.
Underemployment and the increase in part-time employment
Over the past 40 years the share of part-time employment has roughly doubled, from around 15 per cent of total employment in the late 1970s, to around one-third at present (Graph 3). This has been a key driver of the longer-run increase in the underemployment rate since, on average, the share of part-time workers who are underemployed has been much higher than for full-time workers. The long-run average underemployment ratio is around 25 per cent for part-time workers, but only around 1 per cent for full-time workers; as discussed above, this largely reflects differences in how
Figure 1: Underemployment – actual and preferred hours
U N D E R E M P LOY M E N T I N T H E AU S T R A L I A N L A B O U R MA R K E T
8 8 R E S E R V E B A N K O F AU S T R A L I A

underemployment is measured for part-time and full-time workers.
Decomposing movements in underemployment reveals that around half of the increase since the early 1980s has been due to the gradual upwards trend in the share of part-time employment. This is shown in Graph 4 as the ‘between effect’ – changes between the relative shares of full-time and part-time employment in Australia’s labour market.[4]
Importantly though, the remaining half of the cumulative change over the past 4 decades has been due to changes in the prevalence of underemployment within the groups of full-time and part-time employees; this more variable component of underemployment is discussed further below.
Underemployment is not evenly distributed across industries, which has implications for how the effects of underemployment are distributed across the community. Unsurprisingly, industries with higher levels of part-time employment have higher levels of underemployment (Graph 5). Underemployment is most prevalent in the ‘accommodation & food services’, ‘arts & recreation services’ and ‘retail trade’ industries, which all have relatively high part-time shares of employment (around 50 per cent in 2019).[5] Around half of all underemployment in 2019 was attributable to the ‘accommodation & food services’, ‘retail trade’ and ‘health care & social assistance’ industries.
Graph 3 Part-time and Full-time Underemployment*
Underemployment ratioShare of part-time and full-time employment
10
20
30
%
10
20
30
%
Part-time**
Full-time***
Part-time share of total employment
20132005199719891981 202110
20
30
%
10
20
30
%
* Trend estimates** Part-time workers who would like, and are available, to work more
hours*** Full-time workers on part-time hours for economic reasons
Sources: ABS; RBA
Increases in underemployment have been widespread across age and sex cohorts over the past 10 years, but with larger increases for younger workers (15–24 year olds) (Graph 6). Females are more likely to be underemployed than males. The presence of children under 14 years of age in a household is associated with a higher rate of underemployment for females but a lower rate for men. Younger workers are more likely to report being underemployed than older cohorts. As discussed in Dhillon and Cassidy (2018), there has been a notable increase in underemployment and involuntary part-time work for younger workers
Graph 4
20132005199719891981 2021-2
0
2
4
6
8
ppt
-2
0
2
4
6
8
ppt
Changes in the Underemployment Ratio*Cumulative change since February 1978
Total
Within effect**
Between effect***
* Trend estimates** Effect of changes in the share of underemployment within full-time
and part-time employment*** Effect of changes in the shares of full-time and part-time employment
in the labour market
Sources: ABS; RBA
Graph 5
Underemployment ratio (LHS)Part-time share (RHS)
Acc
om&
food
Art
s&
recr
eatio
nR
etai
lA
dmin
&su
ppor
tH
ealth
care
Oth
erse
rvic
esE
duca
tion
Info
&te
leco
sT
rans
port
Con
stru
ctio
nA
gric
ultu
reW
hole
sale
Pro
fess
iona
lR
enta
l &hi
ring
Man
ufac
turin
gP
ublic
adm
inU
tiliti
esF
inan
cial
Min
ing
0
10
20
30
%
0
20
40
60
%
Underemployment by Industry2019 average, share of industry employment
Sources: ABS; RBA
U N D E R E M P LOY M E N T I N T H E AU S T R A L I A N L A B O U R MA R K E T
B U L L E T I N – J U N E 2 0 2 1 8 9

since 2014. These authors suggest that a decline in the rate at which tertiary educated graduates transition from part-time to full-time employment over this period may have contributed to this increase.
Occupations with more underemployment are typically associated with high-underemployment industries. Over the past decade underemployment has increased most for people working in sales roles or as labourers (who are employed in several industries, including construction, hospitality and transport), and to a lesser extent in community & personal services jobs (Graph 7). These occupations also tend to be associated with lower skill levels.
Appendix A provides some additional descriptive statistics for underemployed people compared with other groups in the labour force.
Graph 6 Underemployment Rate by Sex*
Females
5
10
15
20
%
15 to 24
25 to 54
Males
5
10
15
20
%
55 and over
FemalesAged 25 to 54
1991 2001 2011 20210
4
8
12
%
No children under 14
MalesAged 25 to 54
1991 2001 2011 20210
4
8
12
%
Children under 14
* Trend estimates
Sources: ABS; RBA
Graph 7 Underemployment Ratio by Occupation
20081995 20210
5
10
15
20
%
Community &personal service
Managers
Professionals
Technicians & trades
20081995 20210
5
10
15
20
%
Clerical& admin
Machinery operators& drivers
Labourers
Sales
Sources: ABS; RBA
Underemployment, cyclical labour market conditions and hours adjustments
Although growth in the part-time share of employ-ment has been an important driver of underemployment, it does not explain all of the increase over time, nor does it explain any of its periodic fluctuations. An additional important driver has been movements in underemployment within part-time workers as a group, which in turn is shaped by broader labour market conditions (Graph 8).
Increases in the share of part-time workers who are underemployed have been particularly pronounced around periods of broader labour market slowdowns and weaker economic conditions. In these episodes, the share of part-time underemployment begins to increase when the labour market slows, generally reaching a peak around the same time as the unemployment rate. Part-time underemployment generally does not recover as quickly as unemployment when the labour market begins to improve, but does eventually come down.
The speed and extent of adjustments in the underemployment rate have changed as broader characteristics of the labour market have changed. In the slowdowns seen in 2008 and 2012–14, part-time underemployment increased by around 5 percentage points in each case (as employee hours were cut), while the unemployment rate only increased by 1½–2 percentage points (as the
Graph 8
20132005199719891981 202110
15
20
25
30
%
2
4
6
8
10
%
Underemployment andLabour Market Downturns*
(LHS)
(RHS)Unemployment rate
Part-time underemployment ratio**
* Shading indicates labour market downturns, from trough to peakin unemployment rate
** Share of part-time employment that is underemployed
Sources: ABS; RBA
U N D E R E M P LOY M E N T I N T H E AU S T R A L I A N L A B O U R MA R K E T
9 0 R E S E R V E B A N K O F AU S T R A L I A

number of employees was reduced). In comparison, the 1990s downturn saw a smaller increase in part-time underemployment relative to the change in unemployment.
This change in how underemployment adjusts to labour market cycles is likely in part because flexible work arrangements (including part-time employ-ment) have become more widespread as businesses have looked to improve how they can respond to changes in economic conditions. In particular, businesses have increasingly looked to adjust labour inputs through hours worked rather than total employee numbers; for further discussion of these trends see, for example, Bishop, Gustafsson and Plumb (2016) and Heath (2018). At the same time, more employees have also looked for working arrangements with greater flexibility than standard full-time employment would traditionally permit.
Reflecting the growing importance of hours adjustments as a mechanism for employers to manage labour inputs, the magnitude of flows in and out of underemployment are relatively large compared with other types of labour market flows.
Figure 2 shows the average size of flows per quarter in 2019. Most transitions in and out of underemployment were people leaving or joining the group of sufficiently employed workers (2019 is used as a reference period, given the significant disruptions to the labour market in 2020 caused by the COVID-19 pandemic).[6] On average during 2019, around three-quarters of people who became underemployed did so after having most recently been sufficiently employed. Around half of people who became sufficiently employed did so by exiting the pool of underemployed people, rather than being drawn in from the pool of non-employed people (whether previously unemployed or outside the labour force).
Labour market slowdowns tend to both increase the likelihood of becoming underemployed and reduce the likelihood of exiting underemployment. The probability of moving from sufficient employ-ment to underemployment increased relatively sharply in the 1990s recession and the Global Financial Crisis (GFC), only gradually moving lower in periods of labour market strengthening such as
Figure 2: Labour Market Status – Size and Flow Quarterly; 2019 average[7]
U N D E R E M P LOY M E N T I N T H E AU S T R A L I A N L A B O U R MA R K E T
B U L L E T I N – J U N E 2 0 2 1 9 1

the mid 2000s (Graph 9). More broadly, there has been a steady increase over time in the probability of transitioning from sufficient employment to underemployment, consistent with the gradual increase in overall underemployment. In the other direction, in recent years a little over 40 per cent of people who reported being underemployed were sufficiently employed 3 months later, and about half had sufficient work 6 months later.[8] These probabilities are lower than in the mid 2000s, when broader labour market conditions had been very strong.
Importantly, these movements in and out of underemployment generally involve changes in actual hours worked, rather than simply changes in preferred hours. Around one-third of people who become underemployed lose hours of work involuntarily without changing their preferred hours; a further one-third lose hours involuntarily while also increasing their preferred hours. The remaining one-third increase their preferred hours but do not lose any hours. These increases in preferred hours also add to the amount of underutilised hours available in the labour force.
In the other direction, around two-thirds of people who became sufficiently employed gained extra hours of work; the remaining one-third did not gain hours but reduced their preferred hours and so no longer had a recorded shortfall in hours worked. Across all groups of underemployed people who subsequently became sufficiently employed,
Graph 9 Underemployment and Sufficient Employment*
Point-to-point transition probabilities
Underemployment to sufficient employment
40
48
56
%
40
48
56
%
Within 3 months
Sufficient employment to underemployment
201420082002199619901984 20201
2
3
4
5
%
1
2
3
4
5
%
Within 6 months
* Sample has been adjusted for attrition; trend estimates; transitionprobabilities are calculated as flow from status A to status B dividedby stock of status A
Sources: ABS; RBA
between 2015 and 2019 the average increase in hours worked was about 8.5 hours, or a little over a day of work per week (Graph 10). This is broadly indicative of the average additional hours (and hence the average spare capacity) that could be supplied by an underemployed person.
That said, within the group of people transitioning from underemployment to sufficient employment, some people reduce their preferred hours as well as gaining hours. Around one-quarter of underemployed people who became sufficiently employed gained more hours of work and also reduced the number of hours they preferred, by around 3½ hours on average. This suggests the preferred hours they report while underemployed may not reflect their true availability (since, after gaining some extra hours, they downwardly adjust their preferred hours), and volume-based (hours) measures of underemployment may overstate available labour hours to some extent.
The gradual decrease in average additional hours worked when transitioning to sufficient employ-ment is partly because of the increase in the share of part-time workers (whose average hours are lower). As well, over time the average hours worked by part-time underemployed people have been increasing, meaning they have been ‘less underemployed’ prior to subsequently becoming sufficiently employed. These trends are consistent with the relative stability in the hours-based measure of underemployment since the 1990s, even as the heads-based measure of
Graph 10
20132007200119951989 20196
8
10
12
14
hours
6
8
10
12
14
hours
Change in Average Hours Worked*People transitioning from underemployment to sufficient employment
* Trend estimate; 3-month point-to-point change
Sources: ABS; RBA
U N D E R E M P LOY M E N T I N T H E AU S T R A L I A N L A B O U R MA R K E T
9 2 R E S E R V E B A N K O F AU S T R A L I A

Graph 11 Wages Growth and Labour Underutilisation
Unemployment
4 5 6 71
2
3
4
5
Unemployment rate** (%)
Year-endedWPIgrowth*(%)
2000–2010
Heads-based underemployment
5 6 7 8 9
Heads-based underemployment rate**(%)
2010–2014
Hours-based underemployment
2.0 2.5 3.0 3.51
2
3
4
5
Hours-based underemployment rate**(%)
2014–2019
* Private; excluding bonuses and commissions** Quarterly average
Sources: ABS; RBA
underemployment has moved higher; each underemployed person has on average represented a declining amount of underutilised hours.
Underemployment, labour market spare capacity and wages Given the willingness of underemployed workers to work additional hours, underemployment clearly represents an amount of potential labour supply that can be drawn on without an increase in measured employment.[9] Importantly, these are additional hours that people are prepared to work at prevailing wage levels; employers may not need to increase wages in order to source additional labour supply. Underemployed workers may also, in the first instance, be looking to increase hours or maintain flexibility in working hours rather than bargain over wages.
The importance of underemployment as a factor shaping wage outcomes has been receiving increased attention among policymakers and researchers (Lowe 2019). Internationally, Hong et al (2018) find that, across developed economies, involuntary part-time employment appears to have weakened wages growth and represents additional slack in the labour market. Similarly, Bell and Blanchflower (2021) find that some measures of underemployment have been a better predictor of wages growth than the unemployment rate since
the GFC in a number of countries, including the United Kingdom and the United States.
The move higher in underemployment in Australia over the past decade or so appears to have had some relationship with observed wages outcomes over this period; higher rates of underemployment have generally been associated with slower rates of wages growth (Graph 11). In contrast, there has been a less clear relationship between wages growth and changes in the unemployment rate, particularly in more recent years. Recent discussions of the Australian experience include Bishop and Cassidy (2017), Chua and Robinson (2018) and Treasury (2017).
Because of the additional spare capacity represented by an increase in underemployment, observed wages growth may be slower for a given level of the unemployment rate. The increase in the underemployment rate has therefore likely contributed to various researchers’ finding that the level of unemployment consistent with stable wages and inflation has declined over the past 15 years or so in Australia; see discussions in Cusbert (2017) and Ruberl et al (2021). Abstracting from other changes that have occurred in the economy, the upwards trend in the underemployment rate may mean that the unemployment rate would need to decline by more than has previously been the case before wage pressures start building
U N D E R E M P LOY M E N T I N T H E AU S T R A L I A N L A B O U R MA R K E T
B U L L E T I N – J U N E 2 0 2 1 9 3

strongly; certainly this was the pre-pandemic experience for a number of other advanced economies; see discussions in Arsov and Evans (2018) and Ruberl et al (2021).
Conclusion An elevated level of underemployment will generally imply that there is spare capacity that would need to be absorbed before the labour market is sufficiently tight to induce strong wages growth. Moreover, adjustments to underemployment may occur separately from any adjustment to unemployment, if increases in aggregate labour demand are met by additional
hours from existing employees. Assessments of spare capacity in the labour market therefore need to have regard to both unemployment and underemployment.
However, interpreting movements in underemployment is not straightforward, given structural changes in the labour market. Even with measures of underemployment returning to pre-pandemic levels, underemployment remains elevated compared with earlier decades. The Bank will continue to closely monitor developments in underemployment as an indicator of spare capacity in the Australian economy.
U N D E R E M P LOY M E N T I N T H E AU S T R A L I A N L A B O U R MA R K E T
9 4 R E S E R V E B A N K O F AU S T R A L I A

Box A: The COVID-19 Pandemic and Underemployment The onset of the COVID-19 pandemic in Australia in March 2020 had extremely large effects on the labour market. Activity restrictions and precautionary behaviour meant many businesses closed or operated at reduced capacity. By April 2020, a large number of people had lost employment or had their hours reduced; wage freezes and cuts were also used extensively by employers in the face of the sudden decline in activity. Government policy measures, including the introduction of the JobKeeper wage subsidy, meant many people who otherwise might have lost their jobs were able to remain attached to their employer.[10]
Many of these people, however, worked zero or reduced hours; reductions in work hours were also experienced by many workers at firms that did not receive the JobKeeper wage subsidy. By April 2020 the headline number of underemployed people had increased by 700,000 compared with the end of 2019; using broader measures of underemployment, more than 1 million additional people were working reduced hours (Graph A1).
Graph A1
Part-time*Full-time**Part-time on reduced hours for economic reasonsFull-time would like more hours
M M MJ JS SD D20202019 2021
0
1
2
3
m
0
1
2
3
mUnderemployment
* Part-time workers who would like, and are available to, work morehours; includes part-time on reduced hours who also want more hoursthan usual
** Full-time workers on part-time hours for economic reasons
Sources: ABS; RBA
Unlike the pattern of large labour market downturns seen over recent decades – where part-time workers experienced a larger increase in underemployment than full-time workers – an unusually large part of the increase in underemployment in 2020 was because of an increase in the number of full-time workers on reduced hours for economic reasons. In April 2020, around 420,000 full-time workers had their hours cut to zero, and an additional 520,000 worked part-time-hours because they were stood down or had insufficient work (Graph A2). Around 870,000 part-time workers also worked fewer hours than usual. The headline underemployment rate increased sharply, from 8.6 per cent in February to 13.6 per cent in April, the highest rate in the history of this series.
U N D E R E M P LOY M E N T I N T H E AU S T R A L I A N L A B O U R MA R K E T
B U L L E T I N – J U N E 2 0 2 1 9 5

Graph A2 Less Than Usual Hours Worked
Economic reasons
Zero hours
100
200
300
400
500’000
100
200
300
400
500’000
Part-time
Some hours
M M MJ J JS SD D20202019 2021
0
200
400
600
’000
0
200
400
600
’000
Full-time*
* Working part-time hours
Sources: ABS; RBA
As activity restrictions eased and workplaces reopened, the number of people working reduced hours gradually unwound, and nationally the underemployment rate returned to its pre-pandemic level by December 2020.
The speed of this recovery is highly unusual relative to previous labour market downturns (Graph A3). As discussed elsewhere in this article, over recent decades the underemployment rate has been moving higher, with much of this upwards movement occurring during periods of labour market downturns. In this most recent episode, however, it appears that the unique nature of the labour market downturn – being primarily driven by supply-side restrictions and responses, rather than led by weaker demand – has not resulted in similar lasting effects on the degree of underemployment in the economy.
Graph A3
0 6 12 18 24 30 36-2
0
2
4
ppt
-2
0
2
4
ppt
Months since underemployment rate trough
Change in Underemployment RateTrough in underemployment rate = 0
1980s
1990s
GFC
COVID-19
Sources: ABS; RBA
U N D E R E M P LOY M E N T I N T H E AU S T R A L I A N L A B O U R MA R K E T
9 6 R E S E R V E B A N K O F AU S T R A L I A

Appendix A
Table A1: Descriptive Statistics by Labour Force Status 2015–2019 pooled sample average
Underemployed Sufficiently
Employed Unemployed Not in the Labour
Force
Share of working age population 6% 56% 4% 35%
Female 58% 46% 47% 59%
Mean age 35 years 37 years 34 years 56 years
Married 43% 57% 34% 52%
Children under 14 in household 34% 36% 35% 22%
Lives in a capital city 65% 70% 67% 64%
Born in Australia 71% 60% 69% 64%
Educational attainment
Bachelor degree or higher 23% 24% 19% 15%
Year 12 or lower 48% 37% 56% 64%
Part-time status(a) 93% 31% - -
Casually employed(b) 20% 8% - -
Owner manager 15% 12% - -
Hours worked 16 hours 35 hours - -
Preferred hours 32 hours 47 hours - -
Job tenure(c) 3.5 years 4.7 years - -
Multiple job holder 7% 5% - -
Expects to leave job(d) 18% 11% - -
Industry
Retail trade 19% 10% - -
Accommodation & food services 16% 7% - -
Healthcare & social assistance 14% 13% - -
Occupation
Community & personal service workers
21% 11%
Sales workers 19% 9% - -
Labourers 19% 10% - - (a) Underemployment is overweight in part-time workers by definition
(b) Has no leave entitlements
(c) Available data of years of job tenure is bottom-coded at 1 year and top-coded at 20 years
(d) Expects not to be working for current employer in 12 months’ time
Sources: ABS; RBA
U N D E R E M P LOY M E N T I N T H E AU S T R A L I A N L A B O U R MA R K E T
B U L L E T I N – J U N E 2 0 2 1 9 7

Footnotes Mark Chambers is from Economic Analysis Department, Blair Chapman completed this work while in Economic Research Department and Eleanor Rogerson completed this work while in Economic Analysis Department. The authors would like to thank James Bishop, Natasha Cassidy, Ewan Rankin and Brendan Russell for thoughtful advice and suggestions in preparing this article.
[*]
Wilkins (2007) suggests that the impact on subjective wellbeing for those who are part-time underemployed is not too distant from being unemployed.
[1]
The term ‘underemployment’ is also sometimes used to describe a broader concept of labour underutilisation, including people with experience and qualifications that exceed those required for their current role (in addition to people who are available for extra hours of work). In this article we only consider time-related underemployment.
[2]
The headline part-time underemployment series has undergone slight definitional changes, particularly in 2001 and 2003, which means that it is not directly comparable before and after these points.
[3]
Yuen and Smith (2019), in a study for the Fair Work Commission, used shift-share analysis to consider a range of age, sex, industry and occupation characteristics, as well as changing shares of full-time and part-time employment. These authors found that compositional changes in the labour market across these other dimensions generally had made only small contributions to the aggregate underemployment rate. Instead, the largest compositional driver was the increased share of part-time employment.
[4]
Comparing industry underemployment is more straightforward using underemployment ratios than rates; ratios represent the share of employed people in the industry who are underemployed and exclude non-
[5]
employed people for whom it can be hard to assign to an industry.
This analysis draws on ABS’ Longitudinal Labour Force Survey (LLFS) unit record data that has recently become available, which enables us to calculate the probability an individual transitions from one labour market status to another at a monthly frequency. Transition probabilities over longer periods can be calculated using other data sources, such as the Household Income and Labour Dynamics in Australia survey (HILDA).
[6]
Point-to-point transitions over the quarter. [7]
These transition probabilities are based on the period in which survey respondents are included in the ABS’ LFS sample. From the point of first being included in a monthly sample, a survey respondent typically participates in the survey for 8 months. Given this, the ABS’ LLFS does not have information on the duration for which a respondent has been in their current employment status at the point they entered the survey, or changes subsequent to them exiting the survey.
[8]
The measured underemployment rate may also overstate the true extent of spare capacity represented by underemployment since, as with unemployment, some amount of structural and frictional underemployment is likely to be always present in a dynamic labour market. For a simple discussion of different types of unemployment, see Reserve Bank of Australia (2021).
[9]
Bishop and Day (2020) estimate the JobKeeper wage subsidy program and JobKeeper-enabled stand-downs kept at least 700,000 people attached to their employers, who might have otherwise lost their jobs.
[10]
U N D E R E M P LOY M E N T I N T H E AU S T R A L I A N L A B O U R MA R K E T
9 8 R E S E R V E B A N K O F AU S T R A L I A

References Arsov I and R Evans (2018), ‘Wage Growth in Advanced Economies’, RBA Bulletin, March. Viewed 9 June 2021. Available at <https://www.rba.gov.au/publications/bulletin/2018/mar/wage-growth-in-advanced-economies.html>.
Bell DNF and DG Blanchflower (2021), ‘Underemployment in the United States and Europe’, ILR Review, 74(1), pp 56–94.
Bishop J and I Day (2020), ‘How Many Jobs Did JobKeeper Keep?’, RBA Research Discussion Paper No 2020-07.
Bishop J and N Cassidy (2017), ‘Insights into Low Wage Growth in Australia’, RBA Bulletin, March, pp 13–20.
Bishop J, L Gustafsson and M Plumb (2016), ‘Jobs or Hours? Cyclical Labour Market Adjustment in Australia’, RBA Research Discussion Paper No 2016-06.
Chua CL and T Robinson (2018), ‘Why Has Australian Wages Growth Been So Low? A Phillips Curve Perspective’, Economic Record, 94(S1), pp 11–32.
Cusbert T (2017), ‘Estimating the NAIRU and the Unemployment Gap’, RBA Bulletin, June, pp 13–22.
Dhillon Z and N Cassidy (2018), ‘Labour Market Outcomes for Younger People’, RBA Bulletin, June. Viewed 9 June 2021. Available at <https://www.rba.gov.au/publications/bulletin/2018/jun/labour-market-outcomes-for-younger-people.html>.
Heath A (2018), ‘The Evolving Australian Labour Market’, Business Educators Australasia 2018 Biennial Conference, Canberra, 5 October.
Hong GH, Z Koczan, W Lian and MS Nabar (2018), ‘More Slack than Meets the Eye? Recent Wage Dynamics in Advanced Economies’, IMF Working Paper 18/50.
Lowe P (2019), ‘The Labour Market and Spare Capacity’, Address to a Committee for Economic Development of Australia (CEDA) Event, Adelaide, 20 June.
Reserve Bank of Australia (2021), ‘Unemployment: Its Measurement and Types’, RBA Explainer, March. Viewed 9 June 2021. Available at <https://www.rba.gov.au/education/resources/explainers/unemployment-its-measurement-and-types.html>.
Ruberl H, M Ball, L Lucas and T Williamson (2021), ‘Estimating the NAIRU in Australia’, Treasury Working Paper 2021-01.
Treasury (2017), ‘Analysis of wage growth’, Treasury Working Paper.
Wilkins R (2007), ‘The Consequences of Underemployment for the Underemployed’, Journal of Industrial Relations, 49(2), pp 247–275.
Yuen K and O Smith (2019), ‘Insights into underemployment’, Fair Work Commission Research Report 2/2019 , February. Viewed 9 June 2021. Available at <https://www.fwc.gov.au/documents/wage-reviews/2018-19/research/underemployment.pdf>.
U N D E R E M P LOY M E N T I N T H E AU S T R A L I A N L A B O U R MA R K E T
B U L L E T I N – J U N E 2 0 2 1 9 9