undergraduate financial aid and … truncation is used to first estimate the likelihood of making a...
TRANSCRIPT
Discussion Paper No. 57 Williams Project on the Economics of Higher Education Denison Gatehouse Williams College Williamstown, MA 01267 http://www.williams.edu/wpehe
© 2000 (Kelly Dugan, Charles Mullin, and John Siegfried) This paper is intended for private circulation and should not be quoted or referred to without the permission of the authors.
UNDERGRADUATE FINANCIAL AID AND
SUBSEQUENT GIVING BEHAVIOR
Kelly Dugan, Charles H. Mullin and John J. Siegfried Vanderbilt University
November, 2000
DP-57
Undergraduate Financial Aid and Subsequent Alumni Giving Behavior
By
Kelly Dugan, Charles H. Mullin and John J. Siegfried*
Vanderbilt University
October 2000
Abstract
Data on 2,822 Vanderbilt University graduates are used to investigate alumnigiving behavior during the eight years after graduation. A two stage model accounting forincidental truncation is used to first estimate the likelihood of making a contribution andsecond estimate the average gift size conditional on contributing. The type of financial aidreceived as an undergraduate appears to have a greater influence on subsequent alumnigenerosity than the amount received. Adding some scholarship to a loan-only package oreliminating all loans from a mixed loan-grant package increases the likelihood of asubsequent contribution. Increasing the total size of the package or altering theproportions of an already mixed package appears to be inconsequential for futuredonations. Students who receive small merit scholarships contribute more as alumni thanstudents who receive either no merit scholarship or a large merit scholarship.
* Department of Economics, Vanderbilt University, Nashville, TN 37235. Email comments to:[email protected] or [email protected]. Dugan is a 1999 graduate of the Collegeof Arts & Sciences. We thank both Greg Perfetto of the Provost's Office of Special Projects and Melanie Fordof the Office of Alumni and Development at Vanderbilt University for enormous help in assembling the dataset used in this project.

1. Introduction
Alumni provided over $5.5 billion of voluntary support to colleges and universities in 1997-98
(Chronicle of Higher Education, 1999). Although this is less than five percent of higher
education revenues, it represents critical revenues for certain institutions (Leslie and Ramey,
1998; Bande and Sundberg, 1993; Mulugetta, Nash and Murphy, 1999). In particular, America's
research universities averaged more than $50 million each in alumni contributions in 1997-98. In
addition, alumni support is frequently less encumbered with restrictions than alternative
revenues, and thus can be allocated to the highest valued incremental use.
In a seemingly unrelated event, the structure of financial aid recently underwent a
dramatic change. Colleges and universities have begun to rely on financial aid policies as a
strategy to maximize institutional revenues and to manage enrollment (McPherson and Schapiro,
1998). Merit aid has grown in importance relative to need-based aid, and the packaging of
financial aid among grants, loans, employment opportunities, and self-help often is used to
influence enrollment behavior as well as to provide access to post-secondary education.
Additionally, the share of higher education costs shouldered by state governments has fallen in
recent years (McPherson and Schapiro, tables 3.1 and 3.2). In response, federally and
institutionally provided aid has risen, but virtually all of the rise has been in the form of loans
rather than grants. Because most federal loan programs are administered through colleges and
universities, loan repayment checks are written to an individual's alma mater.
In this paper, we attempt to link undergraduate financial aid decisions to alumni giving. In
particular, we explore whether undergraduate college loan obligations affect alumni
contributions. Do young alumni donate less to their alma mater if they have already "just sent
them a check?" Alternatively, do young graduates view financial aid, including loans, as an
enabling opportunity, without which they might not have been able to earn a degree at all? In
short, do post-graduation loan obligations affect either the likelihood of giving by young alumni
to their alma mater or the expected amount of their gift if they do contribute?
To explore these questions we estimate a two-stage decision process with incidental
truncation. First, graduates decide whether or not to contribute. Second, conditional on
contributing, they decide how much to give. In the first stage, we employ a probit model in which
the dependent variable distinguishes alumni who donated to their alma mater at least once during

2
the eight years immediately following their graduation from those who did not. Included among
the explanatory variables are measures of both the existence and amount of various types of
undergraduate financial aid. In the second stage, we regress the average annual gift size on the
same undergraduate financial aid variables, correcting for the censored error distribution caused
by the presence of non-givers in the sample.
Clotfelter (2000) also addresses directly the effects of financial aid on subsequent alumni
donations. He finds no relationship between a binary variable representing the receipt of some
need-based financial aid and alumni contributions for a cohort of 1951 freshmen at a sample of
colleges and universities, but found a significant negative effect for the 1976 cohort at those
same institutions. However, Clotfelter's study is limited by an absence of detail about the amount
and composition of the need-based financial aid. The data used in this study, although with
shortcomings of their own, are suited to address these latter problems.1
Our data consist of 2,822 full-time students who entered Vanderbilt University as
freshmen in 1984, 1985, and 1986, and received their bachelors degrees from Vanderbilt between
May 1988 and May 1990. Thus we include only college graduates who matriculated as freshmen;
dropouts and transfer students are excluded. We have admissions, financial aid, student records,
and contribution data for each of these individuals. During their first eight years after receiving
their degree 1,538, or 54.5 percent of the graduates, donated to Vanderbilt at least once. Since
Vanderbilt has very few students of non-traditional age, these donations effectively represent the
cumulative giving history of individuals who are approximately 30 years old.
Our data have two major faults. First, they are from a single university, limiting the extent
to which one can generalize our results. Second, there is no direct measure of either students' or
their families' income or wealth. The potential effect of this latter point on the robustness of
parameter estimates is discussed in detail later.
We hypothesize that graduates' willingness to donate to their alma mater depends
primarily on satisfaction with their undergraduate experience, an important component of which
1 Stutler and Calvario (1996) identify “satisfaction with financial aid services” as one of the nine categories ofgraduates’ undergraduate experience that distinguish alumni donors from non-donors.

3
is their financial aid history.2 If this hypothesis is true, the detailed information about both the
amount and composition of financial aid awarded to these students, as well as other specific
information such as SAT scores, grade point averages, and social affiliations is immensely
valuable.
Finally, college and university alumni seldom make large donations during their first
eight years after graduation. Indeed, the largest average annual gift for those who donated to
Vanderbilt during the first eight years after they graduated is only $4,100; the average annual gift
is but $32. However, alumni fund-raisers seem to believe that contribution patterns are developed
early in life and there is some evidence that past giving is related to current giving (Lindahl and
Winship, 1992; OKunade and Justice, 1991). The relatively few individuals who make large
donations to their alma mater after they reach the pinnacle of their careers are most likely to have
established a pattern of giving earlier in life. Therefore, to the extent that loan repayments
discourage individuals from making regular contributions in the years immediately following
graduation, need-based loans may reduce the pool from which larger donations might develop
subsequently. Thus, the net present value of any effect of loan obligations on either the
propensity to contribute or the amount of contributions made by individuals during the eight
years immediately following graduation may be much larger than is evident from our empirical
estimates.
2. Model and Estimation Technique
The two outcomes in which we are interested are the decision to donate and the amount donated.
First, the individual decides whether or not a gift is going to be made. We model the decision to
give with the following index function:
d X= +β µ
where a donation is given whenever d is greater than zero. We assume that the error term is
normally distributed and estimate the implied probit model.
Second, the magnitude of the donation is modeled as a linear function of observables, i.e.
y Z* = +γ ε
2 Alternative models of the motivation for giving include pure altruism, avoidance of social stigma, tax incentives,recognition for generosity, a response to past or deterrence to future solicitation, and quid pro quo for servicesrendered indirectly such as access to elite social circles or business contacts.

4
where Z may contain, but is not restricted to, the variables in X. Furthermore, there are no cross
equation restrictions between β and γ , even for coefficients on the same explanatory variable.
For example, the effect of receipt of financial aid on the likelihood of giving is allowed to differ
from its effect on the expected magnitude of the gift. Finally, we do not observe y* for all
respondents. Instead we observe
y y
y
d
d
==
>≤
*
0
0
0
if
if
i.e. we observe the gift size for the sub-population of individuals who desire to make a positive
donation, but observe a gift size of zero for all others. In general, the selection imposed by the
first stage is correlated with the error term in the second stage, resulting in an omitted variables
problem if OLS estimates are computed ignoring the selection. In particular, if ε has a normal
distribution, then
E y d Z E d Z X* > = + > = +0 0� � � � � �γ ε γ ρσ λ βε
where ρ is the correlation between ε and µ , σ ε is the standard deviation of ε , and λ βX� � is
the inverse Mills ratio. Therefore, we compute the inverse Mills ratio based on the estimates in
the first stage and include this estimate of the inverse Mills ratio as an additional regressor in the
second stage. This procedure was introduced in Heckman (1979) and has been shown to produce
consistent estimates. Finally, standard errors are corrected both for the heteroscedasticity induced
by selection and the fact that the inverse Mills ratio is an estimated regressor.
3. Data
The data consist of 2,822 full-time students who entered Vanderbilt University as freshmen
between August 1984 and August 1986 and graduated between May 1988 and May 1990.3 No
transfer students (either into or out of Vanderbilt) are in the sample. Contributions from each
graduate in our sample pertain to the first eight years after graduation. The eight years of post-
graduate experience for which we do have information allow sufficient time for individuals to
complete most post-graduate professional programs, even allowing for a few years of pre-
professional program work experience. These data are used to examine both the probability of
making a donation and the expected magnitude of donations.
3 Data are unavailable for earlier cohorts.

5
Vanderbilt's alumni and development office provided the date, amount, form (cash, stock,
or in-kind), and destination unit of every gift made by individuals in our sample during the first
eight years after graduation. Gifts matched by corporate employers are also identified.
Contributions designated for undergraduate academic units, athletics, reunion events, libraries,
and undesignated contributions are accumulated to form our dependent variable in the regression
analysis, which we identify as gifts to the undergraduate college. Gifts designated for schools
without undergraduate programs or for the university hospital are not included. A binary variable
indicating if a gift was made to the undergraduate college is the dependent variable in the
likelihood of giving probit model. The average annual contribution amount over the eight year
period is the dependent variable in the second equation.
The explanatory variables are separated into five categories: financial aid, socio-
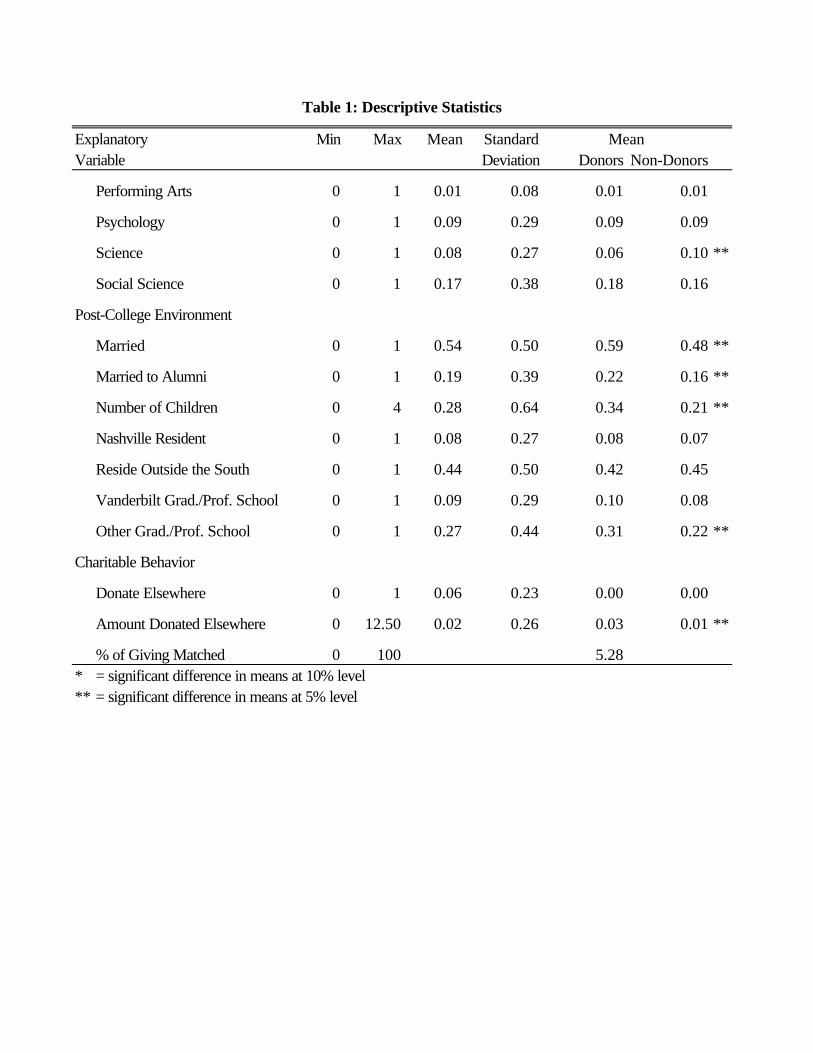
demographic, college experience, post-college experience, and charitable behavior. Descriptive
statistics and results of a two-tailed test for a difference in the means between donors and non-
donors for each of these variables are reported in table 1. Our expectations regarding the
relationship of each variable to both the probability of contributing and the expected size of the
contribution are described below. However, for each dependent variable these expectations are
the same, e.g., if we expect a variable to increase the likelihood of giving, then we expect it to
increase the average gift size as well. Therefore, no distinction between the two outcomes is
made in the following discussion and they are often referred to as charitable behavior. The
predicted signs of these relationships are reported in table 2, along with the empirical estimates.
Before describing any particular variable in detail, a few general points will expedite the
presentation. First, most of the variables are binary variables; only exceptions will be noted
explicitly. Second, two key variables, earnings and wealth, are not available. Hence, the
empirical analysis does not control directly for these factors, potentially biasing the estimated
coefficients in the analysis.4 Most importantly, the need-based financial aid variables are
necessarily correlated with family wealth. Due to this fact, we emphasize the probability of
giving equation, as opposed to the expected magnitude of a gift equation, since we believe
earnings and wealth have a smaller impact on the propensity to give than the quantity given.
Third, all dollar valued variables are measured in thousands of constant 1997 dollars.
4 Student major and grade point average may control for income indirectly.

6
3.1 Financial Aid Variables
Every form of financial aid considered below eases the budget constraint of the student and her
family. Additionally, the award may bestow psychological benefits on the recipient. To the
degree that either of these attributes is appreciated by recipients, we expect it to induce more
generous charitable behavior. Thus, we expect non-need-based aid to increase both the likelihood
of giving and the average gift size. However, since our data prevent us from controlling for
earnings and wealth and need-based aid is negatively correlated with these omitted variables, we
are unable to make unambiguous predictions about the direction of the effect of need-based aid
on alumni contributions.
Need-based loans. Need-based loans include both institutionally funded loans and federal
loans (Stafford and Perkins) that are administered through the university. Repayment usually
commences six to nine months after graduation and extends over a ten year period. Thus,
repayments for the typical graduate are due throughout our sample period.
Need-based scholarships. Need-based scholarships are institutionally funded need-based
grants that do not require repayment. Pell Grants are not included because they are recognized as
entitlements that are independent of the college or university the student chooses to attend, so do
not affect the student's attitude about Vanderbilt. These are likely to be highly negatively
correlated with the income and wealth of graduates' families.
Total need-based financial aid. Total need-based financial aid is a continuous variable
that measures the sum of Pell Grants, need-based scholarships and need-based loans received by
a student. It excludes College Work Study Program (CWSP) awards. Although most student aid
packages at Vanderbilt include a CWSP award, the data do not permit us to determine if a
student chose to take it up.5
Percentage of aid received as loans. Holding constant the total amount of need-based
financial aid, an increase in the proportion that consists of loans indicates a less generous
financial aid package from the university and a greater loan repayment burden. Consequently, we
expect it to be associated with less charitable giving to the university.
5 Only about 75 percent of CWSP dollars offered are actually claimed. However, the CWSP offer is approximatelythe same fraction of most student financial aid packages, so its omission is unlikely to bias the estimated coefficients.

7
Merit scholarships. Merit scholarships are non-need-based grants to students awarded for
academic or extracurricular achievements in high school. We expect more contributions from
former merit scholarship holders for two reasons. First, the honor of receiving a merit scholarship
enhanced their undergraduate experience. Second, former merit scholarship holders are more
likely to be high achievers and consequently high earners.
Amount of merit scholarship. The amount of merit scholarship is a continuous variable
representing the dollar value of merit scholarship received by a student. Larger merit scholarships
bring increased recognition to a student and also more relief on other financial responsibilities.
This should increase charitable giving.
Athletic scholarships. Athletic scholarships are need-blind grants. They are allocated
through a recruitment process that increases self-esteem. For this reason and others similar to
those identified for merit scholarships we expect positive coefficients for this variable.
3.2 Socio-Demographic Variables
White. 95 percent of Vanderbilt graduates in the sample are white. Therefore, we make
no attempt to differentiate between minority groups due to a lack of sample size.
Female. Eckel and Grossman (1998) found that women are more inclined to make
charitable contributions in larger amounts. However, on average, men earn more than women,
providing access to more resources to support donations. Consistent with greater ability to pay,
Okunade (1996) found that male graduates of the University of Memphis contributed more than
female graduates. Clotfelter (2000) finds no significant difference in contributions between men
and women who were enrolled in 14 selective private colleges and universities in 1976. Our
inability to control for earnings makes the direction of the effect of this variable an empirical
question.
Private high school. Students who attended private high schools are likely to come from
families with greater financial resources, which may affect the size of donations to their alma
mater after graduation. On the other hand, competition from private high school solicitations may
lure contributions away from Vanderbilt. Thus the expected effect of this variable is ambiguous.
3.3 College Experience Variables
A student's college experience is a function of both her social interactions and her academic
success. The more favorable an experience a student has, the more likely she is to reward the

8
university with charitable gifts. The variables identified below are intended as proxies for these
two attributes of a student's undergraduate experience.
Greek affiliation. Harrison, Mitchell, and Peterson (1995) found higher alumni giving at
institutions with a higher percentage of students who pledged fraternities and sororities. The
usual interpretation of such results is that students who participate in the extensive social and
community activities arranged by Greek organizations feel a stronger sense of attachment to the
university. Furthermore, membership in a fraternity or sorority requires substantial dues, which
tends to bias Greek membership toward students from relatively wealthier families, possibly
increasing subsequent contributions. On the other hand, OKunade and Justice (1991) found that
alumni who were members of social Greek organizations donated significantly less tot he
university of Memphis for academic purposes. They hypothesized that this finding reflected the
competition between Greek organizations and academic units for the support of their common
alumni. Membership in fraternities and sororities is identified by separate variables.
Athletes. This variable includes only varsity athletes. As with Greek affiliation,
participation on a varsity athletic team generates a stronger sense of attachment to the university
through group membership. In addition, former athletes receive solicitations from a special club
of former athletes in addition to the usual appeal for alumni contributions. Thus, we expect
former athletes to contribute more than other graduates.
Cumulative grade point average (GPA). Higher GPAs may lead both to more satisfied
students and to higher earnings (Jones and Jackson, 1990), both of which should increase
charitable behavior.
Grade point differential. This variable measures each graduate's cumulative grade point
average at Vanderbilt less his or her (standardized) grade point average in core subjects taken in
high school. We expect higher values of the GPA differential to reflect greater satisfaction with a
graduate's academic performance at college and, consequently, to increase charitable giving.
Number of semesters to earn degree. Seven percent of the sample took longer than eight
semesters to graduate.6 We hypothesize that students who did not graduate "with their class" are
likely to have had a less satisfying undergraduate experience and have had to pay for additional
6 The sampling frame causes this estimate to understate the percentage of students exceeding eight semesters tograduation. For example, no freshmen from 1986 who took more than eight semesters are included in the samplingframe.

9
semesters in attaining their degree. We believe both of these factors induce them to contribute
less.
Leave of absence. This variable indicates a student took a formal leave of absence during
the undergraduate years. Students take leaves of absence for various reasons, including illness,
poor grades, honor code violations, and financial problems. The majority of the potential reasons
are likely to reduce a graduate's satisfaction with his or her undergraduate experience. Thus we
expect negative coefficients on this variable.
Undergraduate major. A series of binary variables are included to distinguish nine groups
of majors. They are listed in tables 1 and 2. Humanities is the omitted category.7 Students
majoring in two areas are included in both; thus these variables sum to more than one. We expect
differences across majors since disciplines attract different types of students and provide distinct
earnings potentials. For example, a stereotype of an education major is a relatively more patient
and generous person, who therefore might be more likely to donate, although in modest amounts
because of low expected net earnings. The academic area variables may also capture the extent to
which there is a systematic difference in student satisfaction across departments or divisions of
the university. For example, the positive (albeit insignificant) coefficient associating economics
majors with a greater likelihood of giving might be interpreted in a self-serving way by these
authors as reflecting the superior undergraduate experience received by economics students at
Vanderbilt! Alternatively, it might reflect higher earnings of economics graduates (OKunade and
Justice, 1991). Finally, academic majors reflect likely differences in earnings in the years
immediately after graduation. For example, engineers enjoy the highest average earnings in the
first decade after graduation (Hecker, 1993) and thus have greater capacity to contribute.
However, we take no stand on the expected sign of any major.
3.4 Post-College Environment Variables
Marital status, graduate school and children all affect the budget constraint of graduates.
Therefore, we expect them to affect graduates' charitable giving. However, unless otherwise
stated, we have no strong prior convictions of the direction of the impact of any of the variables
below. Furthermore, if earnings and wealth were available, their inclusion would undoubtedly
change the estimated effect of these variables.
7 Human and organizational development is a quasi-business major focused away from finance and accounting.

10
Marital status. Marital status is based on the graduate's most current status available in the
sampling period; the expected sign of the coefficient is ambiguous. On the one hand, single alumni
may maintain stronger allegiance to their alma mater than married alumni because married alumni
have moved on to another stage of their lives. Thus single alumni would be more inclined to give.
On the other hand, married alumni may be more inclined to make contributions to their alma mater
in order to appear generous to their spouses. If both husband and wife work and there are some
scale economies of living together, a married couple also would have more disposable income
available from which to contribute.
Married to alumni. We are able to determine if graduates are married to other Vanderbilt
alumni. We expect these graduates to have more affection for their undergraduate experience at
Vanderbilt (assuming a happy marriage). Furthermore, the average return to giving may be greater
for these graduates because each receives the additional indirect benefit of improving their spouse's
university. For these reasons, we expect greater charitable giving from this group.
Number of children. A simple count records the number of children an alumnus has
where the default is zero when the alumni office has no information. Alumni with higher income
tend to have more children. Furthermore, parents are relatively more interested in the quality of
education at all levels than are non-parents. However, children add financial responsibilities and
constrain income available for charitable contributions. The expected sign is therefore
ambiguous.
Nashville resident. Nashville residents are more likely to enjoy external benefits from a
successful local university. Furthermore, the residential decision of alumni who remain in
Nashville indicates that they did not experience the need to "get out of this place" that afflicts
many undergraduate students as they approach graduation. These factors lead us to expect
Nashville residents who graduated from Vanderbilt to be more charitable towards the university.
Reside outside the south. Outside the south is defined as all states except Alabama,
Arkansas, Georgia, Kentucky, Louisiana, Mississippi, North Carolina, South Carolina,
Tennessee, Texas, Virginia, and West Virginia. The converse of the reasoning for Nashville
residents leads us to expect these individuals to be less generous to the university as alumni.
Graduate school. Thirty six percent of the sample are known to have earned a graduate or
professional degree. A quarter of those degrees are from Vanderbilt and are identified separately

11
in the analysis. These individuals are likely to have higher expected earnings, but their graduate
institution is an additional competitor for contributions. Thus, the expected signs on these
variables are ambiguous.
3.5 Charitable Behavior
Contributions to other units of Vanderbilt University. Both the frequency and the
magnitude of donations to other units of Vanderbilt can be interpreted as a general reflection of
individuals' generosity. As such, we would expect a positive impact for both the binary and
continuous variables relating giving to other units of the university to charitable behavior of
alumni towards the undergraduate school. However, graduate and professional schools and the
university hospital also can be viewed as competitors for donations, in which case one would
expect negative effects.
Corporate matching programs. A corporate matching program reduces the effective price
of a contribution and should lead to an increase in charitable behavior. Unfortunately, we have
information about employers' matching policies only for graduates who made contributions.
Consequently the corporate matching variable is included only in the average gift size equation
(this is the only difference in explanatory variables between the two estimated equations).
Furthermore, we know only whether donations were matched by a graduate's employer, not the
rate at which they are matched. Therefore, we define this variable as the dollar value of the
graduates' donations that are matched divided by the dollar value of all the graduate's donations.
We expect a substantial positive elasticity with respect to the match rate, but even if this
expectation is correct we cannot guarantee a positive coefficient on this variable. The dependent
variable in the analysis is the amount of dollars spent on contributions to Vanderbilt, not the
quantity of dollars received by Vanderbilt. All that economic theory predicts is that when the
price of a good falls (the cost of sending a dollar to Vanderbilt), the quantity purchased will rise.
It does not require individuals to increase the amount they spend on that good. For example,
suppose a typical contributing graduate who would give $32 with no corporate match receives a
100 percent corporate match. Economic theory predicts that the graduate will give in excess of
$16, ensuring that Vanderbilt receives in excess of $32. Furthermore, if this graduate's elasticity
was 0.5, then we would observe a gift of $24 resulting in a net receipt of $48 for Vanderbilt.
However, this scenario would produce a coefficient of negative $8 on the match variable in the

12
equation determining average gift size. In order to have a positive coefficient on this variable, it
is necessary and sufficient for the elasticity to be in excess of one.
4. Empirical Results
Table 2 contains the estimates of each explanatory variable's effect on the likelihood of making at
least one contribution during the eight years after graduation and on the expected size of such
contributions. We consider the estimates for the expected gift size (the second equation) first.
4.1 Expected Gift Size
Given that the average gift size is $32, it is not surprising that the estimated coefficients are
generally small in magnitude and rarely statistically significant. There are four exceptions to this
pattern. First, receipt of an academic honor scholarship increases the average gift size by $181.8
However, this impact is partially offset by the (surprising) negative coefficient on the size of the
merit award.9 Of course, the two coefficients must be interpreted together. In particular, at the
average size merit award of $5,879 the net effect of a merit award remains positive, but falls to
$49. Merit awards exceeding $8,083 (still within one standard deviation of the mean) have a net
negative effect on average contribution size. In other words, the long run net cost of small merit
awards appears to be less than their nominal value, while the opposite is true of larger, "full-ride"
awards. This surprising result suggests that a strategy of more numerous but lower valued merit
awards may increase future fundraising relative to fewer, but better funded merit awards.
Second, cumulative GPA has a negative impact of $30 per grade point on average gift
size. This effect is largely offset by the $28 increase in the average contribution associated with a
grade point increase in GPA relative to high school GPA, however.
Third, as expected on the basis of likely externalities, those residing outside of the south
make smaller average contributions.
Fourth, there is strong evidence that contribution size is inversely related to price.
Contributions that were subject to a corporate match were statistically significantly larger than
other gifts (a t-value above seven). The point estimate of the added contribution caused by a
8 Receipt of an athletic scholarship increases the average gift size by $41.9 Students with the ability to attract a large merit award for their undergraduate education are more likely to pursuepost-graduate education, and consequently are less likely to make contributions during their years as young alumni(OKunade, Wunnava and Walsh, 1994). However, we control for enrollment in graduate or professional school.Thus, the result is “surprising.”

13
corporate match is $1.60, or five percent of the average gift size of contributors. Therefore, we
can conclude that the elasticity of contributions with respect to the match rate is in excess of one.
If the average match rate is 100 percent, then the elasticity is approximately 1.1.10
Our results provide no evidence that receipt of need-based aid nor the amount of that aid
affects the size of contributors’ gifts. On the other hand, Baade and Sundberg (1996) found that
students receiving financial aid at two out of three institutions they studied made significantly
smaller contributions as alumni.
4.2 Likelihood of Giving
Unlike the expected gift size, the estimated impact of most of the variables on the probability of
making a donation is economically substantial and frequently statistically significant. The
variables are discussed in the same groups in which they were presented: financial aid, socio-
demographic, college experience, post college experience and charitable behavior.
4.2.1 Financial Aid
In short, the types of financial aid received appear to be much more important than the quantity
given. Receipt of a need-based loan lowers the probability of giving by 13 percent. Receiving a
need-based scholarship, however, raises this probability by 12 percent. Given that 80 percent of
the students with any need-based aid receive both loans and scholarships in their aid package,
these two effects generally offset each other. Of greater interest is that neither the total amount of
need-based aid nor the decomposition of that aid between loans and scholarship impacts the
probability of giving. In other words, whether or not a student receives a scholarship or a loan,
not the size of these awards, is what affects alumni donations.11
4.2.2 Socio-Demographics
Unlike Eckel and Grossman (1998), we find no differences in generosity between men and
women. On the other hand, graduates who attended a private high school are about ten percent
more likely to contribute.
10 The elasticity of contributions with respect to the match rate is the increase in the average post match gift size
divided by the average gift size or 32 50 160 1 32 50 32 50 34 10 2 32 50 32 50 11. . . . . . . .+ + − = − ≈� �� �� � � �� �� �match .
11 This last conclusion is supported by the results pertaining to merit scholarships. Although the point estimates arenot statistically significant, the receipt of the scholarship increases the probability of donating by about 7 percent, butthe amount of the merit scholarship has no perceptible effect.

14
4.2.3 College Experience
The college experience variables have the most consistent substantial effects on the likelihood of
giving. In particular, consistent with Harrison, Mitchell, and Peterson (1995), we find that
students who were members of non-academic groups--fraternities, sororities and athletic teams--
respond more favorably to requests for donations after graduation. The estimated effects are
seven, eleven and seven percent, respectively, and all are statistically significant.
Also, students who enjoyed academic success are more likely to contribute as alumni. On
the upside, a one standard deviation increase in GPA (about 0.44) raises the likelihood of giving
by two percent. On the downside, students who took more than eight semesters to graduate are
about eight percent less likely to donate.
Two majors, mathematics/engineering and science, have the greatest and only statistically
significant effects on the likelihood of contributing, but all of the point estimates are substantial.
Education, human/organizational development, performing arts, and science lower the
probability of giving by two, four, five and eleven percent, respectively (humanities is the
benchmark). Economics, mathematics/engineering, psychology and social science raise the
probability by four, seven, two and three percent, respectively. We hypothesized that science
majors would earn higher incomes than humanities majors. This increase in earnings would tend
to make them more rather than less likely to donate than humanities majors. Perhaps these
students, many of whom have gone on to medical school, are not yet in a financial position that
reflects the net present value of their expected lifetime income stream.
4.2.4 Post-College Experience
Married graduates are about four percent more likely to contribute and this number increases to
about six percent if their spouse is also a Vanderbilt alumnus. Although not statistically
significant, this result is in accordance with Hueston (1992), which found increased donations
from graduates' married to fellow alumni of New Mexico State. Graduates with children are
about five percent more likely per child to contribute.
Graduates who reside in Nashville are four percent more likely to contribute. Although
this coefficient is not statistically significant, it also accords with Hueston's (1992) finding that
New Mexico State alumni living in Las Cruces were about the most likely donors. Also, there

15
appears to be no distinction between Vanderbilt graduates who live outside the southeast and
those who live in the southeast, but outside of Nashville.
Finally, in contrast to the findings of Okanade, Wunnava and Walsh (1994) alumni who
remained at Vanderbilt for professional or graduate school are eight percent less likely to give to
the undergraduate college, while those who attended professional or graduate schools elsewhere
are about nine percent more likely to contribute. Apparently the loyalties of students who
continue their education at Vanderbilt get transferred to their graduate or professional school,
while those who continue their education elsewhere do not. This discovery could have
implications for admissions criteria used by Vanderbilt's graduate and professional schools.
4.2.5 Charitable Behavior
Graduates who made donations to the university hospital or to units of Vanderbilt unconnected to
undergraduate education are much more likely to contribute to the undergraduate college. Indeed,
those who made gifts to other units are 35 percent more likely to contribute to the undergraduate
college as alumni. This coefficient is statistically significant at the one percent level.
5. Conclusion
Financial aid is used as a strategic tool by colleges and universities to help achieve a variety of
goals--strengthen the academic quality of the student body, insure a diverse student population,
provide opportunities for intergenerational mobility in income and wealth, and strengthen the
financial condition of the institution. Although much has been written about the implications of
various financial aid strategies for the short-run financial status of colleges and universities, there
is also the possibility that financial aid decisions made today carry implications for future
voluntary contributions by alumni, and therefore the financial condition of institutions of higher
education in the long run.
The empirical results of this exploratory analysis suggest that discrete changes in the
packaging of financial aid eventually may affect the willingness of alumni to contribute. It
appears that small loans in mixed grant/loan packages may have negative long run financial
implications. Adding a modest grant to an otherwise exclusive loan package could have a
positive net present value to an institution by increasing the likelihood of receiving future
contributions from the aid recipient.
16
Finally, it is clear that students' willingness to contribute to their alma mater is affected by
their undergraduate experiences. Decisions regarding Greek organizations, athletics, grading
policies, and efforts to keep students "on track" to graduate with their entering class all bear, to
one degree or another, on the likelihood that students will continue to support their college or
university after they graduate.

17
References
Baade, Robert A. and Jefferey O. Sundberg, “Identifying the Factors that Stimulate AlumniGiving” Chronicle of Higher Education Volume 40, Issue 6 (September 29, 1993): B1 -B2.
Baade, Robert A. and Jefferey O. Sundberg, “What Determines Alumni Generosity?” Economicsof Education Review Volume 15, Issue 1 (February, 1996): 75 - 81.
Chronicle of Higher Education, Almanac (September, 1999)
Clotfelter, Charles T., "Alumni Giving to Elite Private Colleges and Universities," unpublishedmanuscript (Durham, N.C.: Duke University, April 2000).
Eckel, Catherine, and Philip Grossman, "Are Women Less Selfish than Men?: Evidence fromDictator Experiments," The Economic Journal Volume 108, Issue 448 (May 1998): - .
Harrison, William B., Shannon K. Mitchell, and Steven P. Peterson,"Alumni Donations andColleges' Development Expenditures: Does Spending Matter?" The American Journal ofEconomics and Sociology XX (October 1995), pp. 397 - 413.
Hecker, Daniel E., "Earnings of College Graduates, 1993," Monthly Labor Review 118(December, 1995), pp. 3 - .
Heckman, James, "Sample Selection Bias as a Specification Error," Econometrica Volume 47,Issue 1 (January, 1979): 153 - 161.
Hueston, Frederick R., "Predicting Alumni Giving: A Donor Analysis Test," Fund RaisingManagement XX (July 1992), pp. 18-23.
Jones, Ethel B. and John D. Jackson, "College Grade and Labor Market Rewards," Journal ofHuman Resources Volume 25, Issue 2 (Spring, 1990): 253 - 266.
Leslie, Larry L. and Garey Ramey, “Donor Behavior and Voluntary Support for HigherEducation Institutions,” Journal of Higher Education Volume 59, Issue 2 (April, 1988):115 - 132.
Lindahl, Wesley E. and Christopher Winship, "Predictive Models for Annual Fundraising andMajor Gift Fundraising," Nonprofit Management and Leadership Volume 3 (Fall, 1992):43 - 64.
McPherson, Michael S., and Morton Owen Schapiro, The Student Aid Game: Meeting Need andRewarding Talent in American Higher Education (Princeton, N.J.: Princeton UniversityPress, 1998).
Mulugetta, Yuko, Scott Nash and Susan H. Murphy, “What Makes a Difference: Evaluating theCornell Tradition Program,” in Joseph Pettit and Larry H Litlen edition, A New Era ofAlumni Research: Improving Institutional Performance and Better Serving Alumni (SanFrancisco: Jossey-Bass Publishers, 1999): 61 - 80.
OKunade, Albert Ade, "Graduate School Alumni Donations to Academic Funds: Micro-dataEvidence," American Journal of Economics and Sociology Volume 55 (April, 1996): 213- .

18
OKunade, Albert Ade and Scott Justice, “Micropanel Estimates of the Life-Cycle Hypothesiswith Respect to Alumni Donations,” 1990 Proceedings of the Business and EconomicStatistics Section of the American Statistical Association (Alexandria, VA: AmericanStatistical Association 1991): 298 - 305.
OKunade, Albert Ade, Phanindra V. Wannava and Raymond Walsh, Jr.. “Charitable Giving ofAlumni: Micro-data Evidence from a Large Public University,” American Journal ofEconomics and Sociology Volume 53 (January, 1994): 73 - 84.
Stuttler, Doug and Dave Calvario, “In Alumni Support, Satisfaction Matters,” Fund Raising 27(November, 1996): 12 - 13.

Explanatory Min Max Mean StandardVariable Deviation Donors Non-Donors
Financial Aid
Need-Based Loan 0 1 0.19 0.39 0.17 0.22 **
Need-Based Scholarship 0 1 0.18 0.38 0.17 0.19 *
Total Need-Based Aid 0 14.24 1.32 2.89 1.17 1.50 **
Percent of Total Aid in Loans 0 100 8.94 21.14 7.68 10.44 **
Merit Scholarship 0 1.00 0.05 0.21 0.05 0.03 **
Amount of Merit Scholarship 0 15.64 0.26 1.43 0.33 0.19 **
Athletic Scholarship 0 1 0.04 0.19 0.03 0.04
Socio-Demographic
White 0 1 0.95 0.23 0.95 0.94 **
Female 0 1 0.50 0.50 0.50 0.49
Private High School 0 1 0.43 0.50 0.45 0.41 **
College Experience
Fraternity (Men) 0 1 0.27 0.44 0.28 0.25 *
Sorority (Women) 0 1 0.31 0.46 0.34 0.27 **
Athlete 0 1 0.09 0.29 0.10 0.08
Cumulative GPA 1.27 4.00 2.95 0.44 2.98 2.92 **
GPA minus HS GPA -2.34 1.78 -0.38 0.49 -0.36 -0.40 **
More than 8 Semesters 0 1 0.07 0.26 0.06 0.09 **
Leave of Absence 0 1 0.06 0.23 0.05 0.07 *
Major
Economics 0 1 0.15 0.36 0.17 0.14 **
Education 0 1 0.06 0.24 0.06 0.06
Human/Org. Development 0 1 0.06 0.25 0.06 0.07
Mathematics/Engineering 0 1 0.28 0.45 0.30 0.25 **
Mean
Table 1: Descriptive Statistics
Explanatory Min Max Mean StandardVariable Deviation Donors Non-Donors
Mean
Table 1: Descriptive Statistics
Performing Arts 0 1 0.01 0.08 0.01 0.01
Psychology 0 1 0.09 0.29 0.09 0.09
Science 0 1 0.08 0.27 0.06 0.10 **
Social Science 0 1 0.17 0.38 0.18 0.16
Post-College Environment
Married 0 1 0.54 0.50 0.59 0.48 **
Married to Alumni 0 1 0.19 0.39 0.22 0.16 **
Number of Children 0 4 0.28 0.64 0.34 0.21 **
Nashville Resident 0 1 0.08 0.27 0.08 0.07
Reside Outside the South 0 1 0.44 0.50 0.42 0.45
Vanderbilt Grad./Prof. School 0 1 0.09 0.29 0.10 0.08
Other Grad./Prof. School 0 1 0.27 0.44 0.31 0.22 **
Charitable Behavior
Donate Elsewhere 0 1 0.06 0.23 0.00 0.00
Amount Donated Elsewhere 0 12.50 0.02 0.26 0.03 0.01 **
% of Giving Matched 0 100 5.28* = significant difference in means at 10% level** = significant difference in means at 5% level

Expected Regression EstimatesVariable Sign Coefficient Marginal Effect Coefficient
Intercept -0.72 91.52
Financial Aid
Need-Based Loan ? -0.36 -0.132 20.27 (-1.27) (0.28)
Need-Based Scholarship ? 0.32 * 0.117 -45.44 (1.82) (-0.83)
Total Need-Based Aid ? -0.01 -0.004 2.32 (-0.45) (0.54)
Percent of Total Aid in Loans - 0.00 0.000 -0.12 (0.05) (-0.22)
Merit Scholarship + 0.20 0.071 181.15 **(0.83) (3.78)
Amount of Merit Scholarship + 0.01 0.003 -22.41 **(0.21) (-4.23)
Athletic Scholarship + -0.15 -0.056 41.23 (-0.91) (1.13)
Socio-Demographic
White ? 0.06 0.023 -25.10 (0.55) (-1.14)
Female ? -0.01 -0.004 0.50 (-0.13) (0.04)
Private High School ? 0.10 * 0.038 -4.70 (1.91) (-0.26)
College Experience
Fraternity (Men) + 0.19 ** 0.069 -2.44 (2.66) (-0.08)
Sorority (Women) + 0.31 ** 0.113 -0.19 (4.26) (-0.00)
Probit Estimates
Table 2: Empirical Estimates(t -statistics in parentheses)

Expected Regression EstimatesVariable Sign Coefficient Marginal Effect Coefficient
Probit Estimates
Table 2: Empirical Estimates(t -statistics in parentheses)
Athlete + 0.18 ** 0.066 -9.16 (1.66) (-0.29)
Cumulative GPA + 0.12 * 0.043 -29.78 (1.55) (-1.38)
GPA minus HS GPA + -0.03 -0.009 27.78 **(-0.38) (2.33)
More than 8 Semesters - -0.21 ** -0.076 11.67 (-2.04) (0.34)
Leave of Absence - -0.08 -0.028 10.67 (-0.70) (0.49)
Major
Economics ? 0.11 0.041 7.80 (1.48) (0.37)
Education ? -0.06 -0.023 -7.27 (-0.56) (-0.35)
Human/Org. Development ? -0.12 -0.043 -15.45 (-1.09) (-0.62)
Mathematics/Engineering ? 0.20 ** 0.073 -14.71 (2.97) (-0.46)
Performing Arts ? -0.14 -0.053 10.43 (-0.45) (0.18)
Psychology ? 0.07 0.025 -13.53 (0.76) (-0.75)
Science ? -0.31 ** -0.114 10.79 (-3.07) (0.23)
Social Science ? 0.07 0.025 -7.97 (0.93) (-0.50)
Post-College Environment

Expected Regression EstimatesVariable Sign Coefficient Marginal Effect Coefficient
Probit Estimates
Table 2: Empirical Estimates(t -statistics in parentheses)
Married ? 0.10 * 0.036 -4.56 (1.68) (-0.28)
Married to Alumni + 0.07 0.027 8.48 (1.05) (0.53)
Number of Children ? 0.15 ** 0.054 -2.00 (3.44) (-0.09)
Nashville Resident + 0.11 0.042 1.64(1.16) (0.07)
Reside Outside the South - -0.01 -0.003 -14.74 **(-0.15) (-1.70)
Vanderbilt Grad./Prof. School ? -0.21 ** -0.078 -0.69 (-2.06) (-0.02)
Other Grad./Prof. School ? 0.24 ** 0.088 -10.55 (4.17) (-0.29)
Charitable Behavior
Donate Elsewhere ? 0.96 ** 0.349 -45.68 (6.47) (-0.30)
Amount Donated Elsewhere ? 0.10 0.038 10.20 (0.55) (0.41)
% of Giving Matched ? ----- ----- 1.60 **(7.84)
Inverse Mills Ratio + ----- ----- 80.26 (0.37)
* = significant difference in means at 10% level** = significant difference in means at 5% level