understanding and engineering enzymes for enhanced biofuel...
TRANSCRIPT
SANDIA REPORT SAND2009-0489 Unlimited Release Printed January 2009
Understanding and Engineering Enzymes for Enhanced Biofuel Production Rajat Sapra, Diana Roe, Joanne Volponi, Jean-Loup Faulon, George Buffleben, and Blake Simmons Prepared by Sandia National Laboratories Albuquerque, New Mexico 87185 and Livermore, California 94550 Sandia is a multiprogram laboratory operated by Sandia Corporation, a Lockheed Martin Company, for the United States Department of Energy’s National Nuclear Security Administration under Contract DE-AC04-94AL85000. Approved for public release; further dissemination unlimited.

2
Issued by Sandia National Laboratories, operated for the United States Department of Energy by Sandia Corporation.
NOTICE: This report was prepared as an account of work sponsored by an agency of the United States Government. Neither the United States Government, nor any agency thereof, nor any of their employees, nor any of their contractors, subcontractors, or their employees, make any warranty, express or implied, or assume any legal liability or responsibility for the accuracy, completeness, or usefulness of any information, apparatus, product, or process disclosed, or represent that its use would not infringe privately owned rights. Reference herein to any specific commercial product, process, or service by trade name, trademark, manufacturer, or otherwise, does not necessarily constitute or imply its endorsement, recommendation, or favoring by the United States Government, any agency thereof, or any of their contractors or subcontractors. The views and opinions expressed herein do not necessarily state or reflect those of the United States Government, any agency thereof, or any of their contractors.
Printed in the United States of America. This report has been reproduced directly from the best available copy.
Available to DOE and DOE contractors from U.S. Department of Energy Office of Scientific and Technical Information P.O. Box 62 Oak Ridge, TN 37831
Telephone: (865) 576-8401 Facsimile: (865) 576-5728 E-Mail: [email protected] Online ordering: http://www.osti.gov/bridge
Available to the public from U.S. Department of Commerce National Technical Information Service 5285 Port Royal Rd. Springfield, VA 22161
Telephone: (800) 553-6847 Facsimile: (703) 605-6900 E-Mail: [email protected] Online order: http://www.ntis.gov/help/ordermethods.asp?loc=7-4-0#online

3
Table of Contents
1.0 ABSTRACT .........................................................................................................................4 2.0 understanding enzyme performance through computational modeling...................................5
2.1 Introduction.......................................................................................................................5 2.1.1 Cellulase from Sulfolobus solfataricus........................................................................5 2.1.2 CelA from Alicyclobacillus acidocaldarius.................................................................6 2.1.3 Generating homology models from sequences ............................................................7
2.2 Methods ............................................................................................................................8 2.2.1 Generating a homology model for the cellulase from Sulfolobus solfataricus..............8 2.2.2 Generating computational predictions for improving S. solfataricus cellulase activity.9 2.2.3 Generating a homology model for celA from Alicyclobacillus acidocaldarius.............9 2.2.4 Predicting pH optimum in CelA................................................................................10
2.3 Results ............................................................................................................................11 2.3.1 Homology model of S. Solfataricus cellulase............................................................11 2.3.1 Predicting residues to improve catalysis for S. solfataricus .......................................12 2.3.2 Homology Model of CelA ........................................................................................13 2.3.3 Computational Engineering of CelA to Lower pH Optimum....................................16
2.4 Conclusion ......................................................................................................................18 3.0 DIRECTED EVOLUTION STRATEGY FOR THE IMPROVEMENT OF CATALYTIC ACTIVITY OF CelA FROM THE THERMOACIDOPHILIC BACTERIUM ALICYCLOBACILLUS ACIDOCALDARIUS........................................................................19
3.1 Introduction.....................................................................................................................19 3.2 Materials and Methods ....................................................................................................22
3.2.1 Enzyme assays..........................................................................................................22 3.2.2. Cloning for HTP analysis.........................................................................................23 3.2.3. Protein expression. ..................................................................................................23 3.2.4. ePCR protocols:.......................................................................................................23 3.2.5 Cloning of the Mutant Library into the pBAD vector................................................24 3.2.6 DpnI digestion of the PCR products:.........................................................................24 3.2.7 DNA sequencing. .....................................................................................................24
3.3 Results and Discussion ....................................................................................................25 3.3.1 Random Mutagenesis Analysis of the Frequency of Mutations .................................25 3.3.2 Selection of enzyme assays.......................................................................................25 3.3.3 Protein Expression in 96 well plates. ........................................................................25 3.3.4 Surveying and selecting mutation rates for CelA.......................................................26 3.3.5 Comaprison of the low error library using two different enzyme assays....................26
3.4 Conclusion ......................................................................................................................26 4.0 REFERENCES ...................................................................................................................27
4
1.0 ABSTRACT Today, carbon-rich fossil fuels, primarily oil, coal and natural gas, provide 85% of the energy consumed in the United States. The release of greenhouse gases from these fuels has spurred research into alternative, non-fossil energy sources. Lignocellulosic biomass is renewable resource that is carbon-neutral, and can provide a raw material for alternative transportation fuels. Plant-derived biomass contains cellulose, which is difficult to convert to monomeric sugars for production of fuels. The development of cost-effective and energy-efficient processes to transform the cellulosic content of biomass into fuels is hampered by significant roadblocks, including the lack of specifically developed energy crops, the difficulty in separating biomass components, the high costs of enzymatic deconstruction of biomass, and the inhibitory effect of fuels and processing byproducts on organisms responsible for producing fuels from biomass monomers. One of the main impediments to more widespread utilization of this important resource is the recalcitrance of cellulosic biomass and techniques that can be utilized to deconstruct cellulosic biomass.

5
2.0 UNDERSTANDING ENZYME PERFORMANCE THROUGH COMPUTATIONAL MODELING 2.1 Introduction The goal of the computational section was to provide hypothesis for generating mutants and understanding experimental results. As the aim was to engineer an enzyme with improved performance in a dilute acid environment, we focused on three properties in particular: thermostability, catalytic activity and pH optimum. We explored two cellulase enzymes, the first from the extremophile Sulfolobus solfataricus, the second was celA from Alicyclobacillus acidocaldarius. As Sulfolobus solfataricus exists in a low pH and high heat environment, the primary property to optimize was its catalytic activity. With the celA , our initial goal was to try to lower its pH optimum from 5.5 to even lower for industrial use. Since there was no a-priori data about the effects of mutations for this enzyme, we took a combined approach of structural modeling and bioinformatic analysis for both enzymes, described in the method sections. Although there was not a crystal structure available for either cellulase, we were able to generate homology models of both of them as a starting point for structure-based engineering. 2.1.1 Cellulase from Sulfolobus solfataricus The cellulase from Sulfolobus solfataricus is a glycoside hydrolase (GH) enzyme belonging to the glycosyl hydrolase family 12[1] as found in CAZY (Carbohydrate Active Enzymes database at http://www.cazy.org/). Glycoside hydrolases are classified into 113 families based on sequence similarity, and differ on protein fold and reaction mechanism. The overall structure of the cel12 family is a β-jellyroll fold with a six stranded antiparallel β sheet packing on the outside of a nine-stranded mostly antiparallel βsheet curved around an active site cleft, as shown in Figure 2.1. The cel12 family hydrolyzes the β -1,4-glycosidic bond in cellulose in a catalytic mechanism involves two glutamic acids, one serving as a nucleophile and the other as a proton donor, in a double displacement reaction with a glycosylenzyme intermediate that results in retention of configuration in the product[2, 3]. A number of crystal structures have been solved in this family, and their protein data bank[4] entries shown in Table 2.1. The key features in these enzymes, in addition to the catalytic glutamates, are a series of conserved aromatic residues interacting with the sugar rings on the cellulose substrate, along with specific hydrogen-bonding interactions from the backbone and polar sidechains. The standard notation for these enzymes lists the interactions with each sugar as a subsite, numbered sequential from +3 to -3 from reducing end to non-reducing end, with cleavage occurring between +1,-1. At the reducing end of the active site there is a conserved Pro-X-Gly motif, termed the “cord”, which causes the substrate to distort to aid in hydrolysis.

6
Table 2.1 Crystal structure of cellulase family 12 enzymes
Organism PDB Structures R. Marinus[5] 1H0B,2BW8,2BWCS. Lividans[6] 1NLR H. Grisea[7] 1OLR,1W2U A. Niger[8] 1KS4,1KS5 T. Reesei[9] 1H8V,1OA2,1OLQ
Strep. Sp.[10] 1OA4 H. Schweinitzii[10] 1OA3
2.1.2 CelA from Alicyclobacillus acidocaldarius
Although CelA performs the same function as the cellulase from S. solfataricus, it belongs to the glycosyl hydrolase family 9[1] rather than family 12, which has several differences in addition to pH and thermal properties. The first is that the overall fold is an ( // )6 barrel, which gives the active site a different shape, although it uses a similar pattern of aromatic residues interacting with the cellulose sugar groups for substrate binding. And its reaction mechanism results in
Figure 2.1 Crystal structure of cel12a from R. Marinus in “jellyroll” fold (green) bound to a cellulotetraose substrate (gray). Key residues are highlighted –active site glutamates (red), aromatic groups (magenta), hydrogen-bonding groups (cyan). The XPXG “cord is yellow.
7
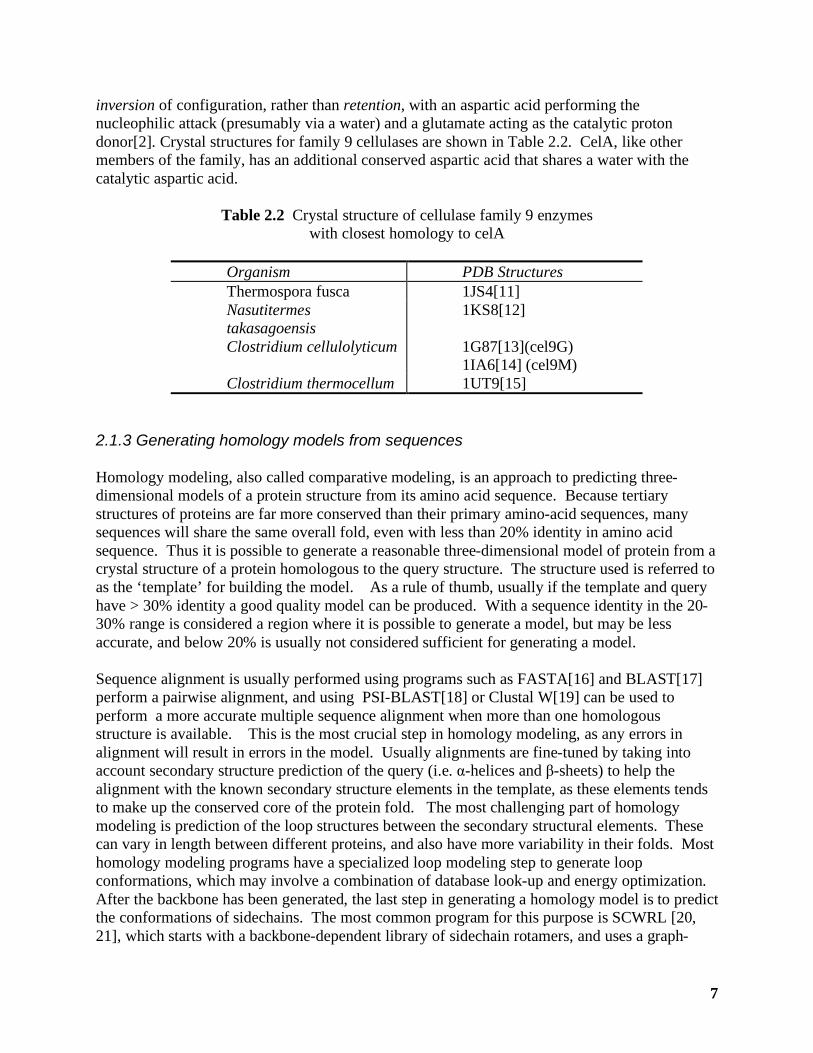
inversion of configuration, rather than retention, with an aspartic acid performing the nucleophilic attack (presumably via a water) and a glutamate acting as the catalytic proton donor[2]. Crystal structures for family 9 cellulases are shown in Table 2.2. CelA, like other members of the family, has an additional conserved aspartic acid that shares a water with the catalytic aspartic acid.
Table 2.2 Crystal structure of cellulase family 9 enzymes with closest homology to celA
Organism PDB Structures Thermospora fusca 1JS4[11] Nasutitermes takasagoensis
1KS8[12]
Clostridium cellulolyticum 1G87[13](cel9G) 1IA6[14] (cel9M)
Clostridium thermocellum 1UT9[15] 2.1.3 Generating homology models from sequences Homology modeling, also called comparative modeling, is an approach to predicting three-dimensional models of a protein structure from its amino acid sequence. Because tertiary structures of proteins are far more conserved than their primary amino-acid sequences, many sequences will share the same overall fold, even with less than 20% identity in amino acid sequence. Thus it is possible to generate a reasonable three-dimensional model of protein from a crystal structure of a protein homologous to the query structure. The structure used is referred to as the ‘template’ for building the model. As a rule of thumb, usually if the template and query have > 30% identity a good quality model can be produced. With a sequence identity in the 20-30% range is considered a region where it is possible to generate a model, but may be less accurate, and below 20% is usually not considered sufficient for generating a model. Sequence alignment is usually performed using programs such as FASTA[16] and BLAST[17] perform a pairwise alignment, and using PSI-BLAST[18] or Clustal W[19] can be used to perform a more accurate multiple sequence alignment when more than one homologous structure is available. This is the most crucial step in homology modeling, as any errors in alignment will result in errors in the model. Usually alignments are fine-tuned by taking into account secondary structure prediction of the query (i.e. α-helices and β-sheets) to help the alignment with the known secondary structure elements in the template, as these elements tends to make up the conserved core of the protein fold. The most challenging part of homology modeling is prediction of the loop structures between the secondary structural elements. These can vary in length between different proteins, and also have more variability in their folds. Most homology modeling programs have a specialized loop modeling step to generate loop conformations, which may involve a combination of database look-up and energy optimization. After the backbone has been generated, the last step in generating a homology model is to predict the conformations of sidechains. The most common program for this purpose is SCWRL [20, 21], which starts with a backbone-dependent library of sidechain rotamers, and uses a graph-
8
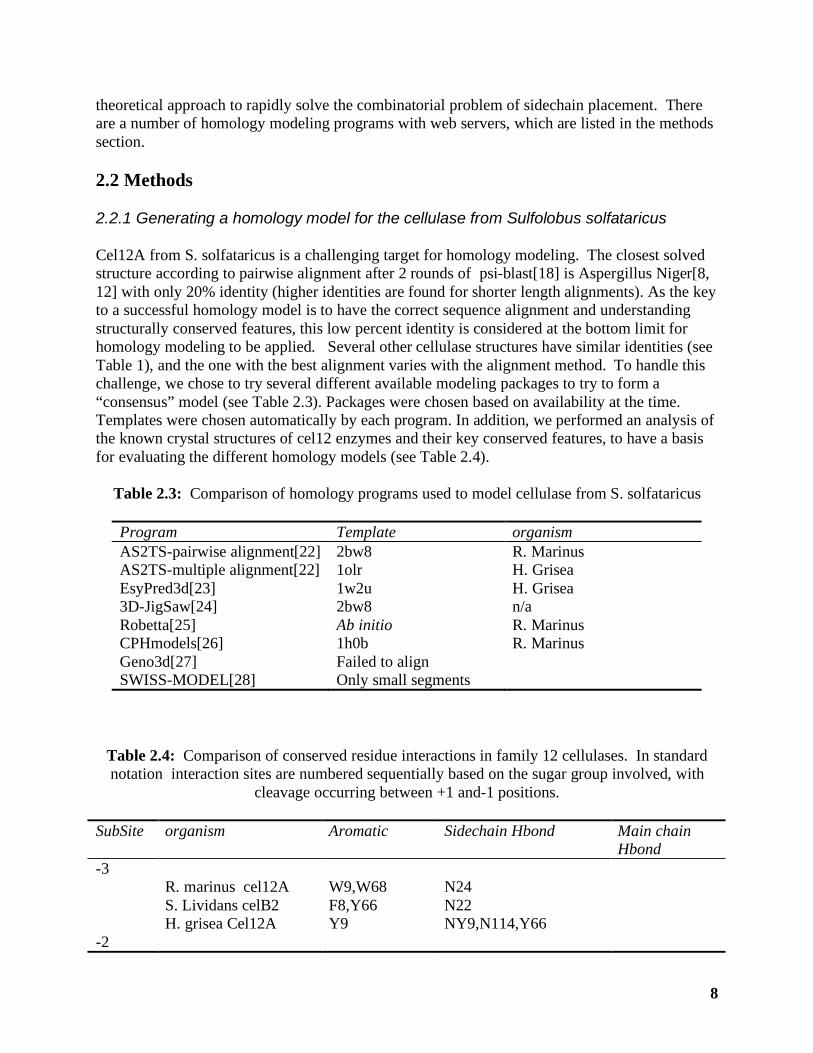
theoretical approach to rapidly solve the combinatorial problem of sidechain placement. There are a number of homology modeling programs with web servers, which are listed in the methods section. 2.2 Methods 2.2.1 Generating a homology model for the cellulase from Sulfolobus solfataricus Cel12A from S. solfataricus is a challenging target for homology modeling. The closest solved structure according to pairwise alignment after 2 rounds of psi-blast[18] is Aspergillus Niger[8, 12] with only 20% identity (higher identities are found for shorter length alignments). As the key to a successful homology model is to have the correct sequence alignment and understanding structurally conserved features, this low percent identity is considered at the bottom limit for homology modeling to be applied. Several other cellulase structures have similar identities (see Table 1), and the one with the best alignment varies with the alignment method. To handle this challenge, we chose to try several different available modeling packages to try to form a “consensus” model (see Table 2.3). Packages were chosen based on availability at the time. Templates were chosen automatically by each program. In addition, we performed an analysis of the known crystal structures of cel12 enzymes and their key conserved features, to have a basis for evaluating the different homology models (see Table 2.4).
Table 2.3: Comparison of homology programs used to model cellulase from S. solfataricus
Program Template organism AS2TS-pairwise alignment[22] 2bw8 R. Marinus AS2TS-multiple alignment[22] 1olr H. Grisea EsyPred3d[23] 1w2u H. Grisea 3D-JigSaw[24] 2bw8 n/a Robetta[25] Ab initio R. Marinus CPHmodels[26] 1h0b R. Marinus Geno3d[27] Failed to align SWISS-MODEL[28] Only small segments
Table 2.4: Comparison of conserved residue interactions in family 12 cellulases. In standard notation interaction sites are numbered sequentially based on the sugar group involved, with
cleavage occurring between +1 and-1 positions.
SubSite organism Aromatic Sidechain Hbond Main chain Hbond
-3 R. marinus cel12A W9,W68 N24 S. Lividans celB2 F8,Y66 N22 H. grisea Cel12A Y9 NY9,N114,Y66 -2

9
R. marinus W26,W68 N24,H67 S. lividans W24 N22,H65 H. grisea W24 N22 -1 R. marinus W26,E207,E124 S. lividans W24,E203,E120,N155 H. grisea W24,E205,E120,N155 +1 R. marinus W159 E207,Y163 M136 S. lividans E205 Q132 H. grisea E205 Y132 +2 R. marinus M136 S. lividans Q132 H. grisea Y132 2.2.2 Generating computational predictions for improving S. solfataricus cellulase activity Protein engineering usually requires multiple iterations of modeling and predicting. As a first step, we focused on probing the amino acid space of related enzymes for conservative mutations which may improve activity. We compared the enzyme model to two related enzymes T. Reesei and S. sp. 11AG8, which have the greatest catalytic activity in kinetic assays[10, 29]. We focused on identifying differences in residues in the active site involved in transition state binding, which may cause an increase in catalytic activity for the S. Solfataricus cellulase. Mutations were selected based on differences for which a structural hypothesis could be generated as to how they may improve catalytic activity such as increasing hydrophobic interaction with the sugars in the transition state, indirectly through charge or shape increasing interaction with the transition state, and improving product release. 2.2.3 Generating a homology model for celA from Alicyclobacillus acidocaldarius The first step in modeling pH changes to CelA was to generate a homology model of the structure of CelA. A BLAST search of the protein data bank (PDB) showed that C. thermocellum had the highest sequence similarity to CelA, with ~30% identity. The primary program used to generate homology models of celA was the nest[30] program which was shown to be one of the top homology modeling programs in a recent benchmark comparison[31]. The advantage of nest was that a locally installed version could be used to customize each step of the modeling process for celA. As with the cellulase from S. solfataricus we also compared results from multiple servers, chosen for availability based on time of the modeling, which included ESyPred3D[23], FFSAO[32-34], SAM-T06[16, 35-37], AS2TS[22], and CPHmodels-20.0[26]. FFSA0 and SAM-T06 were currently top-ranking homology servers in the ongoing livebench-8[38] study.
10
For the homology models built using the nest program, we started with the set of five crystal structures listed in Table 2. Individual pairwise identity ranged from 22-30% for these structures to celA. Further, all templates showed significant sequence and structural identity in the active site residues among themselves and in alignment to celA. We compared 3 strategies for aligning the model:
1. 1CLC as template (29%identity) after 4 rounds of psi-blast [18] multiple sequence alignement.
2. 1CLC as template using a manually “tuned” alignment derived from a clustalW2[19] multiple sequence alignment of the five related glucanase structures followed by structural alignment using LGA[39], and manual optimization. The alignment tuning also took into account residues interacting with the oligosaccharide substrate in the crystal structures. In particular, residues PHE399 and TRP339 were each realigned by 1 position to allow interaction with the substrate, mimicking interactions in 1IA6 and 1CLC respectively.
3. Multiple templates (1CLC,1IA6, and 1UT9) using “tuned” alignment.
All models were given a final refinement using nest’s conref utility for consistency (which produced higher scores in all cases) and then assessed using Verify3d [40, 41] and ProQ[42] servers. Two metrics were used to compare overall structures with Verify3d: the average score over all the residues, and the percent of low-scoring residues (<0.2) to highlight number of poorly modeled regions in each structure. 2.2.4 Predicting pH optimum in CelA The goal with Alicyclobacillus acidocaldarius was to lower its pH optimum. To modify pH optimum we started with the reaction mechanism. CelA uses a inverting catalytic mechanism, with ASP146 performing the nucleophilic attack (presumably via a water) and GLU515 acting as the catalytic proton donor. The pKa’s of these residues are responsible for the span of the active pH range, with the pKa of ASP146 providing the lower bound of active pH range, and the pKa of GLU515 providing the upper end of the active range. According to several examples in the literature, the best way to lower the pH optimum is to lower the pKa of the nucleophilic catalytic residue, in this case ASP146. Two methods were explored for predicting changes to pKa. The first using a Poisson-Boltzmann calculation to evaluate changes in pKa, the second using the empirical PROPKA[43, 44].
1. Poisson-Boltzmann approach: Each residue was mutated using SQWRL[21] to position the mutated sidechain, and keeping the rest of the protein sidechain rigid, rather than a full conformational simulation of the sidechains. Although less realistic that allowing all the sidechains to rotate, this allowed more computational consistency for comparing the overall charge effects. pKas were predicted with ZAP[45], a fast single-conformer program that calculates electrostatic potential by solving the Poisson-Boltzmann equation using a smooth permittivity finite difference approach[46].
2. PROPKA approach: Each residue was mutated using Sandia’s PEngineer[47] code, in the
presence of a substrate model, band all rotamers below an energy cutoff were sent to
11
PROPKA, which has a feature to generate predictions from multiple rotamers. PROPKA uses a fast empirical evaluation derived from quantum mechanical calculations to predict pKa.
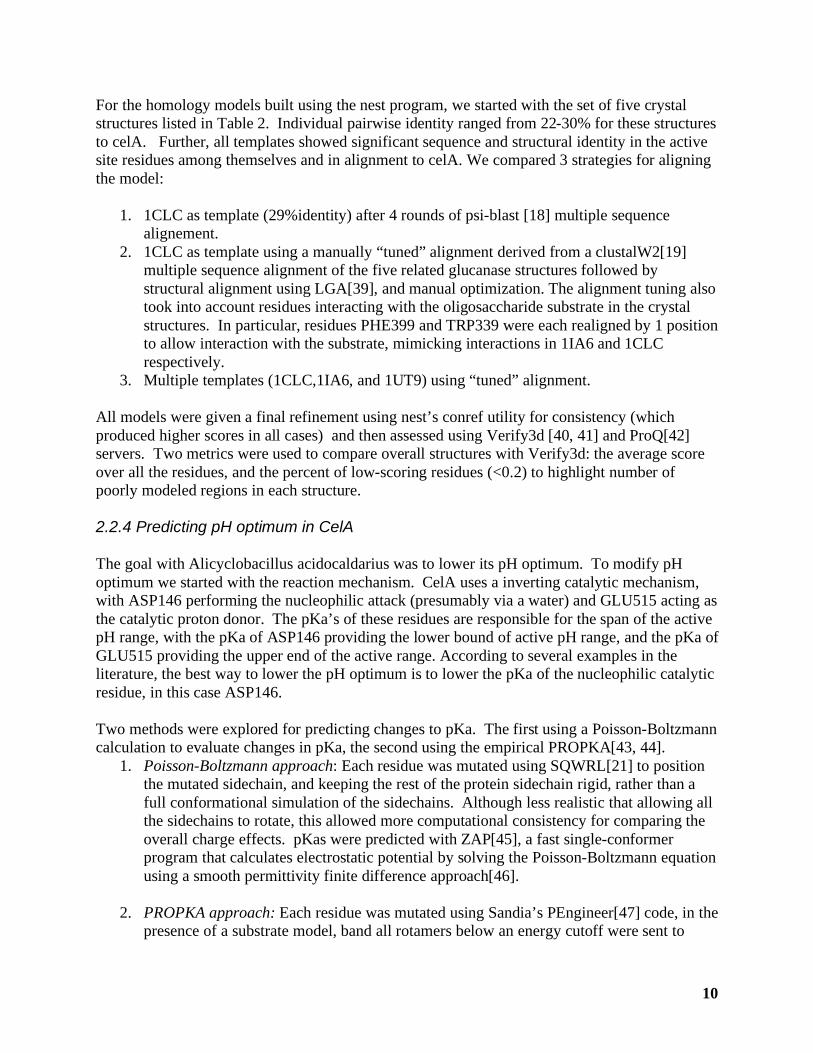
Subsequent benchmarking of the two approaches on a set of xylanases in are own studies and literature comparisons, show the PROPKA approach to be superior[48, 49]. In the first set of mutants selected for CelA the Poisson-Boltzmann approach was applied. We started with residues within 5Å of the active site . We further limited the mutations by analyzing the sequence conservation of these residues from our structural alignment. Residues surrounding the active site were grouped into 3 categories: strictly conserved, conserved homology, and non-conserved. The strictly conserved residues were not selected for mutation. The ones with conserved homology were limited to residues within the homologous set. The last set of residues was allowed to fully mutate. 2.3 Results 2.3.1 Homology model of S. Solfataricus cellulase All models generated from the homology modeling programs were evaluated based on the conserved interactions listed in Table 4. The models from AS2TS and ESyPred3D had the largest number conserved active site interactions. In particular, most other models were missing an aromatic interaction in the P-3 subsite, due to differences in the loop building among the structural models. Figure 2.2 compares the two top models, which are in overall agreement on residues predicted to interact with the cellulose substrate and to the multiple structure alignment, but differ further away from the active site.
(a) (b)
Figure 2.2. Comparison of models from (a) ESyPred3D (yellow) and (b) AS2TS (white) to crystal structure of R. marinus template(purple). The carbohydrate substrate
is colored byatom with grey carbons and red oxygens.
R. Marinus xtal structure
Carbohydrate substrate
Model from Esypred3d Model from AS2TS
12
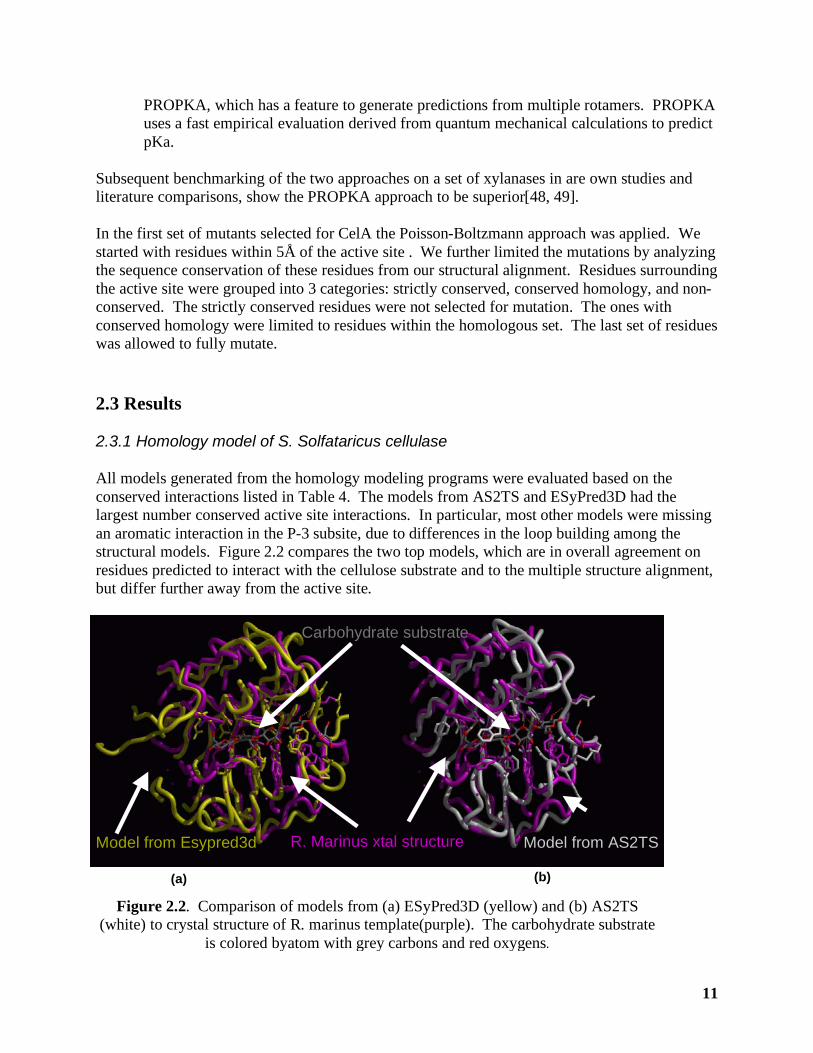
2.3.1 Predicting residues to improve catalysis for S. solfataricus We used the model of S. solfataricus to compare residues those in T. Reesei and S. sp. 11AG8, which had the highest catalytic activities in the comparison study[10, 29]. We overlaid the both the AS2TS and ESyPred3D model structures with crystal structures of the two enzymes bound to a substrate mimic, and focused on the active site residues involved in transition state binding. Table 2.5 shows a list of the residues differences. In addition to these differences, another difference involved insertion of Pro between 310Glu and 311Trp in the model. Mutation predictions were chosen from these differences and from structural hypothesis. Figure 2.3 shows a list of the final mutations chosen. Table 2.5. Residue differences between S. solfataricus model, S. Sp. And T. Reesei purported to
be involved in transition state binding. Differences between S. Sp. and model (compared to both M5_1olr from AS2TS and prot_04623062 from ESyPred3D)
Residue Number in Model
Residue in Model
Residue in S. Sp. 11AG8
Residue in T Reesei
Notes:
103 Asn Gly Gly 137 Thr Pro Val Different Than T.
Reesei 142 Glu Ser n/a S-3 – new;
ESyPred only 207 Pro Tyr/His Tyr S-3 subsite 208 Gly Tyr Tyr S-3 subsite 223 Leu Val Ile 226 Ala Ile Ile cord 258 Trp Asn Met S-1,modified;
AS2TS only 260 Gly Val Val AS2TS only 261 Trp Asn N/a Away from site 263 Tyr Val n/a EsyPred only,new 304 Asp Ser n/a new,far from site

13
The final set of mutations chosen were grouped into four conceptual categories
1. Mutations to add aromatic interactions to directly improve transition state binding: 208 Gly->Tyr 207 Pro->His 207 Pro->Tyr
2. Mutations to indirectly improve transition state binding : 103Asn->Gly
3. Mutations to improve product release Ala226->Gly
4. Insertion Pro between 310 Glu and 311Trp The mutations have not been evaluated experimentally due to difficulties expressing S. solfataricus in sufficient quantities. 2.3.2 Homology Model of CelA Models for CelA were generated from multiple programs using variations in alignment. Overall there was strong agreement between the models. With the exception of the positioning of PHE399 and TRP339, all models generated a similar conserved set of interactions with the substrate. Looking at Table 2.6, we see improvement by using the “tuned” alignment for 1CLC, and further improvement by using a combination of templates for the final structures, as seen in the increasingly higher average scores and the smaller percentages of low-scoring residues for verify3d, as well as high ProQ scores. The AS2TS model had the highest ProQ scores.
Glu 310
Glu 213
Asn 103 Thr 137
Ala 226
Pro 207 Gly 208
Figure 2.3. Mutations selected by comparison to S. Sp. 11AG8 which may improve catalytic activity. Protein (green) with catalytic residues Glu 213,310(red). modeled substrate (gray/red oxygens), and mutations orange,yellow(cord), and magenta.

14
Table 2.6. Comparison of the different homology model structures using Verify3D and ProQ to measure quality. *Note: ESyPred3D has a lower score because it chose the 1UT9 as the template
(24.1% identity). 1CLC template produced an error.
Method Template %Identity Verify3d Average Score X100
Verify3d % <0.2
ProQ LGscore
ProQ MaxSub
nest_1clc_psiblast[30] 1clc 29 37.4 8.9 5.730 0.484 nest_1clc_tuned[30] 1clc 29 40.6 7.6 5.834 0.519 nest_2struct_tuned[30] 1clc,1IA6 29, 23 39.1 5.9 5.931 0.508 nest_3struct_tuned[30] 1clc,1IA6,
1UT9 29,23,26 41.0 4.5 5.570 0.503
*ESyPred3D[23] 1ut9 24.1 36.6 11.9 5.444 0.475 FFAS03[32-34] 1clc 29 39.1 9.4 6.007 0.503 SAM[16, 35-37] 1clc 29 38.5 5.6 5.354 0.475 cph models[26] 1clc 30 37.9 9.2 5.906 0.503 as2ts[22] 1clc 29 40.1 5.9 6.233 0.538
Figure 2.4 shows a comparison of the positions for PHE399 and TRP339 in the “tuned” versus untuned alignments. (The tuned alignment has both of these groups interacting with the substrate). Although the scores are slightly better for the tuned alignment, the differences are small, and so this alone is not conclusive. Both the tuned and alternative positions for PHE399 are seen in several of the crystal structures. The tuned alignment for TRP339 is seen in several crystal structures, whereas the alternative is not, making the “tuned” alignment more likely. Figure 2.5 shows the model and the conserved pattern of aromatic interactions with the target substrate.

15
Figure 2.4. Comparing aromatic residues TRP339 and PHE399 (magenta) in models of CelA (green). The “tuned” alignment has these residues interacting with the substrate(gray/red). Alternate positions from other models are shown in blue.
Figure 2.5. Model of CelA (green). Substrate taken from 4Tf4 and 1K72 shown in gray with red oxygens. Conserved aromatic interactions (yellow), catalytic residues (red), and conserved ARG (cyan) are shown.

16
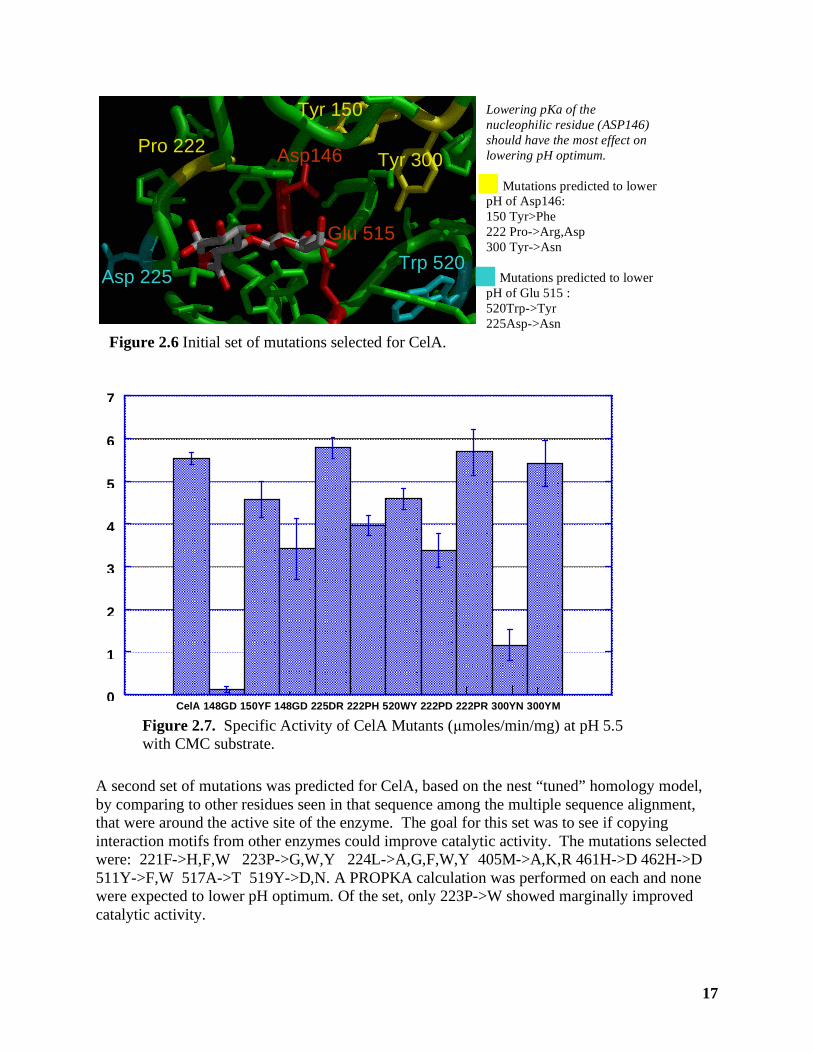
2.3.3 Computational Engineering of CelA to Lower pH Optimum The first set of mutants for CelA was generating by selecting residues within 5 Å of the catalytic acids, and using the Poisson-Boltzmann calculations to predict how these mutations would alter the pKa of ASP146 and GLU515. With the exception of 300Y, only residue positions not expected to interact directly with the substrate were examined. Table 2.7 shows residues chosen based on intial pKa predictions using Poisson-Boltzmann calculations on a preliminary homology model generated from cph models. Note that 148G->D,E was chosen as a negative control and predicted to increase pHoptimum. Table 2.7. pKa predictions from the Poisson-Boltzmann approach used to choose mutation, compared to PROPKA predictions. The Poisson-Boltzmann predictions used the cph-models homology model, the PROPKA was run on the “tuned” model structure from nest. Residue conservation is based on alignment.
Mutation Residue conservation
category
Poisson-Boltmann pKa ASP 146
PROPKA pKa ASP 146
PROPKA-based prediction
150Y->F conservative 1.9 5.1 Raise pKa 300Y->N strict 2.6 4.6 No effect 222P->D Not conserved 3.9 4.7 No effect 222P->R Not conserved -0.1 2.1 Lower pKa 222P->H Not conserved 0.9 4.7 No effect 148G->E Not conserved 10.4 n/a n/a 148G->D Not conserved 5.4 6.3 Raise pKa 225D->R Not conserved 3.2 4.6 No effect 520W->Y conservative 3.5 4.6 No effect WT 3.5 3.5 4.7 4.7
Subsequent to choosing and testing mutations, newer pKa predictions were performed using PROPKA on the “tuned” model from nest. Modeling of a substrate onto the 148G->E mutant showed it would interfere with substrate binding, consistent with its inactivity in assays. The PROPKA predicts the majority of mutants initially selected to have no change in pH optimimum. In contrast to earlier prediction, PROPKA calculations predicts 150Y->F to slightly raise pKa instead of lowering it. Both calculations predict 148G->D to raise pKa as a negative control. The only mutation from this set that PROPKA predicts as lowering pH is 222P->R. Experimental Results at pH 5.5 for the mutants are shown in Figure 2.7. Mutant 148G->D is inactive as expected in modeling with substrate present. Most of the other muations are active. Mutation 300Y->N, which is a non-conservative mutation in a strictly conserved residue, is less active, as expected. The protein precipitated at pH 4.5 and so we were unable to evaluate pH optimum. At pH 6.5 mutant 148G->D shows a slightly higher relative activity compared to CelA (0.7) compared to its relative activity at pH 5.5 (0.6), which was consistent for the prediction of this negative control mutant. All the rest show the same or lower relative activity at pH 6.5.
17
A second set of mutations was predicted for CelA, based on the nest “tuned” homology model, by comparing to other residues seen in that sequence among the multiple sequence alignment, that were around the active site of the enzyme. The goal for this set was to see if copying interaction motifs from other enzymes could improve catalytic activity. The mutations selected were: 221F->H,F,W 223P->G,W,Y 224L->A,G,F,W,Y 405M->A,K,R 461H->D 462H->D 511Y->F,W 517A->T 519Y->D,N. A PROPKA calculation was performed on each and none were expected to lower pH optimum. Of the set, only 223P->W showed marginally improved catalytic activity.
Asp146
Glu 515
Figure 2.6 Initial set of mutations selected for CelA.
Tyr 150
Tyr 300 Pro 222
Asp 225 Trp 520
Lowering pKa of the nucleophilic residue (ASP146) should have the most effect on lowering pH optimum. Mutations predicted to lower pH of Asp146: 150 Tyr>Phe 222 Pro->Arg,Asp 300 Tyr->Asn Mutations predicted to lower pH of Glu 515 : 520Trp->Tyr 225Asp->Asn
CelA 148GD 150YF 148GD 225DR 222PH 520WY 222PD 222PR 300YN 300YM 0 1 2 3 4 5 6 7
Figure 2.7. Specific Activity of CelA Mutants (µmoles/min/mg) at pH 5.5 with CMC substrate.

18
2.4 Conclusion We generated a series of mutant predictions for S. solfataricus and celA. Issues with expression prevented testing of the S. solfataricus mutations. The mutations for celA were two sets: the first design to lower the optimum pKa, the second to explore variations in homologous enzymes. We were not able to test the first set at lower pH due to enzyme precipitation, however 225D->R and 222P->R both have good activities at pH 5.5 and may be worth pursing. The set from comparing to related enzymes did not improve catalytic activity overall, although 223P->W showed marginally improved activity.
19
3.0 DIRECTED EVOLUTION STRATEGY FOR THE IMPROVEMENT OF CATALYTIC ACTIVITY OF CELA FROM THE THERMOACIDOPHILIC BACTERIUM ALICYCLOBACILLUS ACIDOCALDARIUS. 3.1 Introduction A key step in the deconstruction of biomass and the strategy to overcome recalcitrance of lignocellulosic biomass (LC) is the use of cellulolytic enzymes for the hydrolysis of biomass and fermentation of resulting sugars to fuels. Enzymes that break down LC are isolated from microorganisms that hydrolyze sugars for metabolic requirements. Such enzymes are generally extracellular secreted and have been isolated from aerobic and anaerobic bacteria, archaea and fungi. Three major types of enzymatic activities that break down LC to sugars are (Fig 3.1) (i) endoglucanases or 1,4-β-D-glucan-4-glucanohydrolases (EC 3.2.1.4), (ii) exoglucanases, including 1,4-β-D-glucan glucanohydrolases (also known as cellodextrinases) (EC 3.2.1.74) and 1,4-β-Dglucan cellobiohydrolases (cellobiohydrolases) (EC 3.2.1.91), and (iii) β-glucosidases (EC3.2.1.21). Endoglucanases randomly cut the sugar polymer at internal amorphous sites, generating oligosaccharides of various lengths; exoglucanases act in a processive manner on the reducing or nonreducing ends of the polysaccharide chains, liberating either glucose or cellobiose as major products. β-Glucosidases hydrolyze soluble cellodextrins and cellobiose to glucose. One of the bottlenecks of LC deconstruction is the availability of enzymes that are stable and compatible with the biomass pretreatment methods like dilute acid pretreatment. Secondly, the industrial use of enzymes is limited by lack of stability (activity, half–life) under extremophilic conditions as most of the mesophilic enzymes are not well suited for harsh reaction conditions due to the lack of structural stability, which limits their use in industry. Thus for the commercial exploitation of proteinsin LC deconstruvction, our strategy revolves around using enzyme isolated from extremophilic organisms like CelA from Alicyclobacillus acidocaldarius. We are using the endoglucanase CelA from Alicyclobacillus acidocaldarius for LC breakdown strategy. The strictly aerobic, thermoacidophilic gram-positive bacterium A. acidocaldarius grows best at 60 oC and pH 3–4. The organism can utilize a variety of polysaccharides as sole sources of carbon and energy, including starch and carboxy methyl cellulose (CMC). The enzyme that breaks down cellulose in A. aciodcaldarius- CelA- has been isolated and characterized. The recombinant enzyme has a temperature optimum of 70 oC and a pH optimum of 5.5. It contains one zinc and two calcium atoms, which are likely important for temperature stability. The enzyme is most active against substrates containing β-1,4-linked glucans (lichenan and carboxy methyl cellulose), but also exhibits activity against oat spelt xylan. However, the activity of the enzyme is low compared to the industrial standard enzymes like those from fungi (T. reesei, A. niger). Thus, we want to improve the catalytic activity of the enzyme so that the process economics can be improved for the cellulosic biomass deconstruction using enzyme engineering. Enzymes are protein biocatalysts that have evolved through biological evolution over several million years to achieve their characteristics. These biomolecules display extraordinary specificity and catalytic power, which can be used in industrial chemical reactions. The specificity of the enzymes reduces by-product formation and thereby enables a more process-
20
oriented operation as compared to chemical catalysis that can result in additional steps for the removal of unwanted side reactions. However, one drawback of enzymatic processes that since these enzymes are adjusted perfectly to their physiological role in the host organism, the activity and stability of naturally occurring enzymes is often much lower than that required for an economically feasible process as required in industrial processes like biofuels production. This is true for the stability of enzymes in organic solvents and certain other reactions requiring high selectivity and, finally yielding industrially important compounds like monomeric sugars from cellulose and hemicellulose. Nature has devised a method of screening and selecting for a better enzyme- natural evolution- i.e. it produces a large number of variants through natural mutation and selection of the ‘fittest’ variant for the host organism. Using techniques such as mutation and recombination and subsequent selection of a better variant by conducting in vitro enzyme assays, a similar process as natural selection for mutation can be carried out in vitro. ‘Directed evolution’, defined as directed development of the enzyme for a characteristic of interest, has resulted in the development of enzymes with improved properties for established applications and production of new enzymes tailor-made for novel applications. A directed evolution approach starts with the identification of a target enzyme to be optimized, cloning the gene into an efficient expression system (Figure 3.1). A mutant enzyme library is the created by subjecting the gene to random mutagenesis and/or in vitro recombination, thereby creating molecular diversity, i.e. mutant variants of the gene. The improved enzyme variants are identified by screening or selection for the desired property using a developed and optimized enzyme assay. The inferior enzymes and genes are discarded and genes encoding the improved enzymes are then used as ‘parent’ for the next round of directed evolution, repeating the whole process as often as necessary. Thus, directed evolution is an iterative process of creating ‘mutant libraries’ and then screening these libraries for the function or feature of interest in the improvement of the enzyme function (Figure 3.1) and is a generic term that describes the direction of improvement of the enzymes through screening methods. The collections of such methods provide a powerful tool for improving the properties and characteristics of enzymes as well as the development of enzymes with novel properties, without requiring extensive knowledge of enzyme structures or catalytic mechanism. In biotech industry, directed evolution has emerged as a key technology to generate enzymes with new or improved properties and has been used to evolve enzymes with altered properties such as substrate specificity, organic solvent, thermostability, catalytic activity and enantioselectivity. One of the advantages of directed evolution of enzymes over rational designed methods is that functional properties can be evolved without extensive knowledge and details of the target protein; the sequence space of the protein also limits the rational approaches over a small period of time. Directed evolution experiments allow for the efficient exploration of the sequence space through random mutagenesis by achieving molecular diversity in a library of mutagenized genes and selected for by specific assays. Random mutagenesis using techniques like error-prone PCR (ePCR) is a powerful tool for modifying proteins to improve their characteristics. Error prone PCR is a random mutagenesis technique for generating amino acid substitutions in proteins by introducing mutations into a gene during PCR. This technique exploits the fact that the thermostable polymerase used lacks proofreading activity, for example Thermus aquaticus (Taq) polymerase incorporates wrong

21
nucleotides at a frequency of 0.1x10⁻⁴ to 2x10⁻⁴ per nucleotide per round of extension of new DNA strand. Several protocols have been developed for increasing the error rate of Taq polymerase- increasing the concentration of MgCl2, addition of MnCl2, using non-soichiometric concentrations of nucleotides, using a mixture of triphosphate nucleoside analogs or a combination of all these to achieve higher rates of mutations.

22
3.2 Materials and Methods 3.2.1 Enzyme assays. We used several different enzyme assays for measuring the activity of the engineered cellulases: Carboxymethyl cellulose Congo red assay: Also called the zone clearing assay. The lysed cell exttact is assayed using the procedure outlined. 10 ul of a 20x supernatant or 2 ul of 1x lysate was spotted onto an LB agar (1.5% w/v agar) plate containing 0.1% CMC. The plate was tehn incubated at 55ºC for 1 h. The plate was washed with 70% ethanol to precipitate the CMC. The wased plate was then incubated with 1% solution of Congo red dye (Sigma, St. Louis, MO) in water for 1 h at room temperature with rocking. The plate was then rinsed briefly with 1 M NaCl and incubated with 1 M NaCl for 1 h at room temperature with rocking. The rinse and incubate steps with NaCl were repeated for color development. The picture of the plate is taken for analysis of the zone of clearance for correlation of the cleared zone with activity. Tetrazolium blue reducing ends assay: This enzyme assay is adapted from Jue and Lipke (1984). Tetrazolim blue buffer was prepared by dissolving 0.1% tetrazolium blue dye, 0.05 M NaOH, and 0.5 M sodium potassium tartrate (Rochelle salts) in filter sterilized water. The enzyme assay mix was prepared by mixing equal volumes of 1x lysate and 750 uM sodium acetate (pH 6) containing .4% CMC (150 ul). The assay mixture was incubated in 60ºC water bath for 1 h, with occasional flicking of tube to mix. 40 ul cellulase/CMC sample and 4 ml tetrazolium blue buffer was added to a 16x100 mm borosilicate glass disposable culture tube. The sample was boiled in a beaker of water at rolling boil for 3 minutes exactly. The glass tube was moved to ice water bath and left for 1 minute to stop reaction. The absorbance was measured at 660 nm. The standards were run alongside the assay vials; typically 0, 5, 10, 15, 20, and 25 ug glucose samples (always 40 ul volume, with 4 ml of tetrazolium blue buffer, to ensure same conditions) were done in triplicate. DNS reducing ends assay: This assay has been modified from Wood and Bhat (1988). Briedfly, equal volumes of 1x lysate and 750 uM sodium acetate (pH 6) containing .4% CMC were mixed and incubate at 60ºC water bath for 1 h, with occasional flicking of tube to mix. In triplicate, 150 ul cellulase/CMC sample, 100 ul 1 mg/ml glucose, 750 ul 1xPBS, and 3 ml DNS reagent were added to a 16x100 mm borosilicate glass disposable culture tube. The samples were boiled in beaker of water at rolling boil for 3 minutes exactly. The assay tube was then moved to ice water bath to stop the reaction and the absorbance of the assay was measured at 540 nm. Note: Always run a standard curve alongside samples; typically I run 100, 150, 200, 250, and 300 ug glucose samples (always x volume of 1 mg/ml gluocse plus appropriate amount of 1xPBS to reach 1 ml total; eg 150 ul 1 mg/ml glucose and 850 ul 1xPBS for 150 ug standard). Again done in triplicate. This assay can be modified for microplate assays by reducing the volumes accordingly. Nelson-Somogyi Microplate Assay. The microassay for reducing sugars was modified from the original Nelson-Somogyi assay (5,6). 25 µl of sample and 25 µl of appropriate CMC was solubilized in 0.1 M citrate buffer (pH 5.0) in a 96-well microplate. The plate was then covered with an acetate adhesive sheet and incubated at 60°C for 24 h. After overnight incubation, 75 µl of Somogyi copper reagent was added to each well, and the plate was resealed with the acetate
23
sheet. The plate was then incubated at 80°C for 30 min in a water bath. After cooling the plate for 15 min, 75 µl of arsenomolybdate was added to each well and the resulting solution was mixed on a vortex mixer. The resulting color was measured using using reflectance at 500 nm with a Shimadzu2 dual-wavelength densitometer (Shimadzu, Columbia, MD). Glucose was used to prepare the standard curve with concentrations ranging from 100 to 2000 µg/ml. 3.2.2. Cloning for HTP analysis. Cloning experiments were carried out with wild type CelA. CelA was cloned into pET-101-D/TOPO (Invitrogen, Carlsbad, CA) according to manufacturer’s recommendations. Directional TOPO® was used to clone blunt-ended CelA PCR products in a 5´→3´ orientation directly into a pET-101 expression vector. The PCR primers were designed with a CACC overhang on the 5´ end and a blunt end on the 3´ end. pET Directional TOPO vectors were used cloning for E. coli expression so that we could try to use the highly efficient T7 RNA polymerase to achieve strong transcription levels and high protein yields using auto-inducible media. T7 RNA polymerase is expressed by host E. coli under the control of the IPTG-inducible lacUV5 promoter and the auto-inducible media can be used for expression without having to measure OD of the growth media. The additional lacO element found in the T7 lac promoter used in the pET vectors allows for the reduced basal expression levels while enabling strong transcriptional activity upon induction with IPTG. Auto-inducible media (Novagen) was used to express proteins from pET-101 vector. 3.2.3. Protein expression. Two different expression systems were tested for protein expression. The Overnight Express Autoinduction Systems (EMD Biosciences) was used for the the regulated expression of CelA clone in the pET-101-TOPO expression vector. Auto-induction media enables the regulated protein expression in E. coli without the need to monitor the culture or add inducer like IPTG during cell growth. Second expression analysis was done in Top10 cells (Invitrogen), the same E. coli strain that is used for cloning of gene. The Top10 competent cells were transformed with pBAD-HisA-CelA clones and induction of protein expression was initiated by the addition of 0.02% (w/v) of arabinose. 3.2.4. ePCR protocols: The mutational frequency of the PCR reaction was controlled by varying the amount of starting DNA in the reaction and using the GeneMorph II Domain Mutagenesis Kit (Stratagene-Agilent). For low frequency mutations, 500ng of the template DNA was used, for medium frequency mutations, 100 ng of the template DNA was used and for high frequency mutations, 10 ng of the template DNA was used. Briefly, the target amount of DNA was chose to make mutations in the low, medium and high frequency range. PCR reaction for 50-µl reactions contained 41.5 µl of water, 5 µl of 10x Mutazyme II reaction buffer, 1 µl of 40 mM dNTP mix (200 µM each final), 0.5 µl of primer mix (250 ng/µl of each primer), 1 µl of Mutazyme II DNA polymerase (2.5 U/µl), 1 µl template DNA. The reaction mix was centrifuged briefly. Standard PCR program was used for with the following steps: Denaturation- 95°C for 2 minutes. PCR 1 cycle, 95°C 1 minute, Primer Annealing 60°C for 1 minute, Extension at 72°C 1 minute for 3 minutes (1 minute/kb); repeat for 30 cycles and a final polishing step at 72°C at 10 minutes. The PCR products were quantitated using picogreen reagent (Invitrogen) and the products were separted on a 1% agarose gel. Estimate the PCR product yield by comparing the intensities of the PCR product bands with the 1.1-kb gel standard. It was noted that the expected mutation frequencies are typically achieve when the PCR yield of a 10-µl sample is between 100 ng and 2 µg, which corresponds to a yield of between 500 ng and

24
10 µg for a 50-µl reaction. The PCR product is now ready to be cloned into an expression vector and introduced into competent cells according to appropriate protocols. 3.2.5 Cloning of the Mutant Library into the pBAD vector. The PCR products from the error prone PCR reaction in the previous step were used for ‘mega-primer PCR’ to amplify the whole plasmid. This steps avoids the use of restriction digestion for cloning the PCR product into the vector. The plasmid DNA template used in the cloning reaction was the same as the original plasmid DNA used as template in the mutant megaprimer synthesis reaction. Briefly, the mega-primer PCR was set as follows: In a thin walled PCR tube, 25 µl of the 2x EZClone enzyme mix was added followed by 50 ng of template plasmid, 500 ng for megaprimer (PCR products from the previous step), 3 µl of EZClone solution and ddH2O to a final volume of 50 µl. Cycling parameters for the megaprimer PCR were Denaturation at 95°C for 1 minute; main program- per cycle: 95°C for 50 seconds, 60°C for 50 seconds, 68°C for 11 min (2 minute/kb of plasmid length) for a total of 25 cycles. Place the reaction on ice for 5 minutes to stop the reaction. 3.2.6 DpnI digestion of the PCR products: Dpn I restriction enzyme digestion of the PCR products was carried out by adding 1 µl of Dpn I restriction enzyme (10 U/µl) directly to each amplification reaction. The reaction was mixed gently and by pipetting the solution up and down several times. The reaction tube was spun down in a microcentrifuge for 1 minute and incubated immediately at 37°C for 2 hours to digest the parental (i.e., the nonmutated) supercoiled dsDNA.
3.2.7 DNA sequencing. DNA sequencing was used to confirm the sequence of the construct as well as randomly sampled clones from the mutagenesis reaction.
25
3.3 Results and Discussion 3.3.1 Random Mutagenesis Analysis of the Frequency of Mutations. The GeneMorph II (Strategene Agilent) kit was used for selecting the frequency of mutation most appropriate for a directed evolution of cellulases. For analyzing protein structure-function relationships, a low mutation frequency of ~ one amino acid change (1–2 nucleotide changes) per gene is desired. However, in directed evolution studies, mutation frequencies of 1–4 amino acid changes (2–7 nucleotide changes) per gene are commonly employed. One of the drawbacks of the Taq polymerase is that ther is distinct mutational bias exhibited by the enzyme and this bias skews representation of random mutant libraries, diminishing the effective size of the collection produced by error prone PCR. Thus, Mutazyme II DNA polymerase from Strategene was used since it is a novel error prone PCR enzyme blend that provides minimal mutational bias. Therefore, libraries created with Mutazyme II should exhibit greater mutant representation compared to libraries generated with other enzymes. In this reaction, the desired mutation rate can be controlled simply by varying the initial amount of target DNA in the reaction or the number of amplification cycles performed. The gel with low, medium and high mutation rates PCR products is shown in Fig 3.6. 3.3.2 Selection of enzyme assays. We conducted enzyme assays for all four major enzyme assays sued for quantitating cellulase activity- congo Red assay, azo-CMC assay, tetrazolium blue assay, DNS assay and nelson-somogyi assay. While congo red and tetrazolium blue assays were rules out because of the inherent problems with the assays- Congo red assays are very qualitative and the growth media was found to contain interfering substances that did not make using tetrazolium blue assays feasible. The remaining three assays were used for quantitating the activity in a 96-well plate assay since 96 –well plate format is used for the expression of ‘picked colonies’. AS shown in Fig 3.2, 3.3 and 3.4, Azo-CMC assay (Fig 2) was found to have the most error of the three assays (Fig 3- DNS assay; Fig 4: Nelson Somogyi assay). The assay was seen to have a well-to-well variation that could not be traced to the protein expression as the enzyme assays were carried out using the WT protein expression in all the 96 wells of the plate. The SD of the assay was > 25% and thus would not be useful for incremental improvement of the proteins. Nelson-somogyi assay was also found to have a large error and well-to-well variation. DNS assay, on the other hand, was found to be the most reproducible and also showed the least SD of the enzyme assays (SD <10%). The one disadvantage of the DNS assay has been the low color development as measured by the absorbance at the specific wavelength. Based on the activity analysis and well-to-well variation of enzyme activity as measure in 96 well plates, DNS assay was chosen as the assay for high-throughput analysis of enzyme activity. 3.3.3 Protein Expression in 96 well plates. One of the central problems with quantitating enzyme activity in 96 well plates is that the activity has to be attributable to the proteins and not to the differential expression of the protein in the different 96 well plates. We thus used expression of the wild-type protein in all of the 96 wells to gauge the variability in the protein expression levels. Protein expression was quantitated by measuring the amount of the protein produced as visually seen on a protein SDS-PAGE gel and quantitated by densitometric analysis. While we did not run a protein gel on all the wells, a random sampling of the wells was used to gauge the protein expression. Fig 3.5a and 3.5b shows the coomassie stained gel of a randome sampling of wells in a 96 well plate. As seen from the figure, protein expression does not vary

26
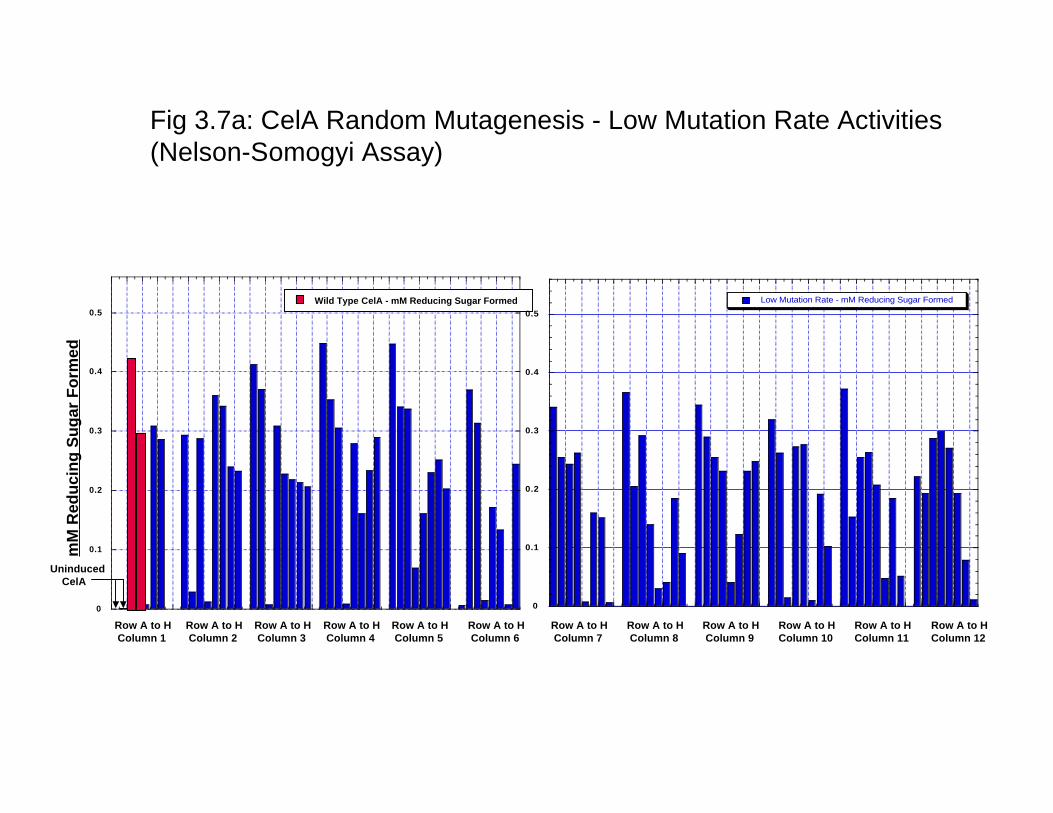
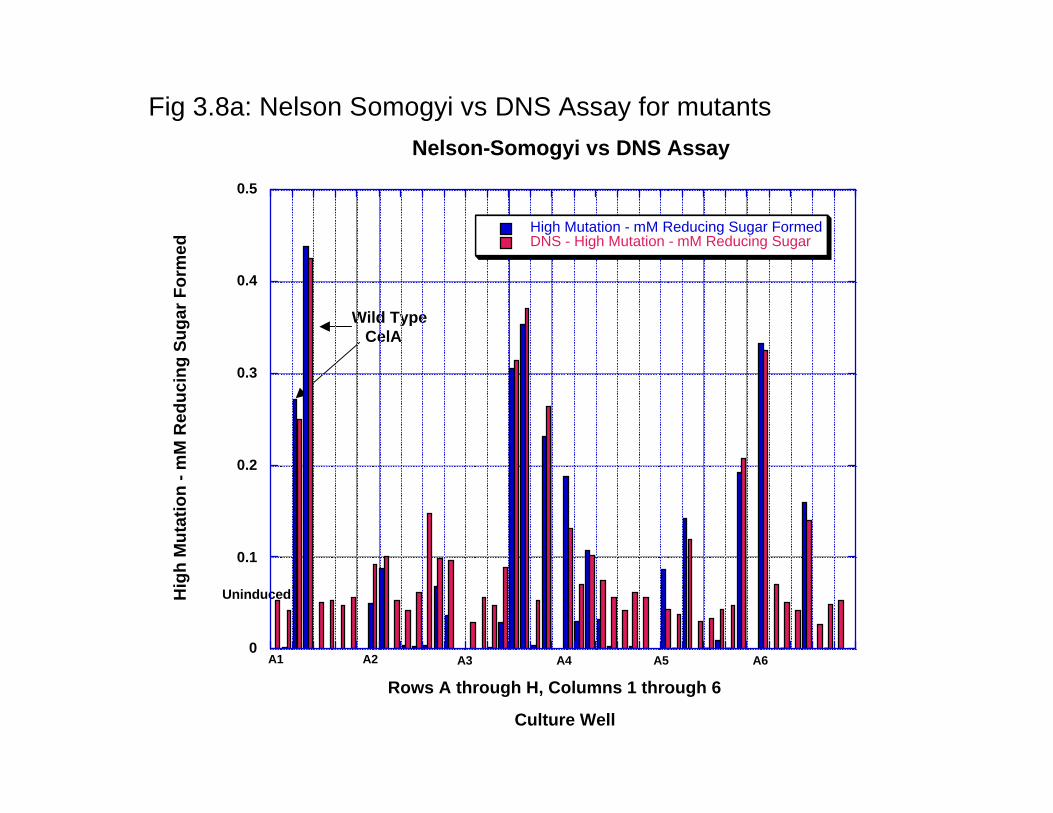
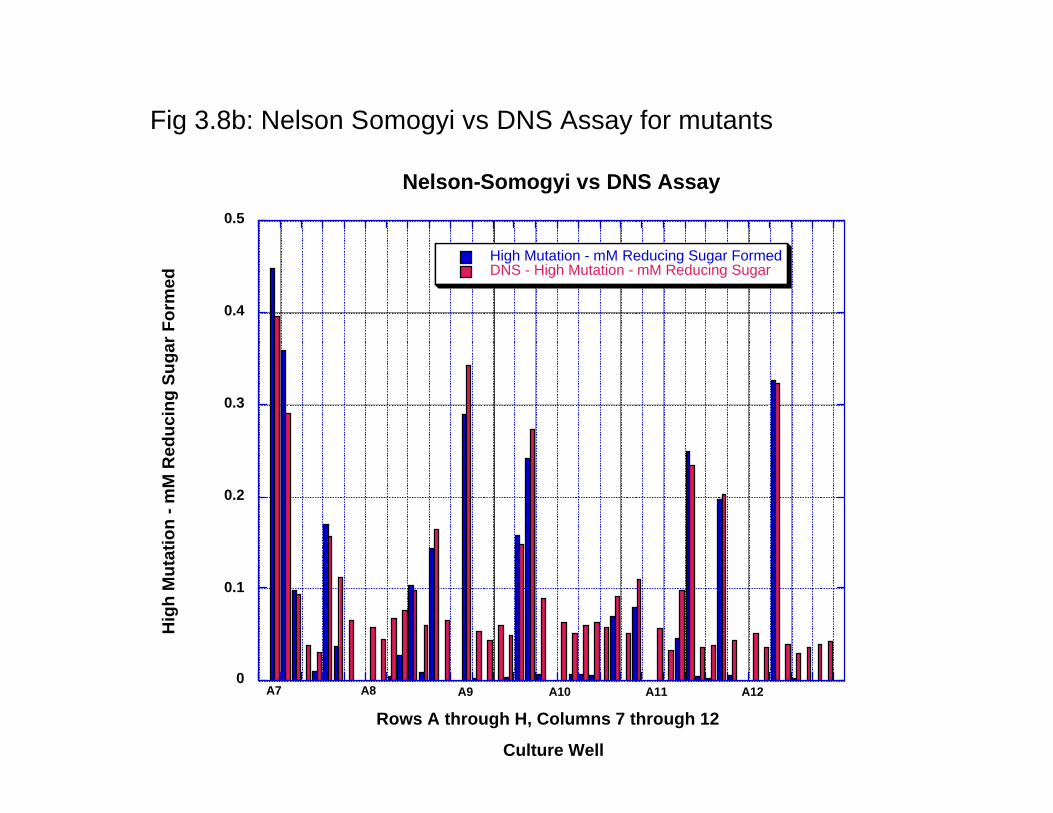
dramatically between the wells towards the interior of the plate with the wells towards the outside of the plate. The maximum variation that can be measured is < 10% as quantitated by densitometric analysis of the stained protein gel. Thus, the 96 well plate based expression of the enzyme can be used for the HTP protein production and evaluation of activity. Furthermore, these results and variation in activity was compared with protein expression in 24 well plates that can be used for growing cell cultures up to 5 ml. The reason being that a larger culture would lead to less variation in protein expression. The results (data not shown) clearly indicate that protein expression variability is not comparable to that seen in 96 well plates and, thus, there is no advantage in using larger cultures for quantitation of activity. 3.3.4 Surveying and selecting mutation rates for CelA. Before the start of a protein engineering experiment using error-prone PCR, the mutation rate that best suits the experiment has to be figured out. We conducted three different experiments with three different error rates- low, defined as 1-4 mutated bases/kb of the gene medium, defined as 4-9 mutated bases/ kb of the gene and high, defined as 9-16 mutated bases/kb of the gene- were surveyed to define the error rate for analysis. As shown in Fig 3.7a, low error rates resulted in at least 30% of the enzyme variants that are within +/- 20% of the wild type enzyme activity. In a similar comparison of the wild type with enzyme variants resulting from medium error rates resulted in <15% of the proteins that are within +/-20% of the wild type enzyme activity (Fig 3.7b). In comparison, the high mutation rate resulted in almost all the enzymes to be less than the wild type enzyme and the vast majority (~90%) were found to have < 30% of the wild type activity (Fig 3.7c). It can thus be concluded that the low mutation rate would be the most suitable error rate to direct the evolution of the enzyme for higher catalytic activity. 3.3.5 Comaprison of the low error library using two different enzyme assays. As mentioned earlier, DNS assay were routinely found to be the most reproducible enzyme assay. However, the wild type CelA activity was characterized using the Nelson-Somogyi assay; we thus compared the activity of the activity of the two enzyme assays. WE thus compared the variants generated from the low error rate library using both the DNS and the Nelson-Somogyi assays. As seen in Fig 3.8a and Fig 3.8b, DNS assay and the Nelson-Somogyi assay were found to have a high degree of correlation at the higher end of the enzyme activity. However, the correlation is poor when the enzyme activity is much lower than the wild type. These experiments show that while either of the enzyme assays can be used for reliable quantitation of the enzyme activity, there are limits to the sensitivity of the enzyme assays. Furthermore, we can also say with a high degree of confidence that enzyme activities calculated with these two different assays are comparably similar. 3.4 Conclusion In conclusion, we have carried out the foundational experiments for directed evolution experiments- we have optimized enzyme assays for 96 well plate format, protein expression in 96-well plate format and selected the error rate that is best suited for generating mutant libraries for the catalytic improvement of CelA.
27
4.0 REFERENCES 1. Courtinho, P.M. and B. Henrissat, Carbohydrate-active enzymes: an integrated database
approach, in Recent Advances in Carbohydrate Bioengineering, G.D. H.J. Gilbert, B. Henrissat and B. Svensson Editor. 1999, The Royal Society of Chemistry: Cambridge. p. 3-12.
2. Vasella, A., G.J. Davies, and M. Bohm, Glycosidase mechanisms. Curr Opin Chem Biol, 2002. 6(5): p. 619-29.
3. McCarter, J.D. and G. Stephen Withers, Mechanisms of enzymatic glycoside hydrolysis. Current Opinion in Structural Biology, 1994. 4(6): p. 885-892.
4. Berman, H.M., et al., The Protein Data Bank. Nucleic Acids Res, 2000. 28(1): p. 235-42. 5. Crennell, S.J., et al., Dimerisation and an increase in active site aromatic groups as
adaptations to high temperatures: X-ray solution scattering and substrate-bound crystal structures of Rhodothermus marinus endoglucanase Cel12A. J Mol Biol, 2006. 356(1): p. 57-71.
6. Sulzenbacher, G., et al., The Streptomyces lividans family 12 endoglucanase: construction of the catalytic cre, expression, and X-ray structure at 1.75 A resolution. Biochemistry, 1997. 36(51): p. 16032-9.
7. Sandgren, M., et al., The Humicola grisea Cel12A enzyme structure at 1.2 A resolution and the impact of its free cysteine residues on thermal stability. Protein Sci, 2003. 12(12): p. 2782-93.
8. Khademi, S., et al., Determination of the structure of an endoglucanase from Aspergillus niger and its mode of inhibition by palladium chloride. Acta Crystallogr D Biol Crystallogr, 2002. 58(Pt 4): p. 660-7.
9. Sandgren, M., et al., The X-ray crystal structure of the Trichoderma reesei family 12 endoglucanase 3, Cel12A, at 1.9 A resolution. J Mol Biol, 2001. 308(2): p. 295-310.
10. Sandgren, M., et al., Comparison of family 12 glycoside hydrolases and recruited substitutions important for thermal stability. Protein Sci, 2003. 12(4): p. 848-60.
11. Sakon, J., et al., Structure and mechanism of endo/exocellulase E4 from Thermomonospora fusca. Nat Struct Biol, 1997. 4(10): p. 810-8.
12. Khademi, S., et al., Structure of an endoglucanase from termite, Nasutitermes takasagoensis. Acta Crystallographica Section D, 2002. 58(4): p. 653-659.
13. Mandelman, D., et al., X-Ray crystal structure of the multidomain endoglucanase Cel9G from Clostridium cellulolyticum complexed with natural and synthetic cello-oligosaccharides. J Bacteriol, 2003. 185(14): p. 4127-35.
14. Parsiegla, G., et al., Crystal structure of the cellulase Cel9M enlightens structure/function relationships of the variable catalytic modules in glycoside hydrolases. Biochemistry, 2002. 41(37): p. 11134-42.
15. Schubot, F.D., et al., Structural Basis for the Exocellulase Activity of the Cellobiohydrolase CbhA from <i>Clostridium thermocellum</i>. Biochemistry, 2004. 43(5): p. 1163-1170.
16. Karplus, K., C. Barrett, and R. Hughey, Hidden Markov models for detecting remote protein homologies. Bioinformatics, 1998. 14(10): p. 846-56.
17. Altschul, S.F., et al., Basic local alignment search tool. J Mol Biol, 1990. 215(3): p. 403-10. 18. Altschul, S.F., et al., Gapped BLAST and PSI-BLAST: a new generation of protein database
search programs. Nucleic Acids Res, 1997. 25(17): p. 3389-402. 19. Larkin, M.A., et al., Clustal W and Clustal X version 2.0. Bioinformatics, 2007. 23(21): p.
2947-8. 20. Bower, M.J., F.E. Cohen, and R.L. Dunbrack, Jr., Prediction of protein side-chain rotamers
from a backbone-dependent rotamer library: a new homology modeling tool. J Mol Biol, 1997. 267(5): p. 1268-82.
21. Canutescu, A.A., A.A. Shelenkov, and R.L. Dunbrack, Jr., A graph-theory algorithm for rapid protein side-chain prediction. Protein Sci, 2003. 12(9): p. 2001-14.
22. Zemla, A., et al., AS2TS system for protein structure modeling and analysis. Nucleic Acids Res, 2005. 33(Web Server issue): p. W111-5.
23. Lambert, C., et al., ESyPred3D: Prediction of proteins 3D structures. Bioinformatics, 2002. 18(9): p. 1250-6.
24. Bates, P.A., et al., Enhancement of protein modeling by human intervention in applying the automatic programs 3D-JIGSAW and 3D-PSSM. Proteins, 2001. Suppl 5: p. 39-46.

28
25. Chivian, D., et al., Prediction of CASP6 structures using automated Robetta protocols. Proteins, 2005. 61 Suppl 7: p. 157-66.
26. Lund, O., et al., CPHmodels 2.0: X3M a Computer Program to Extract 3D Models., in Abstract at the CASP5 conference A102. 2002.
27. Combet, C., et al., Geno3D: automatic comparative molecular modelling of protein. Bioinformatics, 2002. 18(1): p. 213-4.
28. Arnold, K., et al., The SWISS-MODEL workspace: a web-based environment for protein structure homology modelling. Bioinformatics, 2006. 22(2): p. 195-201.
29. Sandgren, M., J. Stahlberg, and C. Mitchinson, Structural and biochemical studies of GH family 12 cellulases: improved thermal stability, and ligand complexes. Prog Biophys Mol Biol, 2005. 89(3): p. 246-91.
30. Petrey, D., et al., Using multiple structure alignments, fast model building, and energetic analysis in fold recognition and homology modeling. Proteins, 2003. 53 Suppl 6: p. 430-5.
31. Wallner, B. and A. Elofsson, All are not equal: A benchmark of different homology modeling programs. Protein Sci, 2005. 14(5): p. 1315-1327.
32. Jaroszewski, L., L. Rychlewski, and A. Godzik, Improving the quality of twilight-zone alignments. Protein Sci, 2000. 9(8): p. 1487-96.
33. Jaroszewski, L., et al., FFAS03: a server for profile--profile sequence alignments. Nucleic Acids Res, 2005. 33(Web Server issue): p. W284-8.
34. Rychlewski, L., et al., Comparison of sequence profiles. Strategies for structural predictions using sequence information. Protein Sci, 2000. 9(2): p. 232-41.
35. Karplus, K., et al., What is the value added by human intervention in protein structure prediction? Proteins, 2001. Suppl 5: p. 86-91.
36. Karplus, K., et al., Combining local-structure, fold-recognition, and new fold methods for protein structure prediction. Proteins, 2003. 53 Suppl 6: p. 491-6.
37. Karplus, K., et al., SAM-T04: what is new in protein-structure prediction for CASP6. Proteins, 2005. 61 Suppl 7: p. 135-42.
38. Rychlewski, L. and D. Fischer, LiveBench-8: the large-scale, continuous assessment of automated protein structure prediction. Protein Sci, 2005. 14(1): p. 240-5.
39. Zemla, A., LGA: A method for finding 3D similarities in protein structures. Nucleic Acids Res, 2003. 31(13): p. 3370-4.
40. Bowie, J.U., R. Luthy, and D. Eisenberg, A method to identify protein sequences that fold into a known three-dimensional structure. Science, 1991. 253(5016): p. 164-70.
41. Luthy, R., J.U. Bowie, and D. Eisenberg, Assessment of protein models with three-dimensional profiles. Nature, 1992. 356(6364): p. 83-5.
42. Wallner, B. and A. Elofsson, Can correct protein models be identified? Protein Sci, 2003. 12(5): p. 1073-86.
43. Li, H., A.D. Robertson, and J.H. Jensen, Very fast empirical prediction and rationalization of protein pKa values. Proteins, 2005. 61(4): p. 704-21.
44. Bas, D.C., D.M. Rogers, and J.H. Jensen, Very fast prediction and rationalization of pK(a) values for protein-ligand complexes. Proteins, 2008.
45. ZAP toolkit, Openeye Software: Santa Fe, NM. 46. J. Andrew Grant, B.T.P.A.N., A smooth permittivity function for Poisson-Boltzmann solvation
methods. Journal of Computational Chemistry, 2001. 22(6): p. 608-640. 47. Roe, D.C., PEngineer, Sandia National Labs: Livermore, CA. 48. Kongsted, J., et al., Prediction and rationalization of the pH dependence of the activity and
stability of family 11 xylanases. Biochemistry, 2007. 46(47): p. 13581-92. 49. Davies, M.N., et al., Benchmarking pK(a) prediction. BMC Biochem, 2006. 7: p. 18.

Fig 3.1: Experimental strategy for the directed evolution of enzymes
Enzyme
Enzyme Class/Family
Library
Library
Screening
Screening
Select Variants(based on fitness)BioinformaticsRational
Design(?)
LibraryGene Discovery Sequencing
- DNA Shuffling
- Family Shuffling
- Random Mutagenesis
- Saturation Mutagenesis
- Sequence Alignments
- Structural Analysis
1. Extremophiles2. Rainforest Communities3. Database (Pubmed/ Brenda/ CaZy)
1. Cellulases2. Hemicellulases3. Ligninases
1. HTP Robotics2. Chips3. Microfluidics
1. HTP Robotics2. Chips3. Microfluidics
1. Cellulases2. Hemicellulases3. Ligninases
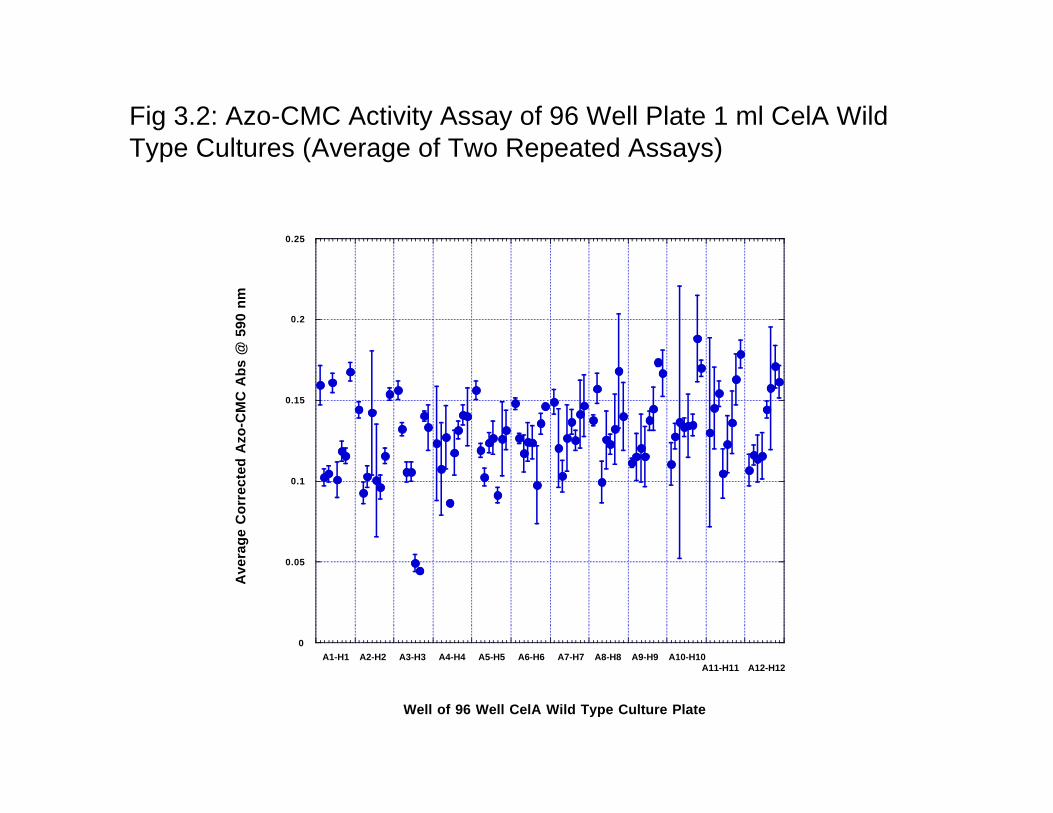
Fig 3.2: Azo-CMC Activity Assay of 96 Well Plate 1 ml CelA WildType Cultures (Average of Two Repeated Assays)
0
0.05
0.1
0.15
0.2
0.25Av
erag
e Co
rrec
ted
Azo-
CMC
Abs
@ 5
90 n
m
Well of 96 Well CelA Wild Type Culture Plate
A1-H1 A2-H2 A3-H3 A4-H4 A5-H5 A6-H6 A7-H7 A8-H8 A9-H9 A10-H10 A11-H11 A12-H12
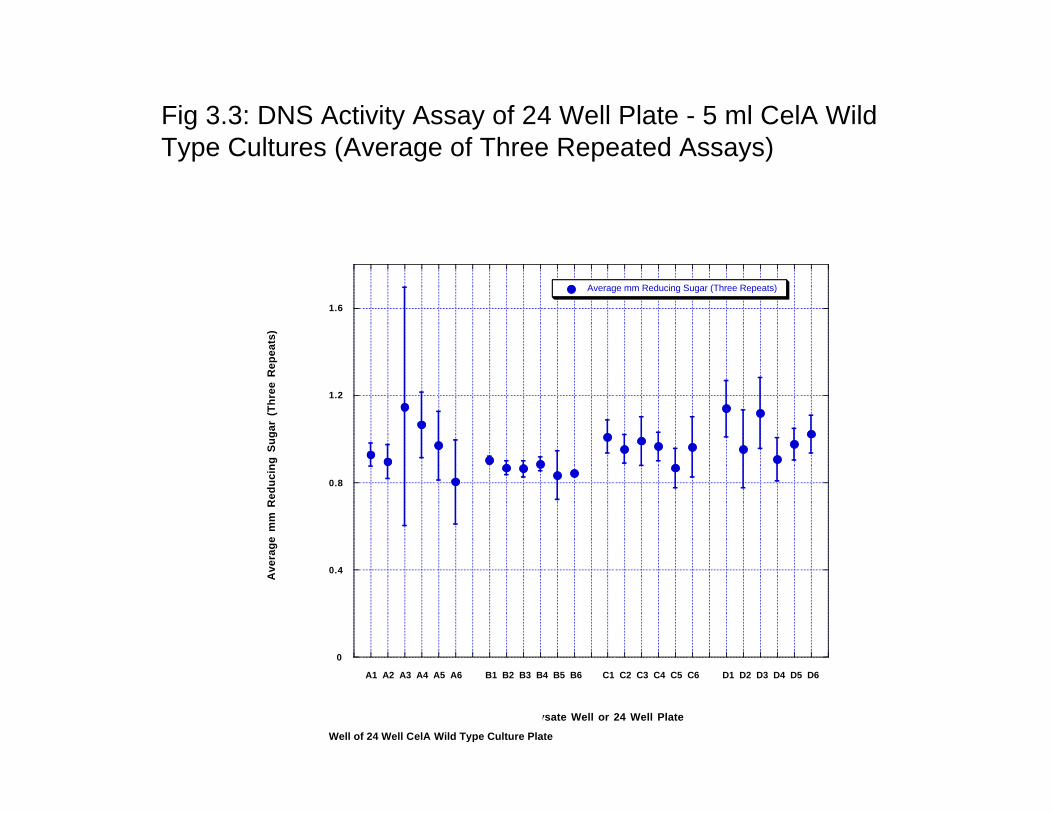
Fig 3.3: DNS Activity Assay of 24 Well Plate - 5 ml CelA WildType Cultures (Average of Three Repeated Assays)
0
0.4
0.8
1.2
1.6
Average mm Reducing Sugar (Three Repeats)
Ave
rage
mm
Red
ucin
g Su
gar
(Thr
ee R
epea
ts)
Cell Lysate Well or 24 Well Plate
A1 A2 A3 A4 A5 A6 B1 B2 B3 B4 B5 B6 C1 C2 C3 C4 C5 C6 D1 D2 D3 D4 D5 D6
Well of 24 Well CelA Wild Type Culture Plate

Fig 3.4: Nelson-Somogyi Activity Assay of 96 Well Plate 1 ml CelAMedium Mutation Cultures (Average of Two Repeated Assays)
0
0.05
0.1
0.15
0.2
0.25
0.3Av
erag
e m
M R
educ
ing
Suga
r (T
wo
Repe
ats)
Med
ium
Mut
atio
n R
ate
-96
Wel
l Cul
ture
Pla
te
Well of 96 Well Medium Mutation Rate Culture Plate
A1-H1 A2-H2 A3-H3 A4-H4 A5-H5 A6-H6 A7-H7 A8-H8 A9-H9 A10-H10 A11-H11 A12-H12
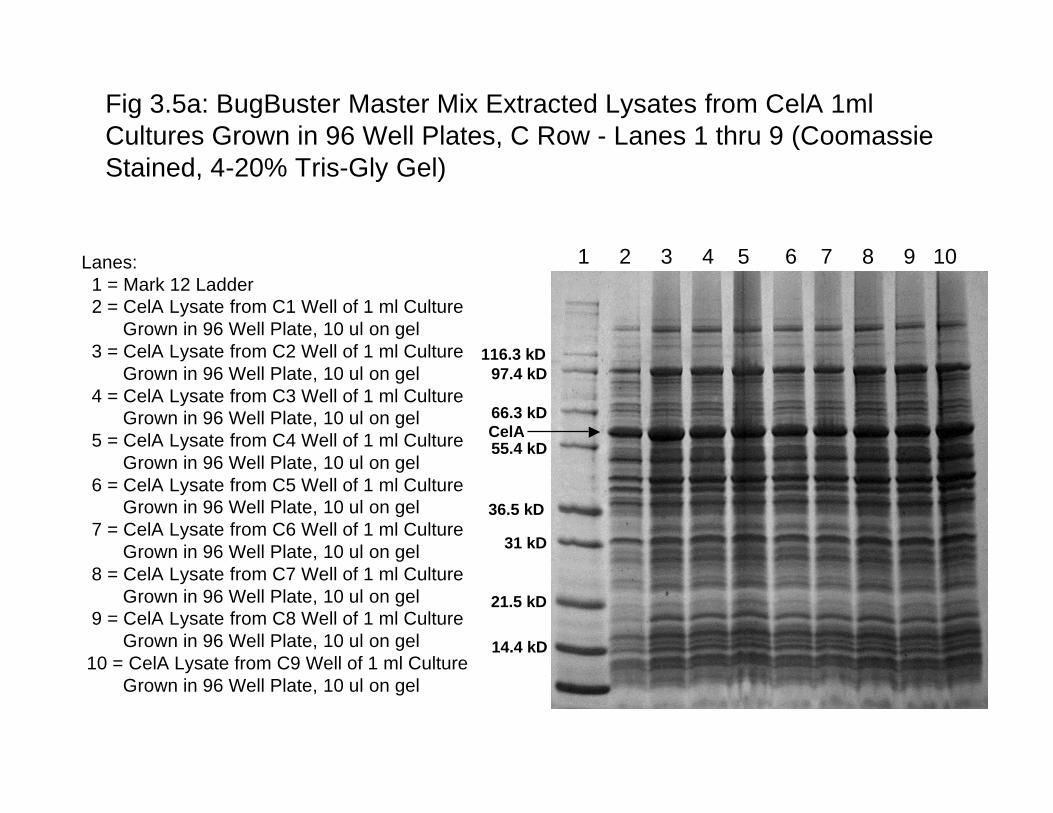
Fig 3.5a: BugBuster Master Mix Extracted Lysates from CelA 1mlCultures Grown in 96 Well Plates, C Row - Lanes 1 thru 9 (CoomassieStained, 4-20% Tris-Gly Gel)
Lanes:
1 = Mark 12 Ladder 2 = CelA Lysate from C1 Well of 1 ml Culture
Grown in 96 Well Plate, 10 ul on gel
3 = CelA Lysate from C2 Well of 1 ml Culture
Grown in 96 Well Plate, 10 ul on gel
4 = CelA Lysate from C3 Well of 1 ml Culture Grown in 96 Well Plate, 10 ul on gel
5 = CelA Lysate from C4 Well of 1 ml Culture
Grown in 96 Well Plate, 10 ul on gel
6 = CelA Lysate from C5 Well of 1 ml Culture Grown in 96 Well Plate, 10 ul on gel
7 = CelA Lysate from C6 Well of 1 ml Culture
Grown in 96 Well Plate, 10 ul on gel
8 = CelA Lysate from C7 Well of 1 ml Culture
Grown in 96 Well Plate, 10 ul on gel 9 = CelA Lysate from C8 Well of 1 ml Culture
Grown in 96 Well Plate, 10 ul on gel
10 = CelA Lysate from C9 Well of 1 ml Culture
Grown in 96 Well Plate, 10 ul on gel
1 2 3 4 5 6 7 8 9 10
116.3 kD
66.3 kD
55.4 kD
36.5 kD
31 kD
14.4 kD
21.5 kD
97.4 kD
CelA

Fig 3.5b: BugBuster Master Mix Extracted Lysates from CelA 1mlCultures Grown in 96 Well Plates, G Row - Lanes 1 thru 9 (CoomassieStained, 4-20% Tris-Gly Gel)
Lanes:
1 = CelA Lysate from G1 Well of 1 ml Culture Grown in 96 Well Plate, 10 ul on gel
2 = CelA Lysate from G2 Well of 1 ml Culture
Grown in 96 Well Plate, 10 ul on gel
3 = CelA Lysate from G3 Well of 1 ml Culture
Grown in 96 Well Plate, 10 ul on gel 4 = CelA Lysate from G4 Well of 1 ml Culture
Grown in 96 Well Plate, 10 ul on gel
5 = CelA Lysate from G5 Well of 1 ml Culture
Grown in 96 Well Plate, 10 ul on gel 6 = CelA Lysate from G6 Well of 1 ml Culture
Grown in 96 Well Plate, 10 ul on gel
7 = CelA Lysate from G7 Well of 1 ml Culture
Grown in 96 Well Plate, 10 ul on gel
8 = CelA Lysate from G8 Well of 1 ml Culture Grown in 96 Well Plate, 10 ul on gel
9 = CelA Lysate from G9 Well of 1 ml Culture
Grown in 96 Well Plate, 10 ul on gel
10 = Mark 12 Ladder
1 2 3 4 5 6 7 8 9 10
116.3 kD
66.3 kD
55.4 kD
36.5 kD
31 kD
14.4 kD
21.5 kD
97.4 kD
CelA

Fig 3.6: E-Gel of Gel Purified MegaPrimers for CelA (9/02/08)Low, Medium & High Mutation Rates
Lanes:
1 = 1 Kb Plus DNA Ladder, 2.0 µl on gel
3 = 1.1 Kb standard - 50 ng on gel
5 = Low Mutation Rate Gel Purified PCR product, 0.5 µl on gel
7 = Medium Mutation Rate Gel Purified PCR product, 0.5 µl on gel
9 = High Mutation Rate Gel Purified PCR product, 0.5 µl on gel
5000 bp
2000 bp1650 bp1000 bp
0
0.1
0.2
0.3
0.4
0.5 Wild Type CelA - mM Reducing Sugar Formed
Uninduced CelA
0
0.1
0.2
0.3
0.4
0.5Low Mutation Rate - mM Reducing Sugar Formed
Row A to H Column 8
Row A to H Column 7
Row A to H Column 9
Row A to HColumn 10
Row A to HColumn 11
Row A to HColumn 12
Row A to H Column 2
Row A to H Column 1
Row A to H Column 3
Row A to H Column 4
Row A to H Column 5
Row A to H Column 6
mM
Red
ucin
g Su
gar F
orm
ed
Fig 3.7a: CelA Random Mutagenesis - Low Mutation Rate Activities(Nelson-Somogyi Assay)

0
0.05
0.1
0.15
0.2
0.25
0.3
Wild Type CelA - mM Reducing SugarFormed
Uninduced CelA
Row A to H Column 2
Row A to H Column 1
Row A to H Column 3
Row A to H Column 4
Row A to H Column 5
Row A to H Column 6
0
0.05
0.1
0.15
0.2
0.25
0.3
Row A to H Column 8
Row A to H Column 7
Row A to H Column 9
Row A to HColumn 10
Row A to HColumn 11
Row A to HColumn 12
mM
Red
ucin
g Su
gar F
orm
ed
Fig 3.7b: CelA Random Mutagenesis - Med Mutation Rate Activities(Nelson-Somogyi Assay)

0
0.1
0.2
0.3
0.4
0.5
Wild Type CelA - mM Reducing Sugar Formed
Uninduced CelA
Row A to H Column 2
Row A to H Column 1
Row A to H Column 3
Row A to H Column 4
Row A to H Column 5
Row A to H Column 6
0
0.1
0.2
0.3
0.4
0.5
Row A to H Column 8
Row A to H Column 7
Row A to H Column 9
Row A to HColumn 10
Row A to HColumn 11
Row A to HColumn 12
Low Mutation Rate - mM Reducing SugarFormed
mM
Red
ucin
g Su
gar F
orm
ed
Fig 3.7c: CelA Random Mutagenesis - High Mutation Rate Activities(Nelson-Somogyi Assay)
Culture Wells
Wild Type CelA
Uninduced
Nelson-Somogyi vs DNS Assay
0
0.1
0.2
0.3
0.4
0.5
High Mutation - mM Reducing Sugar FormedDNS - High Mutation - mM Reducing Sugar
High
Mut
atio
n - m
M R
educ
ing
Suga
r For
med
Culture Well
Rows A through H, Columns 1 through 6A1 A2 A3 A4 A5 A6
Fig 3.8a: Nelson Somogyi vs DNS Assay for mutants
Nelson-Somogyi vs DNS Assay
0
0.1
0.2
0.3
0.4
0.5
High Mutation - mM Reducing Sugar FormedDNS - High Mutation - mM Reducing Sugar
High
Mut
atio
n - m
M R
educ
ing
Suga
r For
med
Culture Well
A7 A8 A9 A10 A11 A12
Rows A through H, Columns 7 through 12
Fig 3.8b: Nelson Somogyi vs DNS Assay for mutants